DOI:
10.1039/D2RA03233C
(Paper)
RSC Adv., 2022,
12, 21468-21481
Novel extraction route of lithium from α-spodumene by dry chlorination†
Received
23rd May 2022
, Accepted 19th July 2022
First published on 2nd August 2022
Abstract
Processing spodumene for lithium is challenging as it requires a high temperature transformation of the natural α-monoclinic form to β-tetragonal form, usually followed by acid baking and digestion. This three-step extraction process requires significant heat energy, acid, process complexity and residence time, leading to both operating and capital costs. An approach which helps to eliminate this challenge will therefore be a milestone in processing spodumene. This study, thus, investigates a direct chlorination of α-spodumene using calcium chloride followed by water leaching of the residue to recover lithium, which reduces the energy requirement and number of unit operations. HSC Chemistry software was used to simulate the process using both phases (α and β) of the mineral up to 1100 °C prior to experimental investigation. The α-form was the only polymorph identified in residues after leaching, suggesting that the extraction is directly from the α-phase. However, an initial formation of a metastable β-form followed by a fast synthesis of lithium chloride from it is also suspected. Under optimal conditions of calcium chloride/spodumene molar ratio of 2.0, and 1000 °C treatment for 60 minutes, almost 90 percent lithium chloride was extracted and 85 percent was recovered to the leach solution with the remainder exiting with the off-gas. An apparent activation energy of about 122 ± 6 kJ mol−1 was obtained at temperatures ranging from 800 to 950 °C during the process.
1. Introduction
Chlorination is gaining popularity in mineral processing due to the advantages it presents for processing ores, concentrates and end-of-life resources. The merits of this technique for metal extraction stem from the high reactivity and selectivity of chlorine and chlorinating agents to many metals at minimal temperatures. The resulting metal chlorides/oxychlorides from the process have considerable difference in boiling point which makes management of impurities and product choices easier. Chlorination agents are also readily available at reasonable prices. The waste generated can easily be treated and disposed off with little or no environmental impact compared to other approaches.1–3 For instance, chlorinated waste unlike other metallurgical wastes, may be easily neutralized with alkaline reagents. These factors make chlorination attractive for treating lean minerals and secondary materials as well as providing new pathways for some refractory ores that do not respond well to conventional approaches. Metal chlorides, Cl2 and HCl have been used to treat ore types (silicates, oxides and sulphides) for subsequent processing according to the reactions below:| |
 | (1) |
| |
 | (2) |
| |
 | (3) |
| |
 | (4) |
| |
 | (5) |
| |
 | (6) |
| |
 | (7) |
where M′ is a chlorine bearing metal used as chlorinating agent and M′′ is a monovalent metal of interest present in the ore.
Chlorination sometimes requires a reducing environment to enhance the process. Due to this, carbochlorination of metal oxides and silicates have been investigated by some researchers,4,5 where the carbon or carbonaceous material acts as reducing agent to enable or enhance reactions.
With the increasing demand for lithium, primarily due to the evolution of electric and hybrid vehicles coupled with its undersupply from Salar and brine, attention has been drawn to extraction from pegmatite ores, secondary resources and to a lesser extent, water produced from shale gas6,7 in order to meet the increasing demand. Investigations for processing petalite,8 zinnwaldite,9–13 lepidolite,14–18 spodumene19–25 and secondary sources26–29 are well documented. Of all lithium bearing minerals, spodumene (LiAlSi2O6) stands out as the one with high economic value resulting from its relatively high lithium content. The mineral occurs naturally as the α-monoclinic form which is compact, making it refractory to chemical attack. Consequently, the conventional approach to processing the mineral requires phase transformation from the α to the β-form which is crucial for opening up the mineral's crystalline structure enabling subsequent lithium extraction. The transformation is a thermal process requiring temperatures above 1000 °C. Previous investigations30,31 have revealed two consecutive routes for the transition wherein the first involves the decay of the natural α-monoclinic phase to both γ and β-phases. The second is the decay of the metastable γ-phase formed from the previous decay to the final β-phase. Fosu et al.32 demonstrated the high temperature requirement for the two decay processes based on the apparent activation energies for the transformations. The acidic process which is currently the industrial process for extracting the metal and its contemporary studies require this inevitable phase transformation step which is energy intensive, therefore increasing processing cost and time. The obsolete alkaline process, which did not necessitate the phase transformation, had inherent challenges including high energy requirement for the decomposition of limestone before calcination with α-spodumene. It also results in the formation of dicalcium silicates which releases large amount of heat and makes temperature control in the calcination stage difficult.33 Thus, the phase transformation step stands out as an expedient step in processing the mineral, the cost implication and the time requirements notwithstanding. In an attempt to eliminate this step, some hydrometallurgical treatments such as employed by SiLeach® and LieNA® have been considered from which promising results have been achieved. Song et al.,25 also by hydrometallurgical treatment using NaOH and CaO in an autoclave, reported 93% leaching efficiency. However, their approach requires high concentration of NaOH and special equipment (autoclave) in addition to long processing time. Owing to the inherent advantages of chlorination, it promises an efficient approach for processing the mineral. After a thorough review of literature by Fosu et al.34 on processes used so far to recover the metal from spodumene, their thermodynamic modelling highlighted chlorination as one of the promising processes which has had the least of attention. In 1959, Peterson et al.35 patented the possible extraction of lithium from α-spodumene using an alkali metal halide or their mixture (specifically, KCl and/or NaCl) in the presence of a refractory material. The amount of refractory material required by this approach was indicated to vary between 60 to 80 wt% of the quantity of spodumene treated. This high quantity of refractory material used results in a reduced amount of spodumene used as feed reducing the efficiency of the process. During a study on simulated pyrometallurgical slag from end-of-life lithium ion battery by chlorination, Dang et al.36,37 reported interesting results. Studies by Barbosa et al.38,39 revealed the metal's extraction from spodumene using CaCl2 and Cl2. Though they reported a successful chlorination for high conversion, their study was based on the calcined mineral (β-spodumene) which does not eradicate the phase transformation problem. This study investigates the direct baking of α-spodumene using CaCl2, followed by aqueous leaching of the residue to recover lithium. The success of this study will help to reduce the processing cost and time, since the decrepitation step will be avoided.
Most thermodynamic studies in literature on the roasting of spodumene with reagents are performed with the β-phase. In this study, α to β-phase transformation of the mineral, followed by a comparative study of thermodynamic behaviour of both phases with CaCl2 using HSC Software is considered. The suggested phase transformation and chemical equations of the mineral in both phases with CaCl2 are given as:
| | |
α-LiAlSi2O6 → β-LiAlSi2O6
| (8) |
| | |
2α-LiAlSi2O6 + CaCl2 → 2LiCl + 2SiO2 + CaAl2Si2O8
| (9) |
| | |
2β-LiAlSi2O6 + CaCl2 → 2LiCl + 2SiO2 + CaAl2Si2O8
| (10) |
In Fig. 1, the Gibbs free energy change of the transformation and the reaction of both polymorphs with CaCl2 (eqn (8)–(10)) as a function of temperature up to 1100 °C are plotted. It can be observed that, the phase transformation is feasible after 750 °C but after 927 °C (indicated by short dashes), the software relies on extrapolated data for the α-phase. This may be due to unavailability of data for the α-phase above this temperature. From our previous investigation,32 it was found that, treating the α-phase at 925 °C did not complete the transformation. Rather, a maximum of about 65% α-phase conversion was achieved even after 480 minutes treatment (the longest residence time of the study). Drawing insight from our studies on the kinetics of phase transformation, it is likely that, the extrapolation of data of the α-phase by HSC Software is due to the unavailability of data rather than completion of the transformation. Roasting the mineral in the β-phase with CaCl2 is spontaneous throughout the temperatures studied whilst the direct roasting of α-phase is only feasible beyond 500 °C. This is expected since the refractory α-phase needs to open up prior to a feasible reaction with CaCl2. If the feed spodumene has already been converted to the β-phase it is then feasible for a reaction with CaCl2 throughout the wider range of operating temperatures. Combining the above scenarios, one can infer that, production of LiCl below 750 °C occurs strictly and directly from the α-phase (eqn (9)). Above this temperature, however, the phase transformation begins (according to HSC Software) and a mixture of both polymorphs may exist. LiCl can thus be obtained from both phases (eqn (9) and (10)) which should lead to higher lithium recovery. A transition point is observed between 600 and 800 °C for both α and β-phase chlorination (Fig. 1). We name this temperature range as the “reaction initiation zone” where melting of CaCl2 and reaction with the mineral begin.
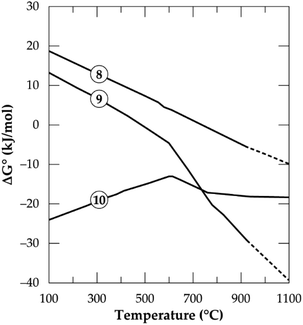 |
| | Fig. 1 Standard Gibbs energy changes as a function of temperature for α to β transformation (eqn 8), reaction of spodumene with CaCl2 in α-phase (eqn (9)) and β-phase (eqn (10)) (data from HSC Chemistry 5.1 software). | |
A differential thermal analysis by both Barbosa et al.39 and Dang et al.36 revealed interesting results in this temperature range during their study on spodumene and simulated slag respectively with CaCl2. They both observed two endothermic peaks within this range where the low and high temperature peaks were linked to the commencement of reaction and the melting of CaCl2 respectively. Chemical thermodynamic predictions have a downside of inability to give insight into the kinetics of processes. One may however, suspect that since the change in the Gibbs free energy remains almost constant for the β-phase after 800 °C (Fig. 1), it may be more kinetically dependant than thermodynamic. For the α-phase, chlorination may be both thermodynamic and kinetic controlled since the Gibb's free energy change decreases significantly with increasing temperature which confirms a strong dependence of α-phase chlorination on the thermodynamics.
The equilibrium composition module of the software was further used to simulate the process. Fig. 2 is the simulation showing the equilibrium composition at varying temperatures. Anorthite (CaAl2Si2O8) and wollastonite (CaSiO3) are new phases synthesized at the end of the process with the former being predominant (more than half of the composition of the later). All the new phases, including lithium chloride can be said to be obtained from the decomposition of spodumene since their synthesis have a corresponding decrease in the quantity of spodumene.
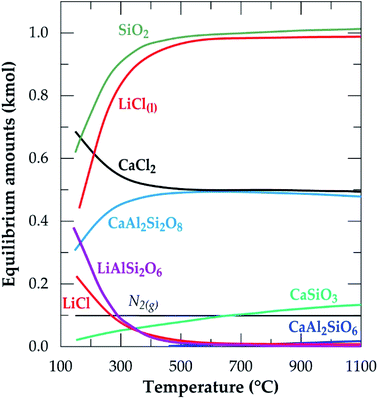 |
| | Fig. 2 Equilibrium amounts as a function of temperature for chlorination of α-spodumene using CaCl2 (data from HSC Chemistry 5.1 software). | |
2. Materials and methods
2.1. Spodumene concentrate preparation
The sample used in this study is a spodumene concentrate received from the Pilbara region of Western Australia after flotation from a lithium–cesium–tantalum pegmatite ore. The method of production and characterization (X-ray diffraction (XRD), Scanning Electron Microscope Energy Dispersive Spectroscopy (SEM-EDS), X-ray fluorescence (XRF) microscopy and Inductively Coupled plasma-Optical Emission Spectrometry (ICP-OES)) is detailed in our previous work.32 Analytical grade CaCl2 supplied by Sigma-Aldrich, France was used as chlorination agent.
2.2. Chlorination and leaching experiments
Direct chlorination of α-spodumene was performed using a mixture of 5 g of the dry uncalcined spodumene concentrate and anhydrous CaCl2. Alumina crucible was used as the reaction vessel while heating in a Carbolite Gero electric furnace which was conditioned as in earlier work.32 Chlorinated samples were cooled to room temperature in a desiccator and weighed before leaching tests.
Leaching was carried out with deionized water at ambient temperature, solid/liquid ratio of 50 g L−1 and agitated using a Gerhardt laboratory thermoshake. The solid and liquid phases were separated with a 3–16 L Sigma Laboratory Centrifuge operating at 3000 rpm for 2 minutes. Leached residues were washed thoroughly with distilled water and dried at room temperature for further analysis. The leached liquor obtained was analyzed for lithium and other metals using the Microwave Plasma Atomic Emission Spectrophotometer (4210 MP-AES) manufactured by Agilent Technologies. Percent lithium recovery (%Li) was calculated as:
| |
 | (11) |
Extraction efficiencies achieved was obtained by residual lithium determination, followed by mass balance calculation. Probing into the reaction mechanism, the leached residues were analyzed for their physicochemical alterations using SEM-EDS. Methods of sample preparation for XRD and SEM-EDS were previously detailed by Fosu et al.32
3. Results and discussion
3.1 Characterization of raw materials
Mineralogical identification and semi-quantitative analyses were carried out using the EVA© software coupled with the PDF2 database. The XRD diagram pattern of the raw spodumene concentrate (Fig. 3) shows the feed is predominantly α-spodumene (about 60%) with quartz, albite, mica and amphiboles as associated gangue minerals. Chemical composition is also provided in Table 1 with lithium accounting for 2.14 wt% whilst particle size analysis shows the d50 to be 57 μm (Fig. 4). Detailed characterization of the concentrate as well as its thermal transformations can be found in Fosu et al.32
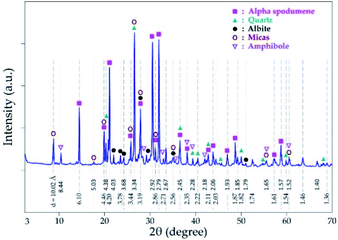 |
| | Fig. 3 XRD pattern of spodumene concentrate. | |
Table 1 Chemical composition of concentrate determined by XRF and ICP-OES
| Major |
Al2O3 |
CaO |
Cr2O3 |
Fe2O3 |
K2O |
MgO |
MnO |
Na2O |
P2O5 |
SO3 |
SiO2 |
TiO2 |
Li |
Cs |
Rb |
Ta |
Nb |
Sn |
| (wt%) |
20.79 |
1.72 |
0.03 |
4.29 |
1.26 |
1.30 |
0.32 |
1.14 |
0.33 |
0.15 |
61.31 |
0.10 |
2.14 |
|
|
|
|
|
| (ppm) |
|
|
|
|
|
|
|
|
|
|
|
|
|
116 |
1033 |
202 |
180 |
140 |
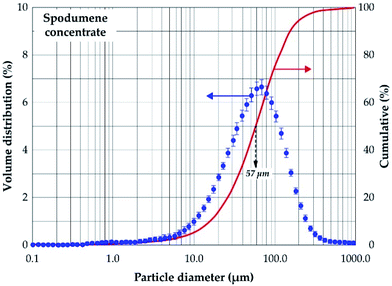 |
| | Fig. 4 Volume distribution and cumulative passing of spodumene concentrate. | |
3.2 Chlorination of α-spodumene concentrate
3.2.1 Effect of CaCl2/spodumene molar ratio. The effect of CaCl2/spodumene molar ratio (MR) on lithium recovery was studied in the range of 1.0 to 2.25, at 900 °C for 60 minutes residence time; the results are presented in Fig. 5. Lithium recovery increases with increasing molar ratio until it plateaus after MR = 2.0. Previous studies21,36,40 have reported a decreased recovery for gaseous chlorination agents after the optimum flow rate is achieved with several explanations proposed by Bidaye et al.41 for the observation. A MR of 2.0 was selected as the optimum for further investigation since there was no significant increase in the amount of lithium recovered after that.
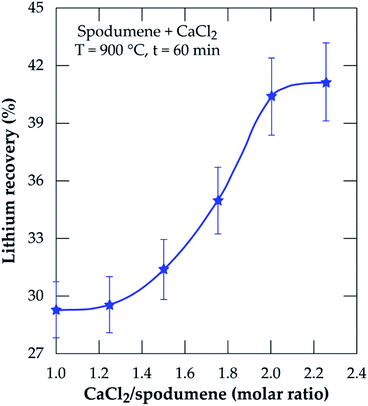 |
| | Fig. 5 Percent lithium recovery obtained as a function of CaCl2/spodumene molar ratio for samples treated at 900 °C for 60 minutes. | |
3.2.2 Effect of temperature. Chlorination was performed at 60 minutes residence time and MR of 2.0 in order to optimize the temperature. During the simulation using the equilibrium composition module of HSC Software (Fig. 2), it was found that lithium chloride in the liquid phase attains a maximum concentration after 600 °C. Based on this, temperatures ranging from 700 to 1050 °C at 50 °C intervals were selected for the chlorination and results are presented in Fig. 6a. Recovery increases with increasing temperature until it peaks at 1000 °C. From 700 to 800 °C which falls within the initiation zone of the process, the lowest quantity of LiCl (about 17%) is produced. This is expected since CaCl2 (with melting point around 770 °C) starts melting to initiate reaction with spodumene to yield products. The range of this temperature however, may not be sufficient enough to provide appropriate conditions for appreciable recovery. After 800 °C, a sharp increase in recovery is observed until 1000 °C. In our previous studies,32 it was established that, spodumene when heated gains minor cracks which become prominent with increasing temperature until it disintegrates. 1000 °C was indicated as the temperature where sufficient disintegration is attainable but above it, melting and agglomeration occurs. Thus, increasing temperature has a remarkable effect on the opening of the mineral for more lithium atoms to interact with molten CaCl2. This leads to the production of more LiCl until it peaks at 1000 °C. After 1000 °C (1050 °C), a decline in recovery is observed. This may be attributed to two factors, either melting and agglomeration of spodumene with impurities or the evaporation of LiCl from the reaction medium as it is formed. It is possible also that, both mechanisms all contribute to the decline. A mass balance was performed on the leached residues in order to compare lithium recovery achieved and extraction efficiency and also to investigate the factor(s) responsible for the decline in recovery. These results are presented in Table 2. Residual lithium in residues is observed to decrease with increasing temperature with a corresponding increase in both recovery and extraction efficiency up to 1000 °C. Beyond 1000 °C, there is an increase in residual lithium. This may be attributed to melting and agglomeration which locks up some lithium atoms within the agglomerated matter, hence, preventing their access by CaCl2 and subsequent extraction.
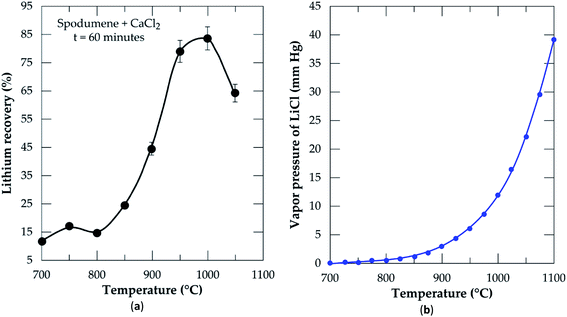 |
| | Fig. 6 (a) Percent lithium recovery versus temperature at CaCl2/spodumene molar ratio of 2.0 and 60 min residence time; (b) vapor pressure of lithium chloride versus temperature. | |
Table 2 Mass balance comparison of percent lithium recovery and extraction at different temperature
| Temperature, °C |
Residual lithium in residues wt% |
Recovery% |
Extraction% |
| 900 |
1.15 |
45.3 |
46.3 |
| 950 |
0.50 |
79.1 |
76.6 |
| 1000 |
0.23 |
83.5 |
89.3 |
| 1050 |
0.32 |
64.3 |
85.1 |
Recovery and extraction efficiency are comparable up to 1000 °C after which about 20% higher extraction was observed than recovery (Table 2). The difference may be linked to the evaporation of LiCl as well as melting and agglomeration of materials suspected earlier. Previous studies40 have confirmed formation and/or evaporation of lithium chloride at 1000 °C and above. They suggested the effect of vapor pressure evolution with temperature as a possible cause of the observation. A plot of changing vapor pressure of LiCl with temperature is shown in Fig. 6b. It increases sharply above 950 °C, where lithium chloride can volatilize and be lost to the gas phase. We suspect also, the possible formation of CaCl2/LiCl, KCl/LiCl or CaCl2/LiCl/KCl eutectic mixtures, which can result in the evaporation of LiCl at relatively low temperature. It can therefore be inferred that, both phenomena (melting and agglomeration and LiCl evaporation) play a role in the decline of lithium recovery.
The Arrhenius diagram for the chlorination process from 800 to 950 °C resulted in an apparent activation energy of 122 ± 6 kJ mol−1 (Fig. 7).
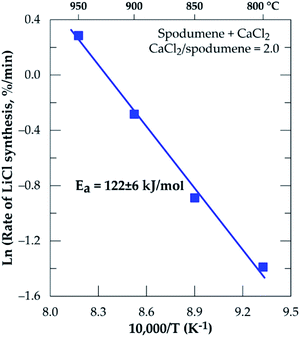 |
| | Fig. 7 Arrhenius diagram for lithium recovery during chlorination of spodumene concentrate between 800 and 950 °C, residence time = 60 minutes, CaCl2/spodumene = 2.0. | |
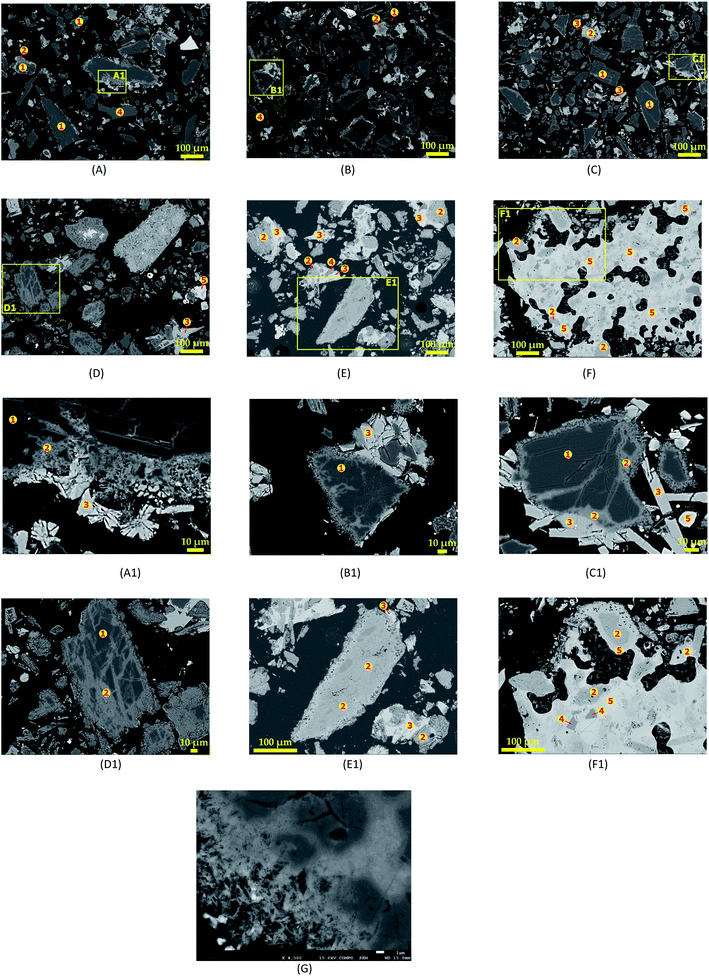 |
| | Fig. 8 SEM photomicrographs showing morphological changes of spodumene during 60 min and MR = 1.75 treatment at (A) 750 °C, (B) 800 °C, (C) 850 °C, (D) 950 °C, (E) 1000 °C, (F) 1050 °C and their corresponding spot magnification (A1), (B1), (C1), (D1), (E1) and (F1); (G) fibrous-like structures appearing at the peripheries of spodumene grains during treatment. | |
Increasing temperature is observed to create more channels in spodumene grains, leading to increased reaction area and recovery. Thus, the recovery or extraction appears to depend on the degree of access of the molten CaCl2 to the spodumene grains. It can then be supposed that, the process is diffusion controlled rather than chemical reaction controlled. The different colorations due to the chlorination of spodumene were assigned “1”, “2” and “3” and identified as spodumene, calcium aluminosilicate (CAS) and calcium silicate, respectively. A representative composition of the different portions are shown in Table 3. It is clear that, the internal portions of spodumene grain (“1”), which were unaffected by CaCl2, still maintained their identity. It is an aluminosilicate with Si/Al = 2.0 which confirms its identity. The total wt% of this portion is approximately 94 and the difference may be attributed to lithium which could not be identified by EDS. Iron, the usual impurity associated with it, is also identified at relatively low concentrations. The next portion from the unaffected spodumene (“2”) is dark grey area and identified as CAS. There is varying concentration of the constituent elements of this portion which suggests that, different minerals of CAS may be present. The portion “3”, which is light grey coloured (the external part of the spodumene), was revealed as calcium silicate with approximate Ca/Si and O/Si of 1.0 and 3.0, respectively. Quartz, which forms a significant portion of the concentrate, is identified at several portions of the SEM photo as “4” with O/Si = 2.0. EDS again identified a type of CAS containing a significant amount of chlorine. Magnesium and iron are found in close association with these portions which makes it light coloured or whitish compared to all the other portions identified. We indicate this portion as “5” and call it “calcium aluminosilicate chloride” (CASCl) for the sake of this study. In Fig. 8F and F1 where melting and agglomeration was observed, quartz, CAS and CASCl were found fused in the agglomerated mater which confirms melting that occurred. EDS could however, not identify the specific type of mineral giving rise to these observations. The standard deviations of atomic percent of the different portions identified and the raw data including the spectra generated by SEM-EDS is given in Tables S1–S10† and Fig. S1–S5 of ESI.†
Table 3 Elemental composition (EDS data) of sections of spodumene grain during chlorination
| Elements |
Spot “1” |
Spot “2” |
Spot “3” |
Spot “4” |
Spot “5” |
| awt% |
aat% |
wt% |
at% |
wt% |
at% |
wt% |
at% |
awt% |
at% |
| wt% and at% represent mass and atomic percentage, respectively. |
| Al |
14.38 |
11.53 |
16.68 |
13.39 |
|
|
|
|
6.33 |
5.60 |
| Si |
30.50 |
23.48 |
22.02 |
16.97 |
24.29 |
19.83 |
48.27 |
33.33 |
13.52 |
11.50 |
| Cl |
|
|
0.39 |
0.24 |
|
|
|
|
14.57 |
9.82 |
| Ca |
|
|
13.22 |
7.14 |
35.41 |
20.25 |
|
|
29.65 |
17.68 |
| Fe |
0.77 |
0.30 |
0.74 |
0.29 |
|
|
|
|
1.76 |
0.75 |
| Na |
|
|
0.26 |
0.25 |
|
|
|
|
|
|
| Mg |
|
|
|
|
|
|
|
|
2.25 |
2.21 |
| O |
47.87 |
64.70 |
45.61 |
61.72 |
41.81 |
59.92 |
54.99 |
66.67 |
35.10 |
52.43 |
| Total |
93.52 |
|
98.92 |
|
101.5 |
|
103.3 |
|
103.2 |
|
A closer look at the edges of spodumene grains in Fig. 8G reveals the formation of fibrous-like structures, which gradually eats into the internal parts suggesting again, an initial attack of CaCl2 at the peripheries of the mineral before the interior portions.
3.2.2.2 XRD investigation. In addition to the SEM approach, different leached residues obtained after chlorination at 60 minutes residence time and MR of 2.0 were studied by XRD (Fig. 9). The α-spodumene is observed up to 950 °C but at 1000 °C and beyond, it disappeared. From the first treatment at 800 °C the chemical composition of the plagioclases shows a chemical evolution towards the calcium pole. Plagioclases corresponds to the CAS identified by SEM-EDS. From 900 °C only anorthite is identified (Fig. 9), moreover its content increases with temperature, reaching about 70% in the end at 1050 °C (Fig. 10). Diopside appears at 800 °C and persists throughout the treatments.
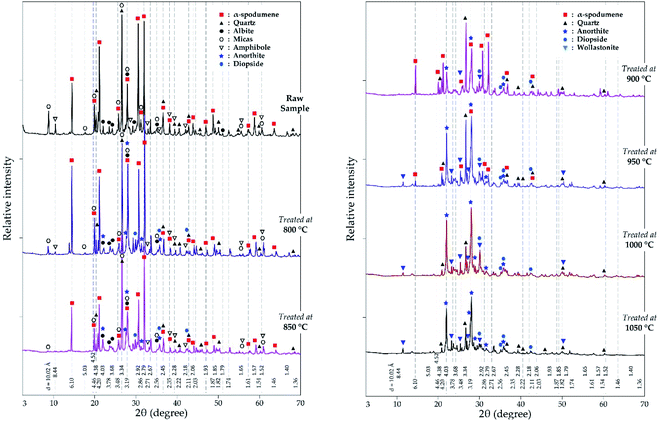 |
| | Fig. 9 XRD pattern of evolving phases as a function of temperature at 60 minutes treatment and MR = 2.0. | |
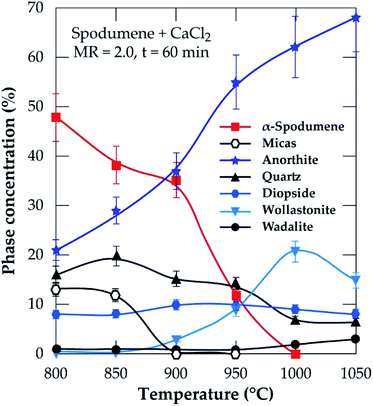 |
| | Fig. 10 XRD semi-quantitative analyses of temperature at 60 minutes residence and MR of CaCl2/spodumene of 2.0. | |
Wollastonite appears from 900 °C and like diopside, can be identified until the end of the treatment. Wollastonite is linked to the calcium silicate identified by EDS. Wadalite (Ca6(Al,Fe,Mg)5Si2O16Cl3) was also identified by XRD but due to its comparatively small concentration and for clarity of presentation, it was not considered in XRD diagram. In Fig. 10, its concentration (< 4%) is observed. It corresponds to CASCl which was identified by EDS.
A thermal influence can therefore be observed on the mineralogical assemblages. Spodumene persists up to 1000 °C and its concentration shows a continuous decrease with increasing temperature. As the temperature rises, the spodumene breaks down to interact with the molten calcium chloride. The decrease in spodumene is also related to anorthite formation (Fig. 10) and obviously to the lithium recovery (Fig. 6a).
It is worth noting that, only the α-form of spodumene was identified in the residue. Two pathways may therefore be possible for the extraction; (1) directly from the α-phase or (2) an initial α to β-phase conversion followed by a quick in situ lithium chloride formation due to the presence of calcium chloride (2α-spodumene → 2β-LiAlSi2O6 + CaCl2 → 2LiCl + 2SiO2 + CaAl2Si2O8).
3.3 Effect of residence time
To investigate the kinetics, chlorination was performed at MR of 2.0, 1000 °C temperature and residence time from 30 to 120 minutes. The result is presented in Fig. 11. Recovery increases sharply from 30 minutes and peaks at 60 minutes, achieving about 85% recovery. A decline is observed afterwards such that, at 120 minutes, about 5% lithium chloride was lost. The decline is primarily attributed to the evaporation of lithium chloride. Both temperature and time are thus, indicated as the most sensitive parameters contributing to lithium extraction by this process as suggested earlier.
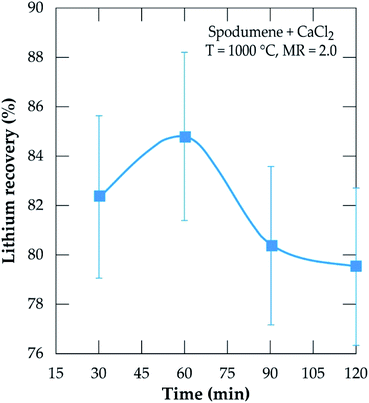 |
| | Fig. 11 Evolution of the lithium recovery as a function of residence time for samples treated at 1000 °C and MR = 2.0. | |
3.3.1 SEM-EDS investigation. Fig. 12 shows the morphology of leached residues arising from section 3.3 as revealed by SEM-EDS. Fig. 12A (treatment for 30 minutes) reveals clear portions of dark grey colour corresponding to spodumene. A zoom in at A1 (Fig. 12A1) confirms spodumene (“1”) by EDS at the internal portions of the grain. Two major phases (dark and light grey) are observed and identified as CAS (“2”) and calcium silicate or wollastonite (“3”) after 30 minutes treatments (Fig. 12B–D). Wollastonite is often found attached to the CAS phase at the exterior parts. Observation also shows that, only few CAS grains had wollastonite phase associated with them which gives an indication that, it may be present in small quantity. It may also imply that, both phases evolved concurrently from a mineral in the concentrate and a particular condition is responsible for their segregation into the different phases. There was no observed melting and agglomeration at the various residence time during the treatment at 1000 °C suggesting that, temperature is the main factor responsible for this effect rather than time. A detailed look at a portion in Fig. 12C is shown in Fig. 12C1. It reveals a uniform fibrous-like structure. This may be attributed to the percolation of molten calcium chloride through grains, enabling reaction and subsequent lithium extraction which renders the grains fibrous and porous. EDS analysis reveals that, the entire grain is composed of CAS (“2”). CAS (anorthite) and calcium silicate (wollastonite) are the predominant phases observed from 60 minutes onward according to EDS investigation. It is therefore a confirmation that, they are the major phases at the end of the process as revealed by XRD.
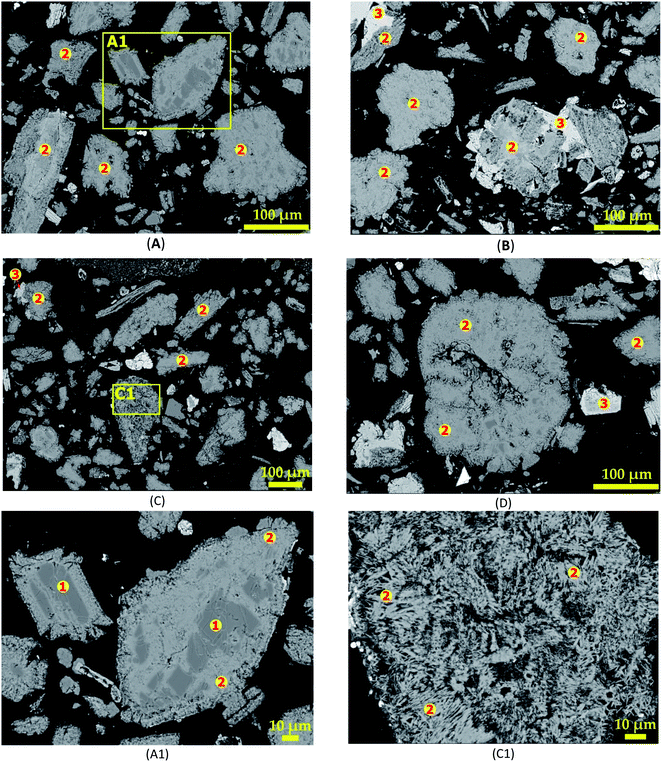 |
| | Fig. 12 SEM photomicrographs showing morphological changes of spodumene during 1000 °C treatment for (A) 30 min, (B) 60 min, (C) 90 min and (D) 120 min; (E) and (F) magnification at A1 and C1 respectively. | |
3.3.2 XRD analysis. XRD was used to access the mineralogical evolution in leached residues as a function of residence time. XRD diagrams and the semi-quantitative estimation are display in Fig. 13 and 14 respectively. Spodumene is observed only in residue treated for 30 minutes which confirms SEM-EDS results in Fig. 12A1. Anorthite is the predominant new phase throughout with minor diopside and wollastonite. In Fig. 14, the anorthite concentration is significantly higher than wollastonite which confirms earlier observation. It increases slightly at the beginning to reach a plateau at 90 minutes. There is no major and significant change in the concentration of the other minerals (quartz, wollastonite, diopside and wadalite).
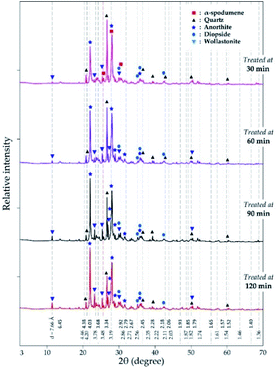 |
| | Fig. 13 XRD pattern of evolving phases as a function of residence time at 1000 °C and CaCl2/spodumene of 2.0. | |
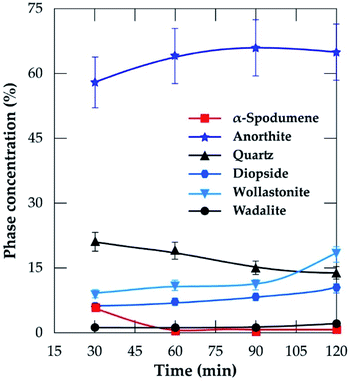 |
| | Fig. 14 Concentration of evolving phases as a function of residence time at 1000 °C and CaCl2/spodumene of 2.0. | |
Table 4 is a mass balance to compare the percent lithium recovered in solution and extraction efficiency at varying residence time. Almost all extracted lithium from the concentrate was recovered in solution at 30 and 60 minutes residence time. Afterwards, the extraction exceeded recovery. Since no melting and agglomeration was observed, the difference may be attributed to the evaporation of lithium chloride after its formation and allowing it to stay in the furnace. A maximum of 89% extraction was achieved during 120 minutes of treatment. Spodumene was not identified in residues obtained beyond the optimal values of the two critical conditions identified. Tables 2 and 4, nonetheless reveal the presence of residual lithium beyond these conditions. This suggests a possibility that, the lithium might be in another phase rather than spodumene which has not been confirmed by this study.
Table 4 Mass balance comparison of percent lithium recoveries and extraction at 1000 °C and different residence time
| Time (min) |
Residual lithium wt% |
Recovery% |
Extraction% |
| 30 |
0.37 |
82.3 |
82.7 |
| 60 |
0.28 |
84.8 |
86.9 |
| 90 |
0.25 |
80.4 |
88.3 |
| 120 |
0.24 |
79.5 |
88.8 |
3.4 Mechanisms for phase evolution
Major gangue minerals in the concentrate are mica, alkali feldspar, amphibole, albite and quartz. These minerals interact with each other or respond differently with temperature and the chlorinating agent (calcium chloride). Decrepitation of mica species have been studied extensively by Hutchison.42 He discovered the decomposition to begin around 300 °C (305 to 340 °C). There is a foreknowledge that under pressure, the decomposition of muscovite43,44 and biotite,45,46 (the two mica species identified in the spodumene concentrate) form K-feldspar as shown from eqn (12)–(15). The formation is said to be an ionic exchange process44 which is similar to observation in our previous study.32| | |
KAl3Si3O10(OH)2 + SiO2 → [KAlSi3O8]melt + Al2SiO5 + H2O(g).
| (12) |
| | |
KFe3AlSi3O10(OH)2 + 3SiO2 → [KAlSi3O8]melt + 3FeSiO3 + H2O(g)
| (13) |
| | |
KAl3Si3O10(OH)2 → [KAlSi3O8]melt + Al2O3 + H2O(g)
| (14) |
| | |
KFe3AlSi3O10(OH)2 → [KAlSi3O8]melt + 3FeO + H2O(g)
| (15) |
Alkali feldspars including K-feldspar synthesized from mica transform to anorthite by replacing alkali metals with calcium atoms in their monoclinic crystal structure of the feldspar.47 Wollastonite, quartz and alkali metal chlorides alongside the synthesized anorthite are products expected at the end of the process (eqn (16) and 17).
| | |
CaCl2 + 2NaAlSi3O8 → CaAl2Si2O8 + 4SiO2 + 2NaCl
| (16) |
| | |
CaCl2 + 2KAlSi3O8 (M) → CaAl2Si2O8 + 4SiO2 + 2KCl
| (17) |
Amphiboles transform to their respective pyroxenes and quartz through topotactical dehydration decomposition at temperatures above 600 °C.48–50 The transformation is pseudo-polymorphic because it occurs at a fixed temperature for a given pressure. There is also a close resemblance of the resultant products to the reactant which is typical of polymorphic transitions.50 Using tremolite (the amphibole considered in this study), the decomposition gives rise to diopside and enstatite) (eqn (18)) at about 740 °C according to Xu et al.49
| | |
Ca2Mg5Si8O22(OH)2 → 2CaMgSi2O6 + 3MgSiO3 + SiO2 + H2O(g)
| (18) |
| | |
CaAl2Si2O8 → CaSiO3 + Al2SiO5
| (19) |
HSC Chemistry software was used to determine the feasibility of phases evolving and predict the influence of temperature on products formation. Gibbs free energy changes for the formation of products in eqn (12)–(19) is plotted as a function of temperature in Fig. 15. All the reactions are feasible either throughout or at a point within the operating temperatures with the exception of the decomposition of anorthite (eqn (19)).
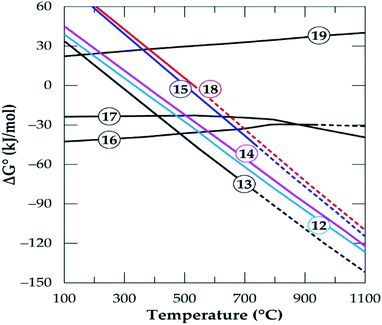 |
| | Fig. 15 The standard Gibbs energy changes for phase transformation of gangue minerals in concentrate in oxygen deficient environment (reactions (12)–(19)) versus temperature (data from the HSC Chemistry 5.1 Software). | |
The micas have similar feasibility which starts after 300 °C and increase with temperature to form K-feldspar which confirms earlier study.42 Alkali feldspars also have similar chemical reactivity to produce the same products (anorthite and quartz) in addition to their respective alkali metal chlorides but their thermodynamic behaviour is somewhat different. Specifically, K-feldspar (eqn (17)) is feasible throughout but the feasibility of albite (eqn (16)) is only up to 927 °C. K-feldspars (synthesized or originally present in the concentrate) end up forming anorthite as the prominent new phase at the end of the process. Furthermore, anorthite is favorably synthesized from the interaction of spodumene and calcium chloride (eqn (9) and (10)). That is, HSC confirms that, anorthite is a major mineral in leached residues. This is because it is a product from a feasible reaction for the decomposition of spodumene (the major component of the concentrate) as well as other minerals which are present in a fairly high amount. The decomposition of anorthite to other components was investigated as modeled by eqn (19) but it was found not to be possible in Fig. 15. It is suspected that, sodium and potassium which may be found in the leached liquor is obtained principally from eqn (16) and (17). The Gibbs free energy change for the decomposition of tremolite (amphibole) in eqn (18) is negative after 527 °C. However, it is an extrapolated data after 527 °C which may be due to either lack of data for tremolite in the software or its breaks down beyond this temperature. Drawing inference from earlier work,50 we attribute this to its pseudo-polymorphic decomposition to diopside and enstatite. Extrapolation of data is also observed for albite and spodumene at 927 °C as well as annite at 727 °C.
The effect of oxygen concentration in the process environment on products formation from individual minerals was investigated using the HSC software. Model equations for mica, alkali feldspars, amphibole and albite in the oxidizing atmosphere are presented in eqn (20)–(25). The Gibbs free energy changes for product formation is presented in Fig. 16. With the exception of annite decomposition (eqn (20)), the feasibility of all the reactions are primarily impossible but by manipulating the oxygen concentration, feasibility can be achieved to some extent in the alkali feldspars.
| | |
2KFe3AlSi3O10(OH)2 + O2(g) → 2[KAlSi3O8]melt + 2Fe3O4 + 2H2O(g)
| (20) |
| | |
2NaAlSi3O8 (A) + 2CaCl2 + 0.5O2(g) → 2NaCl + CaAl2Si2O8 + 3SiO2 + CaSiO3 + Cl2(g)
| (21) |
| | |
2KAlSi3O8 (M) + 2CaCl2 + 0.5O2(g) → 2KCl + CaAl2Si2O8 + 3SiO2 + CaSiO3 + Cl2(g)
| (22) |
| | |
2NaAlSi3O8 (A) + 3CaCl2 + O2(g) → 2NaCl + CaAl2Si2O8 + 2SiO2 + 2CaSiO3 + 2Cl2(g)
| (23) |
| | |
2KAlSi3O8 (M) + 3CaCl2 + O2(g) → 2KCl + CaAl2Si2O8 + 2SiO2 + 2CaSiO3 + 2Cl2(g)
| (24) |
| | |
2αLiAlSi2O6 + 3CaCl2 + O2(g) → 2LiCl + CaAl2Si2O8 + 2CaSiO3 + 2Cl2(g)
| (25) |
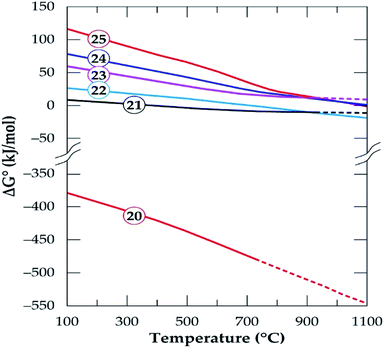 |
| | Fig. 16 The standard Gibbs energy changes for phase transformation of gangue minerals in concentrate in oxidizing environment (reactions (20)–(25)) versus temperature (data from the HSC Chemistry 5.1 Software). | |
Oxidizing reactions for alkali feldspars occurring in half a mole of oxygen (eqn (21) and (22)) are not feasible but by doubling it (eqn (23) and (24)), the Gibbs free energy achieve some level of negativity (though not high). The resulting phases are anorthite and calcium silicate (wollastonite, which is identified by XRD) and the release of chlorine gas. Thus, anorthite formation is highly suspected by the software which confirms XRD results. From this observation, wollastonite can be a possible product in the residue depending on the oxygen concentration during treatment only if HSC Software predictions are valid. Spodumene feasibility is also observed to be affected by oxygen concentration such that, it is non-spontaneous in oxidizing atmosphere (eqn (25) and Fig. 16) but spontaneous in oxygen deficient atmosphere (eqn (9)) depending on the temperature. In general, the process feasibility is high in oxygen deficient environment than oxidizing.
3.5 Correlating XRD results, HSC software predictions and reaction mechanisms
HSC software predicts anorthite as the predominant new phase at the end of the process, arising primarily from spodumene, mica and alkali feldspar decomposition in the presence of calcium chloride. Amphibole and mica persist only up to 850 °C after which they disappear from XRD spectra of leached residue. This implies that, after 850 °C, their transformation to other phases is complete which is in agreement with observation by ref. 50 and 42. As indicated earlier, the decomposition of mica and amphibole basically form K-feldspar melt and pyroxenes respectively. The appearance of diopside after 850 °C may be linked to the decomposition of tremolite, though enstatite (its corresponding pyroxene during decomposition) was not identified, probably it transformed further to another phase. K-feldspar may evolve from mica decomposition and its feasibility is confirmed by HSC software but it was not identified in any of the residues. This suggests that, it appears as a metastable phase and hence, quickly transforms to anorthite in the presence of calcium chloride. According to ref. 51, the decomposition of K-feldspars in the presence of calcium chloride begins around 600 °C. Potassium chloride and anorthite are the resulting products such that at 900 °C, the optimum extraction is achieved. This identified temperature range falls within the operating temperatures of the study. Therefore, the absence of K-feldspar in the residue (XRD spectra) may be attributed to its fast conversion to anorthite in the course of the process. Eqn (19) suggests that, wollastonite may evolve from the decomposition of anorthite or the chlorination of alkali feldspar in an oxidizing atmosphere (eqn (21)–(25)). Since HSC Software predicts eqn (19) to be nonspontaneous, the close association of wollastonite with CAS (as revealed in Fig. 12) may lead to the conclusion that, the decomposition of alkali feldspars is responsible for the synthesis of both phases and a limiting oxidizing atmosphere is a prerequisite for the synthesis.
4. Conclusion
Investigation into the pyrometallurgical synthesis of lithium chloride directly from α-spodumene followed by water leaching was conducted. Though MR has influence on lithium recovery, temperature and time are the major factors which, if are not regulated leads to evaporation of lithium chloride. Lithium recovery to leach solution generally increases with all investigated parameters, which are MR, temperature and time until they peak at 2.0, 1000 °C and 60 minutes respectively. These optimal conditions led to about 90 percent lithium extraction but 85 percent was recovered to solution with the remainder exiting via the gas phase. In a process, this gas phase lithium could be also recovered by leaching the gas treatment dust. Though recovery plateaus after MR of 2.0, evaporation coupled with melting and agglomeration occurs after 1000 °C, which in addition, leads to a decrease in recovery. XRD results confirmed HSC software and SEM-EDS predictions which reveals anorthite as predominant phases (accounting for about 70 percent) alongside quartz, wollastonite and diopside as minor phases. Predictions by HSC software are in good agreement with experimental observation. Spodumene identified in leached residue is in the α-form with no identification of the β-form. This suggests that, the extraction of lithium chloride is directly from the α-phase. A possible transformation of α-spodumene into β-spodumene followed by a fast synthesis of lithium chloride from β-spodumene (2α-spodumene → 2β-LiAlSi2O6 + CaCl2 → 2LiCl + 2SiO2 + CaAl2Si2O8) may also occur. However, we treat this as tentative at this stage. The relatively low apparent activation energy of 122 ± 6 kJ mol−1 obtained could suggest diffusion of calcium chloride as the rate limiting step of the process.
Author contributions
Conceptualization: AC, NK; formal analysis: AYF, AC, NK, DB; funding acquisition: AC; investigation: AYF; project administration: AC; supervision: AC, NK; visualization: AYF, NK; writing-original draft: AYF; writing-review and editing: AYF, NK, BD, JV, AC.
Conflicts of interest
There are no conflicts to declare.
Acknowledgements
This work was supported by the French National Research Agency through the national program “Investissements d'avenir” with the reference ANR-10-LABX-21-RESSOURCES21.
References
- N. Kanari, D. Mishra, J. Mochón, L. F. Verdeja, F. Diot and E. Allain, Some kinetics aspects of chlorine-solids reactions, Rev. Metal., 2010, 46(1), 22–36, DOI:10.3989/revmetalm.0852.
- N. Kanari, D. Mishra, L. Filippov, F. Diot, J. Mochón and E. Allain, Kinetics of hematite chlorination with Cl2 and Cl2 + O2: part I. Chlorination with Cl2, Thermochim. Acta, 2010, 497(1–2), 52–59, DOI:10.1016/j.tca.2009.08.007.
- P. K. Jena and E. A. Brocchi, Metal extraction through chlorine metallurgy, Miner. Process. Extr. Metall. Rev., 1997, 16(4), 211–237, DOI:10.1080/08827509708914136.
- N. Kanari, B. R. Reddy and I. Gaballah, Kinetics of Carbochlorination of Chromium (III) Oxide, Metall. Mater. Trans. B, 1998, 29(4), 729–737, DOI:10.1007/s11663-998-0131-x.
- N. Kanari and I. Gaballah, Chlorination and carbochlorination of magnesium oxide, Metall. Mater. Trans. A, 1999, 30(3), 383–391, DOI:10.1007/s11663-999-0070-1.
- E. Jang, Y. Jang and E. Chung, Lithium recovery from shale gas produced water using solvent extraction, Appl. Geochem., 2017, 78, 343–350, DOI:10.1016/j.apgeochem.2017.01.016.
- L. Tian, Y. Liu, P. Tang, Y. Yang, X. Wang, T. Chen, Y. Bai, A. Tiraferri and B. Liu, Lithium extraction from shale gas flowback and produced water using H1.33Mn1.67O4 adsorbent, Resour., Conserv. Recycl., 2022, 185, 106476, DOI:10.1016/j.resconrec.2022.106476.
- O. Sitando and P. L. Crouse, Processing of a Zimbabwean petalite to obtain lithium carbonate, Int. J. Miner. Process., 2012, 102–103, 45–50, DOI:10.1016/j.minpro.2011.09.014.
- E. Siame and R. D. Pascoe, Extraction of lithium from micaceous waste from china clay production, Miner. Eng., 2011, 24(14), 1595–1602, DOI:10.1016/j.mineng.2011.08.013.
- J. Jandova and H. N. Vu, Processing of zinnwaldite wastes to obtain lithium and rubidium compounds, in Proceedings of the 2008 Global Symposium on Recycling, Waste Treatment and Clean Technology, REWAS 2008, Cancun, Mexico, 2008 Search PubMed.
- J. Jandová, P. Dvořák and H. N. Vu, Processing of zinnwaldite waste to obtain Li2CO3, Hydrometallurgy, 2010, 103(1–4), 12–18, DOI:10.1016/j.hydromet.2010.02.010.
- J. Jandová, H. N. Vu, J. Kondas, and P. Dvořák, Lithium recovery from wastes after mining of Sn–W ore, in Proceedings of the European Metallurgical Conference, EMC 2007, Düsseldorf, Germany, 2007, pp. 667–677 Search PubMed.
- J. Jandová, H. N. Vu, T. Beloková, P. DvořÁk and J. Kondás, Obtaining Li2CO3 from Zinnwaldite wastes, Ceram.–Silik., 2009, 53, 108–112 Search PubMed.
- Q. Yan, et al., Extraction of valuable metals from lepidolite, Hydrometallurgy, 2012, 117–118, 116–118, DOI:10.1016/j.hydromet.2012.02.004.
- Q. Yan, et al., Extraction of lithium from lepidolite using chlorination roasting–water leaching process, Trans. Nonferrous Met. Soc. China, 2012, 22(7), 1753–1759, DOI:10.1016/S1003-6326(11)61383-6.
- Q. Yan, et al., Hydrometallurgy A novel process for extracting lithium from lepidolite, Hydrometallurgy, 2012, 121–124, 54–59, DOI:10.1016/j.hydromet.2012.04.006.
- V. T. Luong, D. J. Kang, J. W. An, D. A. Dao, M. J. Kim and T. Tran, Iron sulphate roasting for extraction of lithium from lepidolite, Hydrometallurgy, 2014, 141, 8–16, DOI:10.1016/j.hydromet.2013.09.016.
- V. T. Luong, D. J. Kang, J. W. An, M. J. Kim and T. Tran, Factors affecting the extraction of lithium from lepidolite, Hydrometallurgy, 2013, 134–135, 54–61, DOI:10.1016/j.hydromet.2013.01.015.
- G. D. Rosales, M. C. Ruiz and M. H. Rodriguez, Study of the Extraction Kinetics of Lithium by Leaching β-Spodumene with Hydrofluoric Acid, Minerals, 2016, 6(4), 98, DOI:10.3390/min6040098.
- G. D. Rosales, M. D. C. Ruiz and M. H. Rodriguez, Novel process for the extraction of lithium from β-spodumene by leaching with HF, Hydrometallurgy, 2014, 147–148, 1–6, DOI:10.1016/j.hydromet.2014.04.009.
- H. Guo, G. Kuang, H. Wang, H. Yu and X. Zhao, Investigation of Enhanced Leaching of Lithium from α-Spodumene Using Hydrofluoric and Sulfuric Acid, Minerals, 2017, 7(11), 205, DOI:10.3390/min7110205.
- G. D. Rosales, A. C. J. Resentera, J. A. Gonzalez, R. G. Wuilloud and M. H. Rodriguez, Efficient extraction of lithium from β-spodumene by direct roasting with NaF and leaching, Chem. Eng. Res. Des., 2019, 150, 320–326, DOI:10.1016/j.cherd.2019.08.009.
- Y. Chen, Q. Tian, B. Chen, X. Shi and T. Liao, Preparation of lithium carbonate from spodumene by a sodium carbonate autoclave process, Hydrometallurgy, 2011, 109(1–2), 43–46, DOI:10.1016/j.hydromet.2011.05.006.
- G. Kuang, Y. Liu, H. Li, S. Xing, F. Li and H. Guo, Extraction of lithium from β-spodumene using sodium sulfate solution, Hydrometallurgy, 2018, 177, 49–56, DOI:10.1016/j.hydromet.2018.02.015.
- Y. Song, T. Zhao, L. He, Z. Zhao and X. Liu, Hydrometallurgy a promising approach for directly extracting lithium from α-spodumene by alkaline digestion and precipitation as phosphate, Hydrometallurgy, 2019, 189, 105141, DOI:10.1016/j.hydromet.2019.105141.
- P. Zhang, T. Yokoyama, O. Itabashi, T. M. Suzuki and K. Inoue, Hydrometallurgical process for recovery of metal values from spent lithium-ion secondary batteries, Hydrometallurgy, 1998, 47(2–3), 259–271 CrossRef CAS.
- R. Gupta and A. Manthiram, Chemical Extraction of Lithium from Layered LiCoO2, J. Solid State Chem., 1996, 121(2), 483–491 CrossRef CAS.
- T. Georgi-maschler, B. Friedrich, R. Weyhe, H. Heegn and M. Rutz, Development of a recycling process for Li-ion batteries, J. Power Sources, 2012, 207, 173–182, DOI:10.1016/j.jpowsour.2012.01.152.
- V. T. Nguyen, J. C. Lee, J. Jeong, B. S. Kim and B. D. Pandey, The Separation and Recovery of Nickel and Lithium from the Sulfate Leach Liquor of Spent Lithium Ion Batteries using PC-88A, Korean Chem. Eng. Res, 2015, 53(2), 137–144 CrossRef CAS.
- O. Peltosaari, P. Tanskanen, E.-P. Heikkinen and T. Fabritius, α → γ → β-phase transformation of spodumene with hybrid microwave and conventional furnaces, Miner. Eng., 2015, 82, 54–60, DOI:10.1016/j.mineng.2015.04.012.
- R. L. Moore, J. P. Mann, A. Montoya and B. S. Haynes, In situ synchrotron XRD analysis of the kinetics of spodumene phase transitions, Phys. Chem. Chem. Phys., 2018, 20(16), 10753–10761, 10.1039/C7CP07754H.
- A. Y. Fosu, N. Kanari, D. Bartier, H. Hodge, J. Vaughan and A. Chagnes, Physico-Chemical Characteristics of Spodumene Concentrate and Its Thermal Transformations, Materials, 2021, 14(23), 7423 CrossRef CAS PubMed.
- G. D. White and T. N. McVay, Some Aspects of the Recovery of Lithium From Spodumene, Oak Ridge, TN (United States), 1958, DOI:10.2172/4352576.
- A. Y. Fosu, N. Kanari, J. Vaughan and A. Chagnes, Literature review and thermodynamic modelling of roasting processes for lithium extraction from spodumene, Metals, 2020, 10(10), 1312 CrossRef CAS.
- J. A. Peterson and G. H. Glioss, Lithium Values Recovery Process, U.S. Patent, No. 2893828, 1959 Search PubMed.
- H. Dang, B. Wang, Z. Chang, X. Wu, J. Feng, H. Zhou, W. Li and C. Sun, Recycled lithium from simulated pyrometallurgical slag by chlorination roasting, ACS Sustain. Chem. Eng., 2018, 6(10), 13160–13167 CrossRef CAS.
- H. Dang, et al., Lithium leaching via calcium chloride roasting from simulated pyrometallurgical slag of spent lithium ion battery, Sep. Purif. Technol., 2020, 233, 116025, DOI:10.1016/j.seppur.2019.116025.
- L. I. Barbosa, G. Valente, R. P. Orosco and J. A. González, Lithium extraction from β-spodumene through chlorination with chlorine gas, Miner. Eng., 2014, 56, 29–34, DOI:10.1016/j.mineng.2013.10.026.
- L. I. Barbosa, J. A. González and M. del C. Ruiz, Extraction of lithium from β-spodumene using chlorination roasting with calcium chloride, Thermochim. Acta, 2015, 605, 63–67, DOI:10.1016/j.tca.2015.02.009.
- L. I. Barbosa, N. G. Valente and J. A. González, Kinetic study on the chlorination of β-spodumene for lithium extraction with Cl2 gas, Thermochim. Acta, 2013, 557, 61–67, DOI:10.1016/j.tca.2013.01.033.
- A.C. Bidaye, C.K. Gupta and S. Venkatachalam, Studies on the chlorination of zircon: Part I. Static bed investigations, Metall. Mater. Trans. B, 1999, 30(2), 205–213 CrossRef.
- W.W. Hutchison, Two stages of decrepitation of micas, Can. Mineral., 1966, 8(4), 437–460 Search PubMed.
- M. Anenburg and Y. Katzir, Muscovite dehydration melting in Si-rich metapelites: microstructural evidence from trondhjemitic migmatites, Mineral. Petrol., 2014, 108(1), 137–152 CrossRef CAS.
- B. Dyck, D. J. Waters, M. R. St-Onge and M. P. Searle, Muscovite dehydration melting: reaction mechanisms, microstructures, and implications for anatexis, J. Metamorph. Geol., 2020, 38(1), 29–52 CrossRef CAS.
- B. J. S. Douce Patino and E. Alberto, Dehydration-melting of biotite gneiss and quartz amphibolite from 3 to 15 kbar, J. Petrol., 1995, 36(3), 707–738 CrossRef.
- A. A. Graphchikov, A. N. Konilov and J. D. Clemens, Biotite dehydration, partial melting, and fluid composition: experiments in the system KAlO2–FeO–MgO–SiO2–H2O–CO2, Am. Mineral., 1999, 84(1–2), 15–26, DOI:10.2138/am-1999-1-202.
- L. Li, S. Lei, Y. Liu and H. Luo, Extraction and Reaction Mechanism of Potassium from Associated Phosphorus and Potassium Ore, J. Wuhan Univ. Technol.-Materials Sci. Ed., 2016, 31(6), 1255–1260 CrossRef CAS.
- N. M. Johnson and B. Fegley, Tremolite decomposition on Venus II. Products, kinetics, and mechanism, Icarus, 2003, 164(2), 317–333 CrossRef CAS.
- H. Xu, D.R. Veblen, L. Gufeng and X. Jiyue, Transmission electron microscopy study of the thermal decomposition of tremolite into clinopyroxene, Am. Mineral., 1996, 81(9–10), 1126–1132 CAS.
- F. Freeman and A. G. Frazer, Pseudo polymorphic transition: the amphibole → pyroxene reaction, Nature, 1968, 220(5162), 67–68, DOI:10.1038/220067a0.
- B. Yuan, et al., Extraction of potassium from K-feldspar via the CaCl2 calcination route, Chin. J. Chem. Eng., 2015, 23(9), 1557–1564, DOI:10.1016/j.cjche.2015.06.012.
|
| This journal is © The Royal Society of Chemistry 2022 |
Click here to see how this site uses Cookies. View our privacy policy here.  Open Access Article
 a,
Ndue Kanari
 a,
Danièle Bartiera,
James Vaughan
 b and
Alexandre Chagnes
 *a
*a


