
 Open Access Article
 This Open Access Article is licensed under a Creative Commons Attribution-Non Commercial 3.0 Unported Licence
Anti-amyloidogenic property of gold nanoparticle decorated quercetin polymer nanorods in pH and temperature induced aggregation of lysozyme†
Pranita Rananawarea,
Parimal Pandita,
Seekha Naikb,
Monalisa Mishrab,
Rangappa S. Keria and
Varsha P. Brahmkhatri *a
*a
aNanomaterials for Drug Delivery and Therapeutics (NDT-Lab), Centre for Nano and Material Science, Jain University, Jain Global Campus, Bengaluru 562112, Karnataka, India. E-mail: brahmkhatri.varsha@gmail.com; b.varsha@jainuniversity.ac.in
bNeural Developmental Biology Lab, Department of Life Science NIT Rourkela, Rourkela, Odisha 769008, India
First published on 19th August 2022
Abstract
Quercetin is an abundant plant polyphenol effective against several diseases due to its antioxidant and anti-inflammatory activity. Herein, we report novel polymeric quercetin nanorods and the former decorated with gold nanoparticles for the first time. The prepared conjugates quercetin-polyvinylpyrrolidone (Q-PVP) and quercetin-polyvinylpyrrolidone-gold nanoparticles (Q-PVP-Au) were characterized by UV-visible spectroscopy, Fourier transform infrared, dynamic light scattering, and zeta potential measurements. The surface morphology of conjugates was analyzed by field emission scanning electron microscopy. These conjugates exhibit harmonized rod-like morphology with a narrow size distribution. Furthermore, the quercetin conjugates with nanorod morphology exhibited enhanced and prolonged drug release over a long period. The synthesized conjugates were investigated for lysozyme aggregation kinetics. ThT binding assay, fibril size measurement, and electron microscopy results revealed that conjugates could suppress fibrillogenesis in lysozyme. The highest amyloid aggregation inhibition activity (IC50) was obtained against Q-PVP and Q-PVP-Au at 32 μg mL−1 and 30 μg mL−1 respectively. The amyloid aggregate disintegration activity (DC50) obtained against Q-PVP and Q-PVP-Au was 27 μg mL−1 and 29 μg mL−1 respectively. The present quercetin conjugates exhibit enhanced bioavailability and stability. They were potent inhibitors of lysozyme aggregation that may find applications as a therapeutic agent in neurological diseases like Alzheimer's and Parkinson's.
1. Introduction
The formation of amyloid fibrils is one of the most important signs and representative biomarkers in various neurological diseases, including Alzheimer's disease, Parkinson's disease, and diabetes (type-II).1–3 In the interim, various globular proteins (lysozyme and β2 microglobulins) and natively unfolded proteins (β-amyloid peptide and α-synuclein) have been reported to be associated with the fibril formation process, which leads to the unstable transitional forms that eventually contribute to neuro disorders.4–9 The first report on lysozyme amyloidosis was confirmed in 1993 by Pepys et al.,10 and in vitro studies with lysozyme have provided inspiring results and vital insights into amyloid fibrillogenesis. It is well documented that the lysozyme amyloid oligomers and fibrils encourage cellular dysfunction and cell death.11 Fibrils were shown to be more noxious than amorphous aggregates, possibly because of their increased exposure to hydrophobic surfaces. It is necessary to evaluate the effect of novel inhibitory drug formulations on each form of the protein aggregate when developing new inhibitory formulations to prevent protein aggregation.12 Recent reports show that large amounts of small drug molecules and natural compounds can bind and inhibit amyloid fibrils, such as curcumin,13 quercetin,14 clioquinol,15 indoles,16 and EGCG.17,18 Among them, quercetin (Q) is grabbing attention to inhibit amyloid deposits and reduce the cytotoxicity of amyloid fibrils or oligomers.19 Q is a well-known common plant flavonoid, having antioxidant properties, and is an extensively used bioflavonoid. It exhibits beneficial properties for human health due to its broad pharmacological aspects such as anti-hypertensive, anti-obesity, anti-hypercholesterolemic, and anti-atherosclerotic activity.20 Q is a known drug for its efficiency in various diseases such as cardiovascular disease,21 neurodegenerative diseases,22–25 osteoporosis,26,27 and lung cancer.28,29 Nevertheless, the unique properties of Q are challenging to utilize due to its insufficient bioavailability and low chemical solubility and stability.30Nanotechnology-based approaches attract extensive attention to improving drug solubility, bioavailability, and stability.31 On top of this, various other nanoparticle systems influenced amyloid fibril nucleation and disintegration of matured amyloid fibrils. For instance, gold nanoparticles,32,33 magnetic nanoparticles,34,35 polyoxometalate nanoparticles,36 iron oxide nanoparticles,37 carbon nanoparticles,38,39 graphene oxide quantum dots40 and polymer nanoparticles41–43 have been reported to inhibit amyloid fibrillation. For instance, Konar et al. reported the influence of silica nanoparticles (SiNPs) on the aggregation of hen egg white lysozyme (HEWL) under heat and acidic conditions using various biophysical methods. They have demonstrated that the SiNPs promote the amyloid fibril formation in HEWL in a concentration-dependent manner. At elevated concentrations of SiNPs, extended cross-linked fibrils of an antiparallel β-sheet configuration were observed.44 Debnath et al. reported nano-epigallocatechin-3-gallate (EGCG) with 25 nm in size. Micelle-based nano EGCG efficiently inhibited amyloid fibrillation, disintegrated mature fibrils, and lowered the amyloidogenic cytotoxicity.45 The same group also reported an up-regulated autophagy process for inhibiting protein aggregates from cells by biopolymer micelle. The polymer has a polyaspartic acid-functionalized by arginine, fatty amine, and primary amine to induce enhanced cell uptake, self-assembly, and up-regulating autophagy processes, respectively.46 Guerrero et al. suggested that Na-citrate derived carbon quantum dots (CQDs) could intervene in HEWL aggregation kinetics. Na-citrate CQDs were efficient enough to dissolve oligomeric HEWL into monomeric HEWL and provoke the dissociation of mature fibrils.47 Ban et al. reported that the starch capped ZnONP of 10–15 nm core size shows the repressing activity of three different formulae of ZnONP to amyloid fibrillation of HEWL and amyloid-mediated cytotoxicity. Such inhibition was also associated with increased protein stability, decreased cross β-sheet amount, and surface hydrophobicity.48 All these reports suggest that different kinds of nanoparticles can inhibit or accelerate HEWL aggregation kinetics and the practical implications depend on the inherent nature, size, shape and type of nanoparticle.49
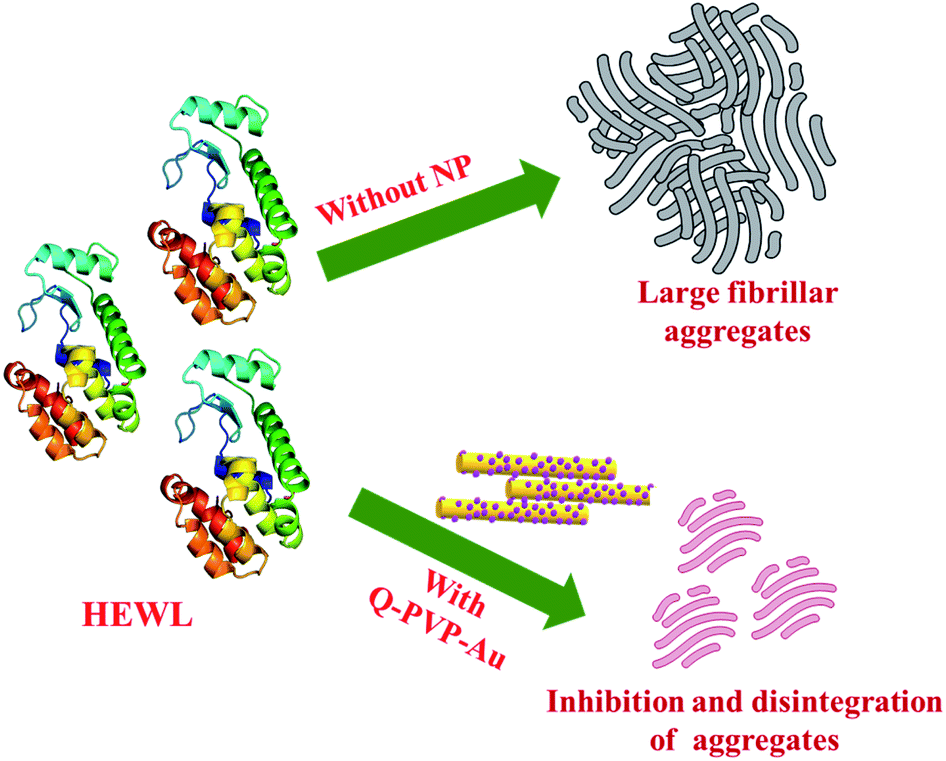
The current study reports the synthesis of novel polymeric conjugates, namely Q-PVP and Q-PVP-Au, comprising Q and polyvinylpyrrolidone polymer (PVP). Furthermore, Q-PVP-Au conjugates are decorated with gold nanoparticles (AuNP). The prepared conjugates are characterized by FT-IR, UV-visible spectroscopy, DLS, and zeta potential analysis. The FE-SEM characterized the surface morphology of conjugates. The Q loading, Q conjugates' stability, and drug release were studied using UV-visible spectroscopy. The rod-shaped Q conjugates (Q-PVP and Q-PVP-Au) were investigated for HEWL aggregation kinetics. The thioflavin T (ThT) analysis and size measurement by dynamic light scattering (DLS) techniques monitored HEWL aggregation kinetics. The Q conjugates with nanorod morphology revealed excellent potential in inhibiting lysozyme aggregation (Scheme 1).
 | ||
| Scheme 1 Polymeric conjugates Q-PVP and Q-PVP-Au for inhibition of HEWL aggregation. | ||
2. Materials and methods
The purified tetrachloroauric (III) acid trihydrate, quercetin dihydrate, and Hen Egg White Lysozyme (HEWL) were from Sigma-Aldrich and used as acquired. Polyvinylpyrrolidone (PVP), sodium citrate, and sodium borohydride were acquired from S D Fine-Chem Ltd. All reagents supplied were used without further purification and were all analytical grades. Milli Q water was used for solution preparations and all procedures.2.1 Synthesis of the quercetin polymer nanoconjugate (Q-PVP)
The curcumin-based polymer conjugates (C-PVP and C-PVP-AuNP) were synthesized by our group.50 Based on curcumin-polymer conjugates in the current study we have chosen another drug, Quercetin and Q polymer conjugates with rod like morphology were synthesized for the first time. The Q-PVP conjugates were synthesized as follows. 20 mL of 10 mg PVP was added in 100 mL of 38.8 mM trisodium citrate and heated under a reflux condenser. The solution was boiled for 45 min. For the conjugation of the drug, 40 mg of Q was dissolved in 25 mL of acetone, and this solution was added to the above reaction mixture at room temperature. The reaction mixture was stirred continuously for 3 h at 60 °C without a reflux condenser to remove acetone from the solution altogether. The conjugates were centrifuged, washed with water, and designated as Q-PVP.502.2 Synthesis of the gold nanoparticle decorated quercetin polymer nanoconjugate (Q-PVP-Au)
In a typical procedure, 20 mL of 10 mg PVP was added to preheated citrate-capped gold nanoparticles (pre-synthesized AuNP colloidal solution, size 27 nm, procedure mentioned in ESI†). The reaction mixture was stirred continuously for the next 30 min. To conjugate, the drug, 40 mg of Q was dissolved in 25 mL of acetone, and this solution was added to the above reaction mixture. The reaction mixture was stirred continuously for 2 h at 60 °C without a reflux condenser to remove acetone from the solution altogether. The obtained conjugates were centrifuged and washed subsequently with water and designated as Q-PVP-Au.502.3 Characterization of conjugates
The presence of surface functional groups in conjugates was analyzed by Fourier transform infrared (FT-IR) spectra. The FT-IR spectra of Q-PVP and Q-PVP-Au were recorded using KBr pellet on Bruker FT-IR Spectrometer ALPHA-E. To investigate Q conjugation, stability, and release from Q-PVP and Q-PVP-Au, UV-visible spectra were recorded on a Shimadzu UV-1800 UV-vis spectrophotometer. The samples were in the water and continuously monitored with respect to the time. The surface morphology of conjugates was analyzed by FEG source and field emission scanning electron microscope (FE-SEM), JEOL, JSM, 7100-F. The zeta potential and hydrodynamic radii of the Q-PVP and Q-PVP-Au conjugates were measured using a Nanozetasizer machine (Brookhaven Zeta PALS). Samples were prepared in water for DLS and zeta potential measurement.2.4 Quercetin loading and release studies
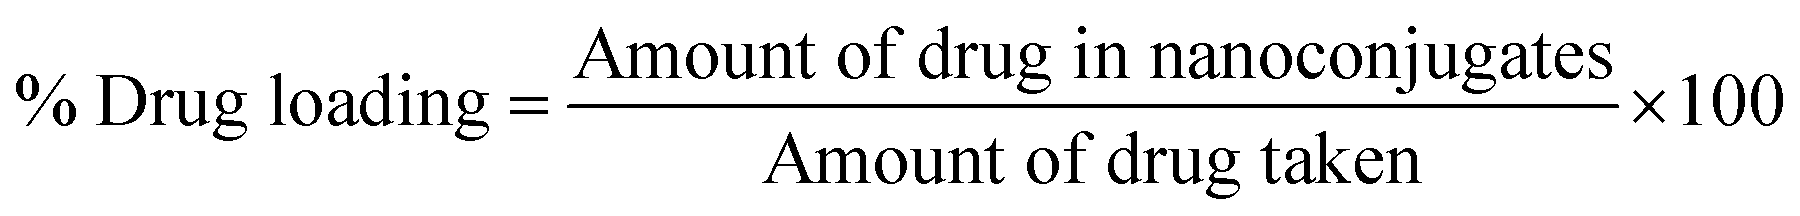
Drug loading was determined by the centrifugation method. The re-dispersed conjugate suspension was centrifuged at 12![[thin space (1/6-em)]](https://www.rsc.org/images/entities/char_2009.gif) 000 rpm for 20 min to separate the free drug in the supernatant. The concentration of Q in the supernatant was determined by measuring the absorbance at 372 nm for Q in Q-PVP and Q-PVP-Au to evaluate the drug loading efficiency using a UV-visible spectrophotometer. The concentration of unknown was determined from the calibration curve, as shown in Fig. S1 and Table S1.† The drug loading capacity was calculated using eqn (1).
000 rpm for 20 min to separate the free drug in the supernatant. The concentration of Q in the supernatant was determined by measuring the absorbance at 372 nm for Q in Q-PVP and Q-PVP-Au to evaluate the drug loading efficiency using a UV-visible spectrophotometer. The concentration of unknown was determined from the calibration curve, as shown in Fig. S1 and Table S1.† The drug loading capacity was calculated using eqn (1).
 | (1) |
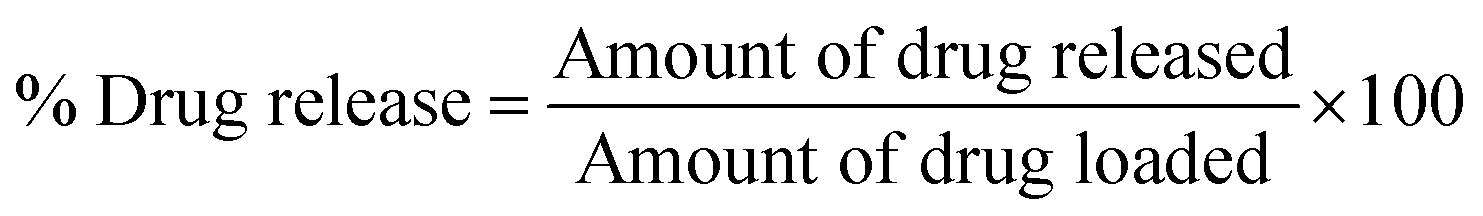
The drug release studies were conducted in phosphate buffer saline (PBS) dissolution medium at pH 7.4 and 37 °C. The conjugates (Q-PVP and Q-PVP-Au) were dispersed in 30 mL of buffer medium, and a specific volume of sample was taken at different time intervals and replaced simultaneously with the same volume of fresh buffer. The release kinetics was studied using UV-visible spectroscopy. Data were recorded at specific time intervals to monitor the release of Q into the solution using eqn (2).
 | (2) |
3. Preparation of HEWL amyloids
HEWL amyloids were achieved at acidic pH 1.6 by 24 h incubation at 65 °C. The HEWL solution was prepared in sterilized Milli-Q water. HEWL was weighed out 0.2 mg mL−1 and dissolved in 2 mL of 0.1% HCl (pH 1.6). Prepared solutions were heated up to 65 °C at 550 rpm for 24 h to form HEWL amyloids.51 HEWL aggregation kinetics was studied with and without conjugates by different techniques. Q-PVP NP and Q-PVP-Au were added at a specific concentration along with HEWL solution and heated up to 65 °C at 550 rpm for 24 h to study the inhibition of HEWL aggregation.3.1 Thioflavin T (ThT) fluorescence measurements
ThT fluorescence spectra were used to study the HEWL aggregation kinetics with amyloidogenic conditions as acidic pH 1.6 and temperature at 65 °C for 24 h incubation in the presence of conjugates, Q-PVP-Au and Q-PVP, using photoluminescence. 13 μM of ThT (thioflavin T) concentration was used. The 60 μl HEWL solution was added into the 2940 μl of ThT solution at different time intervals, and the photoluminescence (PL) spectra were recorded. The excitation wavelength was 440 nm (slit width = 5 nm), and the data were collected over 460–490 nm (slit width = 5 nm). Samples were added to a quartz fluorescence cell, and data were recorded at room temperature on Shimadzu RF 301 PC Spectro fluorophotometer. HEWL was incubated with conjugates to monitor aggregation kinetics at specific concentrations.3.2 Determination of IC50 and DC50 by thioflavin T (ThT) fluorescence measurement
The HEWL aggregation was carried out with amyloidogenic conditions as acidic pH 1.6 and temperature at 65 °C for 24 h incubation in the presence of Q-PVP and Q-PVP-Au to investigate the inhibition of amyloid aggregates and the degradation of HEWL amyloid aggregates. The concentration of conjugates at which inhibition of aggregates formation or degradation of amyloid aggregates is half-maximal are designated as IC50 and DC50 values. The effect of conjugates was studied by varying the concentration ranging from 6 μg mL−1 to 50 μg mL−1 at a constant HEWL concentration of 0.2 mg mL−1. The concentration of aggregates was determined using ThT assay. ThT fluorescence intensities for the formation of HEWL aggregates were considered 100%. The excitation wavelength was 440 nm (slit width = 5 nm), and the data were collected over 460–490 nm (slit width = 5 nm). From ThT, fluorescence curves, the IC50 and DC50 values were determined.523.3 Dynamic light scattering (DLS) measurement
DLS measurements were carried out to study the HEWL aggregation kinetics by measuring the hydrodynamic radii (HD) of HEWL aggregates as a function of time and concentrations of Q-PVP-Au and Q-PVP conjugates with amyloidogenic conditions as acidic pH 1.6 and temperature at 65 °C for 24 h incubation. HEWL fibril solution was incubated with different concentrations of Q-PVP and Q-PVP-Au at specific time intervals, and aggregate size was measured on a Nanozetasizer machine (Brookhaven Zeta PALS).3.4 Tyrosine fluorescence spectra
Tyrosine fluorescence spectra were used to study the interaction between lysozyme and Q, PVP, Au, Q-PVP-Au and Q-PVP conjugates. HEWL amyloids were achieved at acidic pH 1.6 by 24 h incubation and at 65 °C. The excitation wavelength was 280 nm (slit width = 5 nm) and the data were collected over 290–370 nm (slit width = 5 nm). Samples were added to a quartz fluorescence cell and data were recorded at room temperature.3.5 HEWL aggregation kinetics using FE-SEM and AFM
HEWL amyloids were achieved at acidic pH 1.6 by 24 h incubation and at 65 °C. Samples for FE-SEM were prepared by drop-casting of 20 μL of HEWL and conjugates reaction mixture on a clean and dry silicon wafer and dried for 30 min in a vacuum oven at 45 °C. The images were taken using JEOL, JSM, 7100-F microscope. AFM sample preparation was done as mentioned for FE-SEM. The images were taken using an atomic force microscope (Park system AFM) in a non-contact mode under ambient conditions using the cantilever OMLC-AC160TS (Park AFM Probes) with a typical resonance frequency 0.5 Hz and a spring constant of 40 N m−14. Result and discussion
4.1 Structure and morphology of Q-PVP and Q-PVP-Au
Recently, polymeric nanoparticles have been an imperative area of research due to the surface properties of polymers. Polymeric nanoparticles have been synthesized by various methods like solvent evaporation, nanoprecipitation, solvent diffusion, emulsion, and interfacial polymerization.53,54 Q drug is known to exhibit anti-amyloidogenic activity.14 An administration of excessive dose because of poor bioavailability of Q is the major drawback for its applications. Also, it has minimal solubility in water. The purpose of designing polymer-based Q conjugates is to overcome the solubility and bioavailability complications. In this work, we present novel Q polymer conjugates functionalized with AuNP and their efficacy was evaluated on the HEWL protein aggregation. Among all the drug carriers, PVP is well known polymeric drug carrier that is mostly used for controlled drug delivery efficiently.55–61 A schematic representation of the synthesis of the Q conjugates, Q-PVP and Q-PVP-Au is shown in Scheme 2.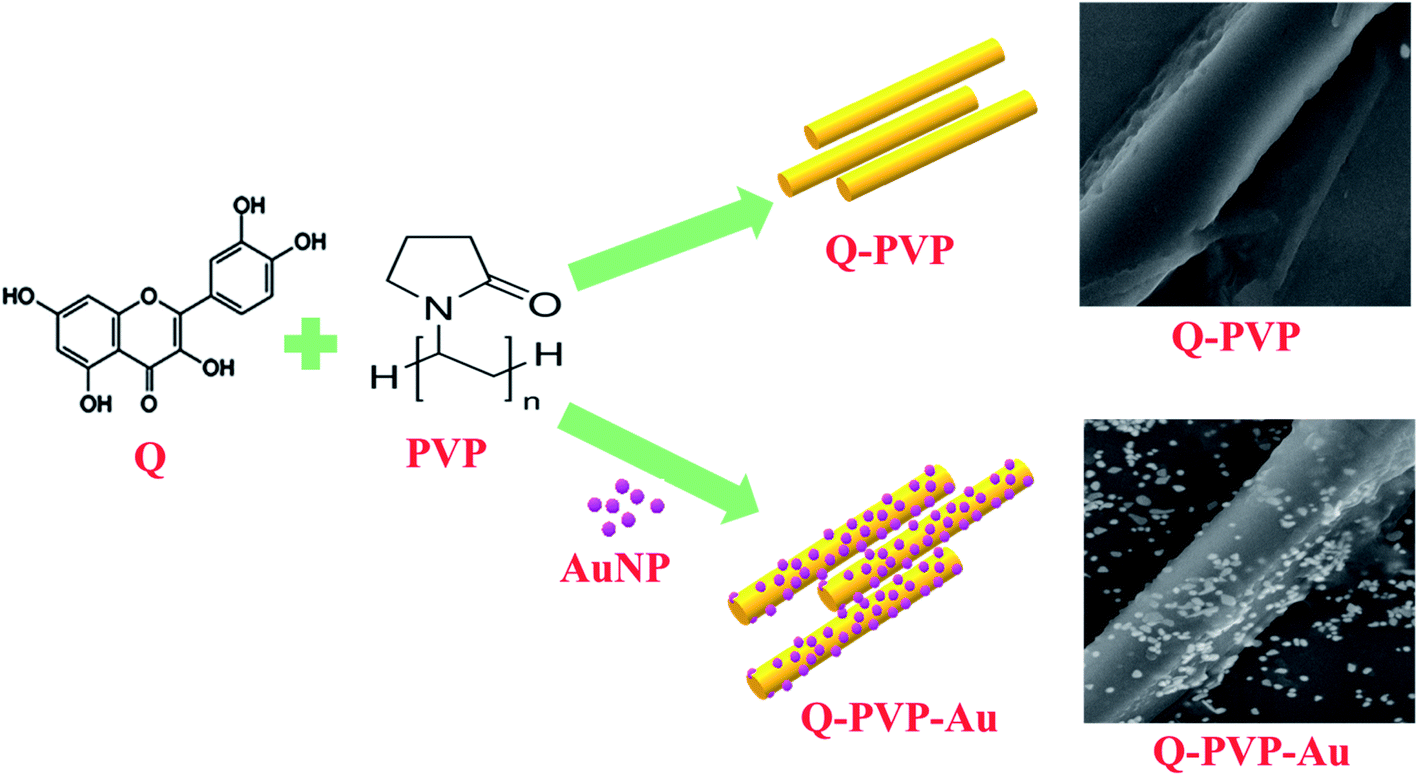 | ||
| Scheme 2 Schematic representation of the synthesis of Q-PVP and Q-PVP-Au conjugates. | ||
The first confirmation of conjugation of Q with polymer in conjugates was observed from UV-visible spectra. Fig. 1A shows the UV-visible spectra of Q, AuNPs, Q-PVP, and Q-PVP–Au. For Q, two distinctive absorption bands could be seen in the 250–400 nm range. A band around 372 nm relates to the B-ring absorption (denoted by red color circle in Fig. 1A), and another one around 250 nm relates to the A-ring absorption (denoted by black color circle in Fig. 1A grey curve).62 Q specific absorption maximum shifts to 260 nm and 385 nm upon conjugation with PVP for Q-PVP (Fig. 1A blue curve). AuNP decorated Q-PVP-Au conjugate exhibits three bands, one at 534 nm attributed to AuNP and the other two at 270 nm and 375 nm attributed to the presence of encapsulated Q (Fig. 1A green curve). The redshift in Q can be attributed to the conjugation with PVP and AuNP. There is no chemical structure demolition during the fabrication process as indicated by the UV-Vis absorption continuum of Q-PVP-Au in water, similar to that of the Q drug. The absorption maxima of Q show a peak shift of 10 to 20 nm in the Q-PVP after conjugation with PVP, which can be attributed to the combination of PVP functionalized with Q. At the molecular level for Q, as the electronic transitions are accompanied by vibrational and rotational transitions. When a large number of wavelengths that are close to each other are absorbed, the absorption due to electronic excitation is relatively broad and hence the broader peaks are observed in UV-visible spectra. The π → π* transition energy of Q is modified through various processes post conjugation with the PVP molecules like hydrogen bonding63,64 in Q-PVP and Q-PVP-Au. In the Q-PVP–Au conjugate, the AuNP also exhibits a shift that can also be attributed to conjugation. The empirical findings are in agreement with the reported literature.65 Also, the Q concentration was 808 μM and 882 μM in Q-PVP and Q-PVP-Au, respectively, as determined from absorption spectra. The Q loading was found to be 88% and 94% in Q-PVP and Q-PVP-Au, respectively.
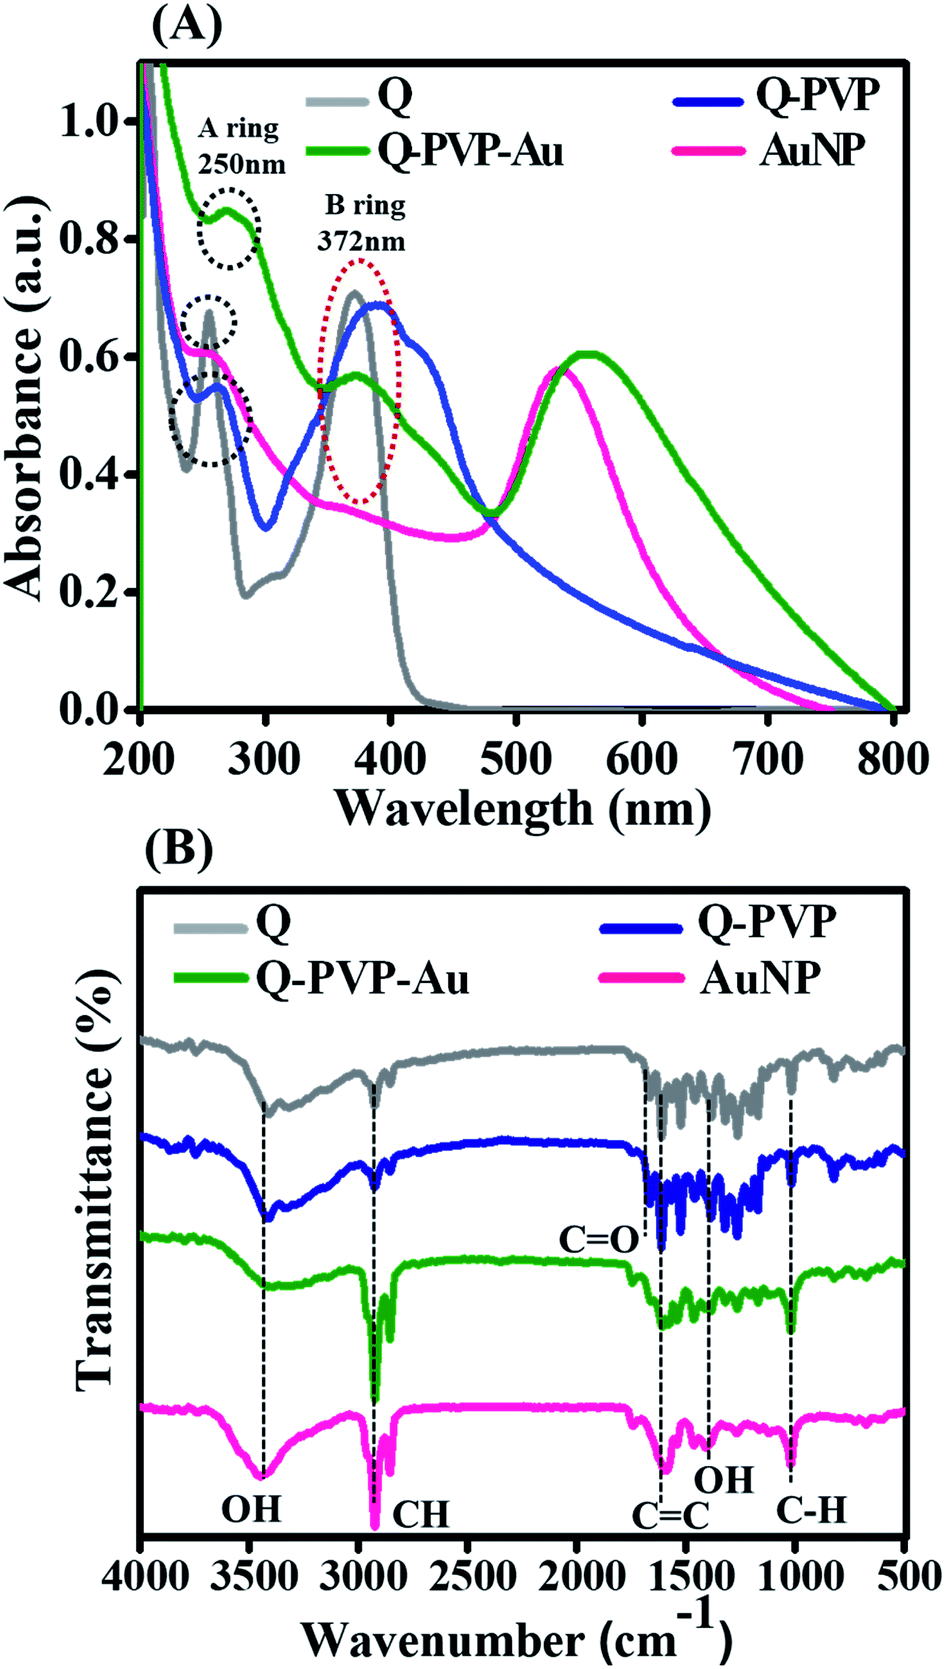 | ||
| Fig. 1 (A) UV-Visible spectra of Q, AuNP, Q-PVP, and Q-PVP-Au; (B) Fourier transform infrared (FTIR) analysis for confirmation of functional groups in Q (Gray line), Q-PVP (blue line), Q-PVP-Au (green line), AuNP (pink line). | ||
FTIR spectra of Q, AuNP, Q-PVP and Q-PVP-Au and were recorded to validate the presence of specific functional groups. As shown in Fig. 1B, Q showed several representative bands: O–H stretching (3300–3500 cm−1) these demonstrates the involvement of OH from the enol and phenolic –OH group from Q; C–H stretching (2925 cm−1) specifies the alkane group; C![[double bond, length as m-dash]](https://www.rsc.org/images/entities/char_e001.gif) O stretching (1660 cm−1) specifies aryl ketonic; CC aromatic stretching (1610–1630 cm−1); O–H bending (1385 cm−1); and C–H aromatic bending (1000 cm−1).66 The FT-IR spectrum of the PVP showed bands corresponding to O–H stretching (3300–3600 cm−1) and CO stretching (1600–1800 cm−1).67 The intensity changes and broadening were observed in FTIR spectra after the conjugation of Q and PVP. We also observed the broadening in the O–H stretching peak at 3363 cm−1 of Q, post conjugation with PVP, which could be attributed to the formation of intermolecular H-bonding interactions between Q and PVP. C–H stretching shows the prominent peak in AuNP and Q-PVP-Au at 1000 cm−1. All the specific structural occurrences of Q and PVP were observed in both the conjugates Q-PVP and Q-PVP-Au (Fig. 1B). Thus, the conjugation with PVP does not alter the structure of Q as confirmed by FTIR spectra. The FT-IR stretching frequencies for all the conjugates are summarized in Table S2, as shown in ESI.†
O stretching (1660 cm−1) specifies aryl ketonic; CC aromatic stretching (1610–1630 cm−1); O–H bending (1385 cm−1); and C–H aromatic bending (1000 cm−1).66 The FT-IR spectrum of the PVP showed bands corresponding to O–H stretching (3300–3600 cm−1) and CO stretching (1600–1800 cm−1).67 The intensity changes and broadening were observed in FTIR spectra after the conjugation of Q and PVP. We also observed the broadening in the O–H stretching peak at 3363 cm−1 of Q, post conjugation with PVP, which could be attributed to the formation of intermolecular H-bonding interactions between Q and PVP. C–H stretching shows the prominent peak in AuNP and Q-PVP-Au at 1000 cm−1. All the specific structural occurrences of Q and PVP were observed in both the conjugates Q-PVP and Q-PVP-Au (Fig. 1B). Thus, the conjugation with PVP does not alter the structure of Q as confirmed by FTIR spectra. The FT-IR stretching frequencies for all the conjugates are summarized in Table S2, as shown in ESI.†
The morphological features like the shape and size of Q-PVP and Q-PVP-Au conjugates were studied by SEM. The time-dependent assembly formation of Q-PVP and Q-PVP-Au is shown in Fig. 2 and 3, respectively. The SEM images depict the well-defined and structured morphology of conjugates. The structural assembly of both Q-PVP and Q-PVP-Au changes from crude, unstructured to well-defined, identical rod-like structures with time. The growth of Q-PVP nanorods at different time points was observed by FE-SEM. One can witness the significant conglomerated clusters in the initial one hour of synthesis (at 60 min) as shown in Fig. 2a. These clusters were separated and transformed into smaller clusters and appeared like many unstructured rods or flat petals-like structures, as indicated in Fig. 2b within the next 30 minutes. Rod-shaped structures of Q-PVP were observed within 2 hours as depicted in Fig. 2c. The flower-like clusters start transforming into a well-structured rod shape at the initial stage. The distinct well-separated nanorods from the flower-like clusters were observed at 150 min, as shown in Fig. 2d. Eventually, well assembled and well-structured Q-PVP nanorods were formed in 3 h with an average diameter of 300–400 nm and length of 6–8 μm, as observed in Fig. 2(e and f). The drug loading amount of Q under different morphology of Q-PVP, along with specific time was calculated as shown in ESI Table S3.†
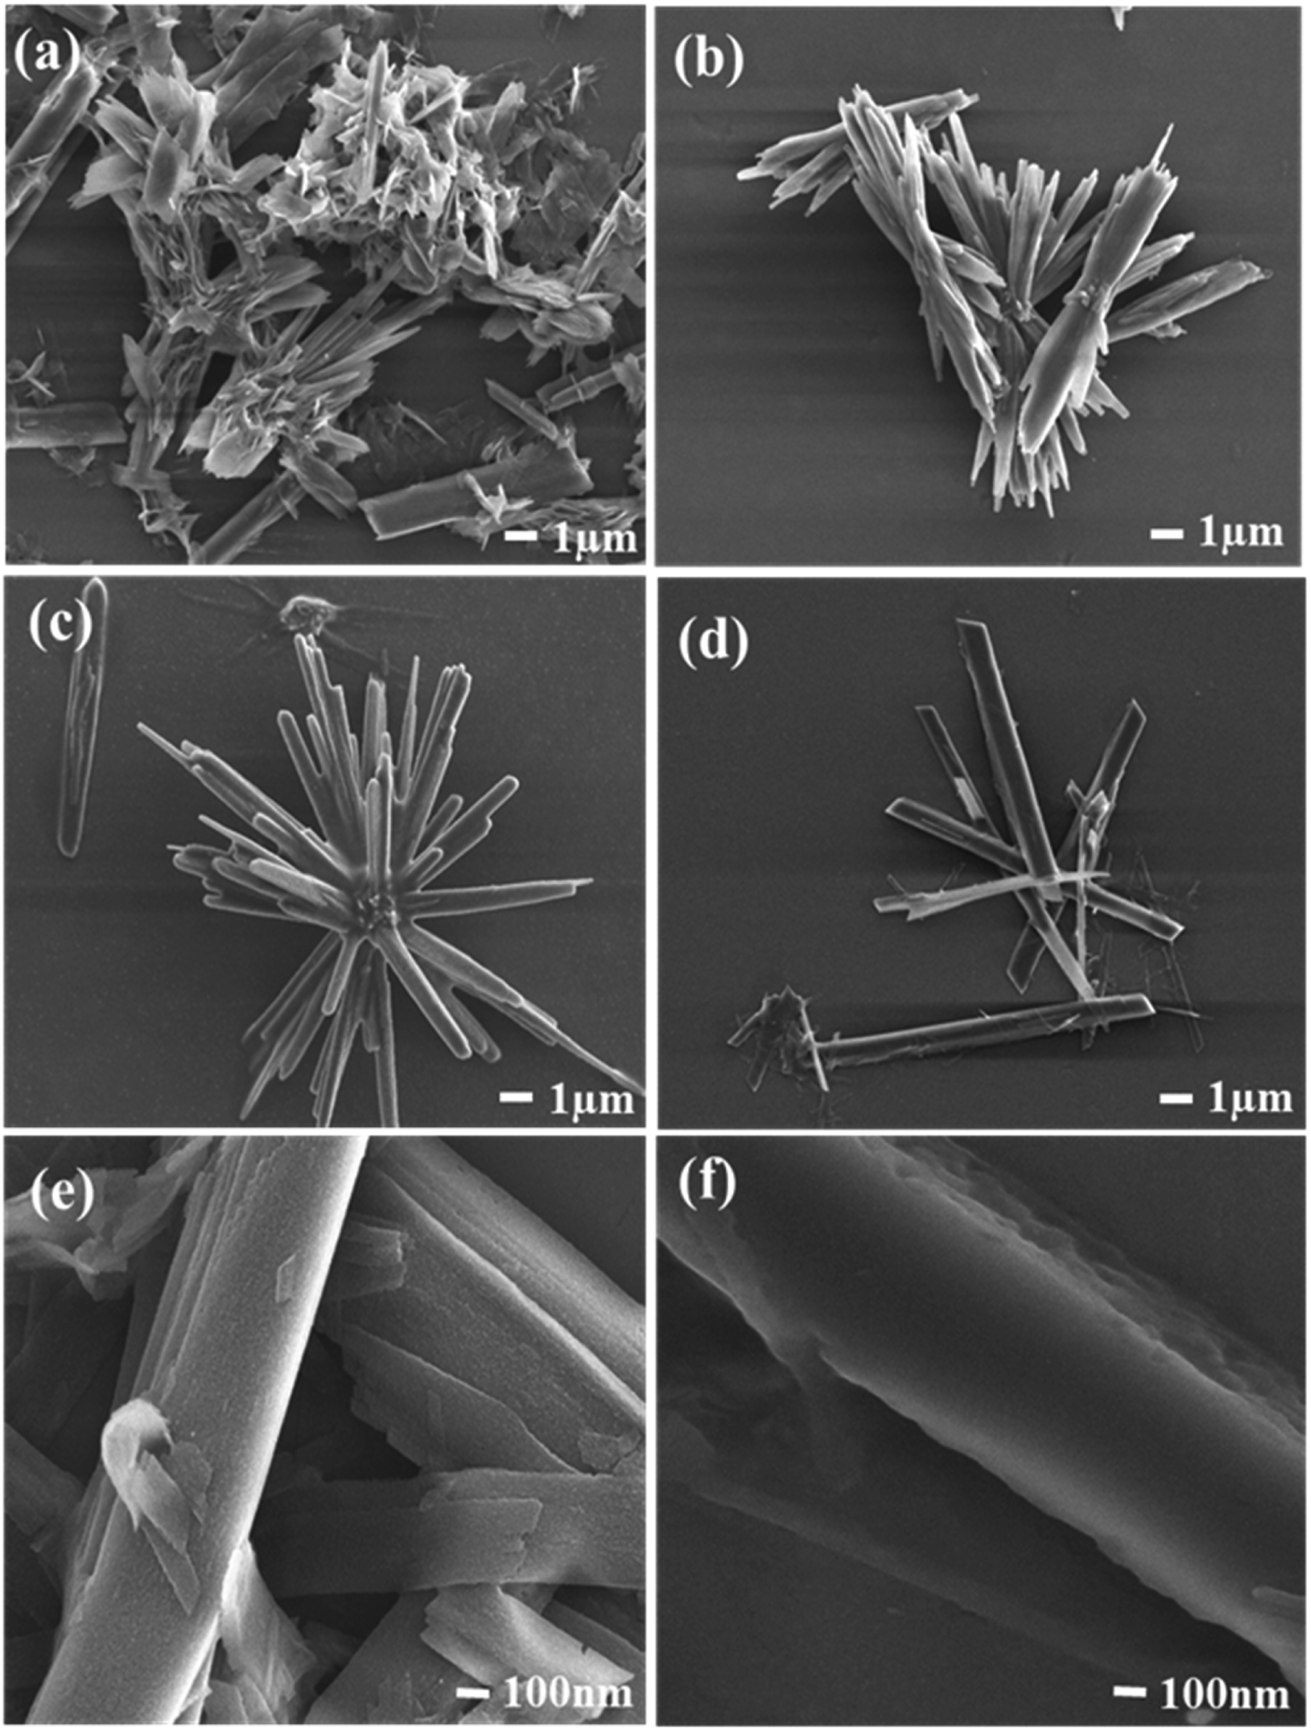 | ||
| Fig. 2 FE-SEM images of Q-PVP (a) After 60 min of synthesis; (b) after 90 min; (c) growth of Q-PVP nanorods was observed in 120 min; (d) Q-PVP nanorods were separated from clusters at 150 min; (e and f) the well-assembled Q-PVP nanorods formed in 180 min with the average diameter of 300–400 nm and length of 6–8 μm. | ||
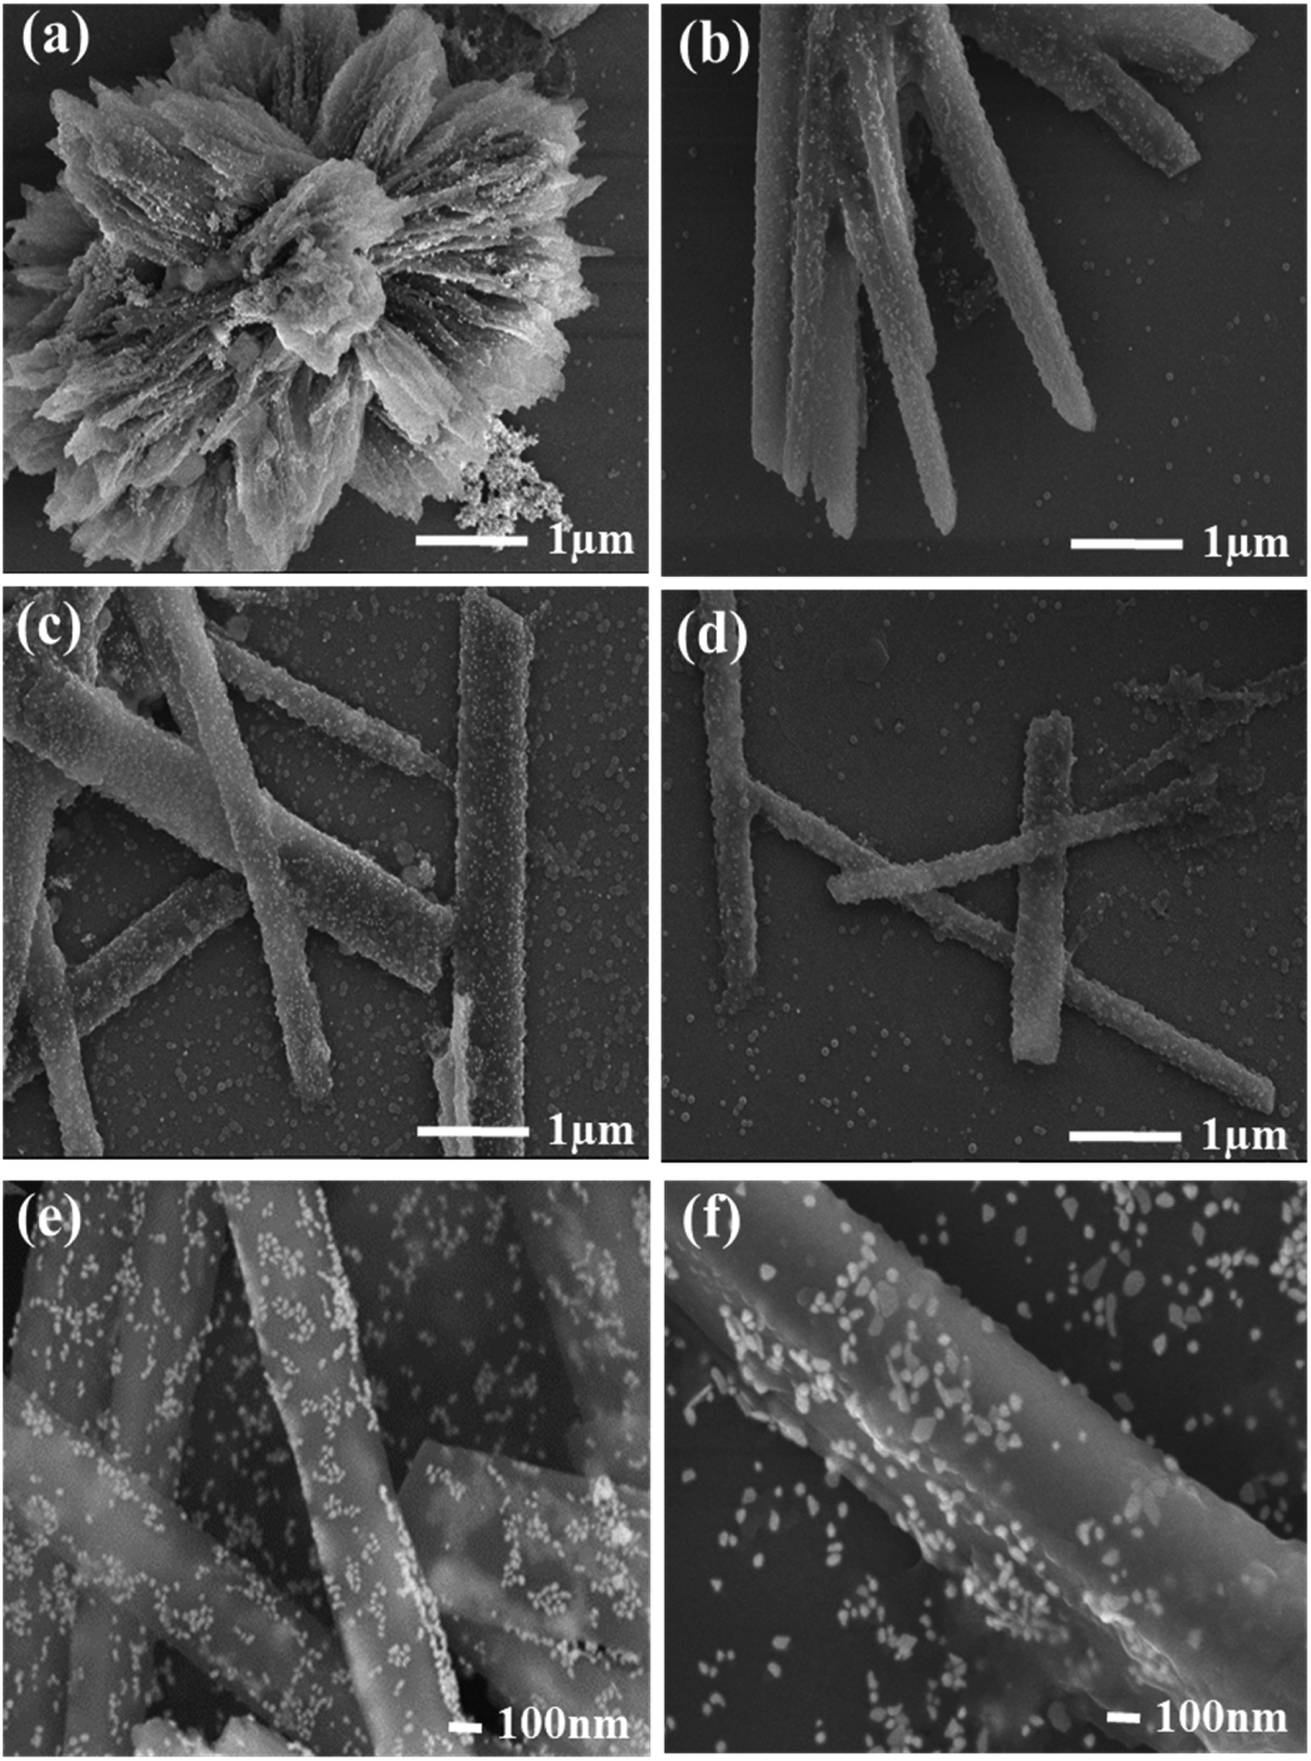 | ||
| Fig. 3 FE-SEM images of Q-PVP-Au (a) the big conglomerated flower like structure was observed in the presence of AuNP in 15 min; (b) growth of Q-PVP-Au nanorods was observed in 30 min. (c) After 60 min, nanorods were uniformly wrapped by AuNP; (d) well separated nanorods from clusters were observed at 90 min; (e and f) the well-assembled nanorods decorated with AuNP in Q-PVP-Au were observed at 120 min with an average diameter of 300–400 nm and length of 6–8 μm. | ||
The time-dependent morphological investigations of Q-PVP-Au are shown in Fig. 3. The growth of nano rod-like morphology from the flower-like clusters, similar to Q-PVP, were also observed in Q-PVP-Au (Fig. 3a–d). Additionally, one can observe in Q-PVP-Au, the surface of the nanorod was uniformly decorated or warped by tiny AuNP of 20–25 nm in size (Fig. 3e and f). Conjugation with AuNP did not affect Q nanorods' size, shape, and morphology in Q-PVP-Au. In fact, in the presence of AuNP, the nanorod formation is accelerated, and within 120 min of reaction time, the discrete nanorods uniformly decorated with AuNP on the surface were observed. Whereas in case Q-PVP nanorod formation takes place in 180 min. The formation of unique Q nanorods is primarily attributed to hydroxyl groups in Q and PVP. The Q/PVP weight ratio was controlled in a fabrication process to get well-structured nanorods. Needle-like or rod-shaped structures can be seen when the PVP content was only 1%, as reported earlier.62 The formation of ordered assembly of polymers into conjugates is well documented in the literature, and polymers of lower molecular weight are more appropriate for conjugation than the polymers of high molecular weight.68 The drug loading amount of Q under different morphology of Q-PVP-Au, at specific time was calculated as shown in ESI Table S4.†
The hydrodynamic diameters (HD) of conjugates were measured using DLS. Q-PVP, Q-PVP-Au, and AuNP exhibited HD sizes of 1024 nm, 1087 nm, and 27 nm, respectively. Zeta potential (ZP) indicates the colloidal stability of the conjugates. The observed ZP values were −38.6 mV, −26.8 mV and 0.4 mV for Q-PVP, Q-PVP-Au, and AuNP respectively. The AuNPs are slightly positively charged, and therefore, they have uniformly warped around negatively charged Q nanorods due to electrostatic interactions in Q-PVP-Au. Specifically, the hydrogen bonding and electrostatic interactions were the main reasons for the AuNPs to be all over the surface of the Q-PVP-Au rods. The observed ZP values reveal that the Q conjugates (Q-PVP and Q-PVP-Au) were highly stable, and it was further confirmed by UV-visible spectroscopy.
4.2 Stability of Q-PVP, Q-PVP-Au, and Q drug release
The concerns regarding the chemical stability of Q are well documented as it degrades very fast due to an autoxidation reaction in an aqueous medium, and it has slight solubility in water.69 The UV-visible spectra of Q-PVP and Q-PVP-Au are shown in Fig. 4A and B, represent the degradation rates of conjugates as a function of time for obtaining stability profiles. The degradation rate of free Q is shown in Fig. S2.† About 95% free Q degraded within 20 days. In the case of Q-PVP, about 7% Q degraded in three days, and on the 20th day, it degraded about 35%, as shown in Fig. 4C. As a result, in aqueous media, Q-PVP was observed to be more stable for a long time as compared to free Q. Conversely, degradation of Q-PVP-Au is shown in Fig. 4C, which shows only 7% Q degraded in the three days' time, and at the 20th day, it degraded about 30%. Hence, these results suggest that the polymeric Q conjugates show comparatively good physical stability than free Q. The Q-PVP and Q-PVP-Au were stable for up to three months when stored at 4 °C.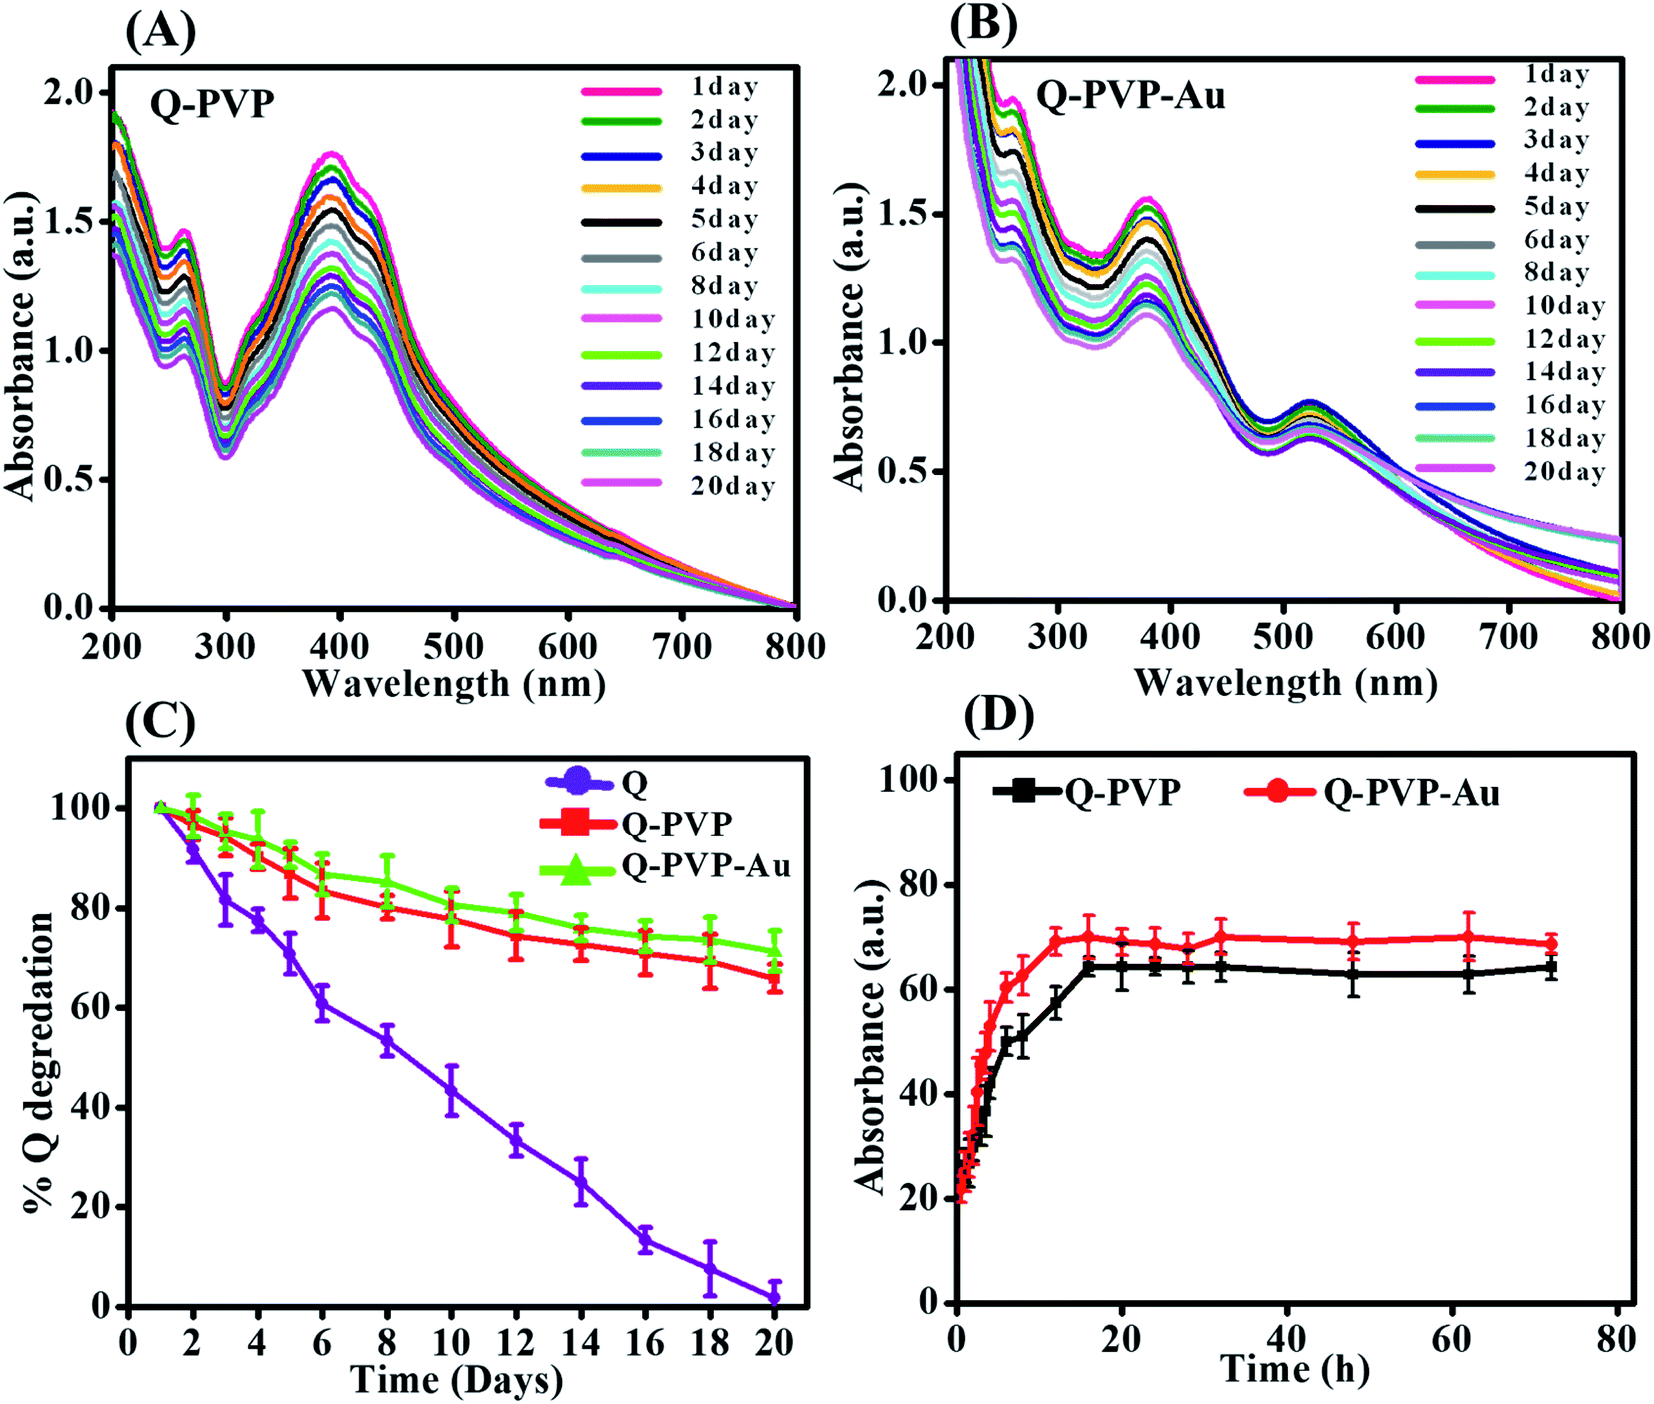 | ||
| Fig. 4 UV-visible spectra as a function of time for (A) Q-PVP; (B) Q-PVP-Au; (C) stability profiles of Q (purple) and Q-PVP (red) and Q-PVP-Au (green) monitored by UV-visible spectroscopy as a function of time; (D) controlled drug release profiles for Q-PVP and Q-PVP-Au at pH 7.4. | ||
The amyloidogenic conditions are not similar to the in vivo amyloidogenesis. In this study the amyloidogenic conditions used were high temperature and acidic pH for inducing the amyloids from HEWL in vitro. On contrary the drug release was studied based on in vivo conditions or physiological conditions with pH 7.4.50,70,71 For controlled drug release of Q, it is essential to enhance the bioavailability of Q. The drug release profiles of conjugates in PBS at pH 7.4 are shown in Fig. 4D. For Q-PVP, 29% of the total drug was released in the first 2 h, and before reaching saturation point, a total of 57% was released in the following 12 h. Conversely, Q-PVP-Au shows 32% of the total drug release in 2 h and 69% released in the following 12 h. Collectively, Q-PVP and Q-PVP-Au show 64% and 70% Q release, respectively, for 72 h. In summary, Q release from conjugates shows rapid and long time drug release for both Q-PVP and Q-PVP-Au, making them desirable for controlled and prolonged drug release applications.
4.3 HEWL aggregate formation
The mutations caused in HEWL protein are the main reason for genetic amyloidosis syndromes.72 The amyloid fibrils that mount up inside due to the protein folding create natural soluble forms and misfold to generate insoluble β-sheet-rich structures.73 We have investigated the formation of HEWL aggregates and the inhibition of aggregation in the presence of Q conjugates. The hydrogen network in the active site of HEWL protein is shattered due to the high temperature and acidic conditions leading to temperature and pH-induced aggregation. So, amyloid fibrillation starts when hydrophobic residues are exposed.74 HEWL protein displays separate globular aggregates with fiber-like morphology. Fig. 5 shows the mature fibrils of HEWL protein with indistinct and dense interlinked structures.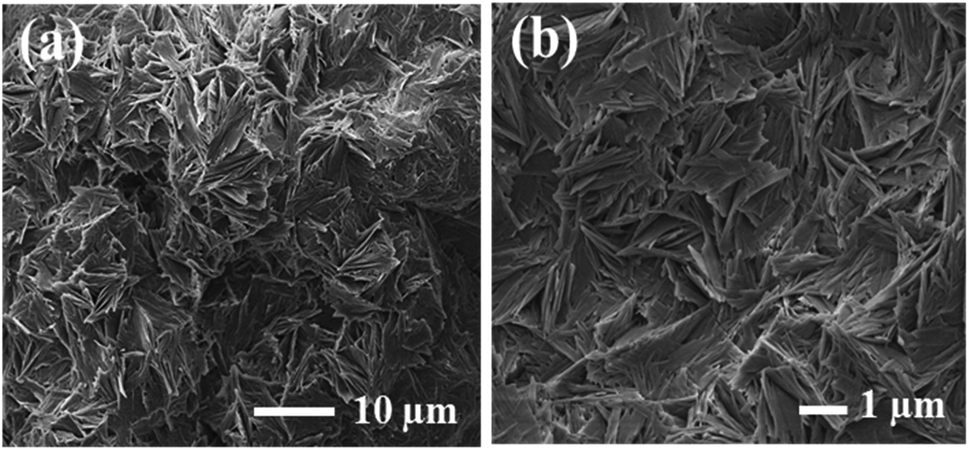 | ||
| Fig. 5 Morphological analysis of the HEWL aggregates. (a and b) FE-SEM images of HEWL aggregates with dense interlinked structure. | ||
4.4 Effect of Q-PVP and Q-PVP-Au conjugates on HEWL aggregation
HEWL amyloid aggregates have broad clinical relevance in the progression of neurodegenerative diseases, and their aggregation characteristics were extensively studied previously to investigate the pathways leading to fibrillation and various inhibition methods.75 The standard procedure for evaluating aggregate formation is a thioflavin T (ThT) fluorescence assay. In the ThT assay, the increased fluorescence of ThT dye is directly associated with the β-sheet formation in the aggregates.76The inhibition effect of Q conjugates on the HEWL aggregates was studied by incubating the HEWL protein with Q-PVP and Q-PVP-Au at different concentrations ranging from 6 μg mL−1 to 22 μg mL−1. Finally, the resulting samples were collected at different time points for photoluminescence studies. The inhibitory effect of Q-PVP and Q-PVP-Au on HEWL aggregation was evaluated by the photoluminescence spectroscopy by monitoring thioflavin T (ThT) fluorescence, as shown in Fig. 6A and B. The ThT fluorescence growth curve showed a continuous increase during the first 12 h and further for 24 h until getting hold of a plateau in the case of Q-PVP. The decrease in the ThT fluorescence intensity corresponds to the inhibition of HEWL aggregation. The aggregation inhibition effect was dose-dependent with various Q-PVP concentrations. When the concentration of Q-PVP was increased to 22 μg mL−1, a nearly full inhibitory effect was observed as shown in Fig. 6A. The aggregation was suppressed by increasing the Q-PVP concentration from 6 μg mL−1 to 22 μg mL−1. For Q-PVP-Au, a similar trend in HEWL aggregation inhibition was also observed (Fig. 6B). Furthermore, both the conjugates inhibited HEWL aggregation in a concentration-dependent manner, and further confirmed by dynamic light scattering measurements.
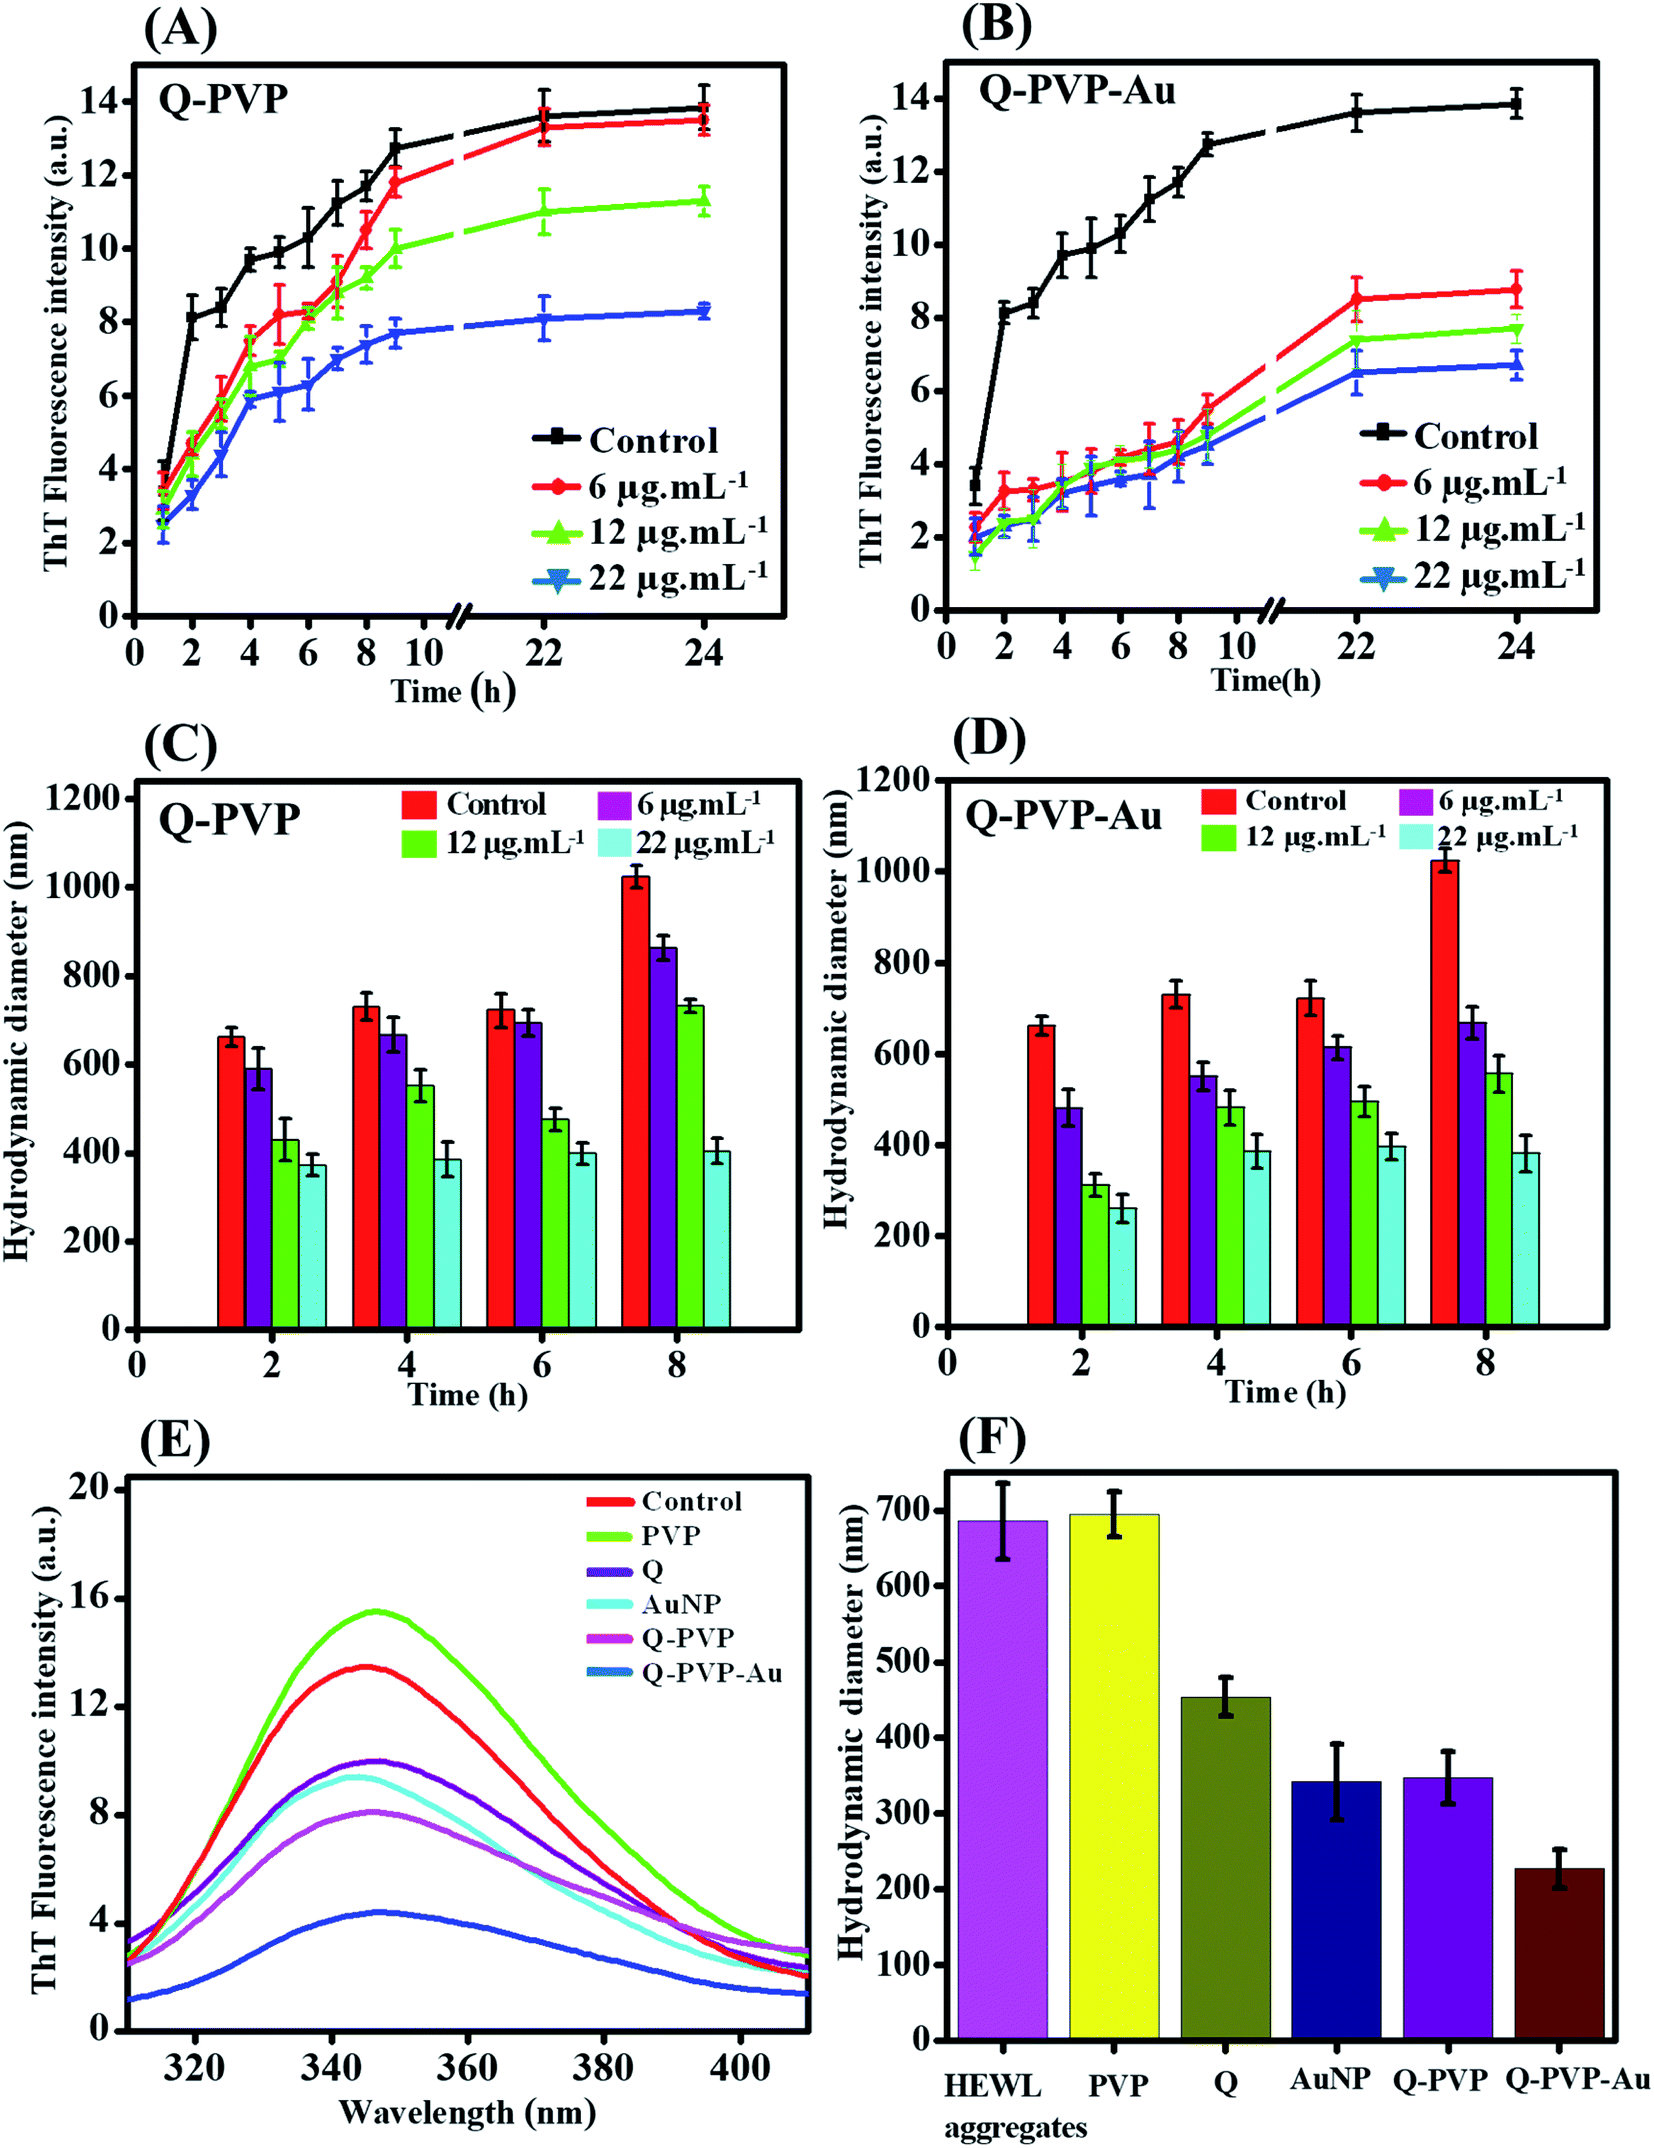 | ||
| Fig. 6 (A) Kinetic profiles of HEWL amyloid fibrils formed alone (control, black curve) and in the presence of different concentration of Q-PVP; (B) effect of Q-PVP-Au on HEWL aggregation measured using Th T assay; (C) effect of Q-PVP and (D) Q-PVP-Au on size of HEWL aggregates measured by DLS; (E) tyrosine fluorescence signal: effect of Q, PVP, AuNP, Q-PVP and Q-PNP-Au on tyrosine fluorescence signal quenching assay and (D) aggregate size measurement by DLS in presence of various nanoparticle. | ||
The DLS was used to monitor the size of HEWL aggregates as a function of time and concentration of conjugates.77,78 The DLS measurements were carried out for the incubated samples at different concentrations to determine the size of the fibrillar aggregates in the presence of conjugates.79,80 Fig. 6C and D show the size of the fibrillar aggregates of HEWL when incubated with conjugates at different concentrations at specific time intervals. The presented numbers clearly show a simultaneous increase in the size of aggregates with respect to the time in the case of HEWL. The average particle size of HEWL aggregates treated with conjugates (Q-PVP and Q-PVP-Au) decreases with an increased concentration of conjugates.
As documented earlier the β-sheet structure is likely to form mature fibrils in HEWL, the secondary structure of HEWL was verified by FT-IR spectroscopy, as shown in Fig. S3.† The peaks around 1632 cm−1 and 1660 cm−1 are characterized by an antiparallel β-sheet structure.81–84 So, in the case of Q-PVP and Q-PVP-Au, the peak at 1632 cm−1 is weakened as compared to control HEWL. These results indicate the expansion of random coil structure, leading to the aggregation inhibition of HEWL by decreasing the β-sheet structure.
The inhibition potential of free Q, PVP, and AuNP with an equivalent dose was also studied for HEWL aggregation as a control experiment along with conjugates. The PL spectra of controls and conjugates are shown in Fig. 6E. The phenomenon demonstrated that Q-PVP and Q-PVP-Au could adsorb HEWL on their surface and reduce Tyr fluorescence. The PL intensity of HEWL for control, Q, PVP, and AuNP was much higher than Q-PVP and Q-PVP-Au. The Q-PVP and Q-PVP-Au presented more pronounced inhibitory effects. Instantaneously, Fig. 6F indicates the DLS studies of HEWL for control, which shows that Q-PVP and Q-PVP-Au inhibit the formation of larger fibrous aggregates compared to Q, PVP and AuNP, which may be attributed to the unique nanorod morphology. It was also observed from Fig. 6F that PVP itself does not show any inhibitory effect in HEWL aggregation.
4.5 Determination of IC50 and DC50 values for HEWL aggregation and dissolution kinetics
The anti-amyloid activity was investigated for Q-PVP and Q-PVP-Au conjugates at different concentrations to quantify the effect of conjugates on HEWL aggregation. It was found that the conjugates dose-dependently inhibit the formation of amyloid fibrils as fluorescence intensity decreases with increasing nanoconjugate concentrations (Fig. 7). The IC50 values were calculated from curves fitting the fluorescence data to measure the inhibitory activity of conjugates presented in Fig. 7A. The IC50 values determined for Q-PVP and Q-PVP-Au are 32 μg mL−1 and 30 μg mL−1, respectively. The lower IC50 value indicates the higher inhibition potential of Q-PVP-Au.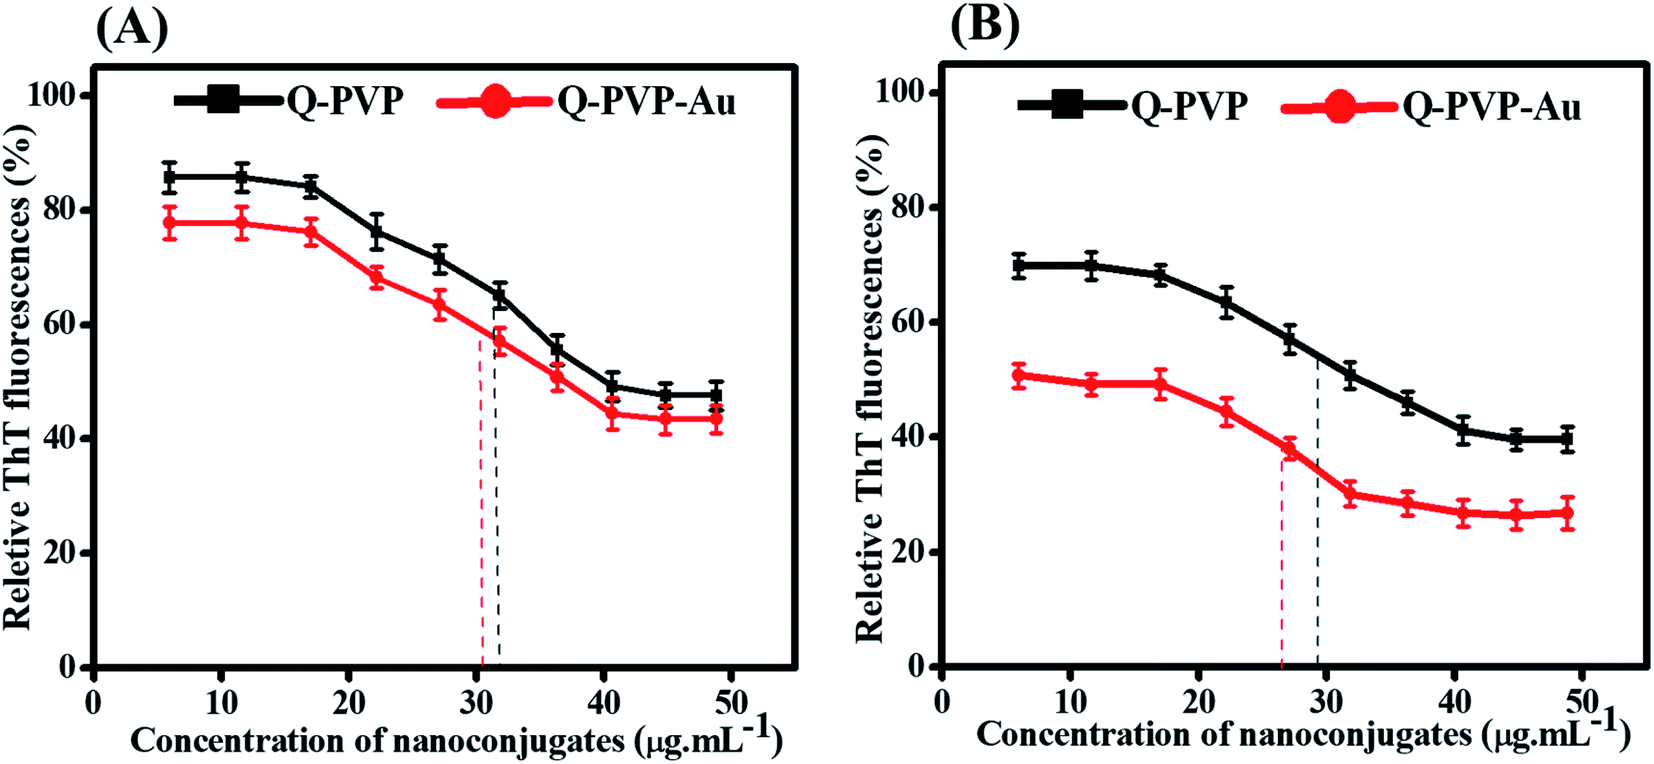 | ||
| Fig. 7 (A) Effect of conjugates Q-PVP and Q-PVP-Au on aggregation kinetics of HEWL (B) Effect of Q-PVP and Q-PVP-Au on the amyloid aggregate dissolution kinetics of HEWL. The measurements were normalized to the intensity of untreated HEWL amyloid fibrils (taken as 100%). | ||
The effect of Q-PVP and Q-PVP-Au conjugates on amyloid dissolution kinetics of HEWL was studied using ThT assay, and the results are presented in Fig. 7B. It was found that the increasing nanoconjugate concentration causes a significant decrease in the fluorescence intensity that suggests the dose-dependent dissolution of HEWL amyloid aggregates. The data obtained were fitted in the eqn S1† to get DC50 values corresponding to the half-maximal ability of conjugates to disintegrate the aggregates. The DC50 values were in the micromolar range. For Q-PVP and Q-PVP-Au DC50 values observed were as 29 μg mL−1 and 27 μg mL−1, respectively. The lowest DC50 values correspond to the highest amyloid aggregate dissociation activity obtained against Q-PVP-Au.
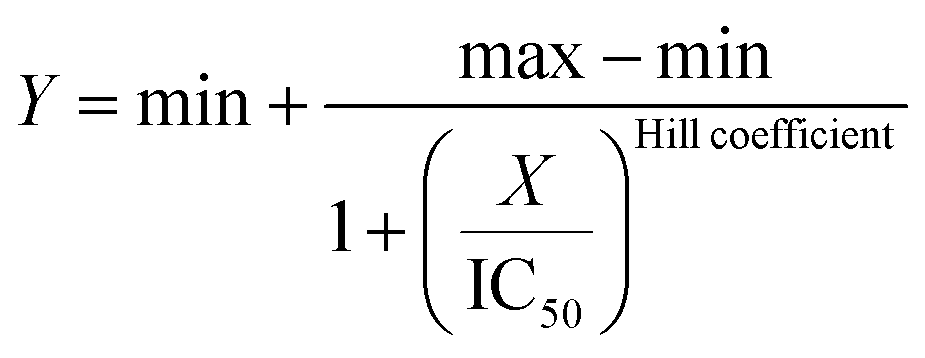
For IC50 and DC50 estimation, a four parameter logistic regression model was used. The calculations were performed using an online tool “Quest GraphTM IC50 Calculator, AAT Bioquest, Inc.” by using eqn (3).85,86 The measurements were normalized to the intensity of untreated HEWL amyloid fibrils (taken as 100%).
 | (3) |
4.6 HEWL aggregation and degradation kinetics by FESEM and AFM
The aggregation kinetics of HEWL was investigated by FESEM and AFM. The aggregation kinetics of HEWL and dissociation kinetics of already formed aggregates were imaged by FESEM, as shown in Fig. 8. Samples containing HEWL alone and in the presence of PVP-Q and PVP-Q-Au nanoparticles were incubated at 65 °C for 24 h, and the SEM images were recorded. The HEWL showed fibrillar aggregates after 24 h, whereas the samples with conjugates did not show much aggregation. We also observed that HEWL incubated with PVP-Q and PVP-Q-Au conjugates exhibited a different morphology than HEWL. These observations suggest that PVP-Q and PVP-Q-Au conjugates interact dynamically with the protein, slowing down the aggregation rate of HEWL.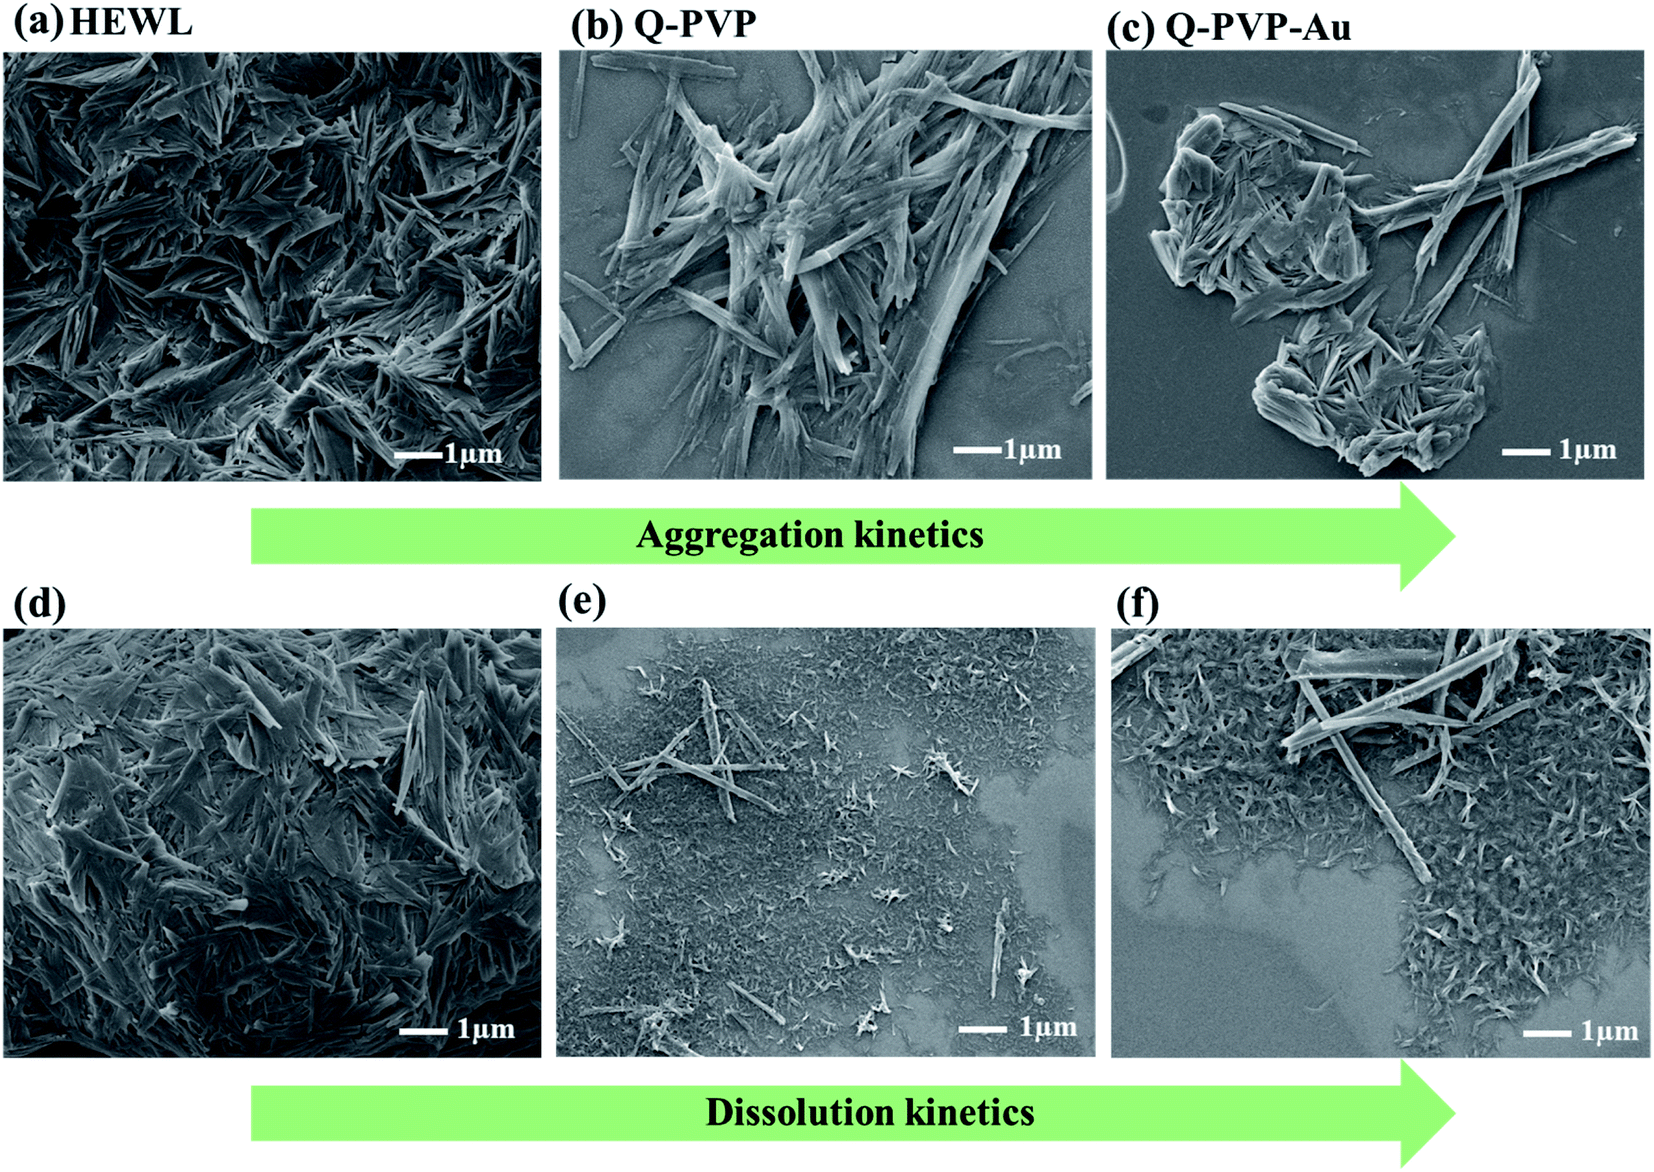 | ||
| Fig. 8 SEM images for HEWL aggregation kinetics: (a) HEWL showing aggregation, whereas (b) HEWL with the Q-PVP and (c) Q-PVP-Au conjugates do not exhibit any aggregation upon incubation at 65 °C for 24 h. (d–f) SEM images for HEWL dissolution kinetics. (d) Already formed aggregates of HEWL were incubated with PVP-Q and PVP-Q-Au conjugates (e and f) at 65 °C for 24 h, and dissolution of the aggregates can be seen in the SEM images. | ||
The effect of these conjugates on already formed amyloid aggregates of HEWL was also investigated. To this end, aggregated HEWL after 24 h was incubated with the PVP-Q and PVP-Q-Au conjugates at 65 °C for 24 h, and the dissolution of the aggregates was monitored by recording SEM images. Fig. 8d–f shows large aggregates of HEWL slowly disintegrating into smaller ones.
Atomic force microscopy (AFM) was used to visualize the effect of Q-PVP-Au in the formation of HEWL amyloid aggregates, as shown in Fig. 9. The diameter of 60 nm and length of a few micrometers was observed for HEWL aggregates (Fig. 9a and b). In the presence of Q-PVP-Au, there was a massive decrease in amyloid aggregate formation, and small globular aggregates were observed. The obtained data indicate that the morphology of the aggregates was changed significantly in the presence of Q-PVP-Au. The observations agree with the results obtained by SEM and ThT assay.
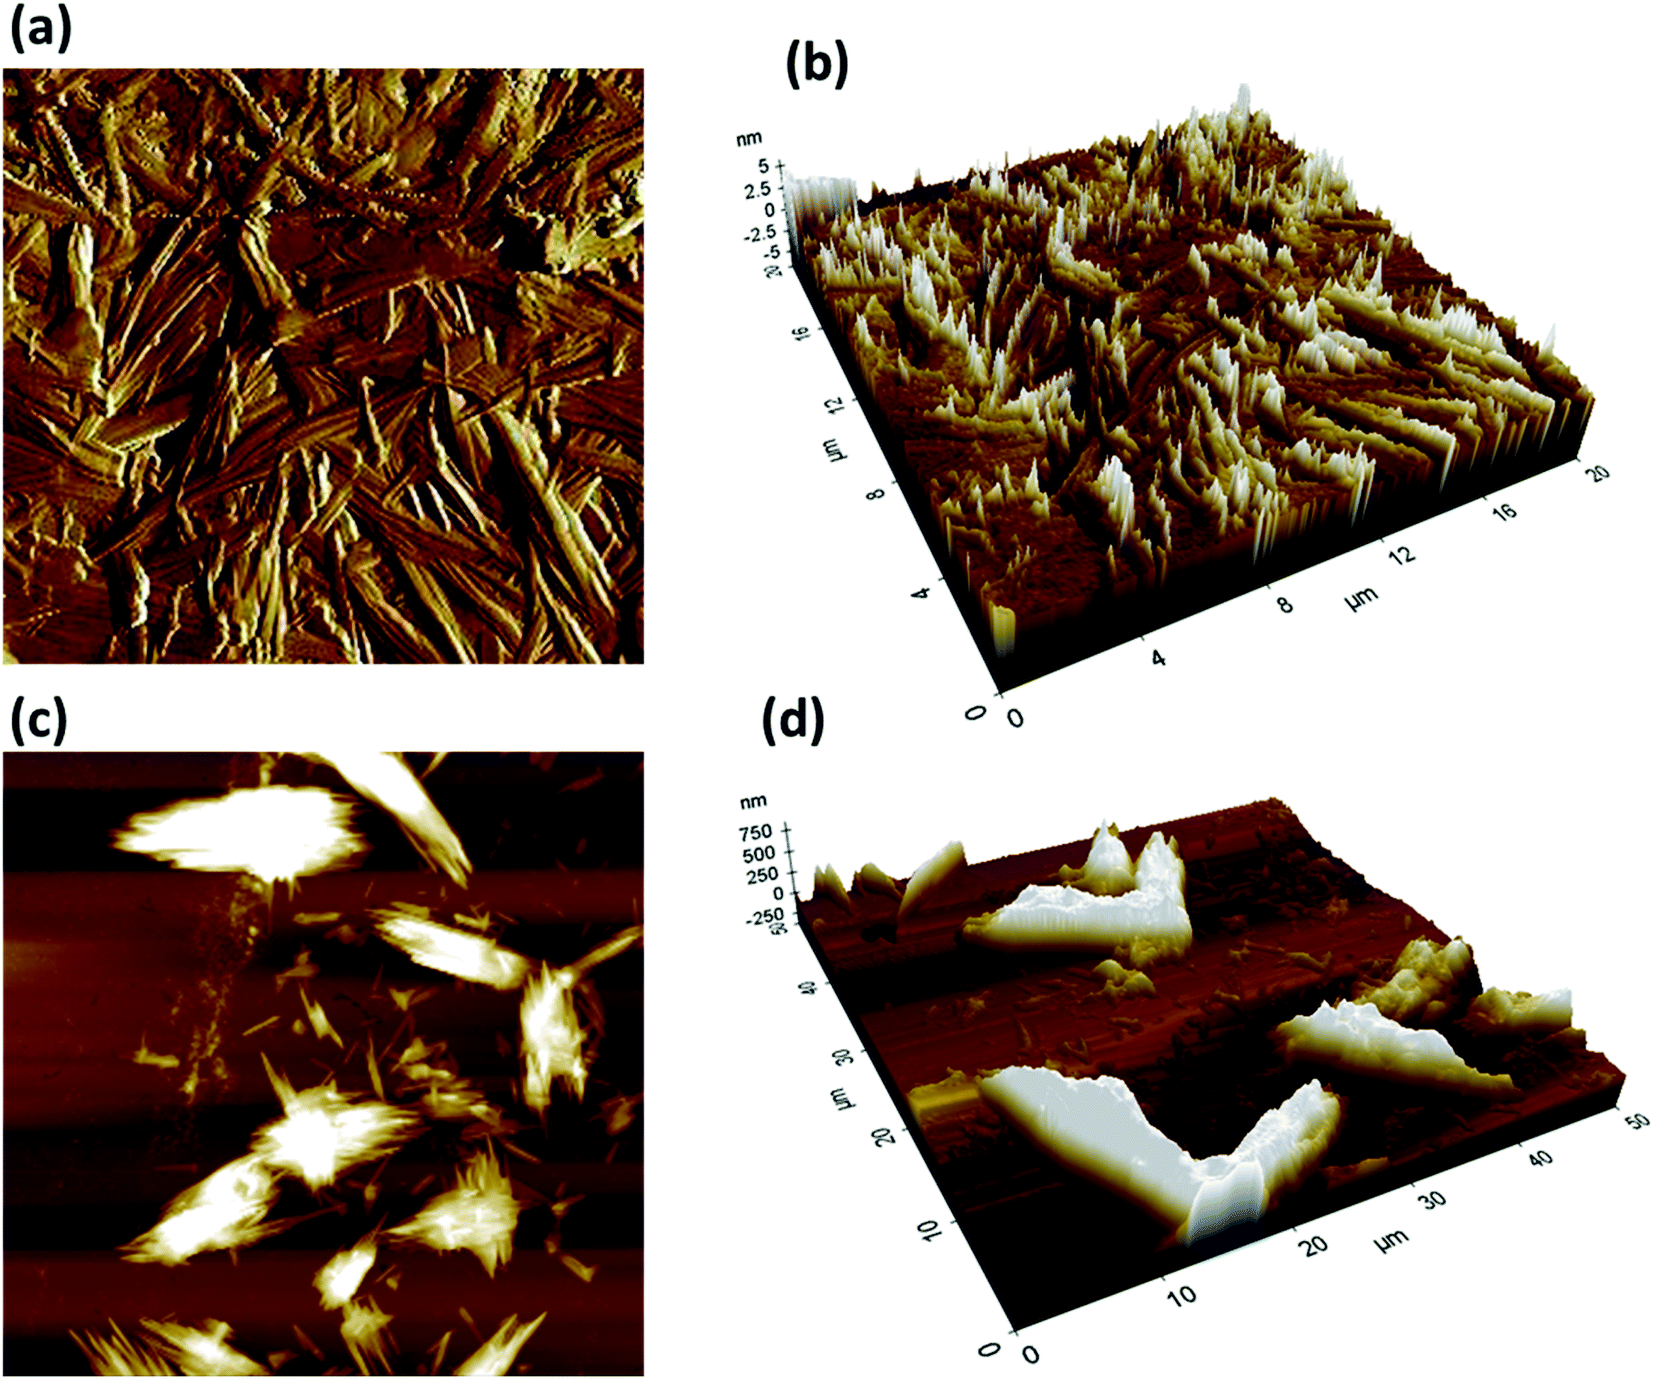 | ||
| Fig. 9 Morphological analysis of the HEWL aggregates. (a and b) AFM images of HEWL aggregates with dense interlinked fibrillar aggregates and (c and d) AFM images of HEWL amyloid aggregation in the presence of Q-PVP-Au. The concentration of conjugates was 22 μg mL−1. | ||
In case of Q-PVP, the inhibitory effect is because of nano Q whereas in the case of Q-PVP-Au, the HEWL aggregation inhibition is attributable to the synergistic effect of nano Q and AuNP. The same observations are shown in Scheme 3. The Q-PVP-Au exhibited the best inhibition efficiency in HEWL aggregation amongst all the nanoparticles, as confirmed by ThT assay, FESEM, and AFM studies (Table 1).
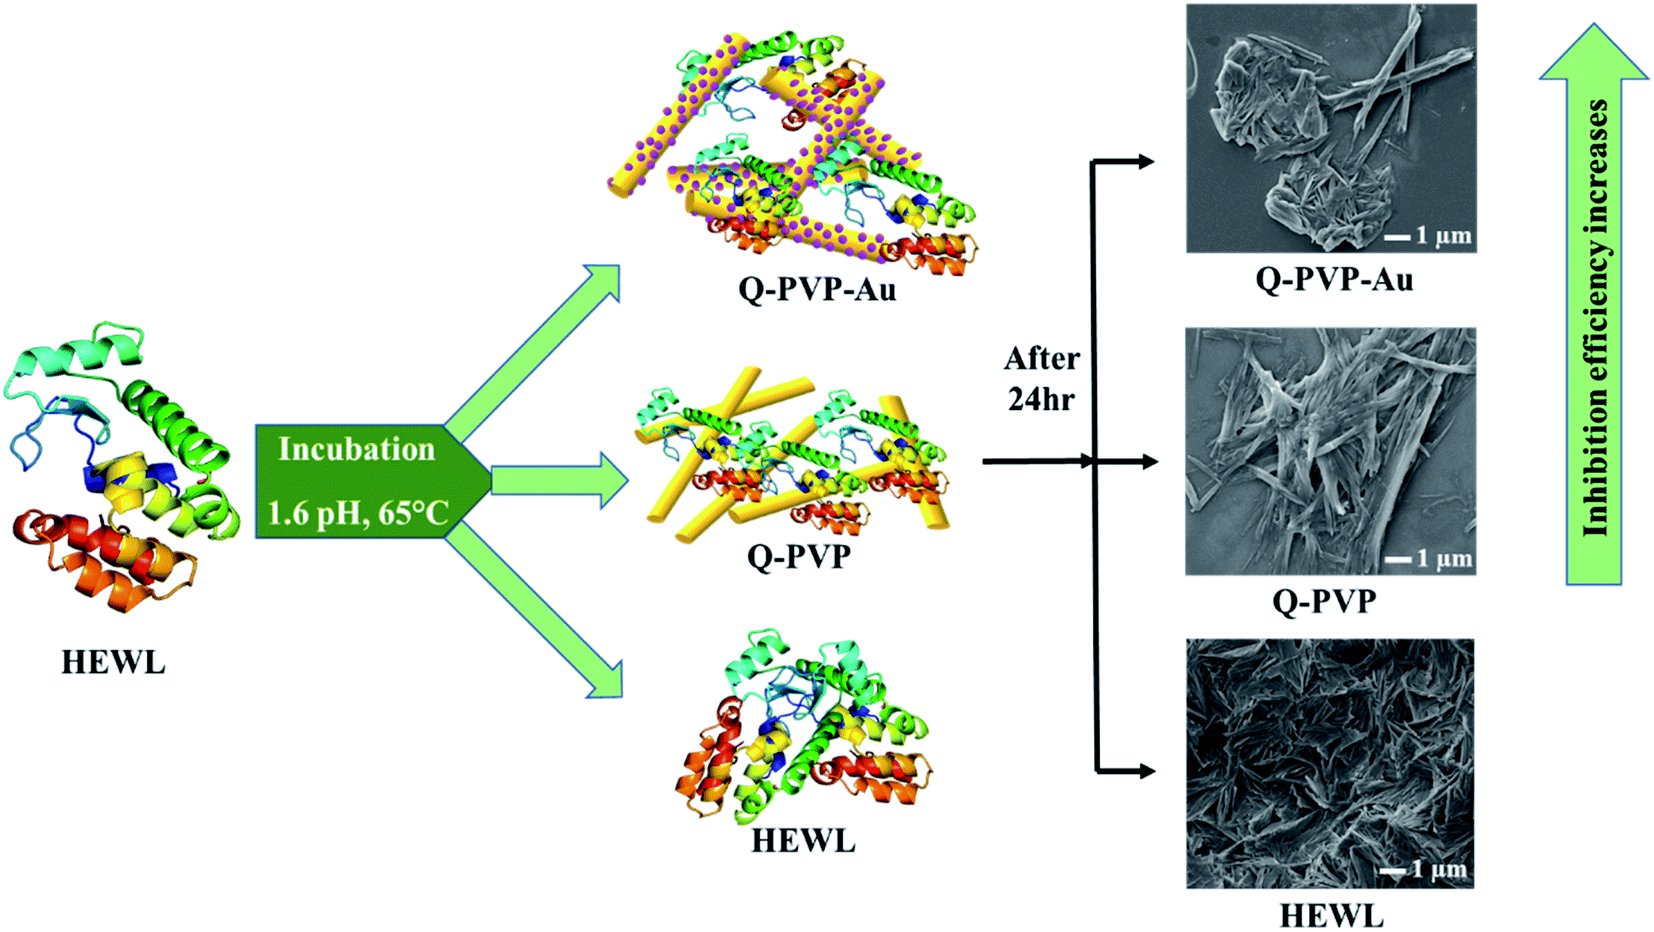 | ||
| Scheme 3 Q-PVP, and Q-PVP-Au conjugates for inhibition of HEWL aggregation. | ||
| NP | Zeta potential (Z) | IC50 | DC50 |
|---|---|---|---|
| Q-PVP | −38.6 | 32 μg mL−1 | 29 μg mL−1 |
| Q-PVP-Au | −26.8 | 30 μg mL−1 | 27 μg mL−1 |
5. Conclusion
In summary, we report novel Q polymeric conjugates (Q-PVP and Q-PVP-Au) with unique morphology. The surface morphological investigations by SEM revealed nanorod assembly with 300–400 nm in diameter and 6–8 μm in length. In the case of Q-PVP-Au, the surface of nanorods was uniformly wrapped by a tiny AuNP of 27 nm in size. Both the conjugates exhibit high stability, drug loading, and prolonged drug release. The applications of amyloid inhibitors in HEWL aggregation kinetics were also investigated. The inhibition of HEWL fibrillation was studied by ThT fluorescence, DLS and FT-IR. ThT fluorescence proposed a considerable reduction in the formation of amyloid aggregates, which was confirmed by field emission scanning electron microscopy and atomic force microscopy. The results showed that Q-PVP and Q-PVP-Au could inhibit HEWL fibrillation kinetics effectively. The control experiments revealed that this efficient inhibition of HEWL fibrillation and degradation of HEWL aggregates is due to nano Q in the case of Q-PVP. Whereas in the case of Q-PVP-Au, the inhibitory effect in HEWL aggregation is due to the synergic effect of nano Q and AuNPs. As confirmed by ThT assay, FESEM, and AFM studies, Q-PVP-Au exhibited the best inhibitory potential. Thus, Q-PVP-Au and Q-PVP demonstrate enhanced bioavailability and stability that may find applications as a potential therapeutic agent towards amyloid-related diseases.Conflicts of interest
There are no conflicts to declare.Author contributions
Conceptualization: Varsha Brahmkhatri; methodology: Pranita Rananaware; formal analysis and investigation: Pranita Rananaware; AFM analysis: Seekha Naik, Monalisa Mishra; writing – original draft preparation: Varsha Brahmkhatri, Pranita Rananaware, Parimal Pandit; writing – review and editing: Pranita Rananaware, Parimal Pandit, Rangappa S. Keri, Varsha P. Brahmkhatri; supervision: Varsha Brahmkhatri.Acknowledgements
We are thankful to Jain University, Bangalore, India and NANOMISSION project (SR/NM/NS-20/2014) for providing facilities. VB also acknowledges TARE-SERB. TAR/2018/000547.References
- M. G. Iadanza, M. P. Jackson, E. W. Hewitt, N. A. Ranson and S. E. Radford, Nat. Rev. Mol. Cell Biol., 2018, 19, 755–773 CrossRef CAS PubMed.
- A. Paul, G. K. Viswanathan, S. Mahapatra, G. Balboni, S. Pacifico, E. Gazit and D. Segal, ACS Chem. Neurosci., 2019, 10, 3510–3520 CrossRef CAS PubMed.
- V. Armiento, A. Spanopoulou and A. Kapurniotu, Angew. Chem., Int. Ed. Engl., 2020, 59, 3372–3384 CrossRef CAS PubMed.
- R. Swaminathan, V. K. Ravi, S. Kumar, M. V. S. Kumar and N. Chandra, in Advances in Protein Chemistry and Structural Biology, ed. R. Donev, Academic Press, 2011, vol. 84, pp. 63–111 Search PubMed.
- D. Ghosh, S. Mehra, S. Sahay, P. K. Singh and S. K. Maji, Int. J. Biol. Macromol., 2017, 100, 37–54 CrossRef CAS PubMed.
- M. Kuragano, R. Yamashita, Y. Chikai, R. Kitamura and K. Tokuraku, Sci. Rep., 2020, 10, 9742 CrossRef CAS PubMed.
- M. Stoppini and V. Bellotti, J. Biol. Chem., 2015, 290, 9951–9958 CrossRef CAS PubMed.
- R. Rajan, S. Ahmed, N. Sharma, N. Kumar, A. Debas and K. Matsumura, Mater. Adv., 2021, 2, 1139–1176 RSC.
- C. S. H. Jesus, H. T. Soares, A. P. Piedade, L. Cortes and C. Serpa, Analyst, 2021, 146, 2383–2391 RSC.
- M. B. Pepys, P. N. Hawkins, D. R. Booth, D. M. Vigushin, G. A. Tennent, A. K. Soutar, N. Totty, O. Nguyen, C. C. F. Blake, C. J. Terry, T. G. Feest, A. M. Zalin and J. J. Hsuan, Nature, 1993, 362, 553–557 CrossRef CAS PubMed.
- A. L. Gharibyan, V. Zamotin, K. Yanamandra, O. S. Moskaleva, B. A. Margulis, I. A. Kostanyan and L. A. Morozova-Roche, J. Mol. Biol., 2007, 365, 1337–1349 CrossRef CAS PubMed.
- K. Al Adem, S. Lukman, T.-Y. Kim and S. Lee, Int. J. Biol. Macromol., 2020, 149, 921–930 CrossRef CAS PubMed.
- F. Yang, G. P. Lim, A. N. Begum, O. J. Ubeda, M. R. Simmons, S. S. Ambegaokar, P. P. Chen, R. Kayed, C. G. Glabe, S. A. Frautschy and G. M. Cole, J. Biol. Chem., 2005, 280, 5892–5901 CrossRef CAS.
- J.-B. Wang, Y.-M. Wang and C.-M. Zeng, Biochem. Biophys. Res. Commun., 2011, 415, 675–679 CrossRef CAS PubMed.
- B. Ma, H. Wang, Y. Liu, F. Wu and X. Zhu, Chem. Phys. Lett., 2021, 779, 138830 CrossRef CAS.
- D. Morshedi, N. Rezaei-Ghaleh, A. Ebrahim-Habibi, S. Ahmadian and M. Nemat-Gorgani, FEBS J., 2007, 274(24), 6415–6425 CrossRef CAS PubMed.
- F. Scialò, D. J. Fernández-Ayala and A. Sanz, Front. Physiol., 2017, 8, 428 CrossRef PubMed.
- R.-Z. Nie, W. Zhu, J.-M. Peng, Z.-Z. Ge and C.-M. Li, Biochimie, 2016, 125, 204–212 CrossRef CAS.
- Y. Qi, P. Yi, T. He, X. Song, Y. Liu, Q. Li, J. Zheng, R. Song, C. Liu, Z. Zhang, W. Peng and Y. Zhang, Colloids Surf., A, 2020, 602, 125058 CrossRef CAS.
- A. V. A. David, R. Arulmoli and S. Parasuraman, Pharmacogn. Rev., 2016, 10, 84 CrossRef CAS PubMed.
- R. V. Patel, B. M. Mistry, S. K. Shinde, R. Syed, V. Singh and H.-S. Shin, Eur. J. Med. Chem., 2018, 155, 889–904 CrossRef CAS.
- P. Elumalai and S. Lakshmi, in The Benefits of Natural Products for Neurodegenerative Diseases, Springer, 2016, pp. 229–245 Search PubMed.
- E. Amanzadeh, A. Esmaeili, S. Rahgozar and M. Nourbakhshnia, Rev. Neurosci., 2019, 30, 555–572 Search PubMed.
- L. G. Costa, J. M. Garrick, P. J. Roquè and C. Pellacani, Oxidative medicine and cellular longevity, 2016, vol. 2016 Search PubMed.
- H. Khan, H. Ullah, M. Aschner, W. S. Cheang and E. K. Akkol, Biomolecules, 2020, 10, 59 CrossRef CAS PubMed.
- H. Derakhshanian, M. Djalali, A. Djazayery, K. Nourijelyani, S. Ghadbeigi, H. Pishva, A. Saedisomeolia, A. Bahremand and A. R. Dehpour, Can. J. Physiol. Pharmacol., 2013, 91, 380–385 CrossRef CAS PubMed.
- H. Yang, J. Liu, M. Wang, L. Wang, L. Zhang and F. Zhang, Trop. J. Pharm. Res., 2020, 19, 277–281 CrossRef CAS.
- S. Salvamani, B. Gunasekaran, N. A. Shaharuddin, S. A. Ahmad and M. Y. Shukor, BioMed Res. Int., 2014, 2014, 480258 Search PubMed.
- B. Sultana and F. Anwar, Food Chem., 2008, 108, 879–884 CrossRef CAS PubMed.
- W. Wang, C. Sun, L. Mao, P. Ma, F. Liu, J. Yang and Y. Gao, Trends Food Sci. Technol., 2016, 56, 21–38 CrossRef CAS.
- T. Sahu, Y. K. Ratre, S. Chauhan, L. V. K. S. Bhaskar, M. P. Nair and H. K. Verma, J. Drug Delivery Sci. Technol., 2021, 63, 102487 CrossRef CAS.
- S. Karmakar, N. Sarkar and L. M. Pandey, Colloids Surf., B, 2019, 174, 401–408 CrossRef CAS.
- N. Alkudaisi, B. A. Russell, D. J. Birch and Y. Chen, J. Photochem. Photobiol., B, 2019, 197, 111540 CrossRef CAS PubMed.
- A. Antosova, M. Gancar, Z. Bednarikova, J. Marek, D. Zahn, S. Dutz and Z. Gazova, Biochim. Biophys. Acta, 2021, 1865, 129941 CrossRef CAS PubMed.
- A. Antosova, M. Gancar, Z. Bednarikova, J. Marek, D. Zahn, S. Dutz and Z. Gazova, Biochim. Biophys. Acta, 2021, 1865, 129941 CrossRef CAS PubMed.
- Y. Liu, J. Sun, Y. Gong, H. Zhou, X. Chen, X. Zhu, Y. Zhao, Y. Wen, X. Qin and J. Liu, ChemNanoMat, 2019, 5, 897–910 CrossRef CAS.
- N. Pradhan, N. R. Jana and N. R. Jana, ACS Appl. Nano Mater., 2018, 1, 1094–1103 CrossRef CAS.
- E. Damian Guerrero, A. M. Lopez-Velazquez, J. Ahlawat and M. Narayan, ACS Appl. Nano Mater., 2021, 4, 2423–2433 CrossRef PubMed.
- M. T. Prabhu and N. Sarkar, Biophys. Chem., 2021, 106714 Search PubMed.
- D. K. Ban, P. Somu and S. Paul, Langmuir, 2018, 34, 15283–15292 CrossRef CAS.
- S. Palmal, N. R. Jana and N. R. Jana, J. Phys. Chem. C, 2014, 118, 21630–21638 CrossRef CAS.
- Y.-X. Yuan, M. Hu, K.-R. Zhang, T.-T. Zhou, S. Wang, M. Liu and Y.-S. Zheng, Mater. Horiz., 2020, 7, 3209–3216 RSC.
- M. Hu, F. Y. Ye, C. Du, W. Wang, W. Yu, M. Liu and Y. S. Zheng, Angew. Chem., 2022, 134, e202115216 Search PubMed.
- M. Konar, A. Mathew and S. Dasgupta, ACS Omega, 2019, 4, 1015–1026 CrossRef CAS PubMed.
- K. Debnath, S. Shekhar, V. Kumar, N. R. Jana and N. R. Jana, ACS Appl. Mater. Interfaces, 2016, 8, 20309–20318 CrossRef CAS.
- K. Debnath, N. R. Jana and N. R. Jana, ACS Biomater. Sci. Eng., 2019, 5, 390–401 CrossRef CAS PubMed.
- E. D. Guerrero, A. M. Lopez-Velazquez, J. Ahlawat and M. Narayan, ACS Appl. Nano Mater., 2021, 4, 2423–2433 CrossRef CAS PubMed.
- D. K. Ban and S. Paul, ACS Appl. Mater. Interfaces, 2016, 8, 31587–31601 CrossRef CAS.
- G. Gao, M. Zhang, D. Gong, R. Chen, X. Hu and T. Sun, Nanoscale, 2017, 9, 4107–4113 RSC.
- V. P. Brahmkhatri, N. Sharma, P. Sunanda, A. D'Souza, S. Raghothama and H. S. Atreya, New J. Chem., 2018, 42, 19881–19892 RSC.
- S.-Y. Ow and D. E. Dunstan, Soft Matter, 2013, 9, 9692–9701 RSC.
- A. Antosova, Z. Bednarikova, M. Koneracka, I. Antal, J. Marek, M. Kubovcikova, V. Zavisova, A. Jurikova and Z. Gazova, Chem.–Eur. J., 2019, 25, 7501–7514 CrossRef CAS.
- A. Zielińska, F. Carreiró, A. M. Oliveira, A. Neves, B. Pires, D. N. Venkatesh, A. Durazzo, M. Lucarini, P. Eder and A. M. Silva, Molecules, 2020, 25, 3731 CrossRef PubMed.
- B. Nagavarma, H. K. Yadav, A. Ayaz, L. Vasudha and H. Shivakumar, Asian J. Pharm. Clin. Res., 2012, 5, 16–23 CAS.
- M. C. Terence, S. B. Faldini, L. F. de Miranda, A. H. M. Júnior and P. J. de Castro, J. Biomed. Nanotechnol., 2011, 7, 446–449 CrossRef CAS PubMed.
- Q. Yang, K. Wang, J. Nie, B. Du and G. Tang, Biomacromolecules, 2014, 15, 2285–2293 CrossRef CAS PubMed.
- S. Niedermayer, V. Weiss, A. Herrmann, A. Schmidt, S. Datz, K. Müller, E. Wagner, T. Bein and C. Bräuchle, Nanoscale, 2015, 7, 7953–7964 RSC.
- A. J. Mieszawska, W. J. Mulder, Z. A. Fayad and D. P. Cormode, Mol. Pharmaceutics, 2013, 10, 831–847 CrossRef CAS PubMed.
- S. Her, D. A. Jaffray and C. Allen, Adv. Drug Delivery Rev., 2017, 109, 84–101 CrossRef CAS PubMed.
- J. A. Kemp, M. S. Shim, C. Y. Heo and Y. J. Kwon, Adv. Drug Delivery Rev., 2016, 98, 3–18 CrossRef CAS PubMed.
- A. J. Trouiller, S. Hebie, F. El Bahhaj, T. W. Napporn and P. Bertrand, Eur. J. Med. Chem., 2015, 99, 92–112 CrossRef CAS PubMed.
- Q. Han, X. Wang, S. Cai, X. Liu, Y. Zhang, L. Yang, C. Wang and R. Yang, J. Mater. Chem. B, 2018, 6, 1387–1393 RSC.
- H. Zhao, J. Chang and L. Du, Comput. Theor. Chem., 2016, 1084, 126–132 CrossRef CAS.
- T. Andrade-Filho, T. Ribeiro and J. Del Nero, Eur. Phys. J. E: Soft Matter Biol. Phys., 2009, 29, 253–259 CrossRef CAS PubMed.
- K. Debnath, N. R. Jana and N. R. Jana, ACS Appl. Bio Mater., 2019, 2, 5298–5305 CrossRef CAS PubMed.
- M. Heneczkowski, M. Kopacz, D. Nowak and A. Kuźniar, Acta Pol. Pharm., 2001, 58, 415–420 CAS.
- I. A. Safo, M. Werheid, C. Dosche and M. Oezaslan, Nanoscale Adv., 2019, 1, 3095–3106 RSC.
- J. W. Hickey, J. L. Santos, J.-M. Williford and H.-Q. Mao, J. Controlled Release, 2015, 219, 536–547 CrossRef CAS PubMed.
- X. Cai, Z. Fang, J. Dou, A. Yu and G. Zhai, Curr. Med. Chem., 2013, 20, 2572–2582 CrossRef CAS PubMed.
- T. Henna, V. Raphey, R. Sankar, V. A. Shirin, H. Gangadharappa and K. Pramod, Int. J. Pharm., 2020, 587, 119701 CrossRef CAS PubMed.
- S. Sathya, B. Shanmuganathan, S. Saranya, S. Vaidevi, K. Ruckmani and K. Pandima Devi, Artif. Cells, Nanomed., Biotechnol., 2018, 46, 1719–1730 CAS.
- M. Faramarzian, S. Bahramikia and M. D. Shasaltaneh, Eur. J. Pharmacol., 2020, 874, 173011 CrossRef CAS PubMed.
- F. Chiti and C. M. Dobson, Annu. Rev. Biochem., 2017, 86, 27–68 CrossRef CAS PubMed.
- E. Frare, M. F. Mossuto, P. P. de Laureto, M. Dumoulin, C. M. Dobson and A. Fontana, J. Mol. Biol., 2006, 361, 551–561 CrossRef CAS PubMed.
- F. G. D. Felice, M. N. Vieira, M. N. Meirelles, L. A. Morozova-Roche, C. M. Dobson and S. T. Ferreira, FASEB J., 2004, 18(10), 1099–1101 CrossRef PubMed.
- K. M. Batzli and B. J. Love, Mater. Sci. Eng., C, 2015, 48, 359–364 CrossRef CAS PubMed.
- T. Allen, Particle size measurement, Springer, 2013 Search PubMed.
- R. Hogg, KONA Powder Part. J., 2008, 26, 81–93 CrossRef.
- R. Hogg, M. Turek and E. Kaya, Part. Sci. Technol., 2004, 22, 355–366 CrossRef CAS.
- H. Chung and R. Hogg, Powder Technol., 1985, 41, 211–216 CrossRef.
- A. Chaari, C. Fahy, A. Chevillot-Biraud and M. Rholam, PLoS One, 2015, 10, e0142095 CrossRef PubMed.
- J. Milošević and R. Prodanović, 2021, 26.
- W. K. Surewicz and H. H. Mantsch, Biochim. Biophys. Acta, Protein Struct., 1988, 952, 115–130 CrossRef CAS.
- A. Sethuraman and G. Belfort, Biophys. J., 2005, 88, 1322–1333 CrossRef CAS PubMed.
- O. D. Cortázar, A. Megía-Macías, S. Moreno, A. Brun and E. Gómez-Casado, Sci. Rep., 2022, 12, 263 CrossRef PubMed.
- L. Y. Zakharova, A. D. Voloshina, M. R. Ibatullina, E. P. Zhiltsova, S. S. Lukashenko, D. A. Kuznetsova, M. P. Kutyreva, A. S. Sapunova, A. A. Kufelkina, N. V. Kulik, O. Kataeva, K. A. Ivshin, A. T. Gubaidullin, V. V. Salnikov, I. R. Nizameev, M. K. Kadirov and O. G. Sinyashin, ACS Omega, 2022, 7, 3073–3082 CrossRef CAS PubMed.
Footnote |
| † Electronic supplementary information (ESI) available. See https://doi.org/10.1039/d2ra03121c |
| This journal is © The Royal Society of Chemistry 2022 |