 Open Access Article
Attenuation of the Bauschinger effect and enhancement of tension–compression asymmetry in single crystal aluminum by temperature
Jinchuan Shena,
Jinjie Zhou *a,
Gang Zhaob,
Caiyun Gongb,
Jingui Yu
 c,
Zhaohui Xia*d and
Fankai Xiana
aSchool of Mechanical Engineering, North University of China, Taiyuan, 030051, P. R. China. E-mail: zhoujinjiechina@126.com
bHubei Key Laboratory of Mechanical Transmission and Manufacturing Engineering, Wuhan University of Science and Technology, Wuhan, 430081, P. R. China
cSchool of Mechanical and Electronic Engineering, Wuhan University of Technology, Wuhan, 430070, P. R. China
dSchool of Mechanical Science and Engineering, Huazhong University of Science and Technology, Wuhan 430074, P. R. China. E-mail: xiaz@hust.edu.cn
First published on 1st August 2022
Abstract
Temperature has a great influence on the mechanical properties of nano-materials. The molecular dynamics method was used to study the effect of temperature on the tension–compression asymmetry and Bauschinger effect of nano single crystal aluminum (NSCA). The strain-hardening behavior of NSCA in the tensile plastic stage is significantly enhanced when the temperature is higher than 400 K. The plastic deformation mechanism of tensile loading shifts from slip blocking of dislocations in grains to dislocation nucleation. The degradation of the mechanical properties of NSCA under compressive loading increases gradually with the increase of temperature. Dislocation emission is limited under compressive loading. Nonetheless, plastic deformation may still be regulated by dislocation slip during severe plastic deformation stages and at elevated temperatures. Temperature enhancement can effectively promote the movement of pre-dislocations and eliminate residual stresses. A new microscopic insight into the temperature attenuated Bauschinger effect is provided. This study provides important theoretical guidance for a comprehensive and in-depth understanding of the high-temperature mechanical properties and microstructure evolution mechanism of NSCA.
1. Introduction
Nano-materials exhibit extraordinary electrical, magnetic, thermal and optical properties.1,2 They have great potential to become a key component in the construction of nanoelectromechanical systems with unprecedented functions.3–8 They will be deformed by external loads during service.9 The presence of residual strain in nanomaterials with reverse loading decreases their yield stress, which is known as the Bauschinger effect. The degradation of the mechanical properties creates uncertainty in engineering applications. This may cause some security issues. This paper studies the loading methods of the Bauschinger effect including tensile and compressive loading. The mechanical response of tensile and compressive loaded materials differs.10,11 The mechanical response and microstructural evolution of unidirectional loading are studied to explore the underlying mechanism of the Bauschinger effect.To evaluate the deformation behavior of nanocrystalline aluminum during service, a large number of researchers have conducted experimental and MD simulation studies. Ahmed12 et al. attributed the extremely high strength of nanocrystalline aluminum to the small grain size and deformation twinning, while high dislocation density in large grains and deformation twinning in small grains are responsible for the good ductility. Rajagopalan13 et al. performed quantitative in situ TEM straining experiments on free-standing gold and aluminum thin films. It was found that the Bauschinger effect is caused by the uneven stress distribution caused by the uneven microstructure. Haouaoui14 et al. studies material deformation by multi-channel iso-angular extrusion method. The boundary of dislocation entanglement and low orientation angle can effectively generate back stress, thereby promoting deformation during reverse strain. However, accurate mechanical properties of nano single crystal aluminum (NSCA) remain a challenge for many existing test and measurement techniques due to their size effects.
Molecular dynamics (MD) simulations can reveal the mechanism of dislocation evolution during deformation of nano-materials.15 Tsuru16 et al. investigated the difference in tension–compression asymmetry between ultrafine crystalline Cu and Al. MD simulations show that the core structure of dislocations related to stacking fault energy in Al is strongly influenced by external stress compared to Cu. Salehinia11 et al. investigated the effect of the presence of orientation and stacking fault tetrahedron on the tension–compression asymmetry of single-crystal copper. The tension–compression asymmetry is usually reduced in the presence of stacking fault tetrahedron (SFT). Dislocation nucleation at the SFT edges is the dominant deformation mechanism under tensile loading. However, SFT decompression and dislocation propagation are the main deformation mechanisms under compressive loading. Yue17 et al. investigated the reversible motion of dislocations caused by pre-dislocation reverse loading. Tsuru18 et al. investigated the effect of dislocation density on the yield strength and plastic deformation of ultrafine crystalline metals. Its Bauschinger effect was found to be due to uneven deformation due to the change in dislocation density between forward and reverse loading. Setoodeh19 et al. found that the Bauschinger effect was highly dependent on the loading level. Larger pre-strain levels lead to higher dislocation density and thus lower yield strength in the opposite direction. Zhu20 et al. investigated the generation, motion, and annihilation processes of defects in single-crystal copper under cyclic loading. Bauschinger effect is weaker in bicrystalline copper than in monocrystalline copper.21 Bernal22 et al. showed that the Bauschinger effect of silver nanowires is caused by the penta-twinned structure and reversible dislocation activity. The above studies show that the microscopic mechanisms that cause the Bauschinger effect in metallic materials are mainly the reverse motion of dislocations, the change of dislocation density, and the inhomogeneous plastic deformation between grains. The tension–compression asymmetry is usually caused by different microscopic mechanisms.
Meanwhile, temperature is one of the important parameters that affect the mechanical properties of nano-materials.23 Potential deformation mechanisms of nano-materials compete at critical temperatures. Sinha24 et al. showed a shift in the deformation behavior of twin boundaries in fcc metals at higher temperatures, where the twin boundaries change from grain boundary migration to twinning mechanisms. Xie25 et al. employed MD simulations to investigate the effects of strain rate and temperature on the plastic deformation mechanism of copper nanowires. Tian26 et al. showed that temperature significantly affects the tension–compression asymmetry of TiAl with nano-polycrystalline. The critical average grain size for HP relationship inversion is very sensitive to temperature.26–28
The reason for the tension–compression asymmetry is the difference in the microscopic deformation mechanism, and the Bauschinger effect is due to the introduction of forwarding loading pre-dislocations and residual stresses.29 The temperature change may lead to a modification of the plastic deformation mechanism. Whether the sensitivity of dislocation slip and twinning to temperature is consistent, and whether the effect of temperature on pre-defects can change the microscopic evolution after stress inversion remains to be further investigated. The effect of temperature on the mechanical properties degradation and microstructure evolution of NSCA under different stress states was investigated. The application scenarios of high temperature nanocrystalline aluminum are guided from a theoretical point of view. This is critical to understanding and avoiding sudden material failures in material design, equipment design, engineering safety, and more. It provides new perspectives for the design of future robust and thermally stable NSCAs.
2. Models and methods
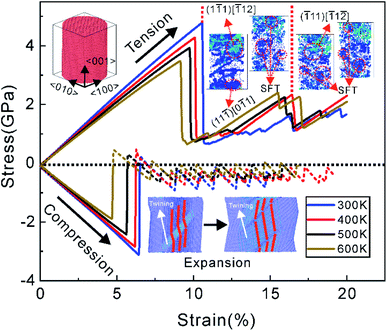
The effects of Bauschinger effect and tension–compression asymmetry in NSCA at temperatures ranging from 300 K to 600 K are carried out. MD simulations are performed using LAMMPS30 with EAM potential function.31 As shown in the upper left corner of Fig. 1, the model specifies 〈100〉 for the X-direction, 〈010〉 for the Y-direction, and 〈001〉 for the Z-direction. The radius of the cylindrical model is 10 nm and the height is 24 nm in Fig. 1. The lattice constant of Al is set to 4.05 Å, and 454![[thin space (1/6-em)]](https://www.rsc.org/images/entities/char_2009.gif) 580 Al atoms are included in the model. The MD simulation is carried out at 300–600 K (ref. 32 and 33) under the NVT ensemble to lower the stress levels before loading, respectively. The initial system uses a conjugate gradient algorithm to minimize energy, followed by bathing in a Nose–Hoover thermostat for 20 ps. All MD simulations performed here have chosen a time step of 1 fs. Samples are uniaxially loaded along the Z axis at a tension/compression rate of 4 × 10⁷ s−1.34–37 The X and Y axis directions are free boundary conditions, and the Z axis direction is periodic boundary conditions.38,39 The average step for the tension–compression asymmetry simulation is 4
580 Al atoms are included in the model. The MD simulation is carried out at 300–600 K (ref. 32 and 33) under the NVT ensemble to lower the stress levels before loading, respectively. The initial system uses a conjugate gradient algorithm to minimize energy, followed by bathing in a Nose–Hoover thermostat for 20 ps. All MD simulations performed here have chosen a time step of 1 fs. Samples are uniaxially loaded along the Z axis at a tension/compression rate of 4 × 10⁷ s−1.34–37 The X and Y axis directions are free boundary conditions, and the Z axis direction is periodic boundary conditions.38,39 The average step for the tension–compression asymmetry simulation is 4![[thin space (1/6-em)]](https://www.rsc.org/images/entities/char_2009.gif) 100
100![[thin space (1/6-em)]](https://www.rsc.org/images/entities/char_2009.gif) 000 steps, and the Bauschinger effect model simulation is 8
000 steps, and the Bauschinger effect model simulation is 8![[thin space (1/6-em)]](https://www.rsc.org/images/entities/char_2009.gif) 000
000![[thin space (1/6-em)]](https://www.rsc.org/images/entities/char_2009.gif) 000 steps, with slight differences in run times of the different temperature models.
000 steps, with slight differences in run times of the different temperature models.
The equivalent stress and strain are calculated based on the von Mises yield criterion. Von Mises stress40–42 is given by the following equation:
 | (1) |
Ovito43 software is used to visualize the microstructural evolution and analyze the mechanical property of the corresponding microstructure. To study the microstructural evolution and mechanical property of the crystal model under different loads, the centro-symmetry parameter (CSP)44,45 can be expressed as:
 | (2) |
3. Results and discussion
3.1 Tension–compression asymmetry
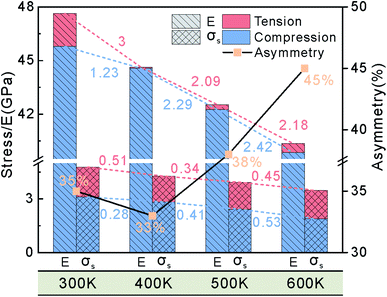
The stress–strain curves of NSCA under tensile and compressive loads are shown in Fig. 1. It is interesting to note that the stress at compressive yielding turns positive. We found that similar phenomenon occurs in the results of some researchers.49,50 The stress–strain curve after compressive yielding is retained as a dashed line. In the initial stage of loading, the stress increases linearly with the strain as an elastic response. The stress–strain curves of NSCA under tensile and compressive loads have no obvious yield stage, which shows a sharp drop after the stress reaches a maximum value. Temperature has a significant effect on the mechanical behavior of NSCA. The yield stress and strain under both loads decrease gradually with increasing temperature. Meanwhile, we found that the yield stress of tensile load is higher than that of compressive load at the same temperature. As the temperature increases, the magnitude of the sharp drop in yield stress gradually decreases. The NSCA enters the plastic stage after yielding, and the stress–strain curve under tensile load exhibits work hardening, while the flow stress under compressive load fluctuates within a level. The strain hardening behavior of NSCA under tensile yielding increases significantly with increasing temperature, while the flow stress under compressive loading decreases with increasing temperature. This shows obvious tension–compression asymmetry at different temperatures.The elastic modulus of the tensile load is greater than that of the compressive load at the same temperature, and the difference between the two is small above the temperature of 400 K in Fig. 2. The elastic modulus decreases with increasing temperature under tensile and compressive loads. The elastic modulus of tensile load varies significantly in the interval of 300–400 K. However, the decrease degree of elastic modulus under compressive load increases gradually, which is more sensitive to temperature. To analyze the influence of temperature on the tension–compression asymmetry, the formula for the tension–compression asymmetry is introduced: (σTf − σCf)/σTf. The calculated tension–compression asymmetry of NSCA at different temperatures is shown as black line in Fig. 2, which shows that the tension–compression asymmetry first decreases and then gradually increases with the increase of temperature. The yield stress difference between compressive loads at adjacent temperatures increases gradually. The effect of temperature on yield stress and elastic modulus is consistent. Combined with the effect of temperature on the elastic modulus and yield stress, it further shows that the compressive load is more sensitive to the increase of temperature. As the temperature increases, we found that the tension–compression asymmetry coefficient first decreases (300–400 K) and then increases (400–600 K).
3.2 Bauschinger effect
The blue line in Fig. 3(a) shows the stress–strain curve of NSCA at 300 K under tension–compression loading. During the initial stage of tensile loading, the stress–strain curve rises linearly. After reaching the tensile yield point A1 (4.57 GPa), the stress drops sharply. The stress reverses after a short period of continued stretching. It does not exhibit a linear relationship between stress and strain during the compression stage. Moreover, the stress value at the compressive yield point B2 (−1.35 GPa) is much lower than the stress value at the uniaxial compressive yield point B1 (−3.18 GPa) at the same temperature. The yield stress and strain at the compressive yield point D2 are larger at 400 K, indicating that the increase in temperature improves the compressive properties. The yield stress and strain at the compressive yield point decrease significantly with increasing temperature, as shown at points F2 and H2 in Fig. 3.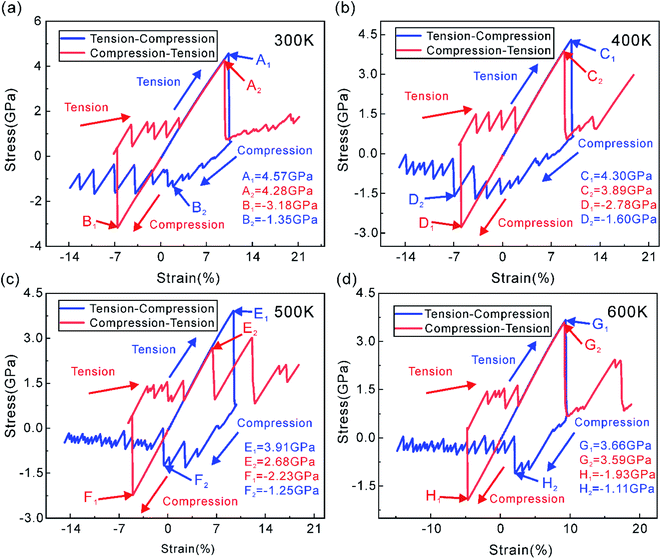 | ||
| Fig. 3 Stress–strain curves of NSCA at 300–600 K under tension–compression load and compression–tension load. (a) 300 K, (b) 400 K, (c) 500 K and (d) 600 K. | ||
The red curve shown in Fig. 3(a) is the stress–strain curve of NSCA under compression–tension load at 300 K. During the initial stage of compression, the stress increases linearly with the strain. After reaching the compressive yield point B1 (−3.18 GPa), the stress drops sharply. NSCA has a distinct elastic phase under tensile loading and is able to reach higher stress levels at the yield point A2 (4.28 GPa). This indicates that the Bauschinger effect under tension–compression and compression–tension loading is asymmetric, which is attributed to the microstructural evolution under different loading methods. From the stress–strain curves of NSCA under compression–tension loading, it can be seen that the Bauschinger effect increases from 300 K to 500 K and decreases at 600 K. Interestingly, two stress peaks appeared under the 500 K tensile load, which may be the effect of temperature on the plastic deformation of NSCA.
The mechanical response of NSCA under tension–compression and compression–tension loading shows asymmetric characteristics.  where σf is the initial forward rheological stress and σr is the reverse yield stress. Due to the tension–compression asymmetry of NSCA, it is difficult for BSP to accurately respond to the influence of temperature on the Bauschinger effect. Therefore, the Bauschinger intensity factor (BIF) for compression–tension and tension–compression loading is defined as
  and
and  Where σT and σC denote the tensile yield stress and compressive yield stress, respectively. σCT represents the tensile yield stress for compression–tension loading and σTC represents the same load. As shown in Table 1, the BIF is calculated for each temperature, and the Bauschinger effect is more pronounced under tension–compression loading. The Bauschinger effect is significantly weakened under tensile and compressive loads at high temperature. The Bauschinger effect first increases and then decreases under compression–tension loading. Temperature not only has an effect on yield stress, but also has a significant effect on yield strain. The compressive yield strain of NSCA increases first and then decreases under tension–compression loading, which is consistent with the effect of temperature on yield stress.
| Temperature (K) | σT (GPa) | σCT (GPa) | BIF (%) | σC (GPa) | σTC (GPa) | BIF (%) |
|---|---|---|---|---|---|---|
| 300 K | 4.57 | 4.28 | 6.35 | −3.18 | −1.35 | 57.55 |
| 400 K | 4.30 | 3.89 | 9.53 | −2.78 | −1.60 | 42.45 |
| 500 K | 3.91 | 2.68 | 31.46 | −2.23 | −1.25 | 43.95 |
| 600 K | 3.66 | 3.59 | 1.91 | −1.93 | −1.11 | 42.49 |
4. Microstructural evolution behavior
4.1 Microstructural evolution behavior under tension–compression asymmetry
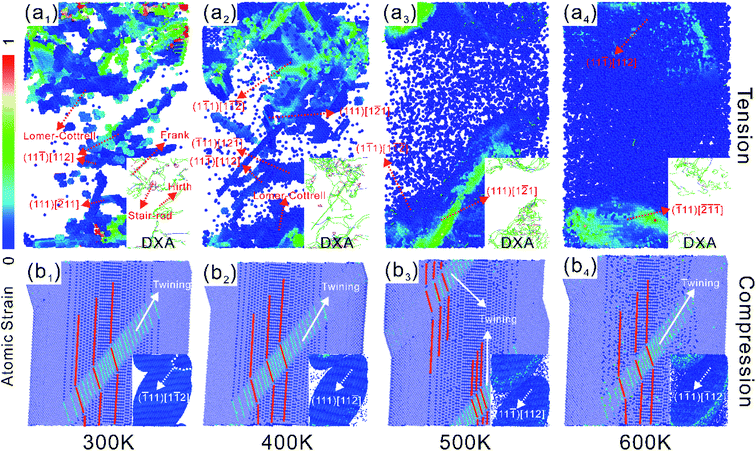
The microstructural features of NSCA at 300–600 K tensile yield are shown in Fig. 4(a1)–(a4). The thermal activation of atoms by temperature is evident in Fig. 4, where the number of point defect atoms is positively related to temperature. The higher the temperature, the more intense the thermal motion of atoms and the easier dislocation slip. The yield stress therefore decreases with increasing temperature. The yielding behavior is dominated by the dislocation burst on the {111} crystal plane under tensile load. After the plastic stage, the strain-strengthening behavior of NSCA increases with the increase of temperature. Dislocation motion within the crystal is hindered by pin dislocations at 300 K, and the strain hardening behavior is flat. In the plastic stage, it is observed that the stress increases linearly with the strain at the temperature of 400–600 K, and the flow stress is significantly higher than that at 300 K. When the sample size is small enough, sliding dislocations leave the crystal faster than they increase, thus reducing the overall dislocation density.51–53 Such a process would result in a dislocation-starved state, requiring very high stress to nucleate new dislocations. Apparently, NSCA reaches dislocation starvation state after undergoing a large strain at 300 K. The plastic deformation is dominated by dislocation slip and intracrystalline blockage in this process. The simulation results54 show that frequent dislocation interactions make dislocation-starved state not easy to achieve. However, the increase in temperature leads to rapid annihilation of mobile dislocations at the boundary and puts the crystal into a dislocation-starved state. As shown in Fig. 1, the microstructural evolution under tensile load at 400 K is divided into two stages. In the first stage, a large number of dislocations exploded in NSCA during tensile yielding. The dislocations rapidly slipped and annihilated at the grain boundaries, while the Lomer–Cottrell dislocations and stacking fault tetrahedra remained unchanged. At this point, the number of dislocations in the crystal is significantly reduced, which will lead to a dislocation-starved state that requires very high stress to nucleate new dislocations. The stress starts to accumulate in the second stage when the stress reaches the critical new dislocation nucleus again. The mobile dislocations then slide toward the grain boundaries again, while the pinned dislocations remain inside the crystal. Therefore, the plastic deformation of NSCA at high temperature is controlled by dislocation nucleation and rapid slip of mobile dislocations, rather than accretion and slip within the crystal based on existing dislocations.Dislocation emission becomes more difficult under compressive loading due to the presence of positive compressive stresses.11,26 Therefore, the plastic deformation is regulated by the slip of dislocations and twins under tensile and compressive loads, respectively. The microstructural evolution of NSCA under compressive yielding at 300–600 K is shown in Fig. 4(b). The yielding behavior of NSCA under compressive loading at all temperatures is regulated in the form of twinning. The compressive yield stress decreases with increasing temperature and is more pronounced than under tensile load. The point defect density was observed to increase with increasing temperature, which is consistent with tensile loading. At compressive yielding at 300 K, steps due to Shockley dislocations appear on twins, indicating that the formation of twins is related to Shockley dislocations (marked with white dashed lines in Fig. 4). The same phenomenon occurs at 400–600 K during twinning. Temperature does not alter the deformation mechanism for twin formation prior to Shockley dislocations, and the continued growth of twins under load. The effect of increasing temperature on tensile load first decreased and then increased, but it was most obvious at 400 K. The effect of temperature on the compressive load increases gradually. The tensile yielding of NSCA is an explosion of dislocation motion dominated by Shockley dislocations, which also contains a variety of pinning dislocations. In contrast, the plastic deformation in compressive yielding is mediated by Shockley dislocations as lead twins. The single-slip system under compressive loading is responsible for the increase in the degree of reduction of the compressive yield stress with increasing temperature.
4.2 Microstructural evolution behavior under Bauschinger effect
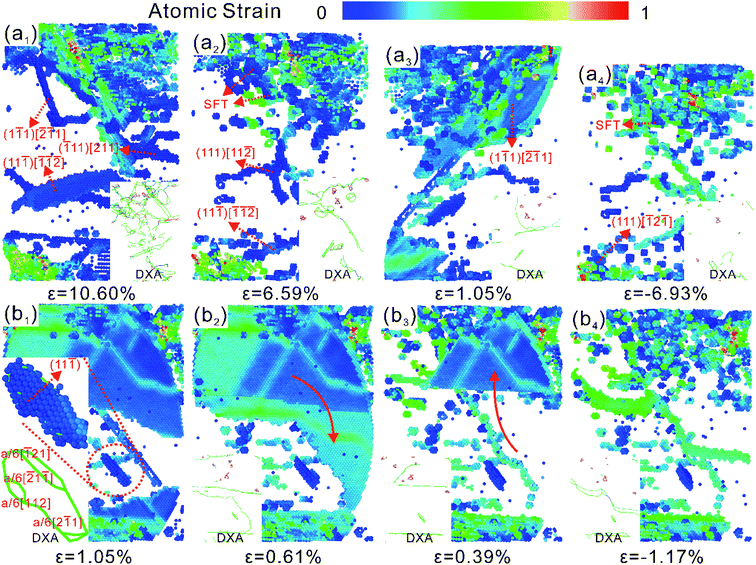
NSCA is consistent with uniaxial stretching in the first stage of yielding. A large number of dislocations appear along the {111} crystal plane, resulting in crystals with mobile and pinned dislocations. When the strain ε = 10.78%, the compressive load is applied in the second stage. Pre-dislocations are subjected to opposing forces at the beginning of loading and move in the opposite direction to the previous one. The reduction in the number of dislocations can be clearly observed in the DXA analysis of Fig. 5(a1)–(a3). Dislocations in pre-dislocations require only a small force to slide under compressive loads, but pinning dislocations hinder dislocation movement. On the one hand, the slip of dislocations releases the stress. On the other hand, the accumulation of dislocations caused by pinning dislocations allows the stress to increase. Therefore, the stress–strain curves show a fluctuating trend in the elastic phase at the onset of compression under tension–compression loading in Fig. 3. The presence of pre-dislocations in the crystal makes it easier to initiate the slip system. Therefore, 300 K NSCA exhibits a significant Bauschinger effect under tension–compression loading, with a BIF of 58.18%. Plastic deformation under unidirectional compressive loading is regulated in the form of twin expansion during compressive yielding. Therefore, in the second stage, we set the maximum stress at which twinning occurs as the yield stress. Twining was observed at ε = 1.05% by the visualization software, but distinct from large-area twinning under uniaxial compression. For the microstructural evolution of twinning disappearance, the visualization shows that twinning exists only between strains ε = 1.05–1.17%, as shown in Fig. 5(b1)–(b4). It can be observed that the twins expand downward under pressure, tending to form twinning through the crystal. However, the enlargement process is hindered by the (11![[1 with combining macron]](https://www.rsc.org/images/entities/char_0031_0304.gif) ) stacking fault, as shown by the dashed line in Fig. 5(b1). Although dislocations within stacking faults are mobile dislocations, the forces exerted on them were found to be small and insufficient to cause them to slip. After that, the twin crystals gradually decreased until they disappeared. The plastic deformation after twin disappearance is controlled by the slip and plugging of dislocations, corresponding to fluctuations on the stress–strain curve.
) stacking fault, as shown by the dashed line in Fig. 5(b1). Although dislocations within stacking faults are mobile dislocations, the forces exerted on them were found to be small and insufficient to cause them to slip. After that, the twin crystals gradually decreased until they disappeared. The plastic deformation after twin disappearance is controlled by the slip and plugging of dislocations, corresponding to fluctuations on the stress–strain curve.
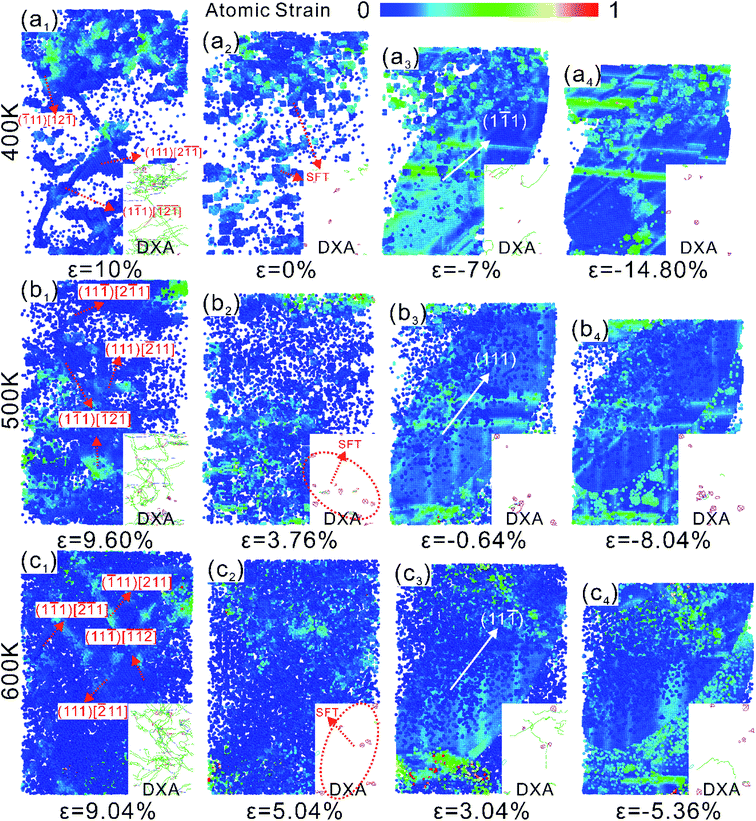
Fig. 6(a1), (b1) and (c1) shows the microstructural evolution of NSCA during the first-stage yielding under tension–compression loading. A large number of Shockley dislocation bursts lead to the yielding behavior of NSCA. A compressive load is applied to the crystal to reverse the motion of these dislocations. Large-area twinning appears in compressive yielding at 400–600 K, as shown in Fig. 6(a3), (b3) and (c3). Unlike twins that appear briefly and then disappear at 300 K, twins expand gradually with increasing strain at high temperature. This is because the increase of temperature increases the energy of the system, which promotes the slip of dislocations in the stacking fault. The lack of stacking faults within the crystal hinders the formation of large-area twinning during compressive yielding. Therefore, the compressive mechanical response of NSCA at 400 K is enhanced. Compressive loading is temperature-sensitive, and higher system energies facilitate easier dislocation nucleation and slip while reducing mechanical properties. The compressive yield stress and strain decrease significantly with increasing temperature.
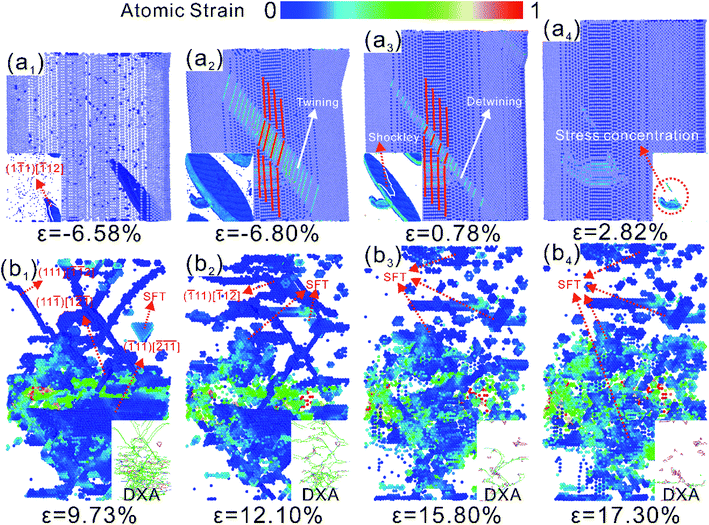
The compressive yield ε = −6.58% in the first stage of NSCA, and stacking faults dominated by Shockley dislocations emanate from the crystal edges. Twins are formed with increasing strain, as shown in Fig. 7(a1) and (a2). When the strain ε = −7.18%, the twinning zone gradually decreases until it disappears under the reverse force. Fig. 7(a2)–(a4) shows the process of twin disappearance. The presence of Shockley dislocation steps on the twin surface was observed in NSCA at strain ε = 0.78%, indicating that the detwining process is also dominated by Shockley dislocations. The stress–strain curve fluctuates during detwining, which is the result of dislocation and twinning competition. The activity of Shockley dislocations leads to a decrease in stress, while the presence of twinning increases the stress. At strain ε = 2.82%, twinning completely disappears in NSCA. As the loading progresses, the stress of NSCA increases linearly with the strain, and the stress–strain curve exhibits an elastic response. A large number of dislocations cause the crystal to yield at ε = 9.73%, and the dislocations are concentrated in the middle of the crystal (Fig. 7(b1)). As loading continues, mobile dislocations slide to grain boundaries and annihilate. Due to the hindering effect of pinning dislocations on dislocation slip in the crystal, NSCA enters the stage of strain hardening.
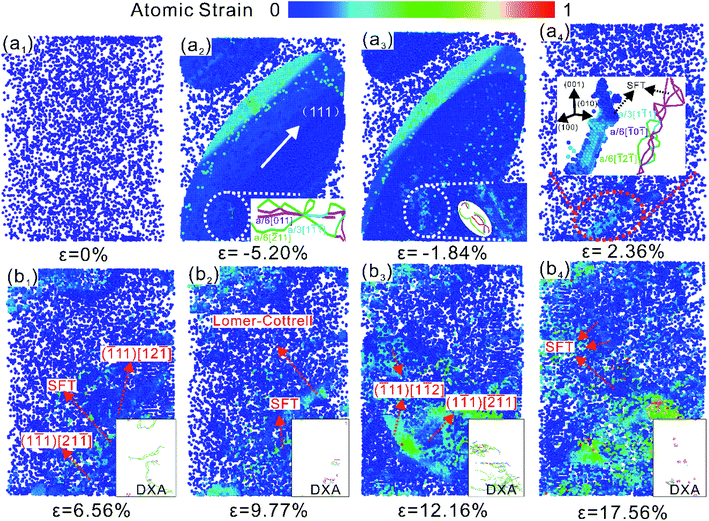
NSCA shows two stress peaks in the second stage of compression–tension loading at 500 K. The microstructural evolution of NSCA under 500 K compression–tension loading was analyzed in Fig. 8. The initial state of NSCA is shown in Fig. 8(a1) ε = 0%, and the atoms remain at 4 < CSP < 11. Twining occurs during compression in Fig. 8(a2), using dashed circles and giving the dislocation structure. Stacking faults are formed by the intersection of a/6 [2![[1 with combining macron]](https://www.rsc.org/images/entities/char_0031_0304.gif) 1], a/6 [011] and a/3 [11
1], a/6 [011] and a/3 [11![[1 with combining macron]](https://www.rsc.org/images/entities/char_0031_0304.gif) ]. The compressive mechanical properties of single-crystal Al were simulated by Xu54 et al. It is also shown that plastic deformation in high symmetry orientations is first controlled by dislocation slip and then turns to twinning. NSCA undergoes detwining under subsequent tensile loading, with stacking faults appearing outside the twin at strain ε = −1.84%. The twinning region growth and detwining dominated by Shockley dislocations are easier than the movement of pinning dislocations, which persist until the twinning disappears. As shown in Fig. 8(a4), the stacking fault gradually forms a more stable stacking fault tetrahedral structure under the action of the force. As shown in Fig. 8(b1) ε = 6.56%, intragranular Shockley dislocations act as core-emitting dislocations causing the first stress drop. The Shockley dislocation moves rapidly to the crystal surface. While it is formed a small amount of stacking fault tetrahedra inside the crystal. The stress increases linearly with the strain, again exhibiting an elastic response. When the strain of NSCA is ε = 12.16%, there are more dislocation outbreaks than the first time, and the degree of stress reduction is greater than that of the first time. The slippage of mobile dislocations leads to a greater degree of plastic deformation. As shown by the DXA analysis in Fig. 8(b1)–(b4), after the dislocation burst, the mobile dislocations are rapidly annihilated at the crystal surface, and the pinned dislocations remain inside the crystal. This process puts NSCA into a state of dislocation-starvation and leads to strain hardening.
]. The compressive mechanical properties of single-crystal Al were simulated by Xu54 et al. It is also shown that plastic deformation in high symmetry orientations is first controlled by dislocation slip and then turns to twinning. NSCA undergoes detwining under subsequent tensile loading, with stacking faults appearing outside the twin at strain ε = −1.84%. The twinning region growth and detwining dominated by Shockley dislocations are easier than the movement of pinning dislocations, which persist until the twinning disappears. As shown in Fig. 8(a4), the stacking fault gradually forms a more stable stacking fault tetrahedral structure under the action of the force. As shown in Fig. 8(b1) ε = 6.56%, intragranular Shockley dislocations act as core-emitting dislocations causing the first stress drop. The Shockley dislocation moves rapidly to the crystal surface. While it is formed a small amount of stacking fault tetrahedra inside the crystal. The stress increases linearly with the strain, again exhibiting an elastic response. When the strain of NSCA is ε = 12.16%, there are more dislocation outbreaks than the first time, and the degree of stress reduction is greater than that of the first time. The slippage of mobile dislocations leads to a greater degree of plastic deformation. As shown by the DXA analysis in Fig. 8(b1)–(b4), after the dislocation burst, the mobile dislocations are rapidly annihilated at the crystal surface, and the pinned dislocations remain inside the crystal. This process puts NSCA into a state of dislocation-starvation and leads to strain hardening.
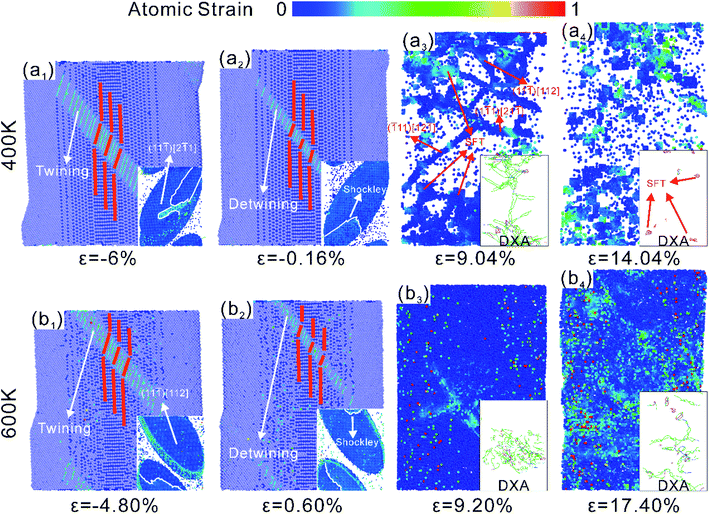
Fig. 9 shows the microstructural evolution of NSCA subjected to compression–tension loads at 400 K and 600 K, respectively. The compressive yielding at both temperatures is a twin-regulated plastic deformation. The plastic deformation is also regulated by detwining during tensile loading. As mentioned earlier, there are no defects in the crystal after twin disappearance, but stress concentration regions appear. A larger area of stress concentration was left at 400 K, and there was no stress concentration in the crystal at 600 K. The abnormal yielding at 500 K is due to the presence of pre-dislocations that cause the crystal to yield prematurely. Therefore, the Bauschinger effect of compression–tension loads first increases and then decreases with increasing temperature. The high temperature activates the thermal motion of atoms, which promotes easy slippage of dislocations. When the temperature is sufficient, the residual stress in the crystal can be eliminated. As shown in the compression–tension loading stress–strain curves in Fig. 3(b) and (d), the tensile-plastic phase of NSCA exhibits the same linear trend at 400 K and 600 K. After yielding, the crystal at 400 K no longer nucleated, and the intragranular dislocation density decreased significantly (Fig. 9(a4)). Dislocations re-emit after yielding at 600 K, as shown in Fig. 9(b4). A slow strain hardening phenomenon is exhibited at 300 K, which indicates that the linear rise of the stress–strain curve is related to the dislocation-starvation state of the crystal. The slow dislocation motion and the hindrance of pinned dislocations are responsible for the strain hardening. The increase in temperature accelerates the slip of mobile dislocations. The crystal enters a dislocation-starvation state, causing the stress to rise linearly with strain.
5. Conclusion
The effect of temperature on the tension–compression asymmetry and Bauschinger effect of NSCA was investigated by molecular dynamics method, and the corresponding microstructure evolution behavior at different temperatures. The study found that the thermal activation effect of temperature on atoms is obvious, and the number of point defect atoms is positively correlated with temperature. The yield behavior under tensile and compressive loads decreases gradually with increasing temperature. The mechanical properties under tensile load decreased the most at 400 K, while the mechanical properties under compressive load decreased gradually with the increase of temperature, and the compressive load was more sensitive to temperature. Twin crystals are usually microstructures of reinforced crystals. However, it is the way twins are formed that makes the yield stress decrease most significantly by temperature. At the meantime, the effect of increasing temperature on the plastic phase of NSCA is inconsistent. The strain strengthening of the material is evident under tensile loading, while the flow stress gradually decreases under compressive loading. The plastic deformation of NSCA at high temperature is controlled by dislocation nucleation and rapid slip of mobile dislocations, rather than based on the diffusion and slip of existing dislocations within the crystal. The faster movement of dislocations towards the crystal surface at high temperature significantly enhances the strain hardening behavior of NSCA. It serves as a valuable guide to study the temperature effect on the mechanical properties and microscopic evolution mechanism of NSCA.The BIF of NSCA under tension–compression loading is more than 5 times that of compression–tension loading, indicating that the mechanical properties are significantly softened after pre-tension and compression loads. The Bauschinger effect under tension–compression loading is significantly weakened at high temperature. The increase in temperature activates the motion of pre-dislocations, which decreases the density of pre-dislocations within the crystal. During reverse loading, the possibility of pre-locations is reduced for nuclear re-proliferation. NSCA modulates plastic deformation in the form of twinning when yielding to compressive loading, while detwining occurs when tensile loading is applied. Although it is possible to restore NSCA to a defect-free state, it leaves stress concentrations within the crystal. Larger stress concentration regions within the crystal remain at 400 K. Thermal motion of atoms removes residual stress within the 600 K crystal. Interestingly, NSCA exhibits pinning dislocations in twins during precompression, yielding under compression–tensile loading of 500 K. This suggests that the elevated temperature causes twinning and dislocation slip compete with each other under compressive loading, but the motion of twinning is more dominant. The presence of intragranular pre-dislocations makes the BIF reach 31.46%. The elevated temperature can effectively promote the movement of predislocations and eliminate residual stress. Provides new microscopic insights into the Bauschinger effect of temperature decay.
Conflicts of interest
There are no conflicts to declare.Acknowledgements
This study was financially supported by the National Natural Science Foundation of China under Grant No. 62071433, the Program for the Top Young and Middle-aged Innovative Talents of Higher Learning Institutions of Shanxi Province under Grant No. 1810200037MZ and the Open Fund of Hubei Key Laboratory of Mechanical Transmission and Manufacturing Engineering at Wuhan University of Science and Technology (MTMEOF2021B05).References
- H. Asgharzadeh and H. J. McQueen, Mater. Sci. Technol., 2015, 31, 1016–1034 CrossRef CAS.
- M. Dao, L. Lu, R. J. Asaro, J. T. M. De Hosson and E. Ma, Acta Mater., 2007, 55, 4041–4065 CrossRef CAS.
- Y. Cui, Q. Q. Wei, H. K. Park and C. M. Lieber, Science, 2001, 293, 1289–1292 CrossRef CAS PubMed.
- Y. Cui, Z. H. Zhong, D. L. Wang, W. U. Wang and C. M. Lieber, Nano Lett., 2003, 3, 149–152 CrossRef CAS.
- X. F. Duan, Y. Huang, Y. Cui, J. F. Wang and C. M. Lieber, Nature, 2001, 409, 66–69 CrossRef CAS PubMed.
- J. Hahm and C. M. Lieber, Nano Lett., 2004, 4, 51–54 CrossRef CAS.
- Y. Huang, X. F. Duan and C. M. Lieber, Small, 2005, 1, 142–147 CrossRef CAS PubMed.
- H. J. Joyce, Q. Gao, H. H. Tan, C. Jagadish, Y. Kim, J. Zou, L. M. Smith, H. E. Jackson, J. M. Yarrison-Rice, P. Parkinson and M. B. Johnston, Prog. Quantum Electron., 2011, 35, 23–75 CrossRef.
- Y. J. Chen, X. H. An and X. Z. Liao, Appl. Phys. Rev., 2017, 4, 031104 Search PubMed.
- C. Dong, J. Yu, L. Xu, Z. Xia and Q. Zhang, Mater. Express, 2020, 10, 165–176 CrossRef CAS.
- I. Salehinia and D. F. Bahr, Int. J. Plast., 2014, 52, 133–146 CrossRef CAS.
- S. I. Ahmed, K. A. Mkhoyan and K. M. Youssef, Mater. Sci. Eng., A, 2020, 777, 139069 CrossRef CAS.
- J. Rajagopalan, C. Rentenberger, H. P. Karnthaler, G. Dehm and M. T. A. Saif, Acta Mater., 2010, 58, 4772–4782 CrossRef CAS.
- M. Haouaoui, I. Karaman and H. J. Maier, Acta Mater., 2006, 54, 5477–5488 CrossRef CAS.
- V. Yamakov, D. Wolf, S. R. Phillpot, A. K. Mukherjee and H. Gleiter, Nat. Mater., 2002, 1, 45–48 CrossRef CAS PubMed.
- T. Tsuru, Phys. Rev. Mater., 2017, 1, 033604 CrossRef.
- L. Yue, H. Zhang and D. Y. Li, Scr. Mater., 2010, 63, 1116–1119 CrossRef CAS.
- T. Tsuru, Y. Aoyagi, Y. Kaji and T. Shimokawa, Modell. Simul. Mater. Sci. Eng., 2016, 24, 035010 CrossRef.
- A. R. Setoodeh and H. Attariani, Mater. Lett., 2008, 62, 4266–4268 CrossRef CAS.
- D. Zhu, H. Zhang and D. Y. Li, J. Appl. Phys., 2011, 110, 124911 CrossRef.
- D. Zhu, H. Zhang and D. Y. Li, Metall. Mater. Trans. A, 2013, 44, 4207–4217 CrossRef CAS.
- R. A. Bernal, A. Aghaei, S. Lee, S. Ryu, K. Sohn, J. X. Huang, W. Cai and H. Espinosa, Nano Lett., 2015, 15, 139–146 CrossRef CAS PubMed.
- I. Sabirov, M. Y. Murashkin and R. Z. Valiev, Mater. Sci. Eng., A, 2013, 560, 1–24 CrossRef CAS.
- T. Sinha and Y. Kulkarni, J. Appl. Phys., 2011, 109, 114315 CrossRef.
- H. X. Xie, F. X. Yin, T. Yu, G. H. Lu and Y. G. Zhang, Acta Mater., 2015, 85, 191–198 CrossRef CAS.
- Y. Tian, J. Ding, X. Huang, H. R. Zheng, K. Song, S. Q. Lu and X. G. Zeng, Comput. Mater. Sci., 2020, 171, 109218 CrossRef CAS.
- J. J. Li, B. B. Lu, H. J. Zhou, C. Y. Tian, Y. H. Xian, G. M. Hu and R. Xia, Phys. Lett. A, 2019, 383, 1922–1928 CrossRef CAS.
- J. G. Yu, Q. X. Zhang and Z. F. Yue, RSC Adv., 2014, 4, 20789–20796 RSC.
- J. Zhou, J. Shen, F. A. Essa and J. Yu, J. Mater. Res. Technol., 2022, 18, 15–28 CrossRef CAS.
- S. Plimpton, J. Comput. Phys., 1995, 117, 1–19 CrossRef CAS.
- Y. Mishin and D. Farkas, Phys. Rev. B: Condens. Matter Mater. Phys., 1999, 59, 3393–3407 CrossRef CAS.
- M. A. Haque and M. T. A. Saif, Thin Solid Films, 2005, 484, 364–368 CrossRef CAS.
- Q. Li, J. Cho, S. Xue, X. Sun, Y. Zhang, Z. Shang, H. Wang and X. Zhang, Acta Mater., 2019, 165, 142–152 CrossRef CAS.
- C. Dong, J. G. Yu, L. Xu, Z. H. Xia and Q. X. Zhang, Mater. Express, 2020, 10, 165–176 CrossRef CAS.
- J. G. Yu, C. Dong, Q. X. Zhang, B. Li and R. Liu, Comput. Mater. Sci., 2019, 162, 162–170 CrossRef CAS.
- J. G. Yu, M. C. Wang and S. C. Lin, ACS Nano, 2016, 10, 11044–11057 CrossRef CAS PubMed.
- J. G. Yu, M. C. Wangy and S. C. Lin, Comput. Mater. Sci., 2017, 140, 235–243 CrossRef CAS.
- C. Deng and F. Sansoz, Phys. Rev. B: Condens. Matter Mater. Phys., 2010, 81, 155430 CrossRef.
- J. Sun, L. Fang, A. Ma, J. Jiang, Y. Han, H. Chen and J. Han, Mater. Sci. Eng., A, 2015, 634, 86–90 CrossRef CAS.
- S. Amstutz and A. A. Novotny, Struct. Multidiscipl. Optim., 2010, 41, 407 CrossRef.
- J. Yu, M. Wang and S. Lin, ACS Nano, 2016, 10, 11044–11057 CrossRef CAS PubMed.
- J. Yu, Q. Zhang and Z. Yue, RSC Adv., 2014, 4, 20789–20796 RSC.
- A. Stukowski, Modell. Simul. Mater. Sci. Eng., 2010, 18, 015012 CrossRef.
- C. L. Kelchner, S. J. Plimpton and J. C. Hamilton, Phys. Rev. B: Condens. Matter Mater. Phys., 1998, 58, 11085–11088 CrossRef CAS.
- J. Yu, S. Zhang, Q. Zhang, R. Liu, M. Tang and X. Li, RSC Adv., 2016, 6, 107748–107758 RSC.
- J. J. Zhou, Y. L. He, J. C. Shen, F. A. Essa and J. G. Yu, Nanotechnology, 2022, 33, 105703 CrossRef CAS PubMed.
- A. Stukowski, V. V. Bulatov and A. Arsenlis, Modell. Simul. Mater. Sci. Eng., 2012, 20, 085007 CrossRef.
- F. Shimizu, S. Ogata and J. Li, Mater. Trans., 2007, 48, 2923–2927 CrossRef CAS.
- Z. Li, Y. Gao, S. Zhan, H. Fang and Z. Zhang, AIP Adv., 2020, 10, 075321 CrossRef CAS.
- H. Xie, F. Yin, T. Yu, G. Lu and Y. Zhang, Acta Mater., 2015, 85, 191–198 CrossRef CAS.
- J. R. Greer and W. D. Nix, Phys. Rev. B: Condens. Matter Mater. Phys., 2006, 73, 245410 CrossRef.
- J. R. Greer, W. C. Oliver and W. D. Nix, Acta Mater., 2005, 53, 1821–1830 CrossRef CAS.
- Z. W. Shan, R. K. Mishra, S. A. S. Asif, O. L. Warren and A. M. Minor, Nat. Mater., 2008, 7, 115–119 CrossRef CAS PubMed.
- S. Xu, Y. F. Guo and A. H. W. Ngan, Int. J. Plast., 2013, 43, 116–127 CrossRef CAS.
| This journal is © The Royal Society of Chemistry 2022 |

