
 Open Access Article
 This Open Access Article is licensed under a Creative Commons Attribution-Non Commercial 3.0 Unported Licence
Synthesis and application of novel N, Si-carbon dots for the ratiometric fluorescent monitoring of the antibiotic balofloxacin in tablets and serum
Jia-Yu Zenga,
Yu-Qi Lianga,
Yan-Ni Wua,
Xiao-Yi Wuab,
Jia-Ping Lai *a and
Hui Sun*b
*a and
Hui Sun*b
aSchool of Chemistry, South China Normal University, Guangzhou 510006, China. E-mail: 20081223@m.scnu.edu.cn
bCollege of Environmental Science & Engineering, Guangzhou University, Guangzhou 510006, China. E-mail: esesunhui@gzhu.edu.cn
First published on 17th October 2022
Abstract
A ratiometric fluorescent probe with blue-emission fluorescence based on N, Si-doped carbon dots (N, Si-CDs) for the detection of balofloxacin (BLFX) was synthesized by simple one-pot hydrothermal carbonization using methotrexate and 3-aminopropyltriethoxysilane (APTES) as carbon materials. The obtained N, Si-CDs showed dual-emission band fluorescence characterization at 374 nm and 466 nm. Furthermore, the synthesized N, Si-CD probe exhibited evidence of ratiometric fluorescence emission characteristics (F466/F374) toward BLFX along with a decrease in fluorescence intensity at 374 nm and an increase in fluorescence intensity at 466 nm. Based on this probe, a highly sensitive and fast detection method for the analysis of BLFX has been established with a linear range of 1–60 μM and a low detection limit of 0.1874 μM, as well as a rapid response time of 5.0 s. The developed assay has also been successfully applied for the detection of BLFX in tablets and rat serum.
1 Introduction
Antibiotics have good bacteriostatic and bactericidal effects, which can effectively inhibit or kill certain pathogenic microorganisms, and thus play a good auxiliary role in the prevention and treatment of human diseases. At present, there are various kinds of antibiotics classified according to their different chemical structures, including fluoroquinolones, macrolides, aminoglycosides, β-lactams, tetracyclines, phenols and sulfonamides.1,2 Fluoroquinolones, the first choice for the treatment of bacterial infections, are a class of antibiotics with broad-spectrum antibacterial activity3 and have a wide range of applications in animal and human medicine with the advantages of broad-spectrum activity, good oral absorption and good bactericidal effects.4 Up to now, there have been four main generations of common fluoroquinolone antibiotics.5Balofloxacin (BLFX), chemically named as 1-cyclopropyl-6-fluoro-1,4-dihydro-8-methoxy-7-(3-methylaminopiperidin-1-yl)-4-oxoquinoline-3-carboxylic acid, is a fourth-generation broad-spectrum fluoroquinolone antibiotic.6 Compared with other fluoroquinolone antibiotics, the 7-position of its fluoroquinolone ring is substituted by methylaminopiperazine, and the 8-position is modified by a methoxy group.7 It is mainly used to treat urinary tract infections (UTIs) and bacterial infections.8 BLFX can cause adverse reactions in the gastrointestinal tract and skin of organisms, and may harm human health in certain ways. In addition, the antibiotic remains in the organism and in the environment and has a certain amount of drug resistance, which endanger public health and cause environmental pollution.9 Therefore, it is very important to detect BLFX in biological fluids and commercial drugs. Until now, there have been lots of literature reports on the detection of BLFX, such as by HPLC-EIMS,7 HPLC-MS,10,11 HPLC-ESI-MS,12 LISAs-ICA9 and electrochemistry.13 However, these assays often suffer from the disadvantages of being time consuming, possessing weak anti-interference ability and requiring costly reagents, expensive instruments and complicated pretreatment. In this work, a ratiometric fluorescence method has been proposed for the detection of BLFX for the first time, which can achieve the efficient and sensitive detection of BLFX with important potential.
This great potential is because the ratiometric fluorescent probe is a kind of fluorescent sensor with special emission properties, where the target analytes are detected based on a change in the ratio of two emission peaks.14 Single-emission fluorescent probes are susceptible to environmental interference, which limits their applications. Compared to traditional single-wavelength emission, utilizing the ratio of two peaks can offset the errors and avoid the influence of a variety of external interferents,15 which improves the accuracy of detection and offers better self-correction capabilities.16–18 Until now, classical ratiometric sensors have usually been designed by combining two fluorescence materials with different emission wavelengths. For example, two carbon dots (CDs) with different emission wavelengths have been assembled,19 and CDs have been assembled with traditional quantum dots,20,21 metal–organic frameworks,22,23 metal clusters24,25 and fluorochromes24 as well. However, these methods may have limitations such as multifarious synthetic steps, an uneven doping of the two fluorescent materials and biotoxicity, which are not conducive to the detection of actual biological samples. Among these materials, CDs are carbon-based fluorescent nanomaterials with a diameter of less than 10 nm.26 Compared with traditional semiconductor quantum dots, CDs are more widely used due to their low toxicity, good biocompatibility, good water solubility, and high stability.26–29 In addition, CDs have the advantage of simple synthesis. There are two main synthetic methods: the top-down method and bottom-up method; among which, the hydrothermal reaction method in the bottom-up synthesis is the most commonly used.30 In this study, non-toxic small molecular substances were used as carbon sources, and CDs with better optical properties were prepared by means of high temperature and high pressure.31 CDs have been used in detection sensors,15,29 biological imaging,32–34 photodynamic therapy,35,36 photocatalysis37,38 and other fields. As a fluorescent probe, they have the advantages of good biocompatibility and high fluorescence stability, which exemplify their potential in fluorescent sensors.
In this work, dual-emission N, Si-CDs were synthesized successfully by a one-pot hydrothermal method using methotrexate and APTES as carbon sources. The synthetic steps are simple and do not require further modification. This method is the first to propose the use of a ratiometric fluorescence method to detect BLFX. Compared with traditional detection methods, this procedure is easier to operate, environmentally friendly, and offers rapid detection at a lower cost. It also has the advantages of a low detection limit and good selectivity, and can be used in the detection of BLFX in biological samples and pharmaceuticals.
2 Experimental
2.1 Reagents and materials
Britton–Robinson buffer solutions (B–R) with different pH values were prepared by titrating 0.1 M sulfuric acid, phosphoric acid, boric acid and 0.1 M sodium hydroxide. Quinine sulfate, 3-aminopropyltriethoxysilane (APTES), cysteine, balofloxacin, clinafloxacin, sparfloxacin, norfloxacin, pefloxacin mesylate, and enrofloxacin were purchased from Aladdin Reagent Company. Methotrexate, methionine, phenylalanine, and L-cysteine were purchased from Macklin Reagent Company. Methanol, ethanol, isopropanol, acetonitrile, dimethyl sulfoxide, L-glutamate, D-fructose, glucose, L-glutamic acid, KI, sulfuric acid, phosphoric acid, and boric acid were purchased from Tianjin Damao Chemical Reagent Factory. K2CO3, KCl, BaCl2, CuCl2, FeCl3, MnCl2, CrCl3, CaCl2, and BeCl2 were all utilized as analytically pure reagents, and purchased from Kelong Reagent Factory. KF, ZnSO4, Al2(SO4)3, Mg2SO4, PbCl2, and Cd2SO4 were all used as analytically pure reagents and purchased from Guanghua Reagent Company. Ultrapure water was used in all the experiments.2.2 Instruments
The fluorescence spectra were recorded on a Hitachi FL-4600 spectrophotometer (Japan). The UV-vis spectra in the 200–600 nm−1 region were recorded on a Shimadzu UV-2700 UV-visible spectrophotometer (Japan). The microstructures were analyzed on a JEM-2100 F high-resolution transmission electron microscope (Japan). Fourier transform infrared spectra in the 4000–500 cm−1 region were recorded on a spectrum two Fourier transform infrared spectrometer (Germany) using KBr as the white background. Elemental analysis was performed using X-ray photoelectron spectroscopy (Japan). The fluorescence lifetime was measured on an FLS-920 transient/steady-state fluorescence spectrometer from Edinburgh Instruments (UK). Electrochemical tests were performed using a CHI-660D system (China).2.3 Preparation of dual-emissive carbon dots (N, Si-CDs)
The N, Si-CDs were prepared by a one-pot hydrothermal carbonization method. Briefly, 0.02 g methotrexate and 0.5 mL APTES were mixed with 10 mL ultrapure water in a Teflon-lined autoclave and nitrogen was then pumped into the solution for 10 min, followed by heating at 200 °C for 2 h. Afterwards, the autoclave was cooled down to room temperature naturally, and the resultant product was obtained by filtering the solution through a 0.22 μm pore diameter microporous membrane. The filtrate obtained was stored at 4 °C (Scheme 1).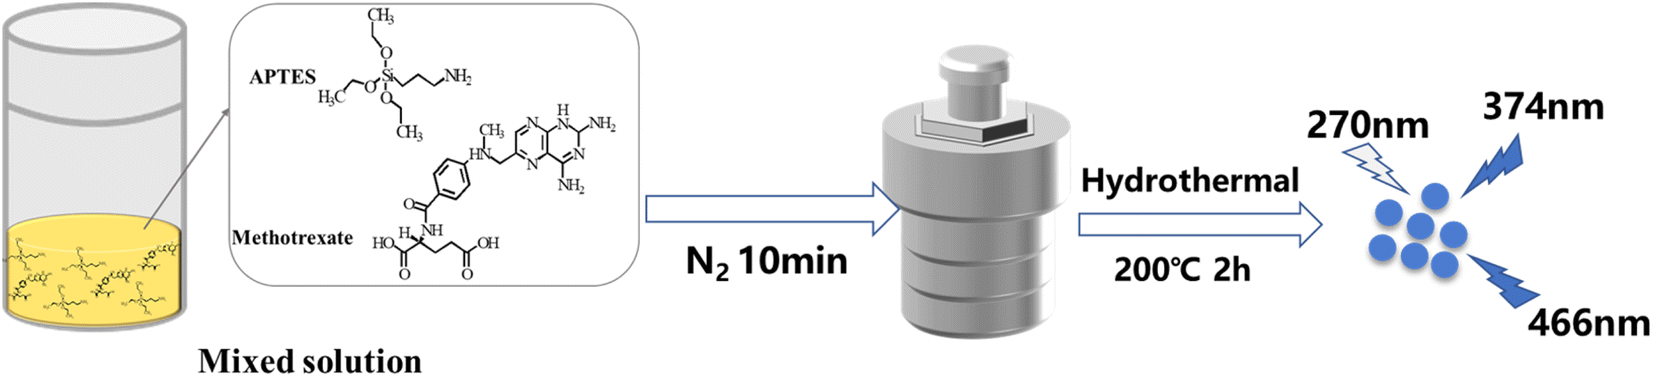 | ||
| Scheme 1 The synthetic procedure of the N, Si-CDs. | ||
2.4 Quantum yield measurement
The quantum yield (QY) of the N, Si-CDs was determined via a comparative method using quinine sulfate (0.1 mol L−1 H2SO4) as a reference under excitation at 360 nm. The equation for the yield is as follows:39,40where Y represents the fluorescence quantum yield, F stands for the fluorescence integrated peak area, A is the absorption value, η is the refractive index, u corresponds to the N, Si-CD sample, and s stands for quinine sulfate.
2.5 Ratiometric fluorescence detection of BLFX
First, a BLFX reserve solution with a concentration of 4 × 10⁻⁴ mol L−1 was prepared. Then, 40 μL N, Si-CDs and BLFX solution with a certain concentration were incubated in 4 mL Britton–Robinson aqueous buffer solution for 10 min. After that, the solutions were transferred to a quartz cell for fluorescence measurement. All the fluorescence measurements were performed under the same conditions: both the excitation and emission slits were set at 5 nm and the fluorescence spectra from 290 nm to 520 nm were recorded under the excitation wavelength of 270 nm. The quantitative and qualitative analysis of BLFX could be achieved by recording and analyzing the change in the F466/F374 fluorescence intensity. The detection conditions, selectivity, sensitivity, anti-interference ability, stability and detection mechanism of the detection system are also studied in this work.2.6 Real sample measurements
In order to investigate the applicability of the probe for real samples, the N, Si-CDs were applied to the determination of BLFX in commercially available BLFX tablets and rat serum. First, BLFX test stock solutions with concentrations of 10, 20, and 30 μM were prepared according to the contents of the tablet ingredients (0.1 g per tablet). The feasibility for application was evaluated by comparing the measured value with the actual value.For the quantification of the concentration of BLFX in rat serum, a standard addition method was carried out by adding the BLFX standard solution to rat serum samples. First, the rat serum was diluted to a certain multiple with normal saline, and 10, 20, and 30 μM BLFX standard solutions were then added. The measured value was compared with the actual value to evaluate the practical application ability of the N, Si-CDs. All the animal procedures were approved by the Animal Experimentation Ethics Committee of the Research Selection Biotechnology (Hangzhou) Co., Ltd. (permission number SYXK (Zhe Jiang) 2020-0043), and all procedures were performed in strict accordance with the Guide for the Care and Use of Laboratory Animals and the Regulation of the Animal Protection Committee to minimize animal suffering and injury.
3 Results and discussion
3.1 Microscopic and spectroscopic studies of the N, Si-CDs
A stock solution of a certain concentration of N, Si-CDs was dropped on an ultrathin carbon mesh and the morphology and size of the N, Si-CDs were characterized by TEM. As shown in Fig. 1a, the obtained N, Si-CDs were monodisperse and uniformly distributed. Additionally, the diameters of the particles ranged from 1.39 to 5.21 nm, which showed good dispersibility with an average diameter of 3.27 nm (Fig. 1b).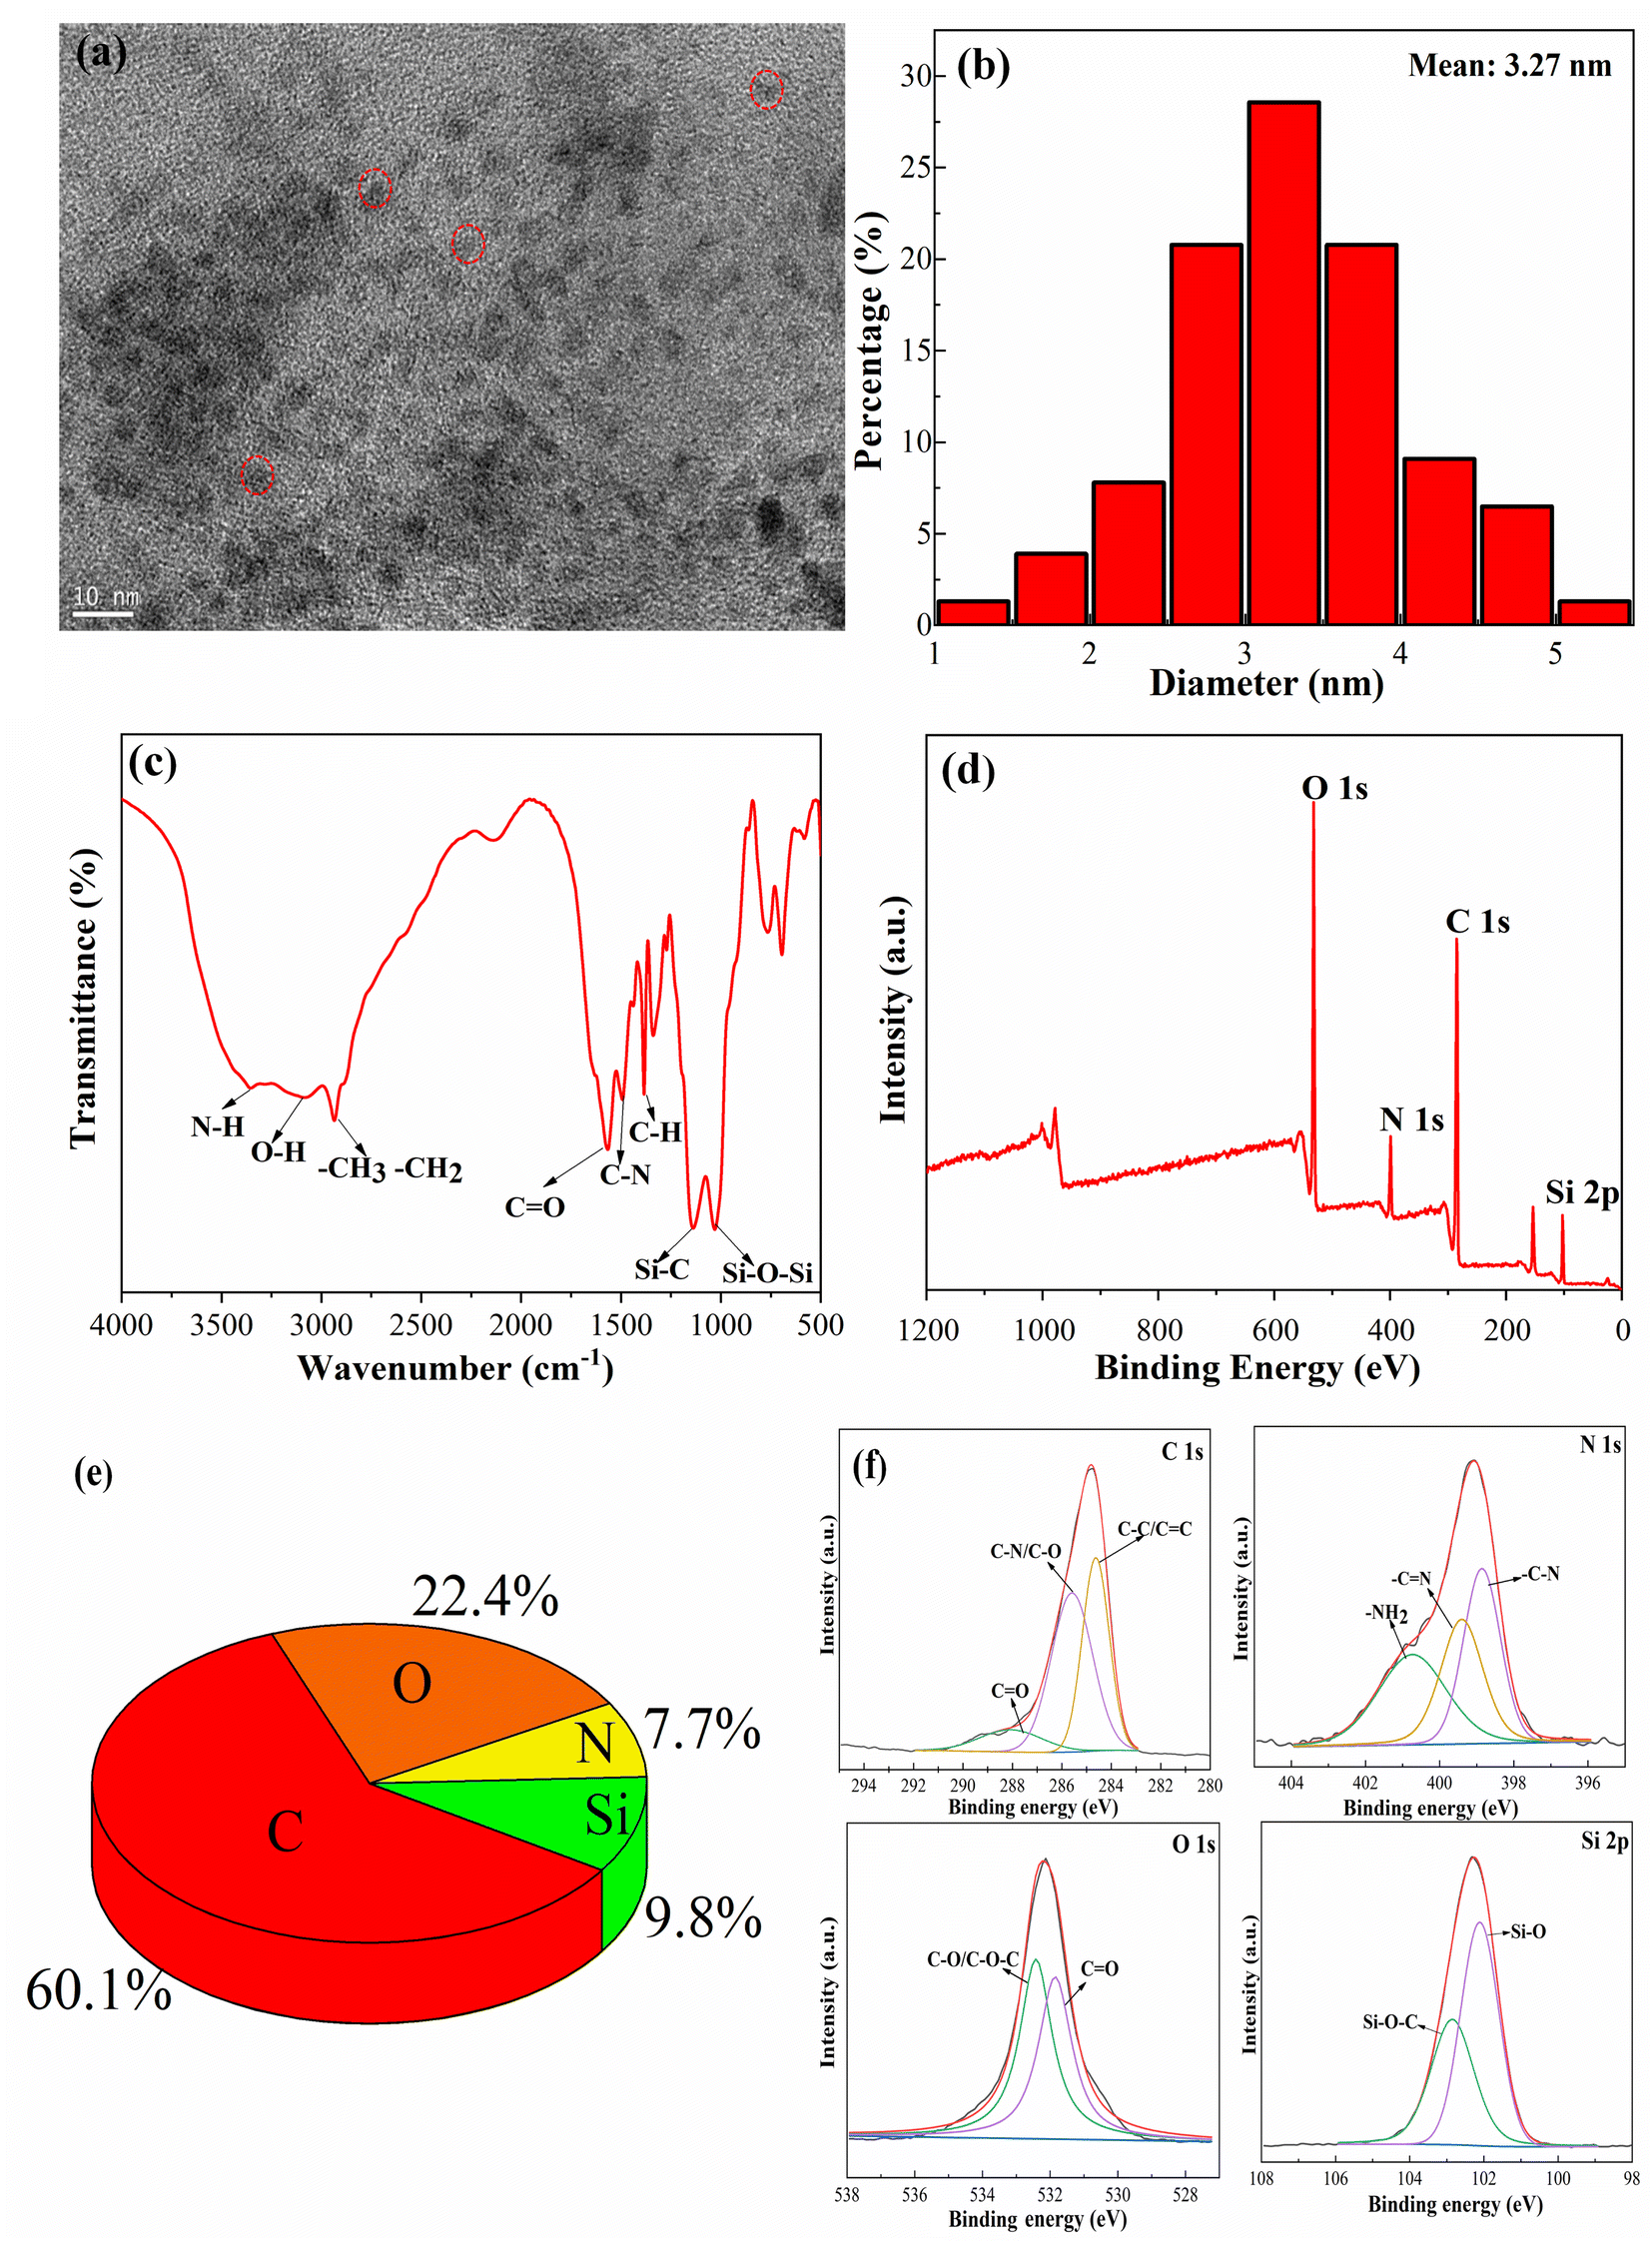 | ||
| Fig. 1 TEM images (a), particle-size distribution analysis (b), infrared characterization of the N, Si-CD functional groups (c), XPS analysis (d), elemental content distribution (e) and high-resolution spectra (C 1s, N 1s, O 1s, Si 2p) (f). | ||
Meanwhile, the surface functional groups of the N, Si-CDs were identified by FTIR spectroscopy. As shown in Fig. 1c, the broad band at 3121–3380 cm−1 was attributed to O–H and N–H stretching vibrations. The infrared spectra showed that the surface of the N, Si-CDs was rich in amino and carboxyl functional groups, indicating that the N, Si-CDs had good water solubility, which is conducive to their detection in solution systems. The peak at 2912 cm−1 was ascribed to C–H. The stretching vibrations of C![[double bond, length as m-dash]](https://www.rsc.org/images/entities/char_e001.gif) O and C–N at 1681 cm−1 and 1476 cm−1, respectively, were related to amide bonds, indicating the successful synthesis of the N, Si-CDs. The two obvious absorption peaks at 1152 cm−1 and 1029 cm−1 belonging to Si–C and Si–O–Si could also be observed, as shown in Fig. 1c, which were consistent with the literature.28,37,41
O and C–N at 1681 cm−1 and 1476 cm−1, respectively, were related to amide bonds, indicating the successful synthesis of the N, Si-CDs. The two obvious absorption peaks at 1152 cm−1 and 1029 cm−1 belonging to Si–C and Si–O–Si could also be observed, as shown in Fig. 1c, which were consistent with the literature.28,37,41
In addition, the full-range XPS spectrum was used to investigate the characteristic functional groups of the N, Si-CDs. As shown in Fig. 1d, there were four peaks for C 1s, N 1s, O 1s and Si 2p in the N, Si-CDs. The elemental composition of the N, Si-CDs was C 60.1%, O 22.4%, Si 9.8% and N 7.7% (Fig. 1e). The XPS spectrum of O 1s indicated that there were two obvious peaks at 532.4 and 531.8 eV, belonging to C–O/C–O–C and CO, respectively.42,43 The spectrum of C 1s showed three peaks at 288.1, 285.6 and 284.6 eV, which were assigned to CO, C–N/C–O and C–C/CC, respectively. The high-resolution spectrum of N 1s included three peaks at 400.7, 399.4 and 398.9 eV, corresponding to N–H, CN and C–N, respectively.44 Lastly, the spectrum of Si 2p showed peaks at 102.9 and 102.1 eV, which were assigned to Si–O–Si and Si–C, respectively.28,41 Comprehensive analysis of the XPS spectrogram shows a high content of C and O elements, indicating that the N, Si-CDs contain more oxygen-containing functional groups, which further explains their good water solubility.
3.2 The optical properties of the N, Si-CDs
As shown in Fig. 2a (black line), the N, Si-CDs had an obvious UV absorption peak at 270 nm, which was derived from the π–π* transition of the conjugated structure of the N, Si-CDs.37 Additionally, the UV absorption peaks at 310 and 370 nm arose from n–π* transitions of the oxygen-containing functional groups.45 Considering the UV and fluorescence spectra, the wavelength of 270 nm was chosen as the excitation wavelength for the N, Si-CDs. Meanwhile, two obvious fluorescence emission peaks of the N, Si-CDs at 374 and 466 nm were observed under the excitation wavelength at 270 nm, thus showing evident dual-emission properties (Fig. 2b). Moreover, the emission wavelength of the N, Si-CDs did not change while the fluorescence intensity changed significantly with the change in excitation wavelength from 240 to 310 nm (Fig. 2c). This may be attributed to the surface defects of the N, Si-CDs and their excitation-independent characteristics.46–48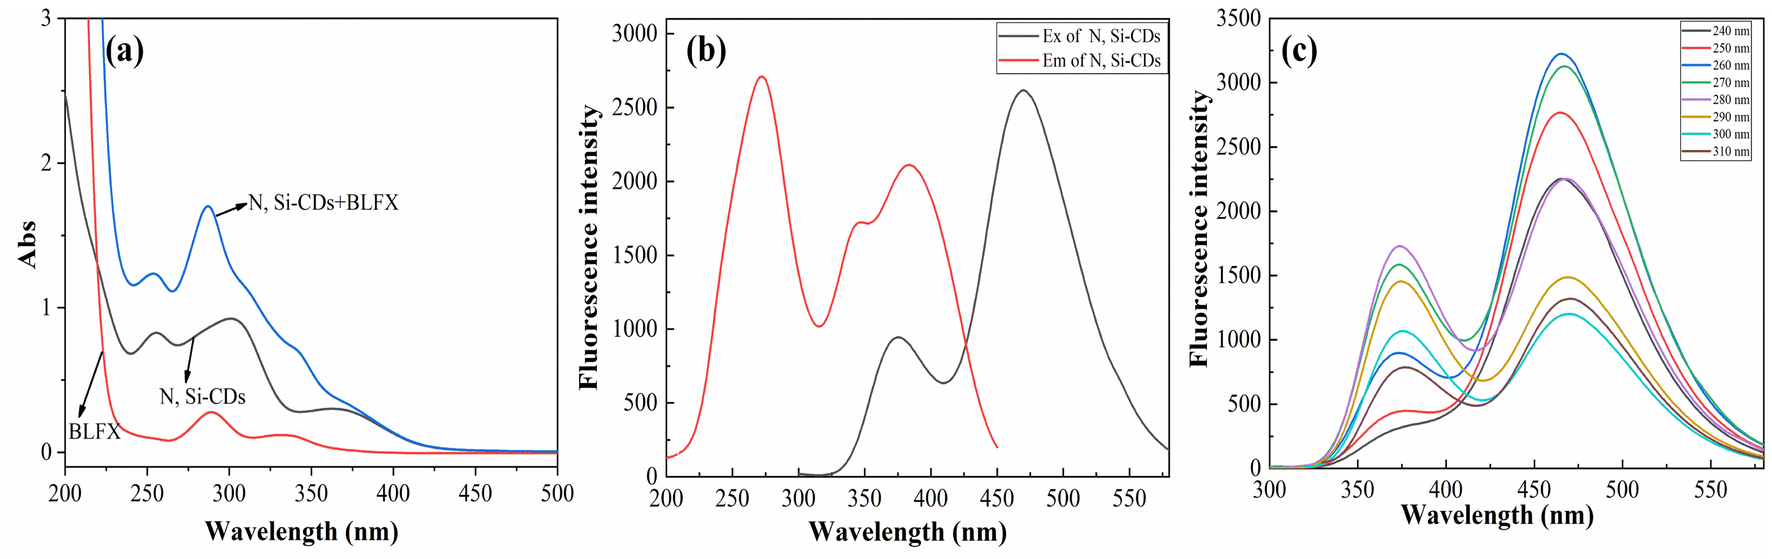 | ||
| Fig. 2 UV-vis spectra of the N, Si-CDs, BLFX and N, Si-CDs + BLFX (a), fluorescence spectra of the N, Si-CDs (b), and fluorescence spectra under different excitation wavelengths (c). | ||
The QY is one of the most important optical properties. Using quinine sulfate as a reference, the relative constants were measured, as shown in Table 1. Finally, the relative fluorescence quantum yield of the N, Si-CDs was determined to be 2.89%.
| F | A | η | |
|---|---|---|---|
| Quinine sulfate | 805![[thin space (1/6-em)]](https://www.rsc.org/images/entities/char_2009.gif) 212.81 212.81 |
0.051 | 1.33 |
| N, Si-CDs | 33674.60 |
0.040 | 1.33 |
3.3 Optimization of the detection conditions
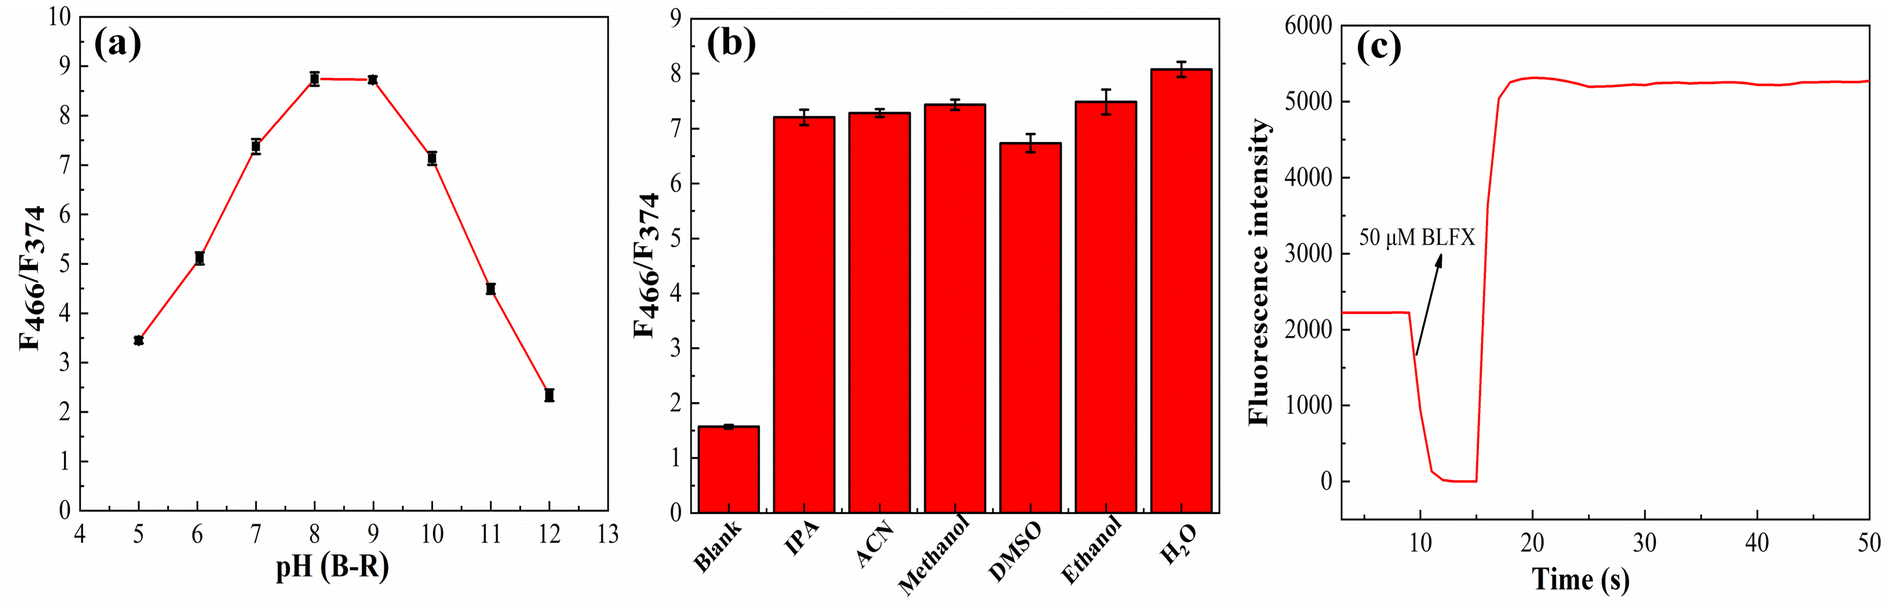
In order to improve the detection effect, the influences of the pH and solvent on the detection system and the response time were also studied.The pH value of the medium is an important factor for the detection system as it can affect the surface charge property of the N, Si-CD nanoparticles and their affinity toward BLFX. In this study, therefore, the influence of different pH values (5–12) on the ratio of F466/F374 was investigated in detail. After incubating 40 μL N, Si-CD reserve solution and 50 μM BLFX solution in different pH Britton–Robinson buffer solutions (B–R) for 10 min, the fluorescence spectra were measured and the ratio changes of F466/F374 were recorded and analyzed. As shown in Fig. 3a, the ratio of F466/F374 increased with an increase in pH value below 8, while it decreased with an increase in pH value above 9. It reached a maximum value when the pH value was between 8 and 9. Considering biocompatibility, pH 8, which is closer to neutral, was selected as the optimal experimental condition.
 | ||
| Fig. 3 The influence of pH value on the ratio of F466/F374 (a), influence of solvent on the ratio of F466/F374 (b) and the fluorescence response time of the N, Si-CDs toward BLFX (c). | ||
The polarity of the solvent is another important factor affecting the fluorescence detection signal as there are abundant amino and carboxyl functional groups on the surface of the CDs. Therefore, the interaction between the N, Si-CDs and the solvent has a great impact on the photoluminescence wavelength.42 Hence, the effects of isopropanol (IPA), acetonitrile (ACN), methanol, dimethyl sulfoxide (DMSO), ethanol, and H2O (20% organic solvent volume fraction) with different polarities on the ratio of F466/F374 were investigated carefully. After incubating 40 μL of the N, Si-CD stock solution and 50 μM BLFX solution in different solvent solutions for 10 min, the fluorescence spectra were recorded. As shown in Fig. 3b, the fluorescence ratio of F466/F374 was only slightly affected by the polarity of the different solvents. The largest ratio of F466/F374 was obtained in H2O. Additionally, considering that most of the actual samples were aqueous solutions, H2O was selected as the solvent for all the tests.
The fluorescence response time is an important parameter to evaluate whether the obtained new probe/sensor can be used for rapid detection. The response time of the N, Si-CDs toward BLFX was explored by monitoring the change in the fluorescence intensity at 466 nm before and after adding the target analyte. As shown in Fig. 4c, after adding BLFX, the fluorescence intensity of the N, Si-CDs reached a response balance within 5 s, which indicates the advantage of a rapid response and allows the rapid detection of BLFX on-site.
 | ||
| Fig. 4 Selectivity of the N, Si-CDs toward BLFX (a, b) and the influence of various ions and small-molecule substances on the ratio of F466/F374 (c, d). | ||
3.4 Selectivity and anti-interference investigations
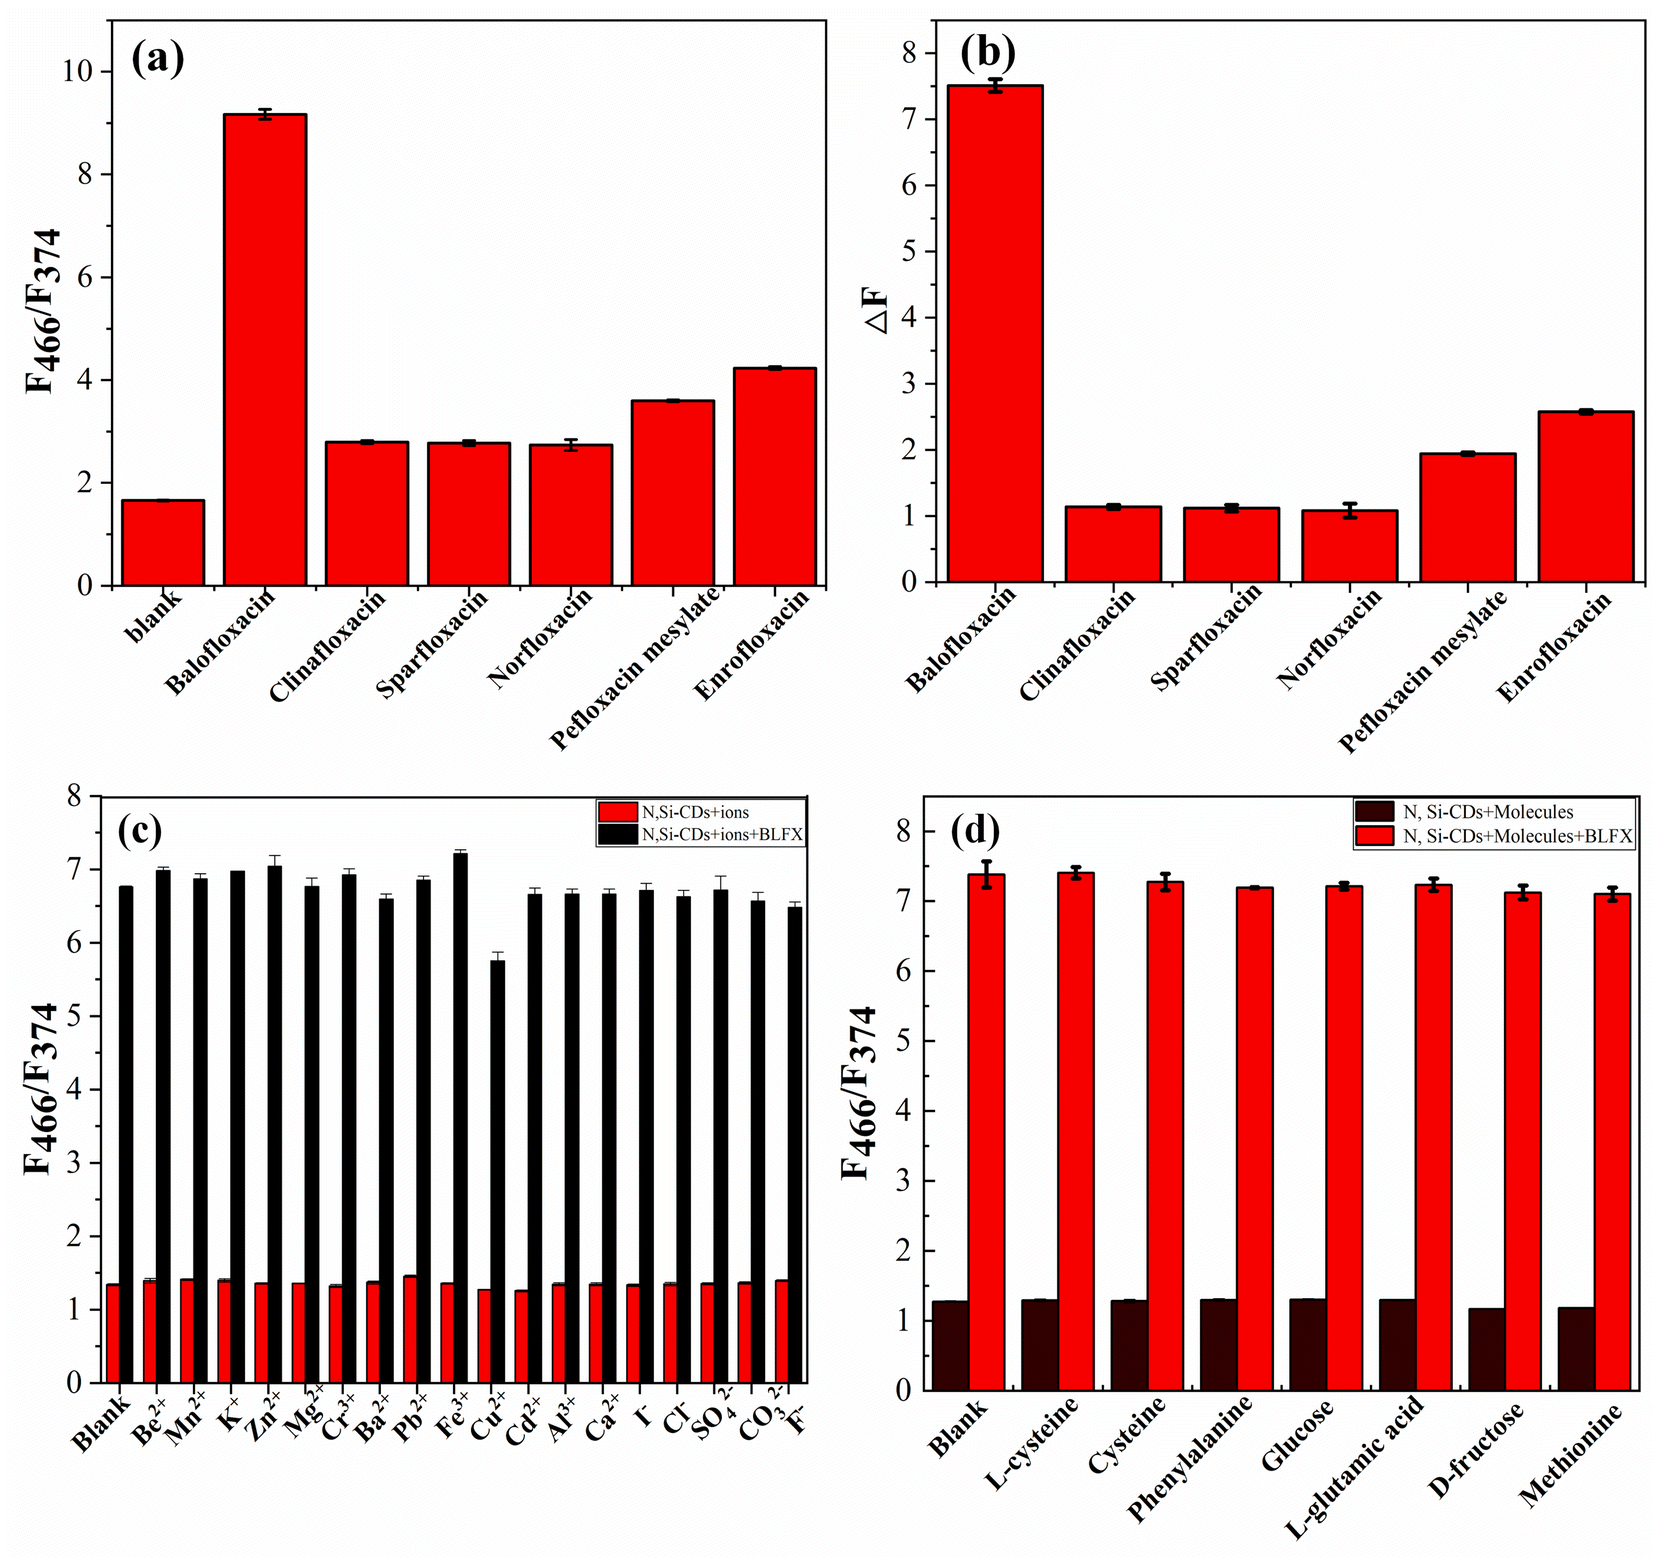
In order to study the selectivity of the N, Si-CDs to BLFX, the ratio of F466/F374 of five other structural analogues of BLFX, namely clinafloxacin, sparfloxacin, norfloxacin, pefloxacin mesylate and enrofloxacin were also measured at the same concentration. By comparing the ratio of F466/F374 after adding the antibiotics (Fig. 4a), the relative fluorescence signal (ΔF) of the N, Si-CD probe toward BLFX was found to be much higher than that of the other analogues (Fig. 4b), which indicated that the obtained N, Si-CDs had a highly selective recognition ability toward BLFX.In addition, to investigate the anti-interference of the N, Si-CDs to possible co-existing ions and small molecules in human blood and water samples on the detection of BLFX, the interferences of common ions (five times the concentration), including Be2+, Mn2+, K+, Zn2+, Mg2+, Cr3+, Ba2+, Pb2+, Fe3+, Cu2+, Cd2+, Al3+, Ca2+, I−, Cl−, SO42−, CO32−, and F−, and some small-molecule substances, including L-cysteine, cysteine, phenylalanine, glucose, L-glutamic acid, D-fructose and methionine, on the ratio of F466/F374 were investigated in detail. It is considered that if the relative error of the fluorescence ratio (F466/F374) caused by the interference substance is less than 5%, then there will be no interference of the substance to the detection system.43 As shown in Fig. 4c and d, most of these substances and ions had no significant influence on the detection of BLFX, except Cu2+. The above results proved that this probe had excellent selectivity and good anti-interference for BLFX detection.
3.5 The stability and quantitative analysis of BLFX with the N, Si-CDs
Good stability is conducive to the application of probes/sensors in actual detection. The influence of different salt concentrations on the detection system and the photostability under the excitation wavelength of 270 nm within 1 h were also explored in this study. The results show that the N, Si-CD probe had strong salt tolerance and good light stability within 1 h (Fig. 5a and b, respectively), which indicate that it can be used for the actual detection of BLFX.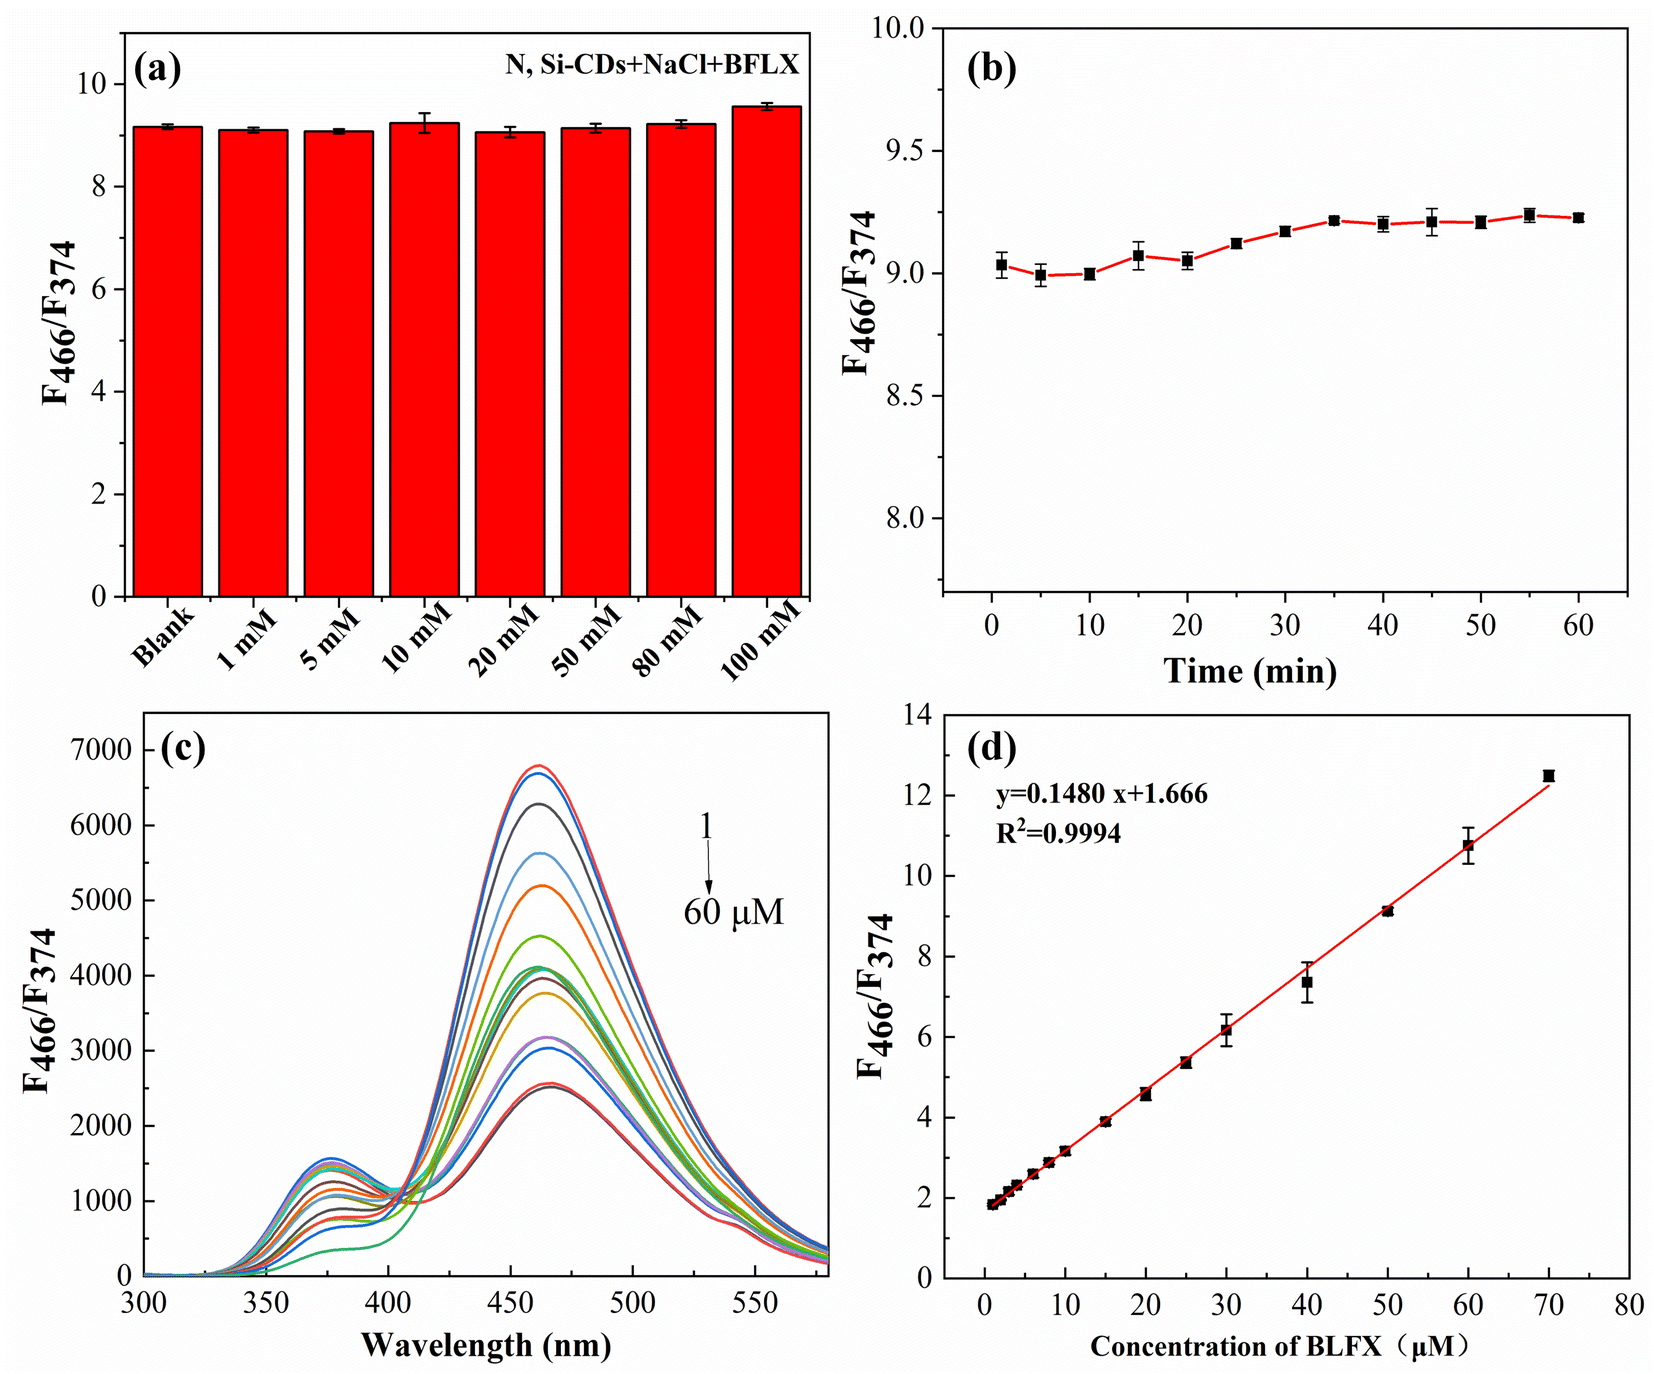 | ||
| Fig. 5 Salt resistance (a), light stability (b), and the fluorescence spectra of the N, Si-CDs–BLFX system with different concentrations of BLFX (c), and the relationship between the fluorescence intensity ratio of F466/F377 and the BLFX concentration (d). | ||
In quantitative analysis, after the incubation of 40 μL N, Si-CD solution with different concentrations of BLFX for 10 min, the mixture was diluted to 4 mL with pH 8 B–R buffer solution. The fluorescence spectra were recorded under the optimal conditions. As shown in Fig. 5c, the fluorescence intensity of the N, Si-CDs at 466 nm gradually increased with the increase in BLFX concentration, while the fluorescence intensity at 377 nm decreased. Additionally, a good linear relationship (R2 = 0.9994) between the fluorescence intensity ratio of F466/F377 and the BLFX concentration from 1 μM to 60 μM was observed and the linear calibration equation was y = 0.1480x + 1.666 (Fig. 5d). The LOD was about 0.1874 μM according to the following equation: LOD = 3σ/k, where σ is the standard deviation of the blank signal (n = 10) and k is the slope of the calibration plot. Thus, our ratiometric fluorescence method can effectively eliminate the interference of environmental factors and improve the detection readiness.
3.6 Determination of the BLFX concentration in tablets and rat serum
In order to evaluate the practicability of the N, Si-CDs for the detection of BLFX, the obtained N, Si-CDs were also applied for the direct detection of the main ingredients in commercially available BLFX tablets and in spiked samples of rat serum. In the determination of the tablet content, the commercially available BLFX tablets were configured into a known concentration of reserve solution according to their tablet content. After incubation with a certain concentration of reserve solution and 40 μL of the N, Si-CDs for 10 min, the fluorescence was determined and the ratio of F466/F374 was calculated. The measured results of BLFX in the tablets could be obtained according to the linear equation, and the recovery of BLFX could be evaluated by comparing the test value with the known concentration value. In the spiked determination of rat serum, the treated rat serum was diluted with normal saline and mixed with BLFX standard solutions of 10, 20, or 30 μM. The recovery could also be evaluated by comparing the measured value with the known BLFX concentration. As can be seen from Table 2, the results showed that the recoveries of the established method for the detection of BLFX in the actual samples were 97.62–106.31%, with the relative standard deviation not exceeding 3.41%, which suggests that the fluorescence probe can be applied for the determination of the BLFX concentration in actual samples.| Sample | Theoretical value (μM) | Found (mean) | Recovery (%) | RSD (n = 3, %) |
|---|---|---|---|---|
| Balofloxacin tablets (100 mg per piece) | 10 | 10.09 | 100.90 | 3.41 |
| 20 | 19.55 | 97.75 | 1.19 | |
| 30 | 30.09 | 100.30 | 2.49 | |
| Rat serum | 10 | 10.63 | 106.31 | 0.72 |
| 20 | 19.52 | 97.62 | 2.38 | |
| 30 | 29.55 | 98.51 | 1.46 |
3.7 Response mechanism for the detection of BLFX
The response mechanisms of fluorescence sensors to their targets include fluorescence resonance energy transfer (FRET),49 photoinduced electron transfer (PET),50 and the internal filtration effect (IFE).51 In order to explore the mechanism of the interaction between the N, Si-CDs and BLFX, fluorescence excitation emission spectroscopy, BLFX ultraviolet absorption spectroscopy, zeta potential analysis, fluorescence lifetime measurements and density functional theory (DFT) calculations were carried out. As can be seen in Fig. 6a, no new peaks were formed before and after the incubation of the N, Si-CDs with BLFX, indicating that no new complex was formed between them. Additionally, the excitation peaks of the N, Si-CDs and BLFX afforded overlapping absorption spectra (Fig. 6b), which is beneficial for energy transfer. Furthermore, according to the zeta potential analysis of the N, Si-CDs (Fig. 6c), it can be seen that there is no charge interaction between BLFX and the surface of the N, Si-CDs. Combined with the fluorescence lifetime results (Fig. 6d), it can be inferred that the mechanism of the interaction between the N, Si-CDs and BLFX is based on the PET process.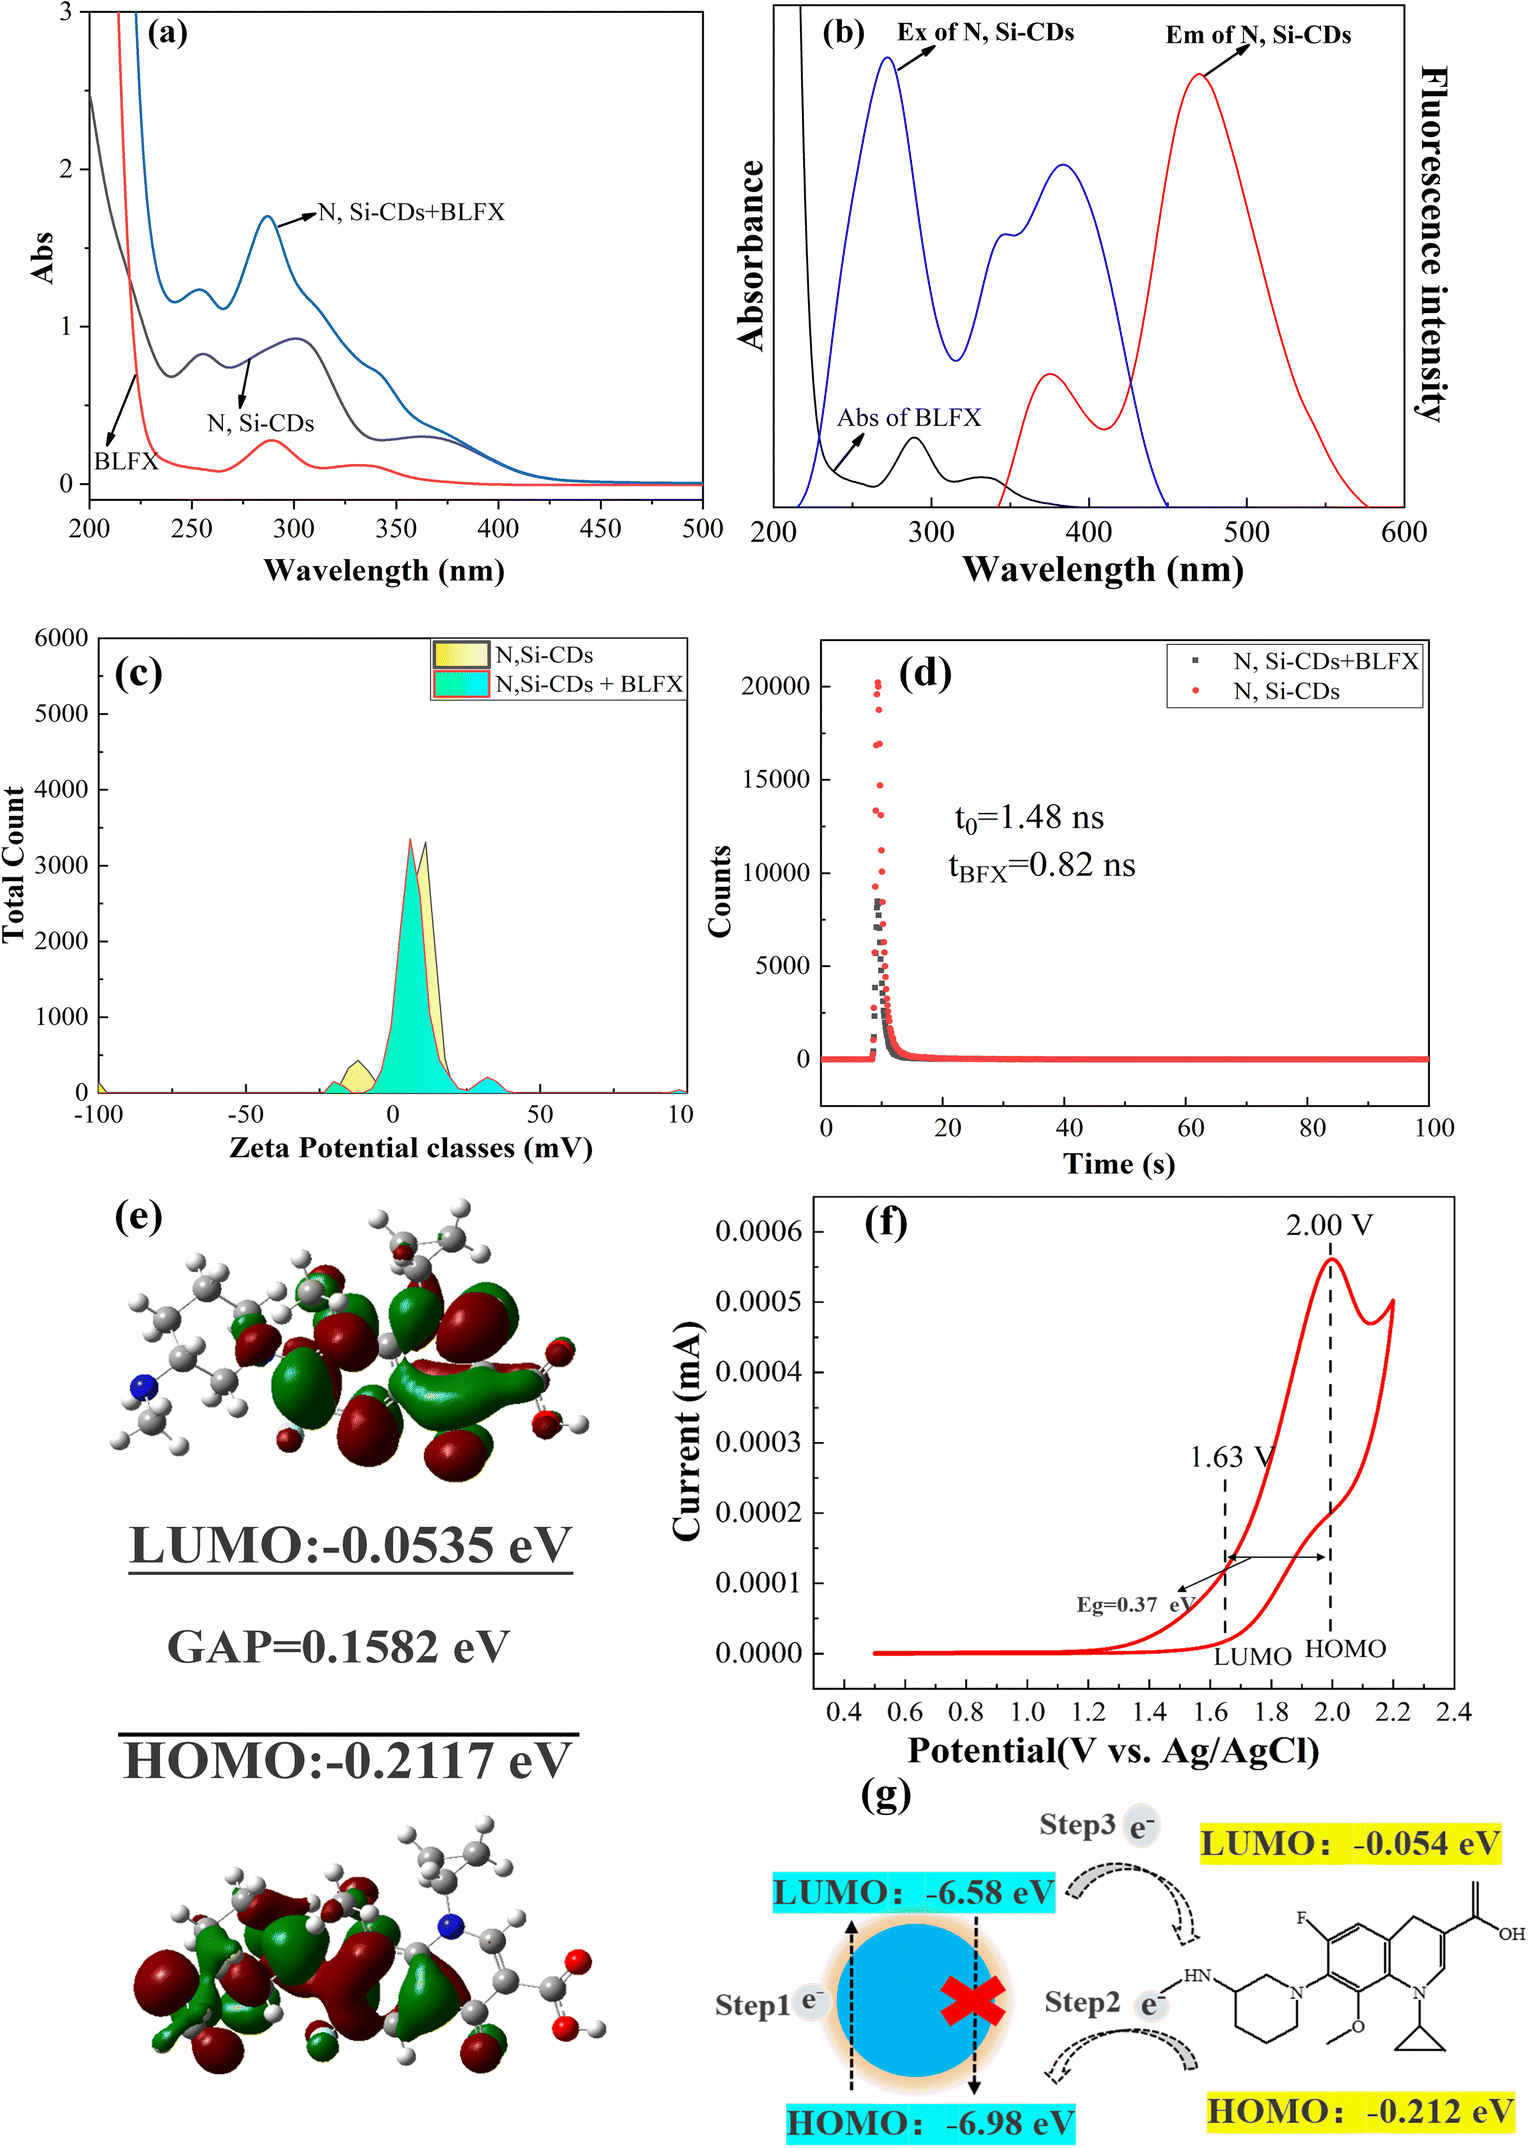 | ||
| Fig. 6 UV-vis spectra of BLFX, the N, Si-CDs, and BLFX + N, Si-CDs (a), fluorescence spectrum of the N, Si-CDs and UV-vis absorption spectrum of BLFX (b), zeta potential (c), fluorescence lifetime (d), frontier molecular orbital profiles of BLFX based on DFT calculations (e), CV test of the N, Si-CDs (f) and the PET process (g). | ||
To verify the PET process between the N, Si-CDs and BLFX, the LUMO and HOMO energy levels of the BLFX molecule and N, Si-CDs were calculated.52–54 First, for the BLFX molecule, DFT calculations were performed using the Gaussian 09 program based on the B3LYP level. The molecular orbital diagram of DFT is shown in Fig. 6e, where the LUMO level of BLFX is −0.0535 eV, while the HOMO level is −0.2117 eV; and the energy gap between the HOMO and LUMO of BLFX was calculated to be 0.1582 eV.
Meanwhile, the electrochemical behavior of the N, Si-CDs was investigated by cyclic voltammetry (CV). With a slight improvement based on the ref. 55, a three-electrode system was used to measure the CV process and the measurement conditions were as follows: Ag/AgCl was used as the reference electrode and 0.1 mol L−1 KCl was used as the electrolyte. A certain concentration of N, Si-CD stock solution was dissolved in the KCl solution for measurement. The scanning speed was set at 100 mV s−1 and the scanning range was 0.5–2.2 V. Finally, the ELUMO and EHOMO of the N, Si-CDs were determined by combining the redox process of the N, Si-CDs with the following three formulas:55,56
| EHOMO = −(Eox,vs.,NHE + 4.75) (eV) | (1) |
| ELUMO = −(Ered,vs.,NHE + 4.75) (eV) | (2) |
| ENHE = EAg/AgCl + 0.197 | (3) |
As shown in Fig. 6g, when the N, Si-CDs are excited by a certain wavelength of light, the electrons at the HOMO level accept energy and transition to the LUMO (step 1). The excited state is unstable and returns to the HOMO in the form of fluorescence. After adding the target analyte BLFX, since the energy level of the BLFX molecule is located between the two energy levels of the N, Si-CDs, the electrons from the HOMO energy level of the BLFX molecule transfer to the HOMO energy level of the N, Si-CDs (step 2), thereby interfering with the HOMO level electrons of the N, Si-CDs returning to the ground state. As a result, the electrons in the LUMO level of the N, Si-CDs are transferred to the LUMO level of BLFX, and then return to the ground state, realizing the PET process.
4 Conclusion
N, Si-CDs were prepared by a one-pot hydrothermal method. They showed two obvious emission peaks at 374 and 466 nm when excited at 270 nm. In the experiment, BLFX was used as the target analyte, and the fluorescence intensity ratio of F466/F374 was monitored to achieve the ratiometric detection of balofloxacin. This method is the first to use ratiometric fluorescence to detect BLFX, which has the advantages of fast detection, high sensitivity and good selectivity, and can be applied to the measurement of BLFX in actual samples.Conflicts of interest
There are no conflicts to declare.Acknowledgements
This work was supported and sponsored by the National Natural Science Foundation of China (21677053, 21876033).References
- M. A. Abedalwafa, Y. Li, C. Ni and L. Wang, Anal. Methods, 2019, 11, 2836–2854 RSC.
- Y. Sun, J. Zhao and L. Liang, Microchim. Acta, 2021, 188, 21–42 CrossRef CAS PubMed.
- J. M. V. Makabenta, A. Nabawy, C. H. Li, S. S. Malan, R. Patel and V. M. Rotello, Nat. Rev. Microbiol., 2021, 19, 23–36 CrossRef CAS PubMed.
- Y. N. Ni, Y. R. Wang and S. Kokot, Talanta, 2006, 69, 216–225 CrossRef CAS PubMed.
- Z. Xu, S. J. Zhao, Z. S. Lv, F. Gao, Y. Wang, F. Zhang, L. Bai and J. L. Deng, Eur. J. Med. Chem., 2019, 162, 396–406 CrossRef CAS PubMed.
- F. Zhao, Y. Qi and W. Xiong, Bull. Korean Chem. Soc., 2012, 33, 204–208 CrossRef CAS.
- Z. W. Bian, Y. Tian, Z. J. Zhang, F. G. Xu, J. H. Li and X. M. Cao, J. Chromatogr. B: Anal. Technol. Biomed. Life Sci., 2007, 850, 68–73 CrossRef CAS PubMed.
- F. M. E. Wagenlehner, W. Weidner and K. G. Naber, Expert Opin. Emerging Drugs, 2005, 10, 275–298 CrossRef CAS PubMed.
- J. Peng, L. Q. Liu, L. G. Xu, S. S. Song, H. Kuang, G. Cui and C. L. Xu, Nano Res., 2017, 10, 108–120 CrossRef CAS.
- B. Żuromska-Witek, P. Żmudzki, M. Szlósarczyk, A. Maślanka and U. Hubicka, Molecules, 2020, 25, 5251 CrossRef PubMed.
- M. Chen, H. Zhao, Y. Wang, T. G. Bekele, W. Liu and J. Chen, Ecotoxicol. Environ. Saf., 2019, 180, 202–207 CrossRef CAS PubMed.
- L. Ge, C. Halsall, C. E. Chen, P. Zhang, Q. Dong and Z. Yao, Sci. Total Environ., 2018, 633, 1192–1197 CrossRef CAS PubMed.
- S. Ansari, M. S. Ansari, S. P. Satsangee and R. Jain, J. Pharm. Anal., 2021, 11, 57–67 CrossRef PubMed.
- X. Y. Xu, R. Ray, Y. L. Gu, H. J. Ploehn, L. Gearheart, K. Raker and W. A. Scrivens, J. Am. Chem. Soc., 2004, 126, 12736–12737 CrossRef CAS PubMed.
- X. Q. Liu, T. Wang, W. J. Wang, Z. P. Zhou and Y. S. Yan, J. Ind. Eng. Chem., 2019, 72, 100–106 CrossRef CAS.
- B. B. Chen, M. L. Liu, L. Zhan, C. M. Li and C. Z. Huang, Anal. Chem., 2018, 90, 4003–4009 CrossRef CAS PubMed.
- F. Li, Y. Y. Li, X. Yang, X. X. Han, Y. Jiao, T. T. Wei, D. Y. Yang, H. P. Xu and G. J. Nie, Angew. Chem., Int. Ed., 2018, 57, 2377–2382 CrossRef CAS PubMed.
- H. Z. Xie, J. Dong, J. L. Duan, G. I. N. Waterhouse, J. Y. Hou and S. Y. Ai, Sens. Actuators, B, 2018, 259, 1082–1089 CrossRef CAS.
- S. Campuzano, P. Y. Sedeno and J. M. Pingarron, Nanomaterials, 2019, 9, 18 Search PubMed.
- J. An, G. Y. Liu, M. Z. Chen, Y. Q. Hu, R. B. Chen, Y. Lyu, C. Zhang and Y. F. Liu, Nanotechnology, 2021, 32, 12 Search PubMed.
- D. Chang, Z. Zhao, W. Niu, L. Shi and Y. Yang, Spectrochim. Acta, Part A, 2021, 260, 119964 CrossRef CAS PubMed.
- H. Z. He, X. H. Zheng, S. Liu, M. Zheng, Z. G. Xie, Y. Wang, M. Yu and X. T. Shuai, Nanoscale, 2018, 10, 10991–10998 RSC.
- Y. Xu, C. Wang, G. Ran, D. Chen, Q. Pang and Q. Song, ACS Appl. Nano Mater., 2021, 4, 4820–4828 CrossRef CAS.
- C. Q. Li, Z. Q. Zhao, S. Z. Fu, X. Y. Wang, Y. H. Ma and S. S. Dong, Sep. Purif. Technol., 2021, 270, 13 Search PubMed.
- Y. Wang, X. F. Li, W. W. Lei, B. L. Zhu and J. H. Yang, Appl. Surf. Sci., 2021, 559, 10 Search PubMed.
- F. Y. Yan, Z. J. Bai, F. Liu, F. L. Zu, R. Q. Zhang, J. X. Xu and L. Chen, Curr. Org. Chem., 2018, 22, 57–66 CrossRef CAS.
- Z. H. Guo, Y. Jiao, F. F. Du, Y. F. Gao, W. J. Lu, S. M. Shuang, C. Dong and Y. Wang, Talanta, 2020, 216, 8 CrossRef PubMed.
- Z. Han, D. Y. Nan, H. Yang, Q. Q. Sun, S. Pan, H. Liu and X. L. Hu, Sens. Actuators, B, 2019, 298, 9 CrossRef.
- W. Song, W. X. Duan, Y. H. Liu, Z. J. Ye, Y. L. Chen, H. L. Chen, S. D. Qi, J. Wu, D. Liu, L. H. Xiao, C. L. Ren and X. G. Chen, Anal. Chem., 2017, 89, 13626–13633 CrossRef CAS PubMed.
- M. Jorns and D. Pappas, Nanomaterials, 2021, 11, 1448 CrossRef CAS PubMed.
- K. J. Mintz, Y. Zhou and R. M. Leblance, Nanoscale, 2019, 11, 4634–4652 RSC.
- M. Li, H. J. Liu and X. Q. Ren, Biosens. Bioelectron., 2017, 89, 899–905 CrossRef CAS PubMed.
- A. Y. Hao, X. Q. Wang, Y. Z. Mei, J. F. Nie, Y. Q. Yang and C. C. Dai, Spectrochim. Acta, Part A, 2021, 249, 9 CrossRef PubMed.
- Y. Q. Liang, X. Y. Wu, J. Y. Zeng, Y. N. Wu, J. P. Lai and H. Sun, Anal. Bioanal. Chem., 2022, 414, 3043–3055 CrossRef CAS PubMed.
- J. Y. Chen, S. Jiang, M. K. Wang, X. L. Xie and X. G. Su, Sens. Actuators, B, 2021, 339, 9 Search PubMed.
- R. Jalili, A. Khataee, M. R. Rashidi and R. Luque, Sens. Actuators, B, 2019, 297, 8 CrossRef.
- S. L. Song, Y. Zhao, Y. Li, X. D. Yang, D. Wang, Z. Q. Wen, M. H. Yang and Q. Lin, Talanta, 2021, 221, 8 CrossRef PubMed.
- Y. Y. Zhang, H. D. Xu, Y. L. Yang, F. M. Zhu, Y. X. Pu, X. S. You and X. L. Liao, J. Photochem. Photobiol. A, 2021, 411, 8 CrossRef.
- L. Ge, H. L. Yu, H. T. Ren, B. Shi, Q. Guo, W. S. Gao, Z. Q. Li and J. G. Li, J. Mater. Sci., 2017, 52, 9979–9989 CrossRef CAS.
- J. Gogoi and D. Chowdhury, J. Mater. Sci., 2020, 55, 11597–11608 CrossRef CAS.
- H. Y. Kou, S. J. Pang, B. Y. Yang, M. Wang, J. Ding, Z. Q. Zhang and X. D. Yang, CrystEngComm, 2021, 23, 2599–2605 RSC.
- X. Gao, Y. Zhang, Z. Fu and F. Cui, Opt. Mater., 2022, 131, 112701 CrossRef CAS.
- H. Liu, D. Su, H. Gao, X. Yan, D. Kong, R. Jin, X. Liu, C. Wang and G. Lu, Anal. Chem., 2020, 92, 3198–3205 CrossRef PubMed.
- Q. Wang, S. R. Zhang, Y. G. Zhong, X. F. Yang, Z. Li and H. Li, Anal. Chem., 2017, 89, 1734–1741 CrossRef CAS PubMed.
- Y. L. Wang, S. Y. Lao, W. J. Ding, Z. D. Zhang and S. Y. Liu, Sens. Actuators, B, 2019, 284, 186–192 CrossRef CAS.
- S. Lei, N. Chang, J. Zhang and H. Wang, Anal. Sci., 2021, 37, 851–857 CrossRef CAS PubMed.
- Z. H. Wen and X. B. Yin, RSC. Adv., 2016, 6, 27829–27835 RSC.
- Y. Y. Zhao, S. N. Qu, X. Y. Feng, J. C. Xu, Y. Yang, S. C. Su, S. P. Wang and K. W. Ng, J. Phys. Chem. Lett., 2019, 10, 4596–4602 CrossRef CAS PubMed.
- Y. Q. Dang, Y. J. Zhou, J. T. Cai, G. Y. Liu, Y. T. Zhang and J. S. Qiu, J. Nano Res., 2017, 45, 134–141 CAS.
- K. Y. Huang, H. X. He, S. B. He, X. P. Zhang, H. P. Peng, Z. Lin, H. H. Deng, X. H. Xia and W. Chen, Sens. Actuators, B, 2019, 296, 7 CrossRef.
- M. Yang, Y. J. Yan, E. Z. Liu, X. Y. Hu, H. Hao and J. Fan, Opt. Mater., 2021, 112, 110743 CrossRef CAS.
- J. Gu, X. Li, G. Zhou, W. Liu, J. Gao and Q. Wang, J. Hazard. Mater., 2020, 386, 121883 CrossRef CAS PubMed.
- M. Yu, M. M. Xie, X. Wang, Y. Li and G. Li, ACS Appl. Mater. Interfaces, 2019, 11, 21201–21210 CrossRef CAS PubMed.
- S. U. Rehman, A. Majid, N. Hassan, A. Shakoor, G. Murtaza and S. D. Khan, Mater. Sci.-Pol., 2015, 33, 782–791 Search PubMed.
- K. M. Omer, D. I. Tofiq and A. Q. Hassan, Microchim. Acta, 2018, 185, 466–473 CrossRef PubMed.
- B. Aayat and E. I. Saievar, J. Lumin., 2017, 192, 180–183 CrossRef.
| This journal is © The Royal Society of Chemistry 2022 |