
 Open Access Article
 This Open Access Article is licensed under a Creative Commons Attribution-Non Commercial 3.0 Unported Licence
Simultaneous quantification of apolipoproteins A-I, E, and J in human plasma by LC-MS/MS for clinical application to diabetes mellitus complicated with cardiovascular disease
Pengfei Li†
 a,
Yuting Cong†b,
Wen Zhang†a,
Lefeng Wangc,
Lulu Rena,
Xin Lic,
Song Yanga,
Zhiyong Zhangc,
Guoqing Li*b and
Lihong Liu*a
a,
Yuting Cong†b,
Wen Zhang†a,
Lefeng Wangc,
Lulu Rena,
Xin Lic,
Song Yanga,
Zhiyong Zhangc,
Guoqing Li*b and
Lihong Liu*a
aPharmacy Department of Beijing Chao-Yang Hospital, Capital Medical University, No. 8 Gongti South Road, Chaoyang District, Beijing, China. E-mail: liulihong@bjcyh.com
bShanghai AB Sciex Analytical Instrument Trading Co. Ltd, 518 North Fuquan Road, Changning District, Shanghai, China. E-mail: guoqing.li@sciex.com
cHeart Center of Beijing Chao-Yang Hospital, Capital Medical University, No. 8 Gongti South Road, Chaoyang District, Beijing, China
First published on 6th June 2022
Abstract
Apolipoproteins (Apos) play an important role in regulating plasma lipid concentration. Complex disorders of Apos are highly related with diabetes mellitus, cardiovascular and other diseases. Direct measures of lipoprotein fractions for risk assessment suffer from inaccuracy in the dyslipidemia and pathological states. Therefore, a reliable precise assay will be of high clinical utility. LC-MS/MS methods with multiple reaction monitoring modes have proven suitable for multiplexed quantification. We aimed to develop a simple, cost-effective and amenable LC-MS/MS assay for quantification of ApoA-I, ApoE and ApoJ in human plasma. Standards were constructed from substitute matrix and proteotypic peptides for external calibration and corresponding stable isotope labeled peptides were added as internal standards to remove matrix effects. Analytical validation of the assay included the assessment of linearity, accuracy (RE: −3.02% to 5.32%), intra-assay precision (RSD: 2.50% to 6.56%), inter-assay precision (RSD: 0.78% to 6.68%), spiking recovery rate (accuracy: 87.17% to 112.71%), matrix effect (accuracy: 88.03% to 114.87%), and reproducibility and repeatability of sample preparation (RSD: 1.95% to 7.26%). The performance of proteotypic peptides ApoA-I, ApoE and ApoJ was sufficient for triplex quantitation within a linear range from 16.26 to 1626.41 pmol mL−1, 1.03 to 103.35 pmol mL−1 and 0.86 to 86.46 pmol mL−1 respectively. For all quantified peptides, the determination coefficient (R2) was >0.997. Besides, the validated LC-MS/MS method has been successfully applied to the quantification of plasma samples in diabetes mellitus and cardiovascular diseases. We anticipate that this assay may provide an alternative method for future clinical applications.
Introduction
Apolipoprotein (Apo) is the protein part of plasma lipoproteins and is generally divided into Apo A, B, C, D, E and J families. The main functions of Apos are maintaining lipoprotein structure and lipid transport, participating in lipoprotein metabolism and regulating many biological functions.1 Apolipoprotein A (ApoA) is an important component of plasma high-density lipoprotein, which has the effect of removing tissue lipids and anti-atherosclerosis effects. Apo A-I is suggested to be a new cardiovascular disease (CVD) risk factor in recent publications.2–4 Apolipoprotein E (ApoE) is also a determinant of CVD risk and atherosclerosis,5–7 but still with clinical application value for the prevention, diagnosis and treatment of eye diseases.8 Similarly, apolipoprotein J (ApoJ, also called clusterin) is widely distributed in various tissues of the human body. In addition to transporting lipids, ApoJ is also involved in complement regulation9,10 and its plasma levels are associated with post-myocardial infarction (MI),10 hepatic insulin sensitivity impairment11 and survival of heart failure.12 Our study demonstrated that ApoJ ameliorated endothelial dysfunction in diabetes by suppressing mitochondrial fragmentation and it might be used as a potential biomarker to predict diabetes mellitus complicated with cardiovascular disease.13Although apolipoproteins have been becoming ideal candidate biomarkers of CVD,14–17 CVD risk is still assessed by traditional HDL and LDL or non-HDL cholesterol concentrations and standardized clinical immunoassays. Due to the complexity of dyslipidemia, multiple target proteins should be analyzed simultaneously for more accurate assessment, however there are only a few standardized immunoassays for clinical testing.14 During the last years, liquid chromatography tandem mass spectrometry (LC-MS/MS) methods with multiple reaction monitoring (MRM) mode have been widely used in targeted quantitative proteomic analysis which can greatly reduce the background noise and improve the sensitivity, specificity and precision.18–20 Compared with traditional immunological methods, MRM method shows great advantages in terms of accuracy, selectivity, reproducibility, sensitivity, and quantitative linear range, and multiple proteins can be analyzed from small sample volumes within one run.14,18–22
Clinical application assays for protein quantification requires stringent criteria for accuracy and precision.23 To improve the specificity and to ensure the analytical performance of target Apos, only one unique peptide of each apolipoprotein was chosen for quantitative purpose. There were two transitions for each selected proteotypic peptide for qualification and quantification separately. Besides, stable isotope labeled peptides as internal standards were introduced to ensure the accuracy and precision.
In this report, we developed and validated a novel LC-MS/MS method with MRM mode for triplex quantification of serum/plasma ApoA-I, ApoE and ApoJ, including a reliable sample preparation protocol for simultaneous quantitative analysis of medium to high abundant Apos and various validation steps toward clinical application. We anticipate that this assay may provide an alternative method for future clinical applications.
Materials and methods
Materials and reagents
Synthetic unique peptides and stable isotope labeled peptides as internal standard (SIL-IS) with the purity greater than 95% were purchased from Synpeptide Co., Ltd (Shanghai, China). ApoA-I (human-recombinant, expressed in E. coli, with the purity greater than 97%, Cat. # SRP 4693), ApoE (from human plasma, with the purity greater than 95%, Cat. # SRP 6303), ApoJ (human-recombinant, expressed in HEK 293 cells, with the purity greater than 92%, Cat. # SRP 6464), were all purchased from Sigma Aldrich (St. Louis, MO, USA). BSA (Bovine serum albumin) was purchased from Saiguo biotech Co., Ltd (Guangzhou, China). Urea, DTT (DL-Dithiothreitol), IAA (iodoacetamide), FA (formic acid), TFA (trifluoroacetic acid) and ammonium acetate were all purchased from Sigma Aldrich (St. Louis, MO, USA). Trypsin (Mass spectrometry grade, Cat. # V5280) was purchased from Promega (Madison, WI, USA). Acetonitrile (HPLC grade) was purchased from Thermo Fisher (Waltham, MA, USA). Oasis PRiME HLB cartridge (10 mg) was purchased from Waters (Milford, MA, USA). Deionized water was used in all of the experiments and was purified with a Milli-Q system (Millipore, Milford, MA, USA).Preparation of calibration standards, quality control samples
Synthetic unique peptides standards and SIL-IS stock solutions (1 mg mL−1) were prepared in 0.1% FA in acetonitrile/water (1![[thin space (1/6-em)]](https://www.rsc.org/images/entities/char_2009.gif) :4, v/v). Each synthetic unique peptide standard was diluted with tryptic digestions of BSA (prepared by the same method as “Sample preparation” to final concentration of 75 μg μL−1) as substitute matrix to prepare a series of mixture of standard solutions (STDs) and quality control (QCs) solutions. A similar stock solution of SIL-IS was diluted to give a mixture of 1 μg mL−1 IS working solution. 200 μL STD and QC solutions were added 20 μL IS working solution to prepare calibration standards and quality control samples. The concentrations of STDs and QCs were 16.26/1.03/0.86, 32.53/2.07/1.73, 81.32/5.17/4.33, 162.64/10.34/8.65, 325.28/20.68/4017.29, 813.21/51.68/43.23, 1626.41/103.35/86.46 and 48.78/3.09/2.58, 243.96/15.50/12.97, 1301.13/82.68/69.17 pmol mL−1 for ApoA-I/ApoE/ApoJ, respectively.
:4, v/v). Each synthetic unique peptide standard was diluted with tryptic digestions of BSA (prepared by the same method as “Sample preparation” to final concentration of 75 μg μL−1) as substitute matrix to prepare a series of mixture of standard solutions (STDs) and quality control (QCs) solutions. A similar stock solution of SIL-IS was diluted to give a mixture of 1 μg mL−1 IS working solution. 200 μL STD and QC solutions were added 20 μL IS working solution to prepare calibration standards and quality control samples. The concentrations of STDs and QCs were 16.26/1.03/0.86, 32.53/2.07/1.73, 81.32/5.17/4.33, 162.64/10.34/8.65, 325.28/20.68/4017.29, 813.21/51.68/43.23, 1626.41/103.35/86.46 and 48.78/3.09/2.58, 243.96/15.50/12.97, 1301.13/82.68/69.17 pmol mL−1 for ApoA-I/ApoE/ApoJ, respectively.
Sample preparation
Sample preparation was based on typical procedures for quantitative proteome analysis and preparation steps were adjusted accordingly24 as illustrated in Fig. 1 and 2 μL plasma sample was dissolved in 96 μL denaturing buffer 1 (50 mM NH4HCO3 and 8 M urea, pH = 8.0). 2 μL DTT (1 M) was added to reach the final concentration of 20 mM and the solution was then incubated in a 60 °C water bath for 1 h. Then add IAA to reach the final concentration of 40 mM, followed by incubation in the dark at room temperature for 40 min. 700 μL buffer 2 (50 mM NH4HCO3, pH = 8.0) was added to make the concentration of urea be 1 M, then 6 μg trypsin was added and the solution was incubated in a 37 °C water bath for 14 h. 10 μL FA was added to quench the digestion. 20 μL IS working solution (1 μg∙mL−1) was added and then the solution was desalted by Oasis PRiME HLB cartridge. The solid phase extraction was washed using 1 mL 0.1% TFA aqueous solution for three times, and eluted using 0.5 mL 0.1% TFA and 80% acetonitrile solution for twice. The elution was lyophilized and then redissolved by 200 μL 0.1% FA for MRM analysis by LC-MS/MS.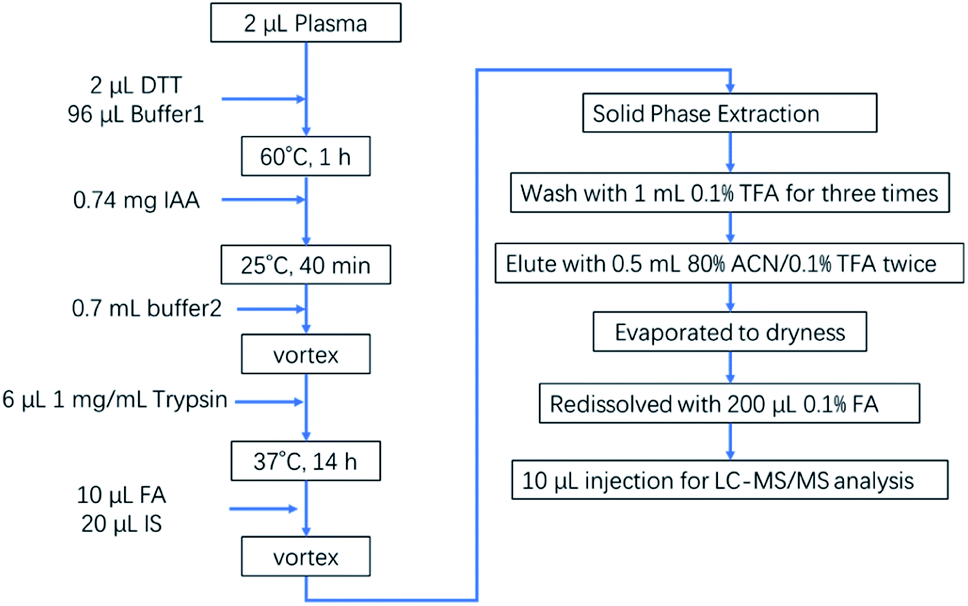 | ||
| Fig. 1 The sample preparation procedure for quantification of Apos in human plasma. | ||
LC-MS/MS conditions
LC-MS/MS analysis was performed on an Shimadzu 20AD series LC system (Shimadzu, Kyoto, Japan) coupled to a SCIEX QTRAP 5500 mass spectrometer (Sciex, Toronto, Canada) equipped with a TurboIonSprayTM source. Chromatographic separation was performed on Phenomenex Aeris WIDEPORE XB-C18 column (150 × 2.1 mm, 3.6 μm) with an injection volume of 10 μL. Mobile phase A consisted of 0.1% formic acid in water and mobile phase B consisted of 0.1% formic acid in acetonitrile, delivered at a flow rate of 0.5 mL min−1. Column heater compartment was set at 40 °C. The gradient elution program was as follows: 0–0.5 min, 5%B; 0.5–4.5 min, 5–90%B; 4.5–5.5 min, 90%B; 5.5–5.6 min, 90–5%B; 5.6–8 min, 5%B.The analytes were detected by the mass spectrometer with MRM in the positive ion mode. Source gas parameters were optimized as follows: ionspray voltage of 5500 V, temperature of 550 °C, ion source gases 1 and 2 were both 60 psi, collision gas was set to medium, and the curtain gas was set to 40 psi. For MRM transitions, collision energy (CE), declustering potential (DP), and cell exit potential (CXP) were manually optimized as shown in Table 1. The system control and data acquisition were performed in Analyst software version 1.6.2.
| Analytes | Q1 | Charge | Product ion | Q3 | DP | CE | CXP |
|---|---|---|---|---|---|---|---|
| ApoA-I peptide | 616.0 | [M + 2H]2+ | Quantifier | 819.6 | 120 | 30 | 17 |
| 616.0 | [M + 2H]2+ | Qualifier | 932.6 | 120 | 29 | 21 | |
| ApoE peptide | 484.9 | [M + 2H]2+ | Quantifier | 588.3 | 110 | 29 | 13 |
| 484.9 | [M + 2H]2+ | Qualifier | 489.3 | 110 | 27 | 13 | |
| ApoJ peptide | 772.3 | [M + 3H]3+ | Quantifier | 507.9 | 160 | 29 | 12 |
| 772.3 | [M + 3H]3+ | Qualifier | 650.9 | 160 | 23 | 14 | |
| ApoA-I peptide-IS | 620.0 | [M + 2H]2+ | Quantifier | 827.6 | 140 | 29 | 17 |
| ApoE peptide-IS | 489.9 | [M + 2H]2+ | Quantifier | 598.4 | 110 | 30 | 13 |
| ApoJ peptide-IS | 775.0 | [M + 3H]3+ | Quantifier | 511.9 | 150 | 28 | 11 |
Assay validation
Specificity was investigated by analyzing tryptic digestions of BSA. Linearity was evaluated by linear least-squares regression with a 1/x2 weighting using internal standard of duplicate calibration curves. Lower limit of the measuring interval (LLMI) was defined as the lowest concentration on the calibration curve which the signal to noise (S/N) was greater than 10. Carryover was assessed by analyzing double blank samples immediately after the highest calibrator samples. Accuracy and precision was evaluated by analysis of QC samples. Intra-assay accuracy and precision was determined at three concentration levels (low, medium and high) from six consecutive runs. Inter-assay accuracy and precision were assessed over three separate days with six replicates per day. Matrix effect was evaluated through the consistency between BSA matrix and human plasma.25 Spiking recovery was evaluated by spiking known standards into six different human plasma at low and high level concentrations. To assess the reproducibility and repeatability of the method, five replicates of five randomly picked plasma samples were tested. Since Apos were quantified by synthetic unique peptides in this study, we need to investigate the efficiencies of trypsin digestion (ETyp) to calibrate the test results of Apos. We prepared standard solutions of Apos, and conducted enzymatic hydrolysis according to the sample treatment process, tested the actual concentration, and investigate the enzymatic hydrolysis through the ratio of the actual concentration to the theoretical concentration.Patients and clinical study design
This study was reviewed and approved by the Research Ethics Committees in Beijing Chaoyang Hospital with the ethical approval number 2015-study-163. Informed consent was obtained from each participant. This study was designed as a case-control study. All the subjects were recruited from Beijing Chaoyang Hospital, whose clinical information was collected in December, 2019–Jun, 2020. And the stenosis severities of coronary lesions were assessed by coronary angiography (CAG). MI diagnosis is based on the assessment of symptoms, analysis of the surface electrocardiogram and serum biomarkers. The term acute myocardial infarction should be used when there is acute myocardial injury with clinical evidence of acute myocardial ischaemia and with detection of a rise and/or fall of cTn values with at least one value above the 99th percentile URL and at least one of the following: Symptoms of myocardial ischaemia; New ischaemic ECG changes; Development of pathological Q waves; Imaging evidence of new loss of viable myocardium or new regional wall motion abnormality in a pattern consistent with an ischaemic aetiology; Identification of a coronary thrombus by angiography or autopsy. Diabetes was defined if the participants reported having been diagnosed with type 2 diabetes mellitus (T2DM) by a physician and also reported meeting at least one of the following criteria: (1) fasting glucose ≥7.0 mmol L−1; (2) oral glucose tolerance test ≥11.1 mmol L−1; (3) use of antidiabetic medication. Subjects were excluded if they had any of the following: smoking or drinking addiction history within five years, liver or kidney dysfunction, psychiatric disorder, substance abuse disorder, recent acute surgery operation, a central neurological condition, pregnant female, or any other conditions which were concerned could interfere with the final result altering the lipid pattern.According to CAG results and myocardial infarction diagnosis, diabetes diagnosis, total of 67 subjects were divided into four groups. Group 1 (DA, T2DM with MI, n = 19), CAG positive (three branches lesion, and at least one branch showed 90% stenosis severity or worse), myocardial infarction positive, and diabetes positive. Group 2 (D, T2DM, n = 11), CAG negative or at most one branch showed 50% stenosis, myocardial infarction negative, and diabetes positive. Group 3 (M, MI, n = 15), CAG positive (three branches lesion, and at least one branch showed 90% stenosis severity or worse), myocardial infarction positive, and diabetes negative. Group 4 (C, Ctrl, n = 22), CAG negative or at most one branch showed 50% stenosis, myocardial infarction negative, and diabetes negative.
All the blood samples were obtained by peripheral venous puncture and collected into tube coated with anticoagulant (EDTA). A total of 3 mL blood would be collected at the same time of CAG operation, but before the contrast media injection. The collected blood samples were immediately centrifuged at 1750 g for 10 minutes at room temperature, then the supernatants were aliquoted into siliconized Eppendorf tubes and stored at −80 °C until use.
Results and discussion
Selection of unique peptides and optimization of LC-MS/MS conditions
For many years, basic and clinical researchers have taken advantage of the analytical sensitivity and specificity afforded by mass spectrometry in the measurement of proteins. Clinical laboratories are now beginning to deploy these work flows as well. For assays that use proteolysis to generate peptides for protein quantification and characterization, synthetic stable isotope-labeled internal standard peptides are of central importance.26 Target protein sequences were searched using UNIPROT tool (https://www.uniprot.org/) and in silico theoretical unique peptides for tryptic digestion of ApoA-I, ApoE, and ApoJ were analyzed by Skyline software. Combined with preliminary analysis of tryptic digestion of target proteins or human plasma by liquid chromatography-high resolution mass spectrometry (LC-HRMS), most of the unique peptides were excluded which could not be used for quantification purpose due to their molecular mass and size, the existence of unstable amino acid residues and posttranslational modifications (PTMs), as well as bad behavior of enzymatic hydrolysis efficiency and/or ionization efficiency. Finally, to ensure the analytical performance of each analyte, only one unique peptide of each apolipoprotein was chosen for quantitative purpose that was not present in any other known human proteins. The sequences of unique peptides of ApoA-I, ApoE, and ApoJ were R.QGLLPVLESFK.V, R.LGPLVEQGR.V, and R.VTTVASHTSDSDVPSGVTEVVVK.L respectively. The stable isotope labeled peptides QGLLPVLESFK* (13C6, 15N2), LGPLVEQGR* (13C6, 15N4), and VTTVASHTSDSDVPSGVTEVVVK* (13C6, 15N2) were synthesized as internal standard for quantitation.MS conditions were optimized using the synthesized peptide standards, and MS/MS spectrum of three unique peptides and their ISs were shown in Fig. 2. MRM transitions, collision energy, declustering potential and cell exit potential were listed in Table 1. Phenomenex Aeris WIDEPORE XB-C18 column was chosen which could improve the separation. Representative chromatogram of digestion of BSA, standards in digested BSA and digestion of human plasma (Fig. 3) showed excellent separation with optimization of gradient.
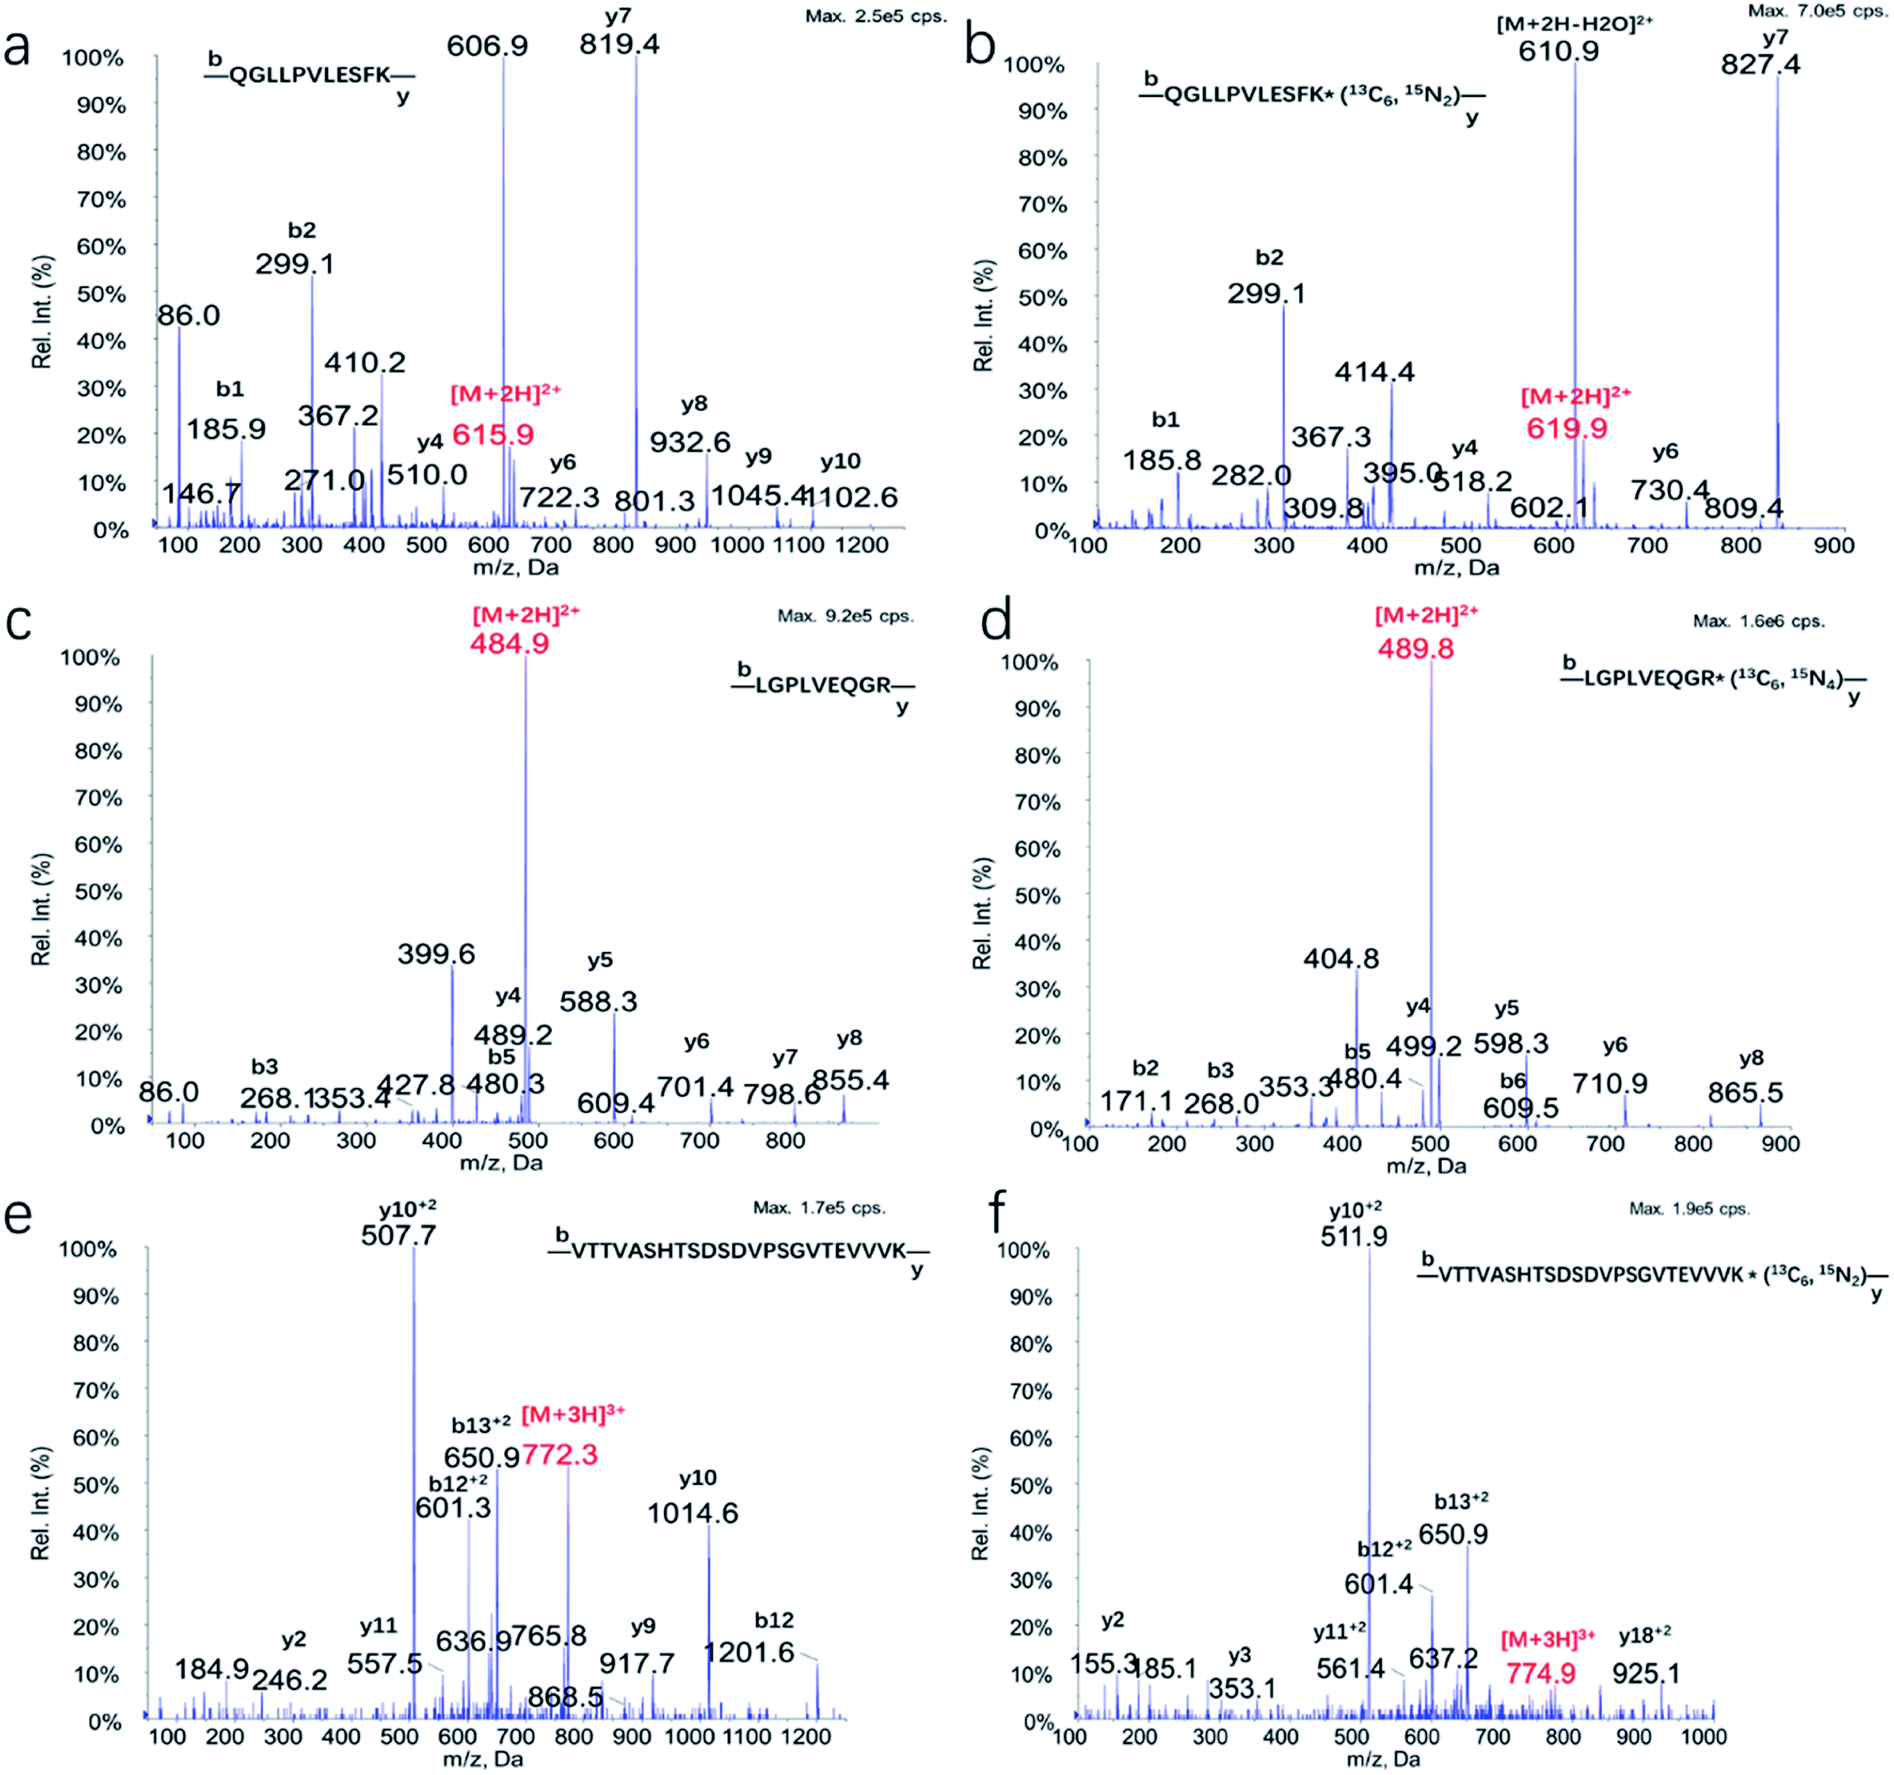 | ||
| Fig. 2 The representative MS/MS spectra of (a) ApoA-I peptide (R.QGLLPVLESFK.V), (b) ApoA-I peptide-IS (QGLLPVLESFK* (13C6, 15N2)), (c) ApoE peptide (R.LGPLVEQGR.V), (d) ApoE peptide-IS (LGPLVEQGR* (13C6, 15N4)), (e) ApoJ peptide (R.VTTVASHTSDSDVPSGVTEVVVK.L) and (f) ApoJ peptide-IS (VTTVASHTSDSDVPSGVTEVVVK* (13C6, 15N2)). | ||
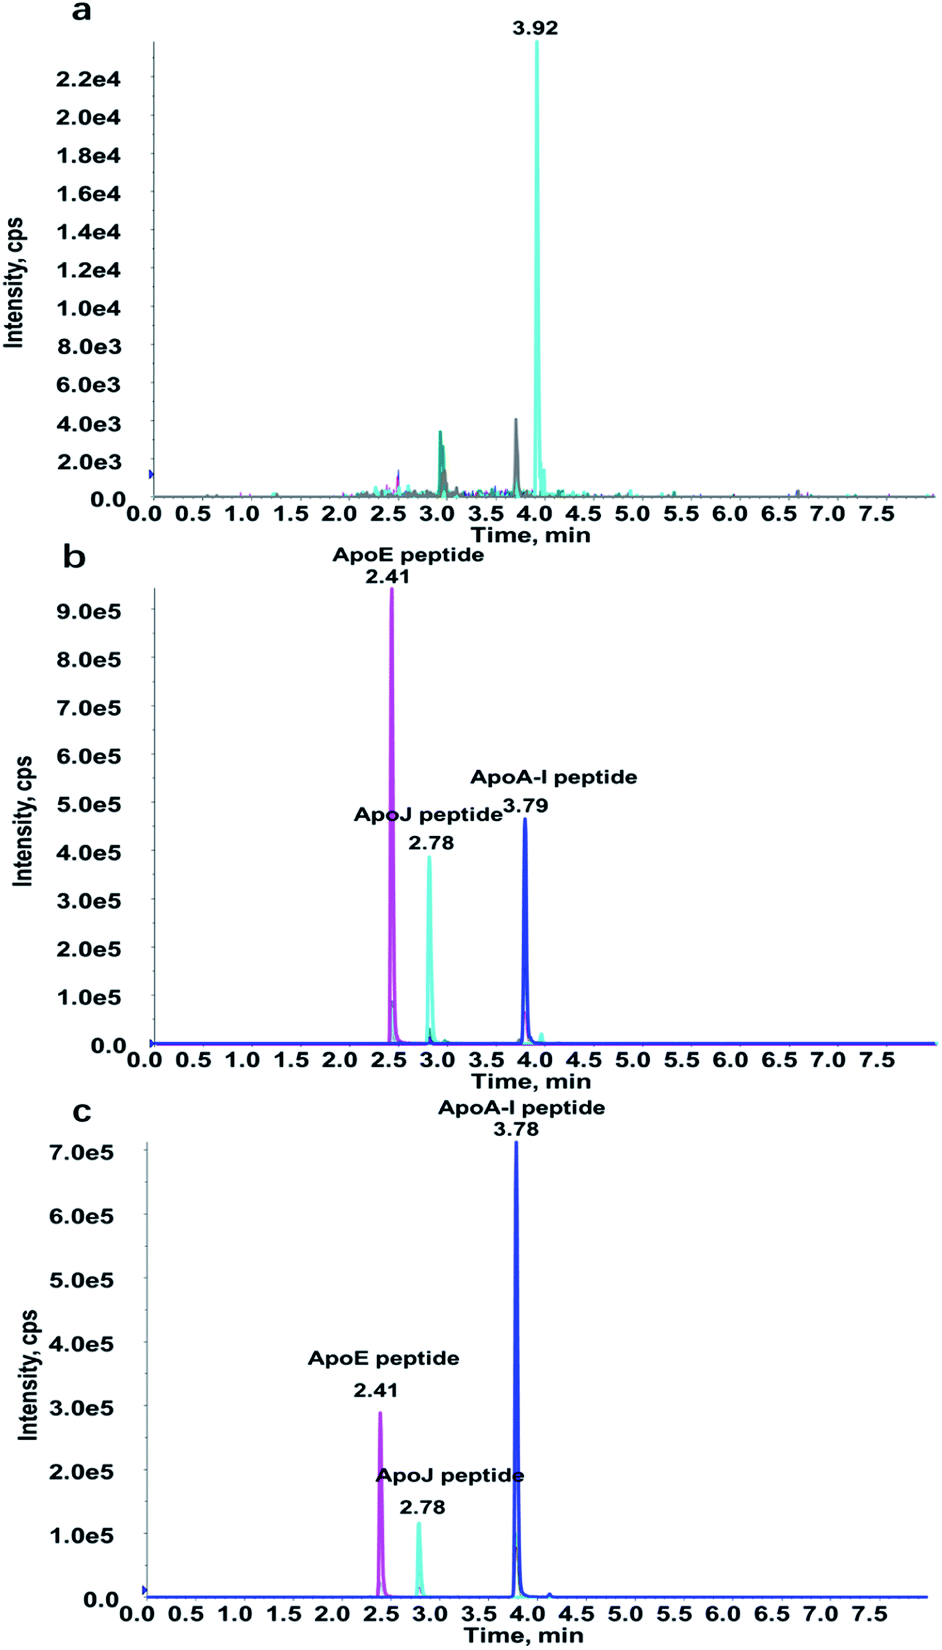 | ||
| Fig. 3 The representative chromatograms of (a) digestion of BSA (double blank sample), (b) standards in digested BSA, and (c) digestion of human plasma. | ||
Selection of substitute matrix and matrix effect
Due to the presence of endogenous Apos in human plasma, a suitable alternative matrix can effectively improve reliability and accuracy of the method. In particular, the introduction of surrogate matrix can also maximally reduce the adsorption effect of proteins and peptides. The same matrix type of other species is usually a priority option, such as rat or mice. However, it is of difficulty to obtain rats or mice plasma in clinical tests. Instead, the feasibility of tryptic digestion of BSA as an alternative matrix was investigated in this paper. The representative chromatograms of tryptic digestion of BSA an alternative matrix showed excellent specificity and selectivity (Fig. 3a). The consistency between tryptic digestion of BSA and human plasma was further evaluated. Six human plasma samples and BSA matrix sample were mixed in three different levels (4:1; 1:1; 1:4 v/v). The matrix effect was assessed by the equation S = R/T. R = area ratio (analyte/IS) of mixed sample, T = theoretical value of BSA matrix sample × proportion + area ratio (analyte/IS) of plasma sample × proportion.
The consistency was modest for all three peptides in different ratios of matrix and human plasma, spanning from 88.03% to 114.87%, and also met the acceptance criteria of <15% deviation with the CV from 2.56% to 11.19%. The influence of the assay matrix effect was detailed in Table 2. For all results within the acceptable range, our BSA matrix and human plasma had a high degree of consistency, which suggested matrix effects of BSA has a very limited effect on accuracy and precision.
| Analyte (concentration of matrix) | Matrix:Plasma (v:v) |
Average (%) | RSD (%) | Matrix effect (%) |
|---|---|---|---|---|
| ApoA-I peptide (813.21 pmol mL−1) | 4:1 |
100.77 | 2.56 | 97.63–104.89 |
| 1:1 |
99.77 | 4.92 | 91.87–104.93 | |
| 1:4 |
103.00 | 3.25 | 96.48–105.32 | |
| ApoE peptide (10.34 pmol mL−1) | 4:1 |
98.05 | 11.19 | 88.03–114.87 |
| 1:1 |
101.80 | 6.75 | 93.80–111.20 | |
| 1:4 |
99.72 | 4.32 | 93.64–104.74 | |
| ApoJ peptide (17.29 pmol mL−1) | 4:1 |
98.55 | 6.12 | 91.33–109.87 |
| 1:1 |
97.67 | 6.44 | 90.69–108.18 | |
| 1:4 |
96.64 | 5.66 | 91.52–107.34 |
Assay validation
The linearity of the assay was evaluated by regression analysis, and the correlation coefficient R2 values were 0.9978, 0.9989 and 0.9978 for ApoA-I, ApoE and ApoJ peptide respectively. All seven calibrator levels in duplicate resulted in excellent linearity for three peptides over the range 16.26–1626.41 pmol mL−1 of ApoA-I peptide, 1.03–103.35 pmol mL−1 of ApoE peptide and 0.86–86.46 pmol mL−1 of ApoJ peptide. Eight replicates of LLMI sample revealed high sensitivity with 4.37%, 10.39% and 7.83%RSD of ApoA-I peptide, ApoE peptide and ApoJ peptide respectively. Moreover, carryover was only observed of ApoJ peptide with 1.96% of LLMI well below the 20% standard. Intra- and inter-day accuracy (as relative error, RE) and precision (as RSD) were both <10% (Table 3) indicating the method is reliable and reproducible. Furthermore, the reproducibility and repeatability of sample preparation method was confirmed by evaluating of five extra human plasma samples in five replicates each with CV < 8% for each peptide (Table 4). In cases of both high and low addition concentrations, spiking recovery rate, i.e. accuracy of six random human plasma samples spiking analysis was 100.82–112.71%, 96.81–109.19%, 87.17–112.08% for ApoA-I peptide, ApoE peptide and ApoJ peptide respectively. The efficiencies of trypsin digestion (ETyp) were 48.07 ± 7.77%, 67.23 ± 9.78%, 55.11 ± 4.32% for ApoA-I, ApoE and ApoJ, respectively.| Analyte | Concentration (pmol mL−1) | Precision (RSD%) | Accuracy (RE%) | ||
|---|---|---|---|---|---|
| Nominal | Mean found | Intra-day | Inter-day | ||
| ApoA-I peptide | 48.78 | 51.38 | 4.46 | 3.83 | 5.32 |
| 243.96 | 254.99 | 2.60 | 2.70 | 4.52 | |
| 1301.13 | 1326.98 | 3.15 | 2.11 | 1.98 | |
| ApoE peptide | 3.09 | 3.00 | 6.56 | 3.47 | −3.02 |
| 15.50 | 15.22 | 4.11 | 3.16 | −1.83 | |
| 82.68 | 81.16 | 2.50 | 0.78 | −1.84 | |
| ApoJ peptide | 2.58 | 2.68 | 5.92 | 6.68 | 3.85 |
| 12.97 | 13.25 | 3.28 | 2.97 | 2.15 | |
| 69.17 | 70.89 | 3.47 | 2.77 | 2.48 | |
| Analyte | Sample 1 | Sample 2 | Sample 3 | Sample 4 | Sample 5 | |||||
|---|---|---|---|---|---|---|---|---|---|---|
| Average (pmol mL−1) | RSD (%) | Average (pmol mL−1) | RSD (%) | Average (pmol mL−1) | RSD (%) | Average (pmol mL−1) | RSD (%) | Average (pmol mL−1) | RSD (%) | |
| ApoA-I peptide | 639.71 | 3.38 | 564.08 | 5.81 | 720.61 | 4.56 | 737.07 | 7.26 | 496.44 | 4.41 |
| ApoE peptide | 10.22 | 4.76 | 9.20 | 4.23 | 7.83 | 5.50 | 13.04 | 5.88 | 14.22 | 6.28 |
| ApoJ peptide | 26.32 | 3.36 | 25.91 | 1.95 | 25.23 | 4.88 | 27.22 | 6.02 | 25.23 | 4.65 |
Application to clinical samples
The characteristics of four groups are shown in Table 5. Values are presented as mean ± standard deviation. The superscript letter indicates significant difference between groups at P < 0.05, respectively, according to ANOVA analysis. There was no significant difference on ages among groups. Patients in T2DM with AMI group had higher fasting plasma glucose (FPG) compared with control group, patients in T2DM group had higher LDL-C compared with control group, patients in AMI group had higher FPG and LDL-C compared with control group.| Variable | T2DM with AMI | T2DM | AMI | Control |
|---|---|---|---|---|
| a Abbreviations: FPG, fasting plasma glucose; TC, total cholesterol; HDL-C, high density lipoprotein; LDL-C, low density lipoprotein; TG, triglyceride; SBP, systolic blood pressure; DBP, diastolic blood pressure. | ||||
| N (male/female) | 11/8 | 5/6 | 11/4 | 10/12 |
| Age (years) | 64.11 ± 2.47 | 61.55 ± 3.703 | 63.13 ± 2.71 | 62.32 ± 2.29 |
| FPG (mmol L−1) | 9.11 ± 0.70*** | 5.81 ± 0.71 | 5.61 ± 0.36* | 4.79 ± 0.14 |
| TC (mmol L−1) | 4.45 ± 0.26 | 4.11 ± 0.25 | 4.57 ± 0.27* | 3.85 ± 0.16 |
| HDL-C (mmol L−1) | 0.90 ± 0.05 | 0.92 ± 0.06 | 1.11 ± 0.09 | 1.07 ± 0.08 |
| LDL-C (mmol L−1) | 2.29 ± 0.89 | 2.90 ± 0.24** | 2.92 ± 0.30* | 2.38 ± 0.59 |
| TG (mmol L−1) | 1.99 ± 0.19 | 1.59 ± 0.17 | 1.62 ± 0.25 | 1.57 ± 0.25 |
| SBP (mmHg) | 137.8 ± 4.18 | 138.6 ± 3.28 | 124.1 ± 4.03 | 135.9 ± 4.11 |
| DBP (mmHg) | 76.32 ± 2.47 | 77.82 ± 3.92 | 75.67 ± 3.16 | 79.73 ± 2.84 |
All the plasma samples collected from the 67 subjects of the four groups were tested by the established LC-MS/MS method and the concentrations of peptide (Cpeptide) were obtained. The concentrations of Apos (CApos) were assessed by the equation CApos = Cpeptide × MApos/Mpeptide/ETyp. MApoA-I = 30759.94 g M−1, MApoE = 36132.76 g M−1, MApoJ = 52462.01 g M−1, MApoA-Ipeptide = 1230.71 g M−1, MApoEpeptide = 968.55 g M−1, MApoJpeptide = 2314.18 g M−1.
The validated LC-MS/MS method is suitable for the quantitative determination of Apos in plasma. The concentrations of Apos are shown in Fig. 4. For ApoA-I and ApoJ, diabetes mellitus groups were significantly higher than diabetes mellitus complicated with myocardial infarction group, myocardial infarction group and control group. Diabetes mellitus complicated with myocardial infarction group was significantly lower than control group for ApoA-I. There was no significant difference among the four groups for ApoE. It can be seen that diabetes significantly increased the concentrations of ApoA-I and ApoJ. However, when complicated with cardiovascular disease, the functions as apolipoproteins in HDL played greater role that proved why the concentrations altered in diabetes mellitus complicated with myocardial infarction group. Meanwhile, The sample size form 67 subjects of the four groups was too small, there might be systematic bias.
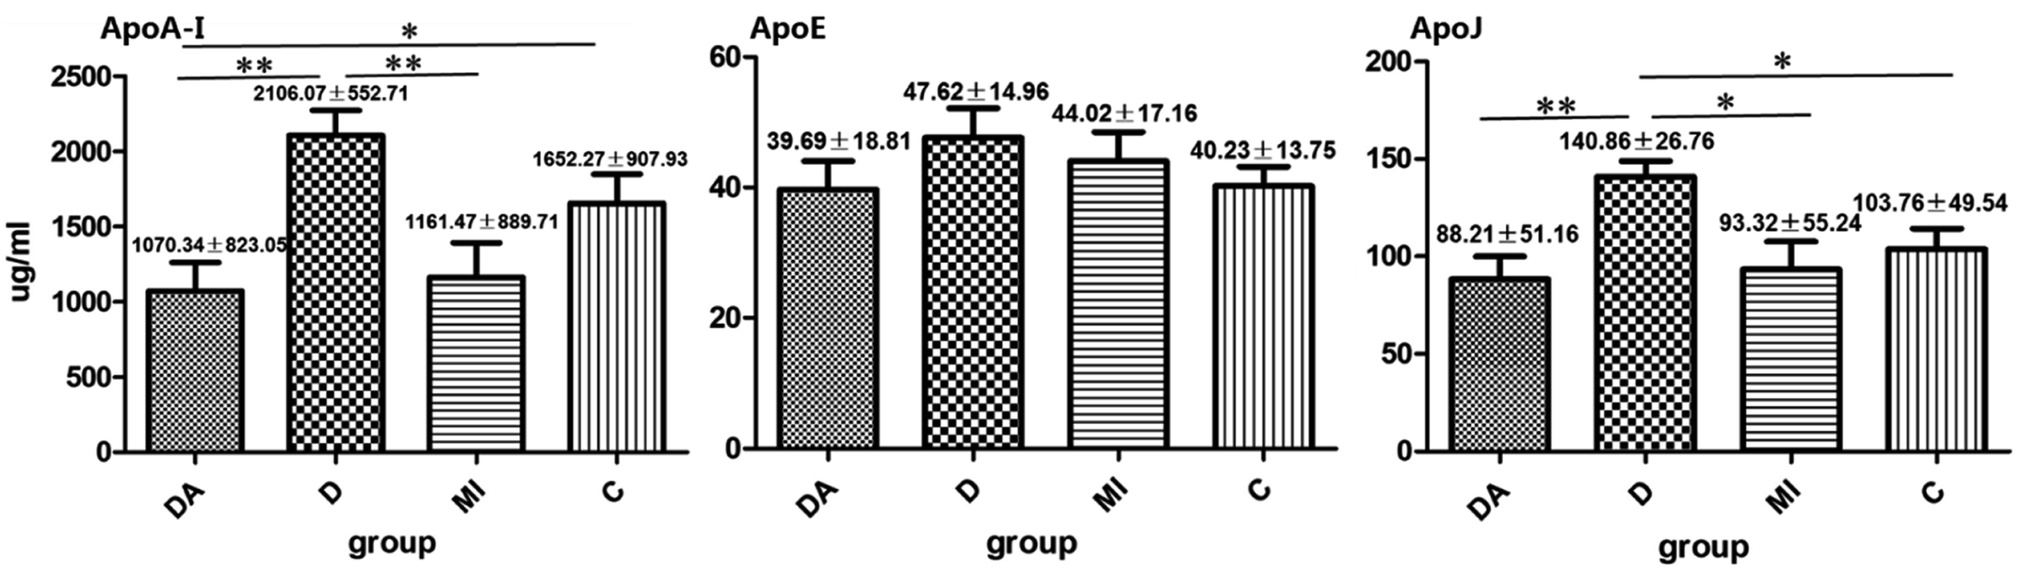 | ||
| Fig. 4 The concentrations of Apos from the 67 subjects of the four groups. Group 1 (DA, T2DM with MI, n = 19), CAG positive (three branches lesion, and at least one branch showed 90% stenosis severity or worse), myocardial infarction positive, and diabetes positive. Group 2 (D, T2DM, n = 11), CAG negative or at most one branch showed 50% stenosis, myocardial infarction negative, and diabetes positive. Group 3 (M, MI, n = 15), CAG positive (three branches lesion, and at least one branch showed 90% stenosis severity or worse), myocardial infarction positive, and diabetes negative. Group 4 (C, Ctrl, n = 22), CAG negative or at most one branch showed 50% stenosis, myocardial infarction negative, and diabetes negative. | ||
Deficiency and improvement
According to the needs, the three Apos apoA-I, ApoE and ApoJ were quantified simultaneously by LC-MS/MS. In the actual clinical works, Apos mainly include apoA-I, apoA-II, apoB, apoC-I, apoC-II, apoC-III, ApoE, ApoJ etc. Some of the above Apos have been tested in the hospital laboratory department, and others have not been explored in this study due to standard proteins, peptides and characteristic peptides. The follow-up can be carried out according to the needs of the work.Another disadvantage of this research method was that only one unique peptide for quantitative analysis was selected for each Apo. In order to further improve the accuracy, it was recommended to select at least two characteristic peptides for detection in future work. It is usually better to quantify different peptides and show good consistency of results obtained across different peptides.27
Conclusions
In conclusion, MS-based clinical diagnosis is a valuable tool for improving detecting of the molecular basis of certain disease. Here, we have developed a sensitive LC-MS/MS method with MRM for triplex quantification of serum/plasma ApoA-I, ApoE and ApoJ. Sample preparation method reduces the amount of plasma samples to 2 μL. This triplex assay has been demonstrated that each peptides and quantification transition for ApoA-I, ApoE and ApoJ could be determined simultaneously without interference. LLMI of target ApoA-I, ApoE and ApoJ reaches 16.26, 1.03 and 0.86 pmol mL−1. Therefore this new assay would provide a major advantage for ApoA-I, ApoE and ApoJ, and may provide an alternative method for future clinical applications.Author contributions
All the authors have accepted responsibility for the entire content of this submitted manuscript and approved submission. All authors have read and agreed to the published version of the manuscript. Pengfei Li: conceptualization, methodology, validation, writing – original draft, writing – review & editing, project administration. Yuting Cong: methodology, validation, writing – original draft. Wen Zhang: project administration, data curation. Lefeng Wang: sample collection. Lulu Ren: investigation. Xin Li: sample collection. Song Yang: investigation. Zhiyong Zhang: sample collection. Guoqing Li: writing – review & editing, supervision. Lihong Liu: conceptualization, writing – review & editing, funding acquisition.Conflicts of interest
Authors Yuting Cong, Guoqing Li was employed by Shanghai AB Sciex Analytical Instrument Trading Co. Ltd. The remaining authors declare that the research was conducted in the absence of any commercial or financial relationships that could be construed as a potential conflict of interest.Acknowledgements
This work was supported by the Science and Technology Innovation Fund of Beijing Chao-Yang Hospital, National Natural Science Foundation of China [81641016, 81603197].References
- P. Zhang, J. Gao, C. Pu and Y. Zhang, Apolipoprotein status in type 2 diabetes mellitus and its complications (Review), Mol. Med. Rep., 2017, 16(6), 9279–9286 CrossRef CAS PubMed.
- B. Lamarche, S. Moorjani, P. J. Lupien, B. Cantin, P. M. Bernard and G. R. Dagenais, et al., Apolipoprotein A-I and B levels and the risk of ischemic heart disease during a five-year follow-up of men in the Québec cardiovascular study, Circulation, 1996, 94(3), 273–278 CrossRef CAS PubMed.
- G. Walldius and I. Jungner, The apoB/apoA-I ratio: a strong, new risk factor for cardiovascular disease and a target for lipid-lowering therapy–a review of the evidence, J. Intern. Med., 2006, 259(5), 493–519 CrossRef CAS PubMed.
- E. J. Rhee, C. D. Byrne and K. C. Sung, The HDL cholesterol/apolipoprotein A-I ratio: an indicator of cardiovascular disease, Curr. Opin. Endocrinol., Diabetes Obes., 2017, 24(2), 148–153 CrossRef PubMed.
- K. Winkler, M. M. Hoffmann, V. Krane, W. März, C. Drechsler and C. Wanner, Apolipoprotein E genotype predicts cardiovascular endpoints in dialysis patients with type 2 diabetes mellitus, Atherosclerosis, 2010, 208(1), 197–202 CrossRef CAS PubMed.
- A. D. Marais, Apolipoprotein E in lipoprotein metabolism, health and cardiovascular disease, Pathology, 2019, 51(2), 165–176 CrossRef CAS PubMed.
- E. K. Valanti, A. Chroni and D. Sanoudou, The future of apolipoprotein E mimetic peptides in the prevention of cardiovascular disease, Curr. Opin. Lipidol., 2019, 30(4), 326–341 CrossRef CAS PubMed.
- R. Liutkeviciene, A. Vilkeviciute, A. Smalinskiene, A. Tamosiunas, J. Petkeviciene and D. Zaliuniene, et al., The role of apolipoprotein E (rs7412 and rs429358) in age-related macular degeneration, Ophthalmic Genet., 2018, 39(4), 457–462 CrossRef CAS PubMed.
- M. H. Antonelou, A. G. Kriebardis, K. E. Stamoulis, I. P. Trougakos and I. S. Papassideri, Apolipoprotein J/Clusterin is a novel structural component of human erythrocytes and a biomarker of cellular stress and senescence, PLoS One, 2011, 6(10), e26032 CrossRef CAS PubMed.
- A. Turkieh, M. Fertin, M. Bouvet, P. Mulder, H. Drobecq and G. Lemesle, et al., Expression and Implication of Clusterin in Left Ventricular Remodeling After Myocardial Infarction, Circ.: Heart Failure, 2018, 11(6), e004838 CAS.
- D. Bradley, A. Blaszczak, Z. Yin, J. Liu, J. J. Joseph and V. Wright, et al., Clusterin Impairs Hepatic Insulin Sensitivity and Adipocyte Clusterin Associates With Cardiometabolic Risk, Diabetes Care, 2019, 42(3), 466–475 CrossRef CAS PubMed.
- L. Koller, B. Richter, M. P. Winter, P. Sulzgruber, C. Potolidis and F. Liebhart, et al., Clusterin/apolipoprotein J is independently associated with survival in patients with chronic heart failure, J. Clin. Lipidol., 2017, 11(1), 178–184 CrossRef PubMed.
- L. Ren, F. Han, L. Xuan, Y. Lv, L. Gong and Y. Yan, et al., Clusterin ameliorates endothelial dysfunction in diabetes by suppressing mitochondrial fragmentation, Free Radical Biol. Med., 2019, 145, 357–373 CrossRef CAS PubMed.
- I. Van den Broek, K. Sobhani and J. E. Van Eyk, Advances in quantifying apolipoproteins using LC-MS/MS technology: implications for the clinic, Expert Rev. Proteomics, 2017, 14(10), 869–880 CrossRef CAS PubMed.
- U. Ceglarek, J. Dittrich, S. Becker, F. Baumann, L. Kortz and J. Thiery, Quantification of seven apolipoproteins in human plasma by proteotypic peptides using fast LC-MS/MS, Proteomics: Clin. Appl., 2013, 7(11–12), 794–801 CAS.
- E. S. Lau, S. M. Paniagua, J. S. Guseh, V. Bhambhani, M. V. Zanni and P. Courchesne, et al., Sex Differences in Circulating Biomarkers of Cardiovascular Disease, J. Am. Coll. Cardiol., 2019, 74(12), 1543–1553 CrossRef CAS PubMed.
- A. Onat, A. Kaya and E. Ademoglu, Modified risk associations of lipoproteins and apolipoproteins by chronic low-grade inflammation, Expert Rev. Cardiovasc. Ther., 2018, 16(1), 39–48 CrossRef CAS PubMed.
- R. Wagner, J. Dittrich, J. Thiery, U. Ceglarek and R. Burkhardt, Simultaneous LC/MS/MS quantification of eight apolipoproteins in normal and hypercholesterolemic mouse plasma, J. Lipid Res., 2019, 60(4), 900–908 CrossRef CAS PubMed.
- V. Blanchard, D. Garçon, C. Jaunet, K. Chemello, S. Billon-Crossouard and A. Aguesse, et al., A high-throughput mass spectrometry-based assay for large-scale profiling of circulating human apolipoproteins, J. Lipid Res., 2020, 61(7), 1128–1139 CrossRef CAS PubMed.
- M. C. Christa, A. Harald and B. B. Ilijana, et al., Towards an SI-Traceable Reference Measurement System for Seven Serum Apolipoproteins Using Bottom-Up Quantitative Proteomics: Conceptual Approach Enabled by Cross-Disciplinary/Cross-Sector Collaboration, Clin. Chem., 2021, 67(3), 478–489 CrossRef PubMed.
- B. A. Parks, D. M. Schieltz, M. L. Andrews, M. S. Gardner, J. C. Rees and C. A. Toth, et al., High throughput quantification of apolipoproteins A-I and B-100 by isotope dilution MS targeting fast trypsin releasable peptides without reduction and alkylation, Proteomics: Clin. Appl., 2017, 11(7–8), 1600128 Search PubMed.
- M. A. Kuzyk, D. Smith, J. Yang, T. J. Cross, A. M. Jackson and D. B. Hardie, et al., Multiple reaction monitoring-based, multiplexed, absolute quantitation of 45 proteins in human plasma, Mol. Cell. Proteomics, 2009, 8(8), 1860–1877 CrossRef CAS PubMed.
- N. P. Smit, I. van den Broek, F. P. Romijn, M. Haex, A. M. Deelder and Y. E. van der Burgt, et al., Quality requirements for quantitative clinical chemistry proteomics, Transl. Proteomics, 2014, 2, 1 CrossRef CAS.
- Y. Cong, L. Hu, Z. Zhang, Y. Gao, M. Dong and H. Qin, et al., Analysis of therapeutic monoclonal antibody glycoforms by mass spectrometry for pharmacokinetics study, Talanta, 2017, 165, 664–670 CrossRef CAS PubMed.
- B. K. Matuszewski, M. L. Constanzer and C. M. Chavez-Eng, Strategies for the assessment of matrix effect in quantitative bioanalytical methods based on HPLC-MS/MS, Anal. Chem., 2003, 75(13), 3019–3030 CrossRef CAS PubMed.
- N. H. Andrew, R. W. Jeffrey and A. C. Steven, et al., Recommendations for the Generation, Quantification, Storage, and Handling of Peptides Used for Mass Spectrometry-Based Assays, Clin. Chem., 2016, 62(1), 48–69 CrossRef PubMed.
- M. M. Santica, C. F. Noémie and L. K. Marlys, et al., Development of an LC-MS/MS Proposed Candidate Reference Method for the Standardization of Analytical Methods to Measure Lipoprotein (a), Clin. Chem., 2021, 67(3), 490–499 CrossRef PubMed.
Footnote |
| † These authors contributed equally to this work. |
| This journal is © The Royal Society of Chemistry 2022 |