DOI:
10.1039/D2RA01967A
(Paper)
RSC Adv., 2022,
12, 16751-16762
An in situ grown amorphous ZrO2 layer on zeolite for enhanced phosphate adsorption†
Received
27th March 2022
, Accepted 19th May 2022
First published on 6th June 2022
Abstract
Zeolite supported amorphous metal oxide nanolayers with high specific surface area, abundant adsorption sites, and excellent reusability hold a bright prospect in the efficient removal of contaminants, yet it is proven to be still challenging to precisely regulate and control their synthesis. Herein, we reported a facile synthetic strategy for rational design and achieving the uniform and firm in situ growth of an amorphous ZrO2 layer decorated on the surface of zeolite (ZEO@AZ) for enhanced phosphate adsorption. The Langmuir isotherm model and pseudo-second order kinetic equation well described the adsorption process towards phosphate solution, and the synthetized ZEO@AZ exhibited an excellent maximum adsorption amount of 24.98 mgP g−1. Furthermore, the adsorption of phosphates on ZEO@AZ was confirmed to be chemisorption, endothermic and spontaneous. This approach for fabricating amorphous metal oxide nanolayers on a robust matrix may provide a new route for constructing composites with superb phosphate adsorption performance.
1. Introduction
With the rapid development of industrialization, urbanization and agricultural modernization in today's world, as the main limiting nutrient discharged into fresh water, excess phosphorus, even if its concentration is exceeding 0.05 mg L−1, will also severely affect the balance of original nutrients in water and become a critical factor, resulting in water eutrophication.1,2 Meanwhile, the global phosphate resources are currently facing an increasingly tight shortage situation from years of over-exploitation, which is due to phosphorus mineral resources with indispensable, irreplaceable, unrecyclable and non-renewable characteristics, as well as broad applications.3 Therefore, it is of great significance to develop an effective phosphate adsorption and recycling technology for the treatment of eutrophic water bodies and renewable utilization of phosphorus. Among various approaches for removing phosphates from wastewater, adsorption has been generally considered as the most facile and promising method because of its convenient operation, low-cost, high efficiency, and widespread application without secondary pollution.4–6 However, the adsorption efficiency of phosphates depends greatly on the adsorbents. Numerous studies have revealed that the metal oxides,7–10 MOFs,11,12 along with minerals13,14 and biomaterials15–17 have attracted considerable attention. However the inherent limitations of the above adsorbents on phosphate removal, such as low adsorption sites, poor adsorption kinetics, and the potential danger of secondary pollution, limit their industrial application.18
Many researchers have reported that ZrO2, a typical bi-functional material with both acidic and basic sites, displays significant adsorption effects of phosphates.19–21 Zr species actually easily generate a large quantity of hydroxyl ions and water molecules by hydrolysis, which are involved in the exchange of ligands with phosphate ions in target solution.22 Moreover, the competitive cost advantage and environmental friendliness and compatibility of ZrO2 also enhance its economy and application feasibility in environmental governance. Nevertheless, there still have been some choke-points that restrict the application of crystal ZrO2, such as limited adsorption sites, low capacity density, and narrow modulation range of composition and structure.23–25 Amorphous materials show good potential in phosphate adsorption due to their abundant unsaturated defect sites and high active centre density; it is thus imperative to conduct the design, synthesis and practical inquiry of amorphous ZrO2. In practice, however, the application of pure ZrO2 still faces a myriad of problems, such as high cost, low specific surface area, poor stability, and ticklish recycling.23 Based on the above reasons, it is a preferred solution to construct a robust substrate supported amorphous ZrO2 composite material for phosphorus removal. Among them, zeolites have attracted much attention as ideal adsorbent substrates owing to their well-ordered porous structure, extremely high specific surface area, superior absorbability and good sedimentation.26 Therefore, we have sufficient reasons to believe that zeolites have a satisfactory cooperative relationship with amorphous ZrO2.
Herein, we described a facile method for fabricating an amorphous ZrO2 layer decorated on the surface of zeolite (ZEO@AZ) by a conformal growth strategy, and the application of the ZEO@AZ as a recyclable adsorbent towards phosphate removal from aqueous water was systematically investigated. Although several published literature studies on crystalline ZrO2 and its utilization as an adsorbing material have been reported,27,28 to date, the studies about amorphous ZrO2 with unique conformal growth structures and abundant adsorption sites still are limited. Thereby, the adsorption isotherms, kinetic models and thermodynamic parameters were applied to investigate the phosphate adsorption performance from synthetic solution on ZEO@AZ and the counterparts by batch experiments. The effects of water quality conditions (i.e. solution pH, ion strength and co-existing ions) on phosphate adsorption were further analysed in detail. Our findings demonstrated that ZEO@AZ had superior phosphate adsorption performance and good recycling performance. This research presented here can inspire more applications towards an advanced adsorption technology that requires heterogeneous structures enabled by such amorphous metallic oxide nanomaterials.
2. Materials and methods
2.1. Materials
Tris(hydroxymethyl)aminomethane (C4H11NO3, ≥99.8%), zirconyl chloride octahydrate (ZrOCl2·8H2O, ≥99.9%), zeolite (ZEO, ≥97%) and potassium phosphate monobasic (KH2PO4, ≥99.5%) were purchased from Shanghai Macklin Biochemical Co., Ltd, and hydrochloric acid (HCl 36.0–38.0%), ethyl alcohol (C2H6O, ≥99.5%), sodium hydroxide (NaOH, ≥96%), sodium chloride (NaCl, ≥99.8%), sodium nitrate (NaNO3, ≥99%), sodium sulfate (Na2SO4, ≥99%) and sodium bicarbonate (NaHCO3, ≥99.5%) were obtained from Sinopharm Chemical Reagent Co., Ltd. All reagents were used without any further refinement.
2.2. Synthesis of adsorbents
ZEO@AZ adsorbent was prepared according to the method proposed previously with appropriate modifications.29 Briefly, 0.6057 g C4H11NO3 and 0.33 μL HCl were dissolved in 50 mL deionized water with magnetic stirring at 500 rpm for 10 min, and then 0.2 g zeolite and 0.0483 g ZrOCl2·8H2O powders were added to the solution with magnetic stirring at 500 rpm for 10 min and ultrasonic treatment for 15 min, respectively. The well-dispersed suspension was further transferred to an ice-water bath at 4 °C for 2 h and an oil bath at 60 °C for 4 h under continuous stirring, respectively. After centrifugation, washing and drying, the products were dissolved in 20 mL ethyl alcohol in a hydrothermal reactor at 80 °C for 12 h to acquire the ZEO@AZ. For comparison, the products after centrifugal collection were calcined in a muffle furnace at 450 °C for 2 h to obtain the crystalline zirconia layer decorated on zeolite (ZEO@CZ), and the same synthetic procedure as ZEO@AZ except for the step of adding zeolite was performed to obtain the non-loaded amorphous and sheet-like ZrO2 (AZ).
2.3. Characterization
The morphology of adsorbents was examined using a scanning electron microscope (SEM, Shimadzu JEOL 7600F) and transmission electron microscope (TEM, Shimadzu JEOL JEM-2100F). The functional groups were characterized with an infrared spectrometer (IR, Thermo Nicolet NEXUS-470). The N2 adsorption–desorption isotherms were obtained using a surface area & pore size analyser (Micromeritics ASAP 2460). The zeta potentials of adsorbents at different pH levels were measured using a potentiometric analyzer (Zetasizer Nano ZS90).
2.4. Batch adsorption experiments
As one of the main phosphate sources leading to eutrophication, KH2PO4 was selected as an adsorption target to examine the adsorption behaviour of phosphates on ZEO@AZ and its counterparts by batch experiments.
For the adsorption isotherms, 50 mL KH2PO4 solution with different initial phosphate concentrations ranging from 0 to 80 mg L−1 (calculated by the mass of phosphorus) were oscillated with 80 mg adsorbents in a thermostatic oscillator at 25 °C at a speed of 200 rpm for 24 h. For the adsorption kinetics, 320 mg adsorbents and 200 mL 50 mg L−1 KH2PO4 solution were put into a conical flask which was placed in a thermostatic oscillator at 25 °C at a speed of 200 rpm for 24 h. At regular time intervals (2 min, 5 min, 10 min, 30 min, 60 min, 120 min, 240 min, 480 min, 720 min, 1080 min, and 1440 min), the samples were taken out for phosphate concentration analysis. For the adsorption thermodynamics, 50 mL of KH2PO4 solution with the phosphate concentration of 50 mg L−1 were oscillated with 80 mg adsorbents in a thermostatic oscillator at different temperatures (25 °C, 35 °C, and 45 °C) at a speed of 200 rpm for 24 h.
To evaluate the practicability of the as-prepared adsorbents, the adsorption performance of ZEO@AZ and the counterparts toward different types of water quality, as well as the recycling performance were systematically investigated. The effect of solution pH and ionic strength on phosphate adsorption was studied by a similar procedure mentioned above. KH2PO4 solution (50 mL, 50 mg L−1) with 0 mol L−1, 0.01 mol L−1 and 0.5 mol L−1 NaCl was mixed with 80 mg adsorbents at an initial pH of 3–11, which was adjusted by adding 0.1 mol L−1 HCl or NaOH solution. Four types of co-existing anions, including the sodium salt forms of chloride, nitrate, sulfate and bicarbonate, were taken as examples to evaluate the adsorption selectivity of various adsorbents. KH2PO4 solution (50 mL, 20 mg L−1) with different initial concentrations of NaCl, NaNO3, Na2SO4 and NaHCO3 was vibrated with 80 mg adsorbents in the oscillator, respectively. To investigate the recycling performance, the adsorbents with adsorbed phosphates were immersed into 0.1 mol L−1 NaOH solution to dissolve phosphates several times. The regenerated adsorbents were used to measure phosphate adsorption performance for another new cycle. The adsorption–desorption–regeneration experiments were performed five times.
Phosphate concentrations in liquid samples were analysed by Mo–Sb anti-spectrophotometry method, and more details are provided in ESI appendix.† The adsorptive capacity towards phosphates was calculated based on the equation of Qt = (C0 − Ct)V/m, where Qt (mg g−1) is the adsorptive capacity at the designated time; C0 (mg L−1) and Ct (mg L−1) are the concentrations of phosphates at the initial and designated time, respectively; V (L) is the solution volume; m (g) is the weight of the adsorbent. Unless stated, all concentrations involved in our text refer to the phosphate concentrations, which are calculated by the mass of phosphorus in the solution.
3. Results and discussion
3.1. Characterization of adsorbents
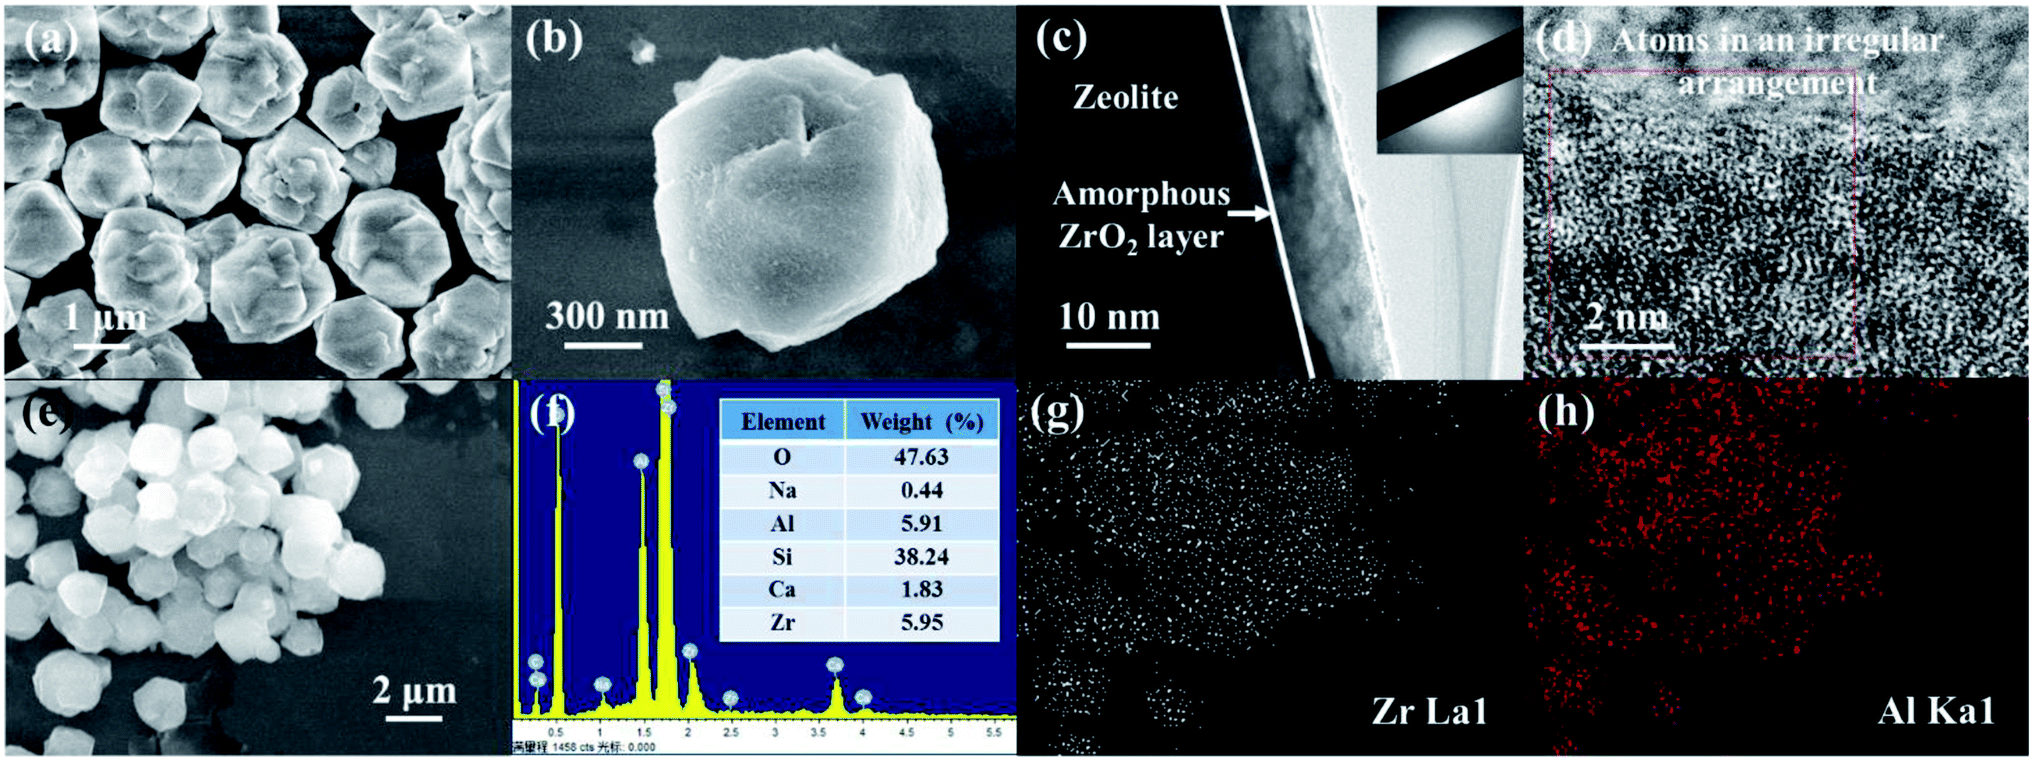
The representative micrograph of the as-prepared ZEO@AZ at low magnification in Fig. 1a reveals that ZEO@AZ retains the original morphology as that of the pristine zeolite (Fig. S2†).The adsorbent particles can be uniformly dispersed in aqueous solution without any agglomeration with an average diameter of 2.41 μm (see more details in ESI appendix, Fig. S3†). Fig. 1b clearly depicts the layered depositional surface and resulting crumples after in situ growth of a zirconia layer on zeolite. As exhibited in Fig. 1c, the TEM image of ZEO@AZ shows a distinct thin layer with a thickness of about 10 nm decorated on the surface of incipient zeolite. The selected area electron diffraction (SAED) image displays a noticeable scattered and hazy halo, which demonstrates that the zirconia layer is in an amorphous state.30,31 The high-resolution TEM (HR-TEM) image discloses no distinct lattice fringes or regular arrangement of atoms at the edges of the composite, which has directly and strongly demonstrated the amorphous feature of the zirconia layer and is consistent with the result of SAED pattern. The energy-dispersion spectroscopy (EDS) result indicates the presence of O, Na, Al, Si, Ca and Zr elements in the ZEO@AZ adsorbent with an O/Na/Al/Si/Ca/Zr weight ratio of about 47.63![[thin space (1/6-em)]](https://www.rsc.org/images/entities/char_2009.gif) :0.44:5.91:38.24:1.83:5.95 (Fig. 1e and f), which is basically in accordance with the additive proportion in the synthetic process. Furthermore, the EDS element mappings in Fig. 1g and h demonstrate the uniform distribution of Zr and Al, suggesting the relatively homogeneous distribution of the amorphous ZrO2 layer anchored with the surface of zeolite. XRD pattern of the ZEO@AZ composite is presented in Fig. S4.† The characteristic peaks of ZEO@AZ are consistent with those of the initial zeolite, whereas the peaks of ZrO2 cannot be observed. This result reveals that the amorphous zirconia is mainly responsible for no zirconia peak observed in the ZEO@AZ, which is well in agreement with the HR-TEM result.
:0.44:5.91:38.24:1.83:5.95 (Fig. 1e and f), which is basically in accordance with the additive proportion in the synthetic process. Furthermore, the EDS element mappings in Fig. 1g and h demonstrate the uniform distribution of Zr and Al, suggesting the relatively homogeneous distribution of the amorphous ZrO2 layer anchored with the surface of zeolite. XRD pattern of the ZEO@AZ composite is presented in Fig. S4.† The characteristic peaks of ZEO@AZ are consistent with those of the initial zeolite, whereas the peaks of ZrO2 cannot be observed. This result reveals that the amorphous zirconia is mainly responsible for no zirconia peak observed in the ZEO@AZ, which is well in agreement with the HR-TEM result.
 |
| | Fig. 1 SEM images of ZEO@AZ at different magnifications (a and b), TEM images of ZEO@AZ at different magnifications (c and d), the illustration in (c) shows the corresponding SAED pattern, EDS image and result analysis of ZEO@AZ (e and f), and EDS elemental mappings of ZEO@AZ derived from (e) (g and h). | |
The in situ growth of the amorphous ZrO2 layer on zeolite constructs the hierarchical structure, endowing the ZEO@AZ adsorbent with dramatically high specific surface area. The N2 adsorption–desorption isotherm was measured to analyse the specific surface area and pore distribution. As illustrated in Fig. 2, the isotherm of ZEO@AZ is identified as type IV in the Brunauer classification, in accordance with that of pristine zeolite (Fig. S5a†). The type IV isotherm verifies the presence of diversified adsorptive behaviours, involving monolayer adsorption, multilayer adsorption and capillary condensation,32 which are characteristics of mesoporous materials. Observably, the isotherm of ZEO@AZ exhibits a narrow hysteresis loop over the region of 0.4 < P/P0 < 1, demonstrating the persistent capillary evaporation and condensation on N2 during the adsorption processes.19 The pore-size distribution (inset in Fig. 2) obtained from the adsorption branch of N2 isotherms by the Barrett–Joyner–Halenda (BJH) method indicates that the pore sizes are mainly from 2 to 50 nm in ZEO@AZ and the average pore diameter is 4.38 nm. These pores mainly arise from the open-framework structure of zeolite, which can be confirmed by the inset in Fig. S5a.† Moreover, the BET specific surface area of ZEO@AZ, calculated from the N2 isotherm at −196 °C, is found to be as much as about 290 m2 g−1. By contrast, the AZ sample with the feature of type II isotherm has only a negligible surface area of 4.19 m2 g−1, which can be assigned to the physical adsorption on nonporous or macroporous materials (Fig. S5b†). Accordingly, in situ growth of the amorphous ZrO2 layer on zeolite plays in no significant reducing the inherent BET specific area of zeolite and further expose the adsorption sites of zirconia for subsequent phosphate removal.
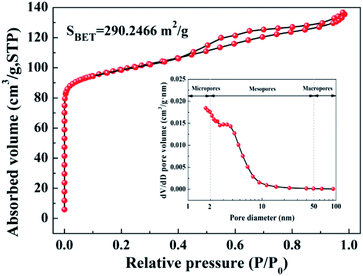 |
| | Fig. 2 N2 adsorption–desorption isotherm and BJH pore-size distribution plots (inset) from the adsorption branch of the isotherm of ZEO@AZ. | |
3.2. Adsorption isotherms
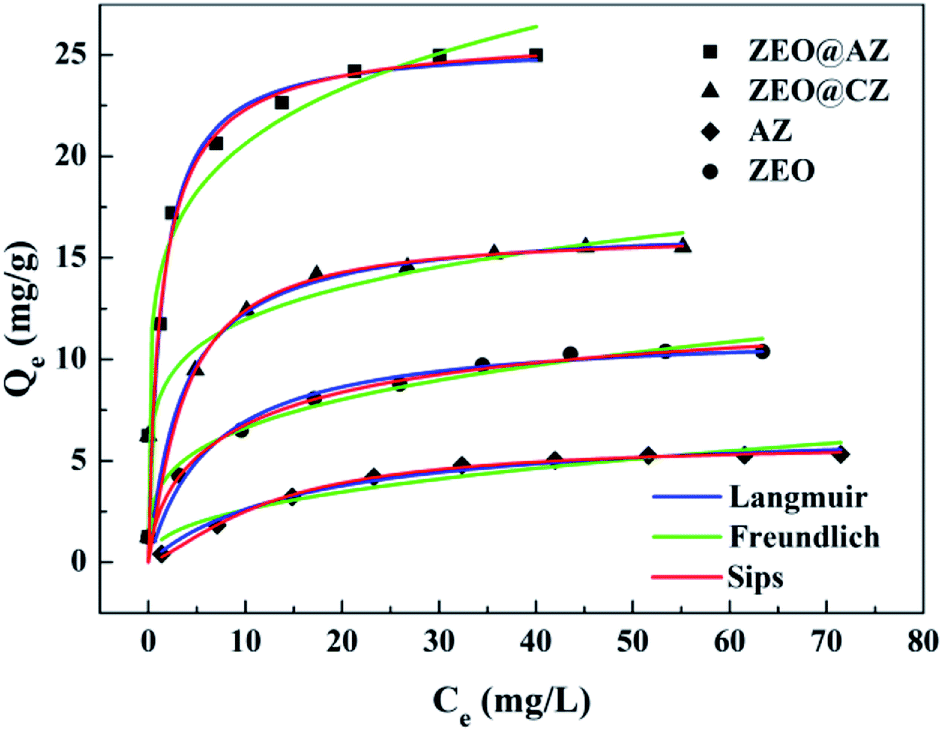
We tested the adsorption isotherms of phosphates on four types of adsorbing materials (i.e., ZEO@AZ, ZEO@CZ, AZ and ZEO). All the adsorbing materials were characterized by the same adsorption procedure and evaluated in 50 mL of KH2PO4 solution with the initial phosphate concentrations ranging from 0 to 80 mg L−1. The adsorption capacity Qe (mg g−1) is of paramount importance in estimating the adsorption abilities of materials. As can be seen from Fig. 3, the adsorption capacity of phosphates originally multiplies with the increase of initial phosphate concentrations in the range of 0–20 mg L−1 and eventually tends to be balanceable after it approaches the maximum adsorption capacity. It is the powerful driving force between adsorbents and adsorbates under higher initial concentrations of phosphates that may be responsible for the enhanced adsorption capacity, while the gradually saturated adsorptive sites of adsorbents make the absorption level out after the initial ramp-up. Remarkably, the composite adsorbents (i.e., ZEO@AZ and ZEO@CZ) show better phosphate adsorption ability than the single material (i.e., ZEO and AZ), which may be attributed to the sufficient exposed area (confirmed by Fig. 2) and abundant adsorption sites after the conformal growth of the ZrO2 layer decorated on zeolite. Of these, ZEO@AZ exhibits a higher adsorption capacity of 25.0 mg g−1 than the relevant ZEO@CZ, substantiating the important role in phosphate removal played by the amorphous ZrO2 layer with a unique disordered structure and abundant defects. The conclusion presented above is consistent with previous reports,23,33 where amorphous nanomaterials with flexible adjustment and control of structure and high-density active sites exhibited superior adsorption activity in comparison with their crystalline counterparts for the past few years.
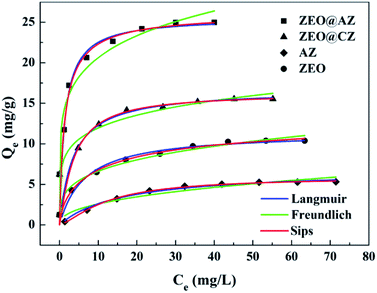 |
| | Fig. 3 Phosphate adsorption isotherms with results fitted to Langmuir, Freundlich and Sips equations of ZEO@AZ and its counterparts (T = 298 K, t = 24 h). | |
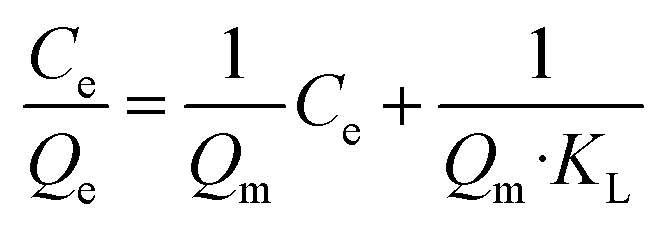
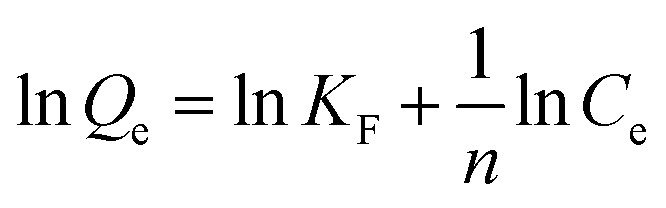
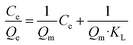
More importantly, the phosphate adsorption process is further fitted by two typical adsorption isotherm models, i.e., Langmuir and Freundlich equations, which are described in eqn (1) and (2), respectively.
| |
 | (1) |
| |
 | (2) |
where
Ce (mg L
−1) is the phosphate concentration at adsorption equilibrium;
Qe (mg g
−1) is the adsorption capacity;
Qm (mg g
−1) is the maximum theoretical adsorption capacity; the values of
KL (L mg
−1) and
KF (mg g
−1) are Langmuir and Freundlich adsorption constants, respectively;
n is the equilibrium constant.
The fitted results for phosphate adsorption derived from Langmuir and Freundlich isotherm models are displayed in Table 1, and the relevant parameters are calculated from the slope and intercept of linearized plots (ESI appendix, Fig. S6†). It is demonstrated that the Langmuir model is preferable to describe the process of phosphate adsorption owing to its higher correlation coefficient (R2 of 0.985–0.999) than that of Freundlich (R2 of 0.883–0.970). The successful fitting by Langmuir model indicates the mechanism of a monolayer adsorption on the surface of adsorbing materials, and the negligible interactions between Zr(IV) and phosphate anions.34 Similar results have been reported when ZrO2 NPs/SiO2 membrane,19 Fe3O4@ZrO2 composite,22 PANI-ZrO2 composite,35 etc. were employed as adsorbents to adsorb phosphates. In particular, the theoretical maximum adsorption capacities, normally inaccessible by experiment methods, towards phosphates on ZEO@AZ, ZEO@CZ, AZ and ZEO are calculated to be 25.4 mg g−1, 15.9 mg g−1, 6.96 mg g−1 and 11.1 mg g−1 by the Langmuir model, which are much closer to experimental values (22.9 mg g−1, 14.2 mg g−1, 5.06 mg g−1 and 9.66 mg g−1).
Table 1 Isotherm parameters for phosphate adsorption by different adsorbents derived from Langmuir, Freundlich and Sips models
| Adsorbent |
Langmuir |
Freundlich |
Sips |
| Qm (mg g−1) |
KL (L mg−1) |
R2 |
KF (mg g−1) |
n |
R2 |
AS |
KS |
n |
R2 |
| ZEO@AZ |
25.4065 |
1.1056 |
0.9991 |
12.9487 |
5.0161 |
0.8832 |
19.3781 |
0.7383 |
0.8840 |
0.9081 |
| ZEO@CZ |
15.8705 |
0.6175 |
0.9960 |
7.4499 |
5.0615 |
0.8851 |
3.5905 |
0.2214 |
1.1681 |
0.9283 |
| AZ |
6.9575 |
0.0550 |
0.9849 |
0.4300 |
1.5315 |
0.9314 |
0.1707 |
0.0290 |
1.4085 |
0.9968 |
| ZEO |
11.0791 |
0.2195 |
0.9898 |
3.2097 |
3.3072 |
0.9701 |
2.7659 |
0.2010 |
0.6831 |
0.9704 |
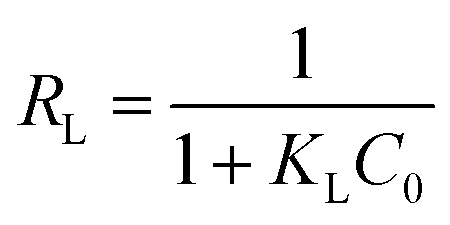
Further, in the Langmuir model, the constant KL related to interaction energy can be applied for analysing the bonding strength between adsorbents and adsorbates. The KL values of four types of adsorbents follow the sequence of ZEO@AZ > ZEO@CZ > ZEO > AZ, which is consistent with the variation of Qm. This suggests that ZEO@AZ exhibits the strongest binding with phosphates among all the materials to the benefit of phosphate adsorption removal. Besides, the affinity of the ZEO@AZ adsorbent for phosphates is predicted by a dimensionless separation factor RL calculated from Langmuir constant KL, as shown in eqn (3).
| |
 | (3) |
where
C0 (mg L
−1) is the highest initial concentration of phosphates in solution. It is reported that
RL = 0, 0 <
RL < 1,
RL = 1 and
RL > 1 mean that the adsorption isotherms are irreversible, favourable, linear and unfavourable, respectively.
36 According to the parameter
KL, the calculated
RL value of 0.0112 indicates a favored adsorption of phosphates on ZEO@AZ.
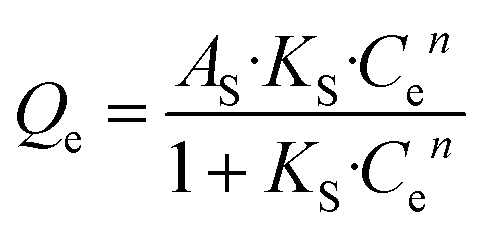
Next, the Sips model, an optimization based on Langmuir and Freundlich isotherm equation, is employed for further determining the absorbing type of the adsorptive surface, as displayed in eqn (4).
| |
 | (4) |
where
KS and
AS are Sips model constants;
n is an exponential factor, related to adsorption intensity or surface heterogeneity. The correlation coefficients of the Sips model for phosphate sorption are higher than 0.91, suggesting that the Sips model is acceptably applied to fit the experiment process in our study. Thereinto, the closer the model index
n, as an evaluation criterion of adsorbent heterogeneity, is to 1, the more homogeneous the adsorbent surface is.
37 Among all the tested materials, the
n value for ZEO@AZ is nearer to 1 than those of others, demonstrating its highly homogeneous surface and substantially favourable adsorption. This may be attributed to the evenly distributed adsorption sites derived from the isotropic properties of amorphous materials in chemical environments, in good agreement with previous studies.
38
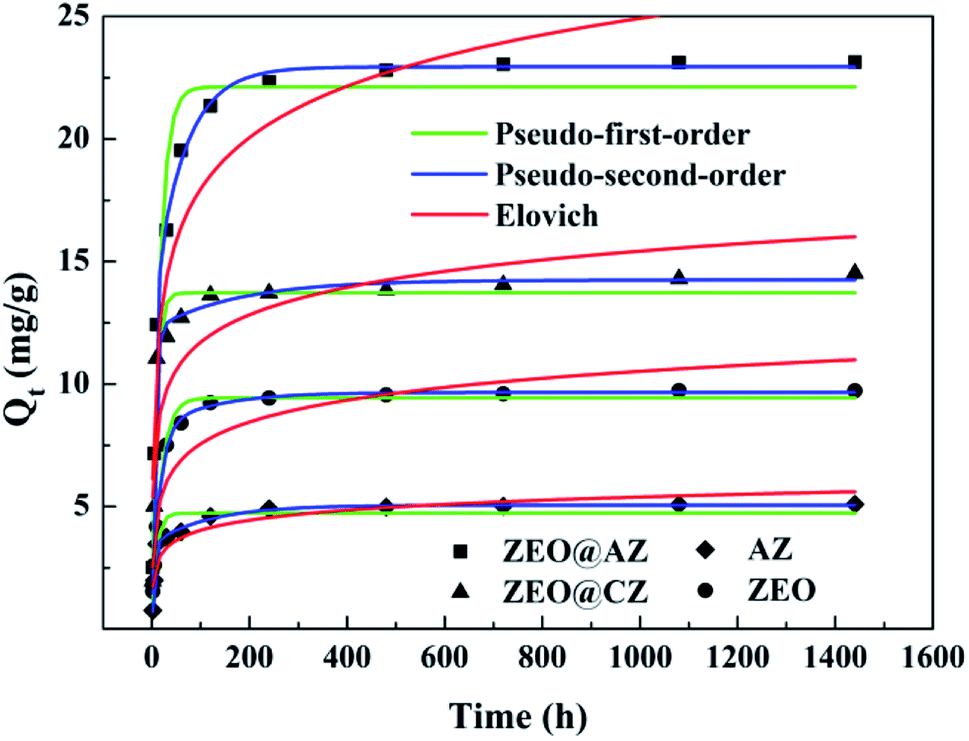
3.3. Adsorption kinetics
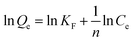
In order to identify the kinetic mechanism of the adsorption process, the concentration of phosphates in solution was then monitored by the same adsorption procedure at designed time intervals. The adsorption kinetics curves on various adsorbing materials are illustrated in Fig. 4. As expected, the adsorption quantity of phosphates rapidly increases within the initial 60 min, which accounts for 84.4–87.5% of the adsorption capacity at equilibrium. Afterwards, the phosphate adsorption gradually slows down and ultimately achieves the saturation. The fast adsorption originally can be attributed to the adequate adsorption sites on the surface of adsorbents, while the consumption little by little of adsorptive sites results in a difficulty in the adsorption of phosphates.
 |
| | Fig. 4 Phosphate sorption kinetics with results fitted to pseudo-first-order and pseudo-second-order models (T = 298 K, Ce = 50 mg L−1). | |
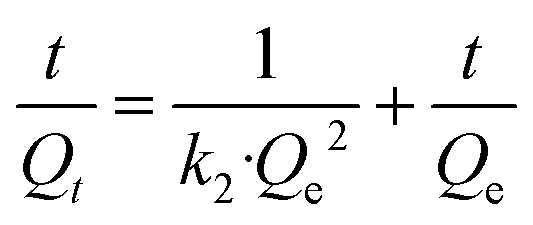
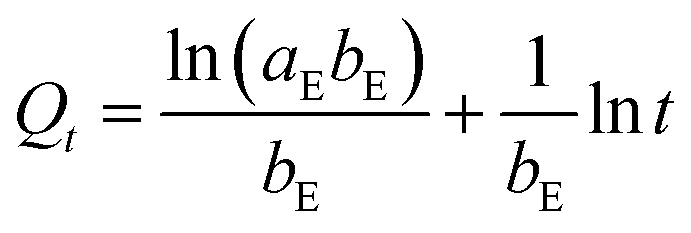
Three widely accepted kinetic models, i.e., pseudo-first-order, pseudo-second-order and Elovich equations, were conducted to simulate the kinetics of phosphate adsorption, as shown in eqn (5), (6) and (7), respectively.
| | |
ln(Qe − Qt) = lnQe − k1t
| (5) |
| |
 | (6) |
| |
 | (7) |
where
Qe (mg g
−1) and
Qt (mg g
−1) are the adsorption amount at equilibrium and designed intervals, respectively;
t (h) is the adsorption time;
k1 (g mg
−1 h
−1),
k2 (g mg
−1 h
−1) and
k3 (mg g
−1 h
0.5) are the rate constants, respectively;
aE (mg g
−1 h
−1) is the initial adsorption rate;
bE (g mg
−1) is related to the surface coverage and activation energy of chemisorption.
Kinetic parameters for phosphate adsorption of the three models, calculated from the linearized phosphate sorption kinetics plots (Fig. S7†), are exhibited in Table 2. It clearly reveals that the pseudo-second-order model is more suitable for depicting the adsorption kinetics with relatively higher correlation coefficients with R2 values of 0.999. The results confirm that the adsorption of phosphates on the adsorbents is mainly dominated by chemisorption.39,40 The high consistency of the pseudo-second-order model for test kinetic data is also in agreement with earlier findings where the pseudo-second-order model can satisfactorily describe the adsorption kinetics of phosphates on aluminium oxide,7 zirconium oxide,41 zinc hydroxide,42 modified minerals,43 etc. Moreover, the theoretical adsorption capacities at equilibrium on ZEO@AZ, ZEO@CZ, AZ and ZEO adsorbents (23.4 mg g−1, 14.5 mg g−1, 5.13 mg g−1 and 9.80 mg g−1) calculated from the pseudo-second-order model are substantially consistent with experimental results.
Table 2 Kinetics parameters for phosphate adsorption of pseudo first-order, pseudo second-order and Elovich kinetics models
| Adsorbent |
Pseudo-first-order |
Pseudo-second-order |
Elovich |
| Qe (mg g−1) |
k1 (h−1) |
R2 |
Qe (mg g−1) |
k2 (g mg−1 h−1) |
R2 |
aE (mg g−1 h−1) |
bE (g mg−1) |
R2 |
| ZEO@AZ |
8.1446 |
0.3658 |
0.9228 |
23.3590 |
0.2179 |
0.9999 |
688.90 |
0.3307 |
0.8812 |
| ZEO@CZ |
3.5186 |
0.1733 |
0.6434 |
14.5033 |
0.3755 |
0.9997 |
1367.51 |
0.6195 |
0.7417 |
| AZ |
1.6024 |
0.2699 |
0.8628 |
5.1253 |
1.0244 |
0.9999 |
331.83 |
1.6964 |
0.8558 |
| ZEO |
3.1288 |
0.3325 |
0.7052 |
9.8020 |
0.5596 |
0.9999 |
276.68 |
0.7780 |
0.8603 |
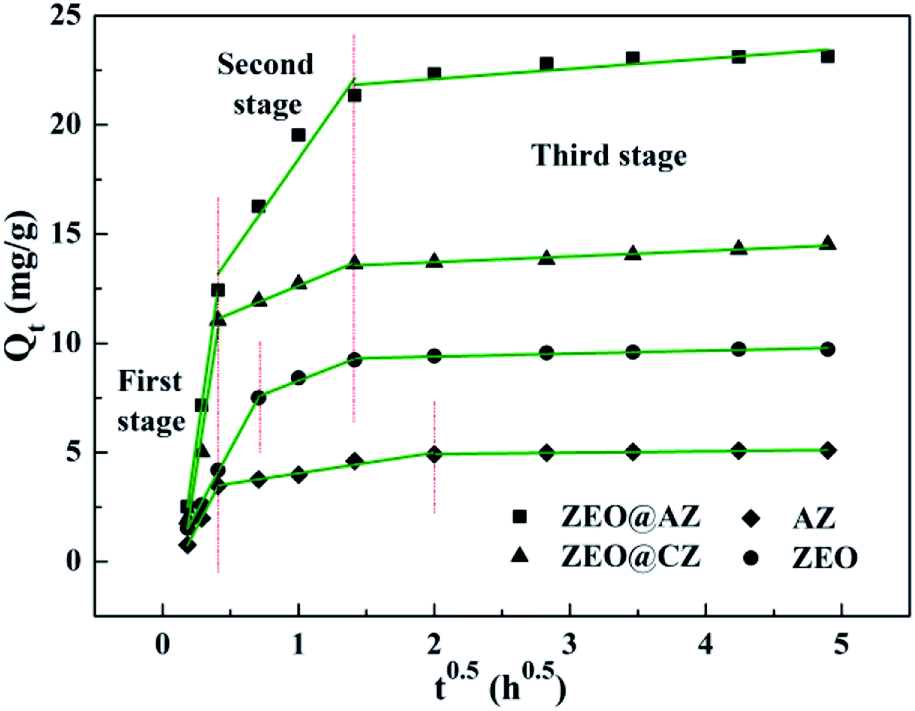
The Weber–Morris model was performed to elucidate the mass transfer and analyse the intra particle diffusion mechanism between adsorbents and adsorbates during the adsorption process, which can be depicted by eqn (8).
where
Qt (mg g
−1) is the adsorption capacity at designed time;
ki (mg g
−1 h
0.5) is the rate constant;
Ci (mg g
−1) is the Weber–Morris model constant, related to the thickness of the boundary layer.
According to the intraparticle diffusion model,2 the plots of Qt vs. t0.5 should be linear if the intraparticle diffusion is involved in the adsorption process; the adsorption is controlled only by intraparticle diffusion if the curves of Qt vs. t0.5 pass through the origin, whereas the deviation represents that intraparticle diffusion is not the only rate-controlling step; the larger the Ci value is, the greater the contribution of the boundary layer effect on speed-control steps is; two or more slopes could occur in a multi-step adsorption process. As shown in Fig. 5, the adsorption kinetics of phosphates on ZEO@AZ and its counterparts are controlled by a three-step procedure with multi-linear features. It is noteworthy that the first stage is assigned to the rapid mass transfer of phosphate ions from the bulk solution to the surface of adsorbents, whereas the second and third stages are attributed to the gradually intraparticle diffusion of phosphates into the pores of adsorbents for some time and the final adsorption equilibrium, respectively. The model rate constants for three stages in Table 3 follow the relationship of k1 > k2 > k3 and k1 is much greater than k2 and k3, indicating the fast and vigorous mass transfer of phosphates in the first stage, while the relatively gradual intraparticle diffusion is not the only rate controlling step involved. The intercept C2 observably away from the origin confirms the conclusion above as well. It is reasonable to infer that both external and intraparticle diffusion control the adsorption of phosphates.
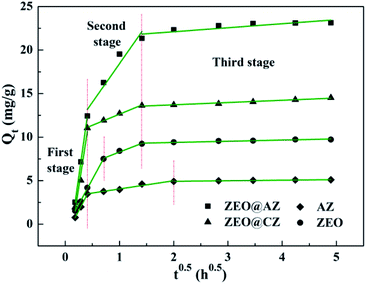 |
| | Fig. 5 Linearized adsorption kinetics based on the Weber–Morris model. | |
Table 3 Kinetics parameters for phosphate adsorption of the intraparticle diffusion model
| Adsorbent |
First stage |
Second stage |
Third stage |
| k1 (g mg−1 h0.5) |
C1 (mg g−1) |
R2 |
k2 (g mg−1 h0.5) |
C2 (mg g−1) |
R2 |
k3 (g mg−1 h0.5) |
C3 (mg g−1) |
R2 |
| ZEO@AZ |
43.8987 |
−5.5008 |
0.9999 |
8.8870 |
9.5535 |
0.9172 |
0.4622 |
21.1805 |
0.9152 |
| ZEO@CZ |
40.5107 |
−5.8701 |
0.9538 |
2.5603 |
10.0720 |
0.9929 |
0.2599 |
13.1927 |
0.9621 |
| AZ |
12.0002 |
−1.4451 |
0.9992 |
0.9448 |
3.0964 |
0.9635 |
0.0653 |
4.7872 |
0.9682 |
| ZEO |
11.4777 |
0.5933 |
0.9985 |
2.4181 |
5.8696 |
0.9685 |
0.1367 |
9.1174 |
0.8952 |
3.4. Adsorption thermodynamics
The influence of ambient temperature ranging from 298 K to 318 K of the phosphate adsorption on various adsorbents is investigated and the results are shown in Fig. 6a. The adsorption capacity at equilibrium of phosphates greatly increases when the reaction temperature rises from 298 K to 308 K, whereas the increment in adsorption capacity at equilibrium grows only a little as the temperature further rises to 318 K. It is well-known that the increasing temperature is beneficial to the diffusion of phosphates in aqueous solution, and enhances the interaction forces between phosphate ions and absorbing materials.15 Consequently, the higher temperature can provide phosphates sufficient energy to overcome the resistance of the hydrated ion layer and ultimately reach the interior of adsorbents to interact with adsorption sites.
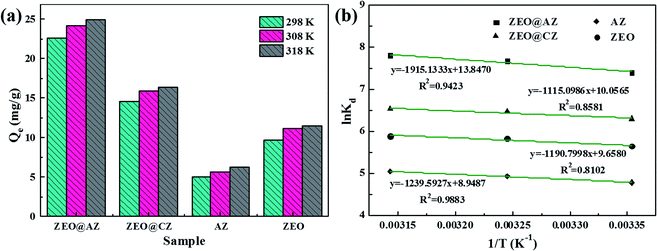 |
| | Fig. 6 Effect of ambient temperature on phosphate adsorption on different adsorbents (a), and plots of lnKd vs. 1/T (b) (t = 24 h, C0 = 50 mg L−1). | |
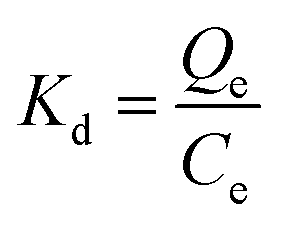
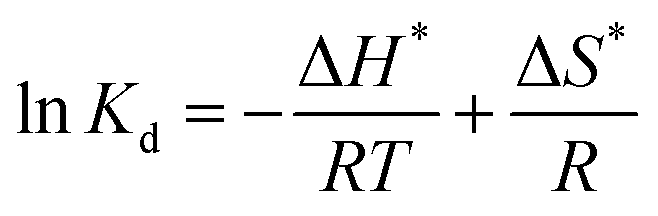
The thermodynamic parameters, involving Gibbs free energy, enthalpy and entropy, are usually utilized to further explain the relationship between temperature and phosphate adsorption, which can be obtained from the following eqn (9)–(11).
| |
 | (9) |
| | |
ΔG* = −RTlnKd
| (10) |
| |
 | (11) |
where
Kd (mL g
−1) is the distribution coefficient;
Qe (mg g
−1) and
Ce (mg L
−1) are the adsorbing capacity and phosphate concentration at equilibrium, respectively; Δ
G* (kJ mol
−1) is the change of Gibbs free energy;
R (8.314 J mol
−1 K
−1) is the universal gas constant;
T (K) is the absolute temperature; Δ
H* (kJ mol
−1) and Δ
S* (kJ mol
−1 K
−1) are the change of enthalpy and entropy, respectively.
In detail, the change of enthalpy (ΔH*) and entropy (ΔS*) can be determined by the slope and intercept of plots of lnKd vs. 1/T (Fig. 6b), respectively. The thermodynamic parameters of phosphate adsorption on ZEO@AZ and the counterparts are presented in Table 4. The results show that the values of Gibbs free energy variation ΔG* from phosphate adsorption using the four adsorbents involved are negative (−11.9 to −20.7 kJ mol−1) at various temperatures, indicating that the phosphate adsorption can occur spontaneously. Furthermore, the absolute values of ΔG* for each type of adsorbent are positively associated with the reaction temperature, which means the enhanced spontaneous tendency of phosphate adsorption with the increase in temperature. The positive enthalpy change ΔH* (9.27–15.9 kJ mol−1) of all adsorbing materials reveals that the phosphate adsorption is substantially endothermic, verifying the conclusion proposed above that the temperature increases in favour of phosphate adsorption (Fig. 6a). In particular, the positive entropy change ΔS* (0.0744–0.115 kJ mol−1 K−1) manifests the enhancive randomness or disorder at the solid–liquid interface during phosphate adsorption.
Table 4 Thermodynamic parameters of phosphate adsorption
| Adsorbent |
T (K) |
Qe (mg g−1) |
Ce (mg L−1) |
Kd (mL g−1) |
ΔG* (kJ mol−1) |
ΔH* (kJ mol−1) |
ΔS* (kJ mol−1 K−1) |
| ZEO@AZ |
298 |
22.64 |
13.78 |
1642.78 |
−18.35 |
15.92 |
0.1151 |
| 308 |
24.21 |
11.27 |
2147.85 |
−19.66 |
| 318 |
24.91 |
10.14 |
2456.85 |
−20.65 |
| ZEO@CZ |
298 |
14.54 |
26.74 |
543.66 |
−15.61 |
9.27 |
0.0836 |
| 308 |
15.92 |
24.53 |
648.95 |
−16.59 |
| 318 |
16.36 |
23.82 |
686.92 |
−17.28 |
| AZ |
298 |
5.03 |
41.96 |
119.76 |
−11.86 |
10.31 |
0.0744 |
| 308 |
5.70 |
40.88 |
139.43 |
−12.65 |
| 318 |
6.23 |
40.04 |
155.47 |
−13.35 |
| ZEO |
298 |
9.71 |
34.46 |
281.85 |
−13.98 |
9.30 |
0.0803 |
| 308 |
11.09 |
32.25 |
343.99 |
−14.96 |
| 318 |
11.46 |
31.67 |
361.74 |
−15.58 |
3.5. Effect of water quality on phosphate adsorption
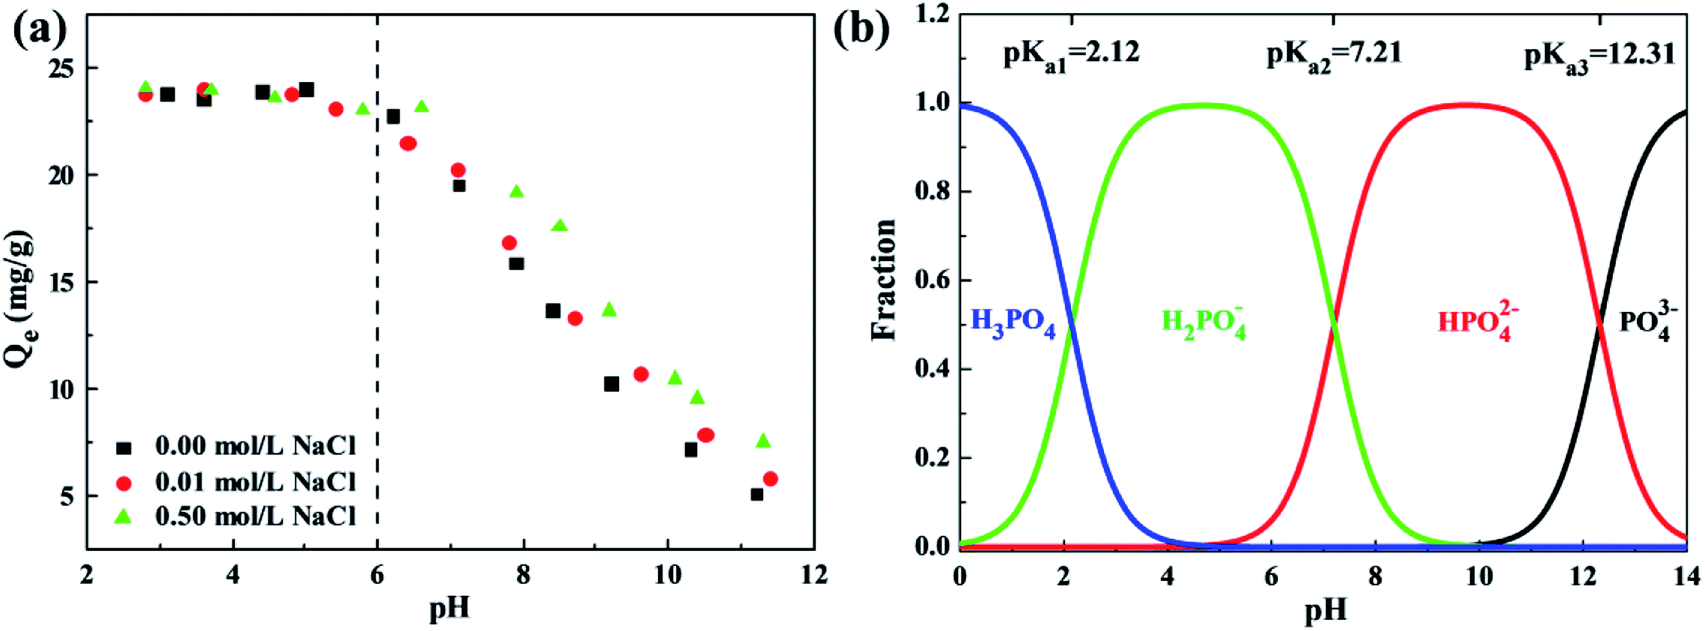
The water quality conditions, involving solution pH, ionic strength and co-existing ions, significantly affect the surface charges, adsorbent ionization and speciation of anions, playing a critical role in adsorption of phosphates. The effect of solution pH varying from 2 to 12 and ionic strength with NaCl concentrations of 0.00 mol L−1, 0.01 mol L−1 and 0.50 mol L−1 on phosphate adsorption of the ZEO@AZ and ZEO@CZ was studied by batch-scale experiments, as exhibited in Fig. 7a. Remarkably, the phosphate adsorption using ZEO@AZ embodies a strong dependency upon solution pH. Acidic conditions with a pH of less than 6 favour the adsorbent in adsorbing phosphates, whereas sharp declines of adsorption capacities occur within the solution pH ranging from about 6 to 11.5. Meanwhile, the ionic strength is also a crucial benchmark to determine the effect of the electrolyte formed by dissociation of NaCl in an aqueous solution on phosphate solubility. It is noteworthy that a similar variation tendency in adsorbing capacity with pH levels is observed at varied ionic strengths. The high ionic strength remarkably enhances the adsorption capacity of phosphates under neutral and alkaline solvent environments, but has no apparent effect on acidic pH levels. Moreover, the similar results using ZEO@CZ as adsorbents (Fig. S8†) also support the above-mentioned conclusions. Meanwhile, the enhanced phosphate adsorption on Zr-containing adsorbents by increasing the ionic strength under neutral or alkaline conditions has been reported by previous literature studies. For instance, Wu et al. pointed out that the 0.5 mol L−1 NaCl can promote high efficiency removal of phosphates from water of one-step synthesis of a magnetite core/zirconia shell nanocomposite.22 Xu's group also got similar results on the magnetic Fe3O4@C@ZrO2 adsorbent.9 In addition, almost negligible phosphate adsorption on both sorbents is detected at pH 11, indicating that the phosphorus-saturated adsorbents are expected to be regenerated under alkaline pH conditions.
 |
| | Fig. 7 Effect of solution pH and ionic strength on phosphate adsorption of ZEO@AZ (a), and existence form of phosphate at different pH levels (b) (C0 = 50 mg L−1, T = 298 K, t = 24 h). | |
The dependency of phosphate adsorption on solution pH value and ionic strength can be assigned to the dual-functional characteristics of the zirconia surface and the complicated species distribution of phosphates at different pH levels. Zeta potential measurements as a function of pH were conducted to determine the surface charge state of adsorbents (ESI appendix, Fig. S9†). Apparently, the zeta potential of the ZEO@AZ adsorbent (−26.6–32.2 mV) remarkably increases compared with that of initial zeolite (−46.7 to −18.8 mV) as the pH ranges from 2 to 11, demonstrating that the conformal growth of amorphous ZrO2 changes the electronegativity of the zeolite surface. Actually, the positively charged ZEO@AZ adsorbent provides a better choice to the adsorption of anionic pollutants such as phosphates due to the favourable electrostatic affinity after the modification of the initial zeolite. Furthermore, the isoelectric point (IEP) for ZEO@AZ is obtained at pH 6.10, which suggests that the surface of ZEO@AZ is negatively charged by the process of deprotonation at pH above the IEP and positively charged derived from the protonation process when solution pH is adjusted to below IEP. The deprotonation and protonation processes are shown in eqn (12) and (13), respectively.
| | |
Zr–OH + OH− = Zr–O− + H2O
| (12) |
| | |
Zr–OH + H+ = Zr–OH2+
| (13) |
where Zr–O
− and Zr–OH
2+ represent the negatively charged and positively charged groups on the surface of the zirconia layer, respectively.
Furthermore, the pH plays a vital role in the existence form of phosphate species in aqueous solution. In general, phosphates are present in water as the species of PO43−, HPO42−, H2PO4− and H3PO4, and the dissociation constants are shown as follows: Ka1 = 7.11 × 10⁻³, Ka2 = 6.34 × 10⁻⁸, and Ka3 = 4.79 × 10⁻¹³. Based on the dissociation equilibrium principle of acids, the curves of fraction for phosphate species with pH variation are displayed in Fig. 7b. It is finally known from the above analysis that monovalent and electronegative H2PO4− is the predominantly formed phosphate anions in solution when the pH ranges from 2.12 to 6.10, which can be adsorbed by the positively charged ZEO@AZ with electrostatic attraction. Meanwhile, a small fraction of neutral H3PO4 contributes little to the phosphate adsorption. Then, the surface charge of ZEO@AZ starts to transform from positive to negative, while the phosphates exist as both electronegative HPO42− and H2PO4− species throughout the pH ranges from 6.10 to 7.21. The identical electro negativities thus cause the repulsion between ZEO@AZ and phosphates. Besides, the gradual transition of solution to be neutral leads to a rise in the concentration of OH−, which competes for the adsorption sites on ZEO@AZ with HPO42− and H2PO4− together, resulting in a lowered adsorption capacity. With the pH level moving forward, the same charges of both parties involved, as well as further strengthened competition of OH− concentration have combined to pull the phosphate adsorption capacity down continuously.
In the actual natural/waste water, various species of anions, such as Cl−, NO3−, SO42− and HCO3−, survive together to compete for the finite adsorption sites with phosphates, resulting in reduced adsorption ability of adsorbents to targeted pollutants. The four anions mentioned above with different concentrations were chosen as competitors to investigate the selectivity of ZEO@AZ for phosphates. The concentrations of co-existing anions vary from 50 mg L−1 to 800 mg L−1, which is 2 to 30 times that of the initial phosphates. The results are displayed in Fig. 8, which illustrates that the coexistence of Cl− and NO3− in solution shows slight or no obvious effect on phosphate adsorption as the concentration of co-existing anions goes up from 50 mg L−1 to 800 mg L−1, whereas the existence of SO42− and HCO3− prominently decreases the phosphate adsorption on both adsorbents, even if their concentrations reach only 50 mg L−1 in aqueous solution. This could be attributed to the fact that Cl− and NO3− form only weaker bonds by outer sphere complexes, while SO42− and HCO3− can generate both outer- and inner-sphere complexation with Zr4+ in the surface of adsorbents and inhibit the adsorption of phosphates. It can thus be seen that the affinities of competing anions for adsorption sites have a significant impact on phosphate adsorption. Furthermore, the influence of coexisting ions on pH is also critical.23,44 The addition of HCO3− makes the initial solution pH gradually turn to neutral or even alkaline condition, also leading to the decreasing adsorption capacity to some extent. Considering the much higher concentrations of coexisting anions than phosphates, these results still demonstrate clearly such good selectivity of the ZEO@AZ adsorbent for phosphate removal from the practical wastewater, even at unusually high concentrations of competing anions.
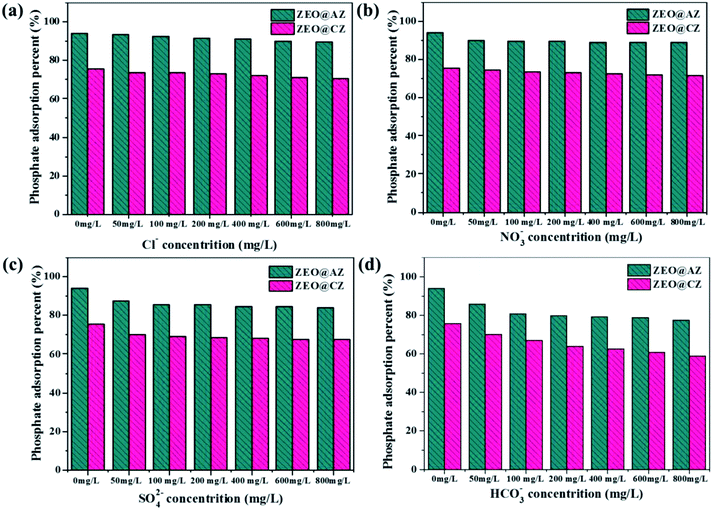 |
| | Fig. 8 Effect of coexisting anions on phosphate adsorption on ZEO@AZ and ZEO@CZ. (a) Cl−, (b) NO3−, (c) SO42−, and (d) HCO3−. | |
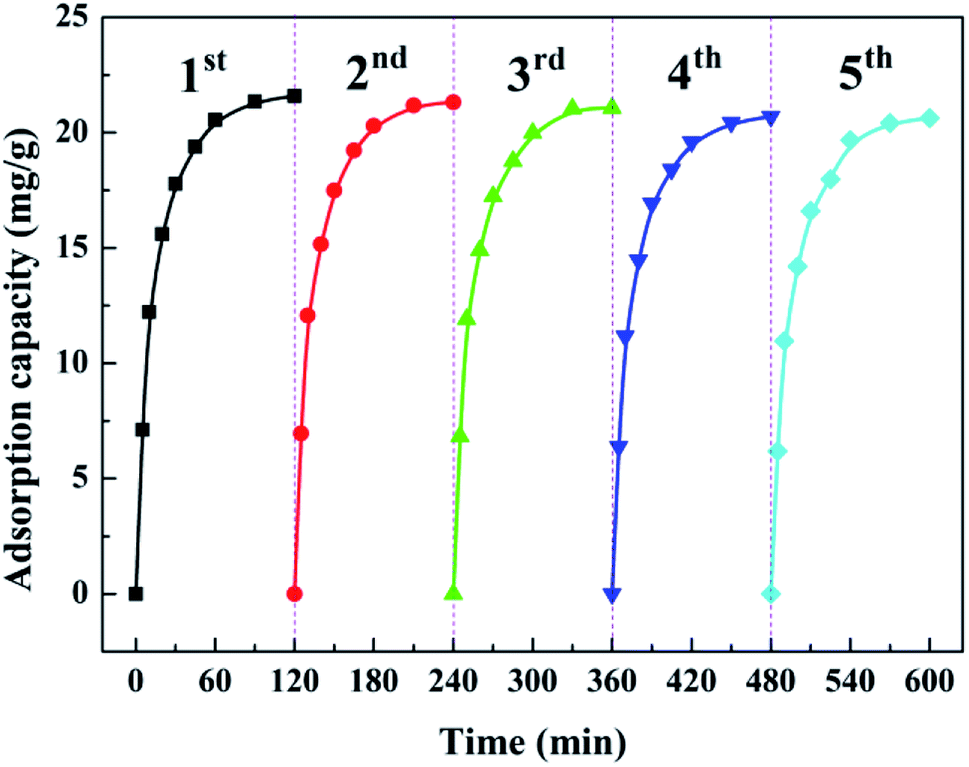
3.6. Recycling adsorption performance
Recycling adsorption performance is of paramount importance to practical water governance. Bench-scale experiments with five cycles were conducted to systematically investigate the reusability of the as-prepared ZEO@AZ. Each cycle followed the adsorption–desorption–regeneration process, wherein the adsorbents after adsorption equilibrium were immersed into 0.1 mol L−1 NaOH solution to dissolve the adsorbed phosphates for regeneration and then started a new cycle. As illustrated in Fig. 9, the results depict that the adsorption amount loss towards phosphates on ZEO@AZ is only less than 5% after five repeated cycles, thus indicating favourable adsorption ability of the regenerated adsorbents. The recycling performance of ZEO@AZ may be ascribed to the conformal growth based on zeolite, providing the amorphous ZrO2 layer more robust and scattered adsorptive sites and endowing the ZEO@AZ adsorbent with superior recyclability for practical applications.
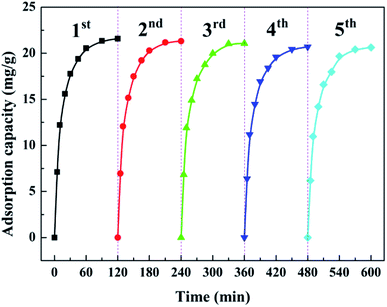 |
| | Fig. 9 Recycling adsorption performance of the ZEO@AZ adsorbent towards phosphates (C0 = 50 mg g−1, T = 298 K, t = 24 h). | |
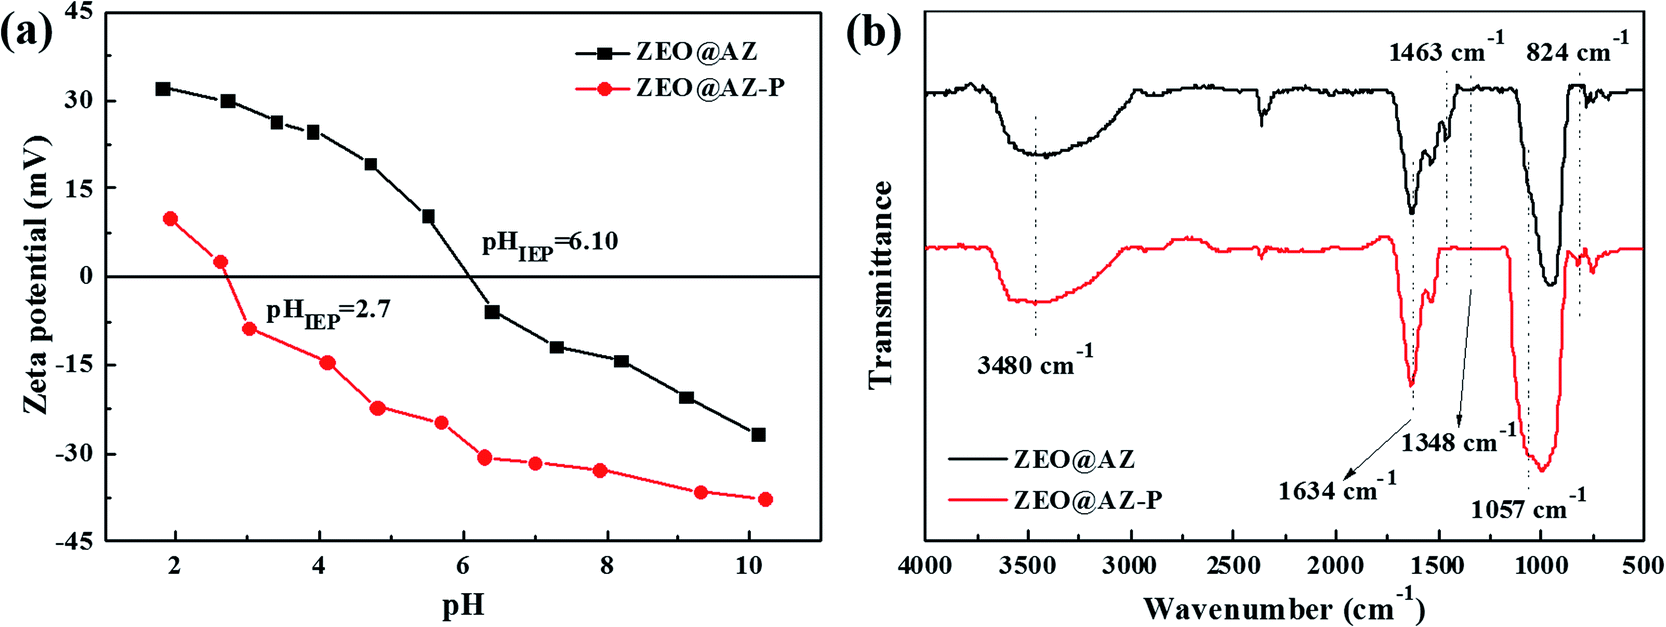
3.7. Adsorption mechanism towards phosphates
According to the above analysis, we attribute the adsorption mechanism of phosphates on ZEO@AZ to the interaction of phosphates with the amorphous zirconia layer, where polyphosphates or other species have a negligible impact on the sorption process (see more details in ESI appendix, Fig. S10†). Previous studies45,46 have suggested that the zirconium exists in the form of tetrameric ion [Zr(OH)2·4H2O]48+ with the addition of ZrOCl2·8H2O in the pre-made Tris–HCl solution at pH 7.5. The precursor formation of the amorphous ZrO2 layer relies on a two-step temperature controlled strategy of low temperature adsorption (4 °C) and nucleation and heterogeneous growth of metal ions by hydrolysis at a relatively high temperature (60 °C). During the hydrolytic reaction, some of the coordinated water in [Zr(OH)2·4H2O]48+ is replaced by hydroxide radicals and forms the precursor for ZrO2 uniformly distributed on the surface of the zeolite matrix. Finally, the amorphous ZrO2 layer conformally grown on the surface of zeolite is obtained in the subsequent dehydration treatment (mixed with some ethyl alcohol at 60 °C for 12 h). Compared with the crystalline counterpart ZEO@CZ, the ZEO@AZ is well situated to benefit from the abundant defects of the amorphous ZrO2 layer, which are in favour of the ion exchange in phosphate adsorption.23,45 Furthermore, the high specific surface area of ZEO@AZ derived from the zeolite support (certified by the results of SBET) endows the composite adsorbent with more evenly distributed active adsorption sites. Therefore, it is the synergistic effect between the zeolite support and amorphous ZrO2 layer that results in the enhanced phosphate adsorption properties.
The favourable selective adsorption on phosphates using the ZEO@AZ adsorbent in the presence of high concentrations of coexisting ions (Fig. 8) further indicates that the formation of an inter-sphere complex, i.e. ligand exchange, dominates the removal mechanism of phosphates. The variation of isoelectric point (IEP) helps to distinguish the formation of outer and inner spheroidal complexes, based on the fact that the generation of the former cannot change the IEP value due to the lack of chemical reactions between the adsorbent surface and phosphates that might alter the surface charge state. Zeta potential measurements of the ZEO@AZ composite before and after phosphate adsorption were conducted and the results are shown in Fig. 10a. It's clear that the zeta potential of ZEO@AZ markedly decreases after the phosphate adsorption over the whole pH tested region. The IEP value shifts from ∼6.10 to ∼2.7 after treatment with 50 mg L−1 phosphates solution. Thus, zeta potential strongly supports the ligand exchange mechanism. The ligand exchange mechanism by the inter-sphere complex was also confirmed by the FTIR spectra of ZEO@AZ before and after the sorption of phosphates under acidic conditions with a pH of 4.6 (Fig. 10b). The broad absorption band centred at around 3480 cm−1 and the narrow peak at 1634 cm−1 of both curves could be ascribed to the O–H stretching and bending vibrations caused by hydroxyl groups and physically adsorbed water, respectively.23 Before adsorption reaction, a characteristic peak at 1463 cm−1 and a wide absorption band at 1348 cm−1 can be observed due to O–H bending vibrations on the metal oxide surface.34,47 But after adsorbing phosphates, they are distinctly weakened in the red spectrum compared with that of fresh ZEO@AZ. Moreover, new adsorptive peaks at 1057 cm−1 and 824 cm−1 emerge in the relatively low wavenumber region (750–1250 cm−1), resulting from the stretching vibration of adsorbed P-OX, where X represents the hydrogen or metal atom bonded with phosphates.47,48 Notably, these bands provide direct evidence for the formation of zirconia and phosphate complex, which is consistent with the results of zeta potential. Consequently, it is the inter-sphere complexation mechanism that dominates the adsorption reaction of phosphates on the ZEO@AZ adsorbent.
 |
| | Fig. 10 Zeta potential (a) and FTIR spectra (b) of the ZEO@AZ composite before and after phosphate adsorption. | |
4. Conclusions
In summary, we have first presented a facile liquid phase synthesis to achieve the conformal growth of an amorphous ZrO2 thin layer decorated on the surface of zeolite, fabricating the heterostructured ZEO@AZ compound adsorbent. The as-prepared ZEO@AZ adsorbent exhibited favourable adsorptive performance towards phosphates with a theoretical maximum adsorption amount of 25.41 mgP g−1. The adsorption process can be well fitted by the Langmuir model and pseudo-second-order model, and also proved to be chemisorption, endothermic and spontaneous by thermodynamics analysis. Furthermore, the adsorption ability of ZEO@AZ was highly dependent on the solution pH and remained efficient and stable at pH < 6. Favourable selectivity and reusability illustrated that the ZEO@AZ could be reutilized as a high-efficiency and eco-friendly adsorbent for the treatment and recycling utilization of phosphates in practical wastewater. Besides, the inter-sphere complex mechanism proposed in our research probably helps to further regulate the synthesis of compound adsorbents for more effective phosphate adsorption and recovery.
Author contributions
Y. Tao: writing – original draft and conceptualization. S. Liu: validation. S. Dong: formal analysis. C. Wang: data curation. T. Qu: investigation. S. Li: review & editing. L. Li: methodology. Z. Ma: supervision and funding acquisition.
Conflicts of interest
There are no conflicts to declare.
Acknowledgements
This work was supported by National Natural Science Foundation Youth Program [52102360]; Fundamental Research Foundation of Education Department of Liaoning Province [L2020lkyjc-03, L2020lkyjc-05]; Natural Science Foundation of Liaoning Province [2020-BS-230]; National College Students Innovation and Entrepreneurship Training Program [202211430044]; Inter-school Cooperation Program in Higher Education Institutions of Liaoning Province; and Liaoning BaiQianWan Talents Program.
References
- A. F. de Sousa, T. P. Braga, E. C. C. Gomes, A. Valentini and E. Longhinotti, Chem. Eng. J., 2012, 210, 143–149 CrossRef.
- M. Pan, X. Lin, J. Xie and X. Huang, RSC Adv., 2017, 7, 4492–4500 RSC.
- D. Tonini, H. Saveyn and D. Huygens, Nat. Sustain., 2019, 2, 1051–1061 CrossRef.
- M. R. Razanajatovo, W. Gao, Y. Song, X. Zhao, Q. Sun and Q. Zhang, Chin. Chem. Lett., 2021, 32(9), 2637–2647 CrossRef CAS.
- Y. G. Ko, T. Do, Y. Chun, C. H. Kim, U. S. Choi and J. Y. Kim, J. Hazard. Mater., 2016, 307, 91–98 CrossRef CAS PubMed.
- Y. Zhang, J. Qin, X. Wang, Z. Chen, X. Zheng and Y. Chen, J. Environ. Manage., 2021, 296, 113203 CrossRef CAS PubMed.
- Z. Wang, K. Qin, Z. Wang, D. Shen and C. Wu, RSC Adv., 2021, 11, 37851–37865 RSC.
- X. Wang, Y. Hu, Y. Tang, P. Yang, X. Feng, W. Xu and M. Zhu, Environ. Sci.: Nano, 2017, 4, 2193–2204 RSC.
- W. Wang, H. Zhang, L. Zhang, H. Wan, S. Zheng and Z. Xu, Colloids Surf., A, 2015, 469, 100–106 CrossRef CAS.
- J. Lin, S. He, X. Wang, H. Zhang and Y. Zhan, Colloids Surf., A, 2019, 561, 301–314 CrossRef CAS.
- L. Wang, X. Wen, J. Li, P. Zeng, Y. Song and H. Yu, Chem. Eng. J., 2021, 405, 126681 CrossRef CAS.
- M. Nehra, N. Dilbaghi, N. K. Singhal, A. A. Hassan, K. H. Kim and S. Kumar, Environ. Res., 2019, 169, 229–236 CrossRef CAS PubMed.
- S. Asaoka, K. Kawakami, H. Saito, T. Ichinari, H. Nohara and T. Oikawa, J. Hazard. Mater., 2021, 406, 124780 CrossRef CAS PubMed.
- E. L. Uzunova and H. Mikosch, Microporous Mesoporous Mater., 2016, 232, 119–125 CrossRef CAS.
- Z. Zhong, G. Yu, W. Mo, C. Zhang, H. Huang, S. Li, M. Gao, X. Lu, B. Zhang and H. Zhu, RSC Adv., 2019, 9, 10425–10436 RSC.
- Y. Shang, K. Guo, P. Jiang, X. Xu and B. Gao, Int. J. Biol. Macromol., 2018, 109, 524–534 CrossRef CAS PubMed.
- Y. Huang, X. Lee, M. Grattieri, M. Yuan, R. Cai, F. C. Macazo and S. D. Minteer, Chem. Eng. J., 2020, 380, 122375 CrossRef CAS.
- H. Bacelo, A. M. Pintor, S. C. Santos, R. A. Boaventura and C. M. Botelho, Chem. Eng. J., 2020, 381, 122566 CrossRef CAS.
- X. Wang, L. Dou, Z. Li, L. Yang, J. Yu and B. Ding, ACS Appl. Mater. Interfaces, 2016, 8, 34668–34676 CrossRef CAS PubMed.
- J. Lin, Y. Zhan, H. Wang, M. Chu, C. Wang, Y. He and X. Wang, Chem. Eng. J., 2017, 309, 118–129 CrossRef CAS.
- F. C. P. Masim, C. H. Tsai, Y. F. Lin, M. L. Fu, M. Liu, F. Kang and Y. F. Wang, Environ. Technol., 2019, 40, 226–238 CrossRef CAS PubMed.
- Z. Wang, M. Xing, W. Fang and D. Wu, Appl. Surf. Sci., 2016, 366, 67–77 CrossRef CAS.
- A. Nuryadin, T. Imai, A. Kanno, K. Yamamoto, M. Sekine and T. Higuchi, Mater. Chem. Phys., 2021, 266, 124559 CrossRef CAS.
- H. Miyauchi, T. Yamamoto, R. Chitrakar, Y. Makita, Z. Wang, J. Kawai and T. Hirotsu, Top. Catal., 2009, 52, 714–723 CrossRef CAS.
- Y. Su, H. Cui, Q. Li, S. Gao and J. K. Shang, Water Res., 2013, 47, 5018–5026 CrossRef CAS PubMed.
- Q. Sun, N. Wang and J. Yu, Adv. Mater., 2021, 33, 2104442 CrossRef CAS PubMed.
- X. Ju, J. Hou, Y. Tang, Y. Sun, S. Zheng and Z. Xu, Microporous Mesoporous Mater., 2016, 230, 188–195 CrossRef CAS.
- K. Rathinam, R. Atchudan and T. N. J. I. Edison, J. Environ. Chem. Eng., 2021, 9, 106053 CrossRef CAS.
- H. Zhao, Y. Zhu, F. Li, R. Hao, S. Wang and L. Guo, Angew. Chem., Int. Ed., 2017, 129, 8892–8896 CrossRef.
- J. Yu, A. Li, L. Li, X. Li, X. Wang and L. Guo, Sci. China Mater., 2019, 62, 1275–1284 CrossRef CAS.
- J. Liu, J. Nai, T. You, P. An, J. Zhang, G. Ma, X. Niu, C. Liang, S. Yang and L. Guo, Small, 2018, 14, 1703514 CrossRef PubMed.
- J. Wang, X. Shao, J. Liu, Q. Zhang, J. Ma and G. Tian, Mater. Chem. Phys., 2020, 249, 123024 CrossRef CAS.
- G. Gatti, D. F. O. Olivera, G. Paul, R. Bagatin, A. Carati, M. Tagliabue, C. Bisio and L. Marchese, Dalton Trans., 2019, 48, 11781–11790 RSC.
- H. Liu, X. Sun, C. Yin and C. Hu, J. Hazard. Mater., 2008, 151, 616–622 CrossRef CAS PubMed.
- F. C. P. Masim, C. H. Tsai, Y. F. Lin, M. L. Fu, M. Liu, F. Kang and Y. F. Wang, Environ. Technol., 2019, 40, 226–238 CrossRef CAS PubMed.
- Z. Wang, D. Shen, F. Shen and T. Li, Chemosphere, 2016, 150, 1–7 CrossRef CAS PubMed.
- X. Xu, B. Wang, H. Tang, Z. Jin, Y. Mao and T. Huang, J. Environ. Manage., 2020, 260, 110130 CrossRef CAS PubMed.
- X. Han, G. Wu, J. Du, J. Pi, M. Yan and X. Hong, Chem. Commun., 2022, 58, 223–237 RSC.
- T. Guan, Y. Kuang, X. Li, J. Fang, W. Fang and D. Wu, Environ. Int., 2020, 134, 105322 CrossRef CAS PubMed.
- J. Lalley, C. Han, X. Li, D. D. Dionysiou and M. N. Nadagouda, Chem. Eng. J., 2016, 284, 1386–1396 CrossRef CAS.
- X. Luo, X. Wang, S. Bao, X. Liu, W. Zhang and T. Fang, Sci. Rep., 2016, 6, 1–13 CrossRef PubMed.
- D. A. Almasri, R. Essehli, Y. Tong and J. Lawler, RSC Adv., 2021, 11, 30172–30182 RSC.
- Z. Zha, Y. Ren, S. Wang, Z. Qian, L. Yang, P. Cheng, Y. Han and M. Wang, RSC Adv., 2018, 8, 19326–19334 RSC.
- R. B. Balow, J. G. Lundin, G. C. Daniels, W. O. Gordon, M. McEntee, G. W. Peterson, J. H. Wynne and P. E. Pehrsson, ACS Appl. Mater. Interfaces, 2017, 9, 39747–39757 CrossRef CAS PubMed.
- T. Guan, Y. Kuang, X. Li, J. Fang, W. Fang and D. Wu, Environ. Int., 2020, 134, 105322 CrossRef CAS PubMed.
- Y. Tao, S. Liu, T. Zheng, J. Lu, F. Li, R. Hao, H. Zhao, Z. Ma and L. Guo, Mater. Lett., 2022, 311, 131589 CrossRef CAS.
- Z. Wang, W. Fang, M. Xing and D. Wu, J. Magn. Magn. Mater., 2017, 424, 213–220 CrossRef CAS.
- E. J. Elzinga and D. L. Sparks, J. Colloid Interface Sci., 2007, 308, 53–70 CrossRef CAS PubMed.
|
| This journal is © The Royal Society of Chemistry 2022 |
Click here to see how this site uses Cookies. View our privacy policy here. 
 Open Access Article
 This Open Access Article is licensed under a Creative Commons Attribution-Non Commercial 3.0 Unported Licence
 *ab,
Shaojia Liu
*ab,
Shaojia Liu