
 Open Access Article
 This Open Access Article is licensed under a Creative Commons Attribution-Non Commercial 3.0 Unported Licence
Compound green tea (CGT) regulates lipid metabolism in high-fat diet induced mice†
Caibi Zhou‡
 ab,
Liuhong Hu‡ab,
Ren Mua,
Xin Mei*a,
Xingli Wua,
Chuanming Wangc and
Xiaolu Zhou*ab
ab,
Liuhong Hu‡ab,
Ren Mua,
Xin Mei*a,
Xingli Wua,
Chuanming Wangc and
Xiaolu Zhou*ab
aCollege of Biological Science and Agriculture, Qiannan Normal University for Nationalities, 5 Jianjiang Avenue Middle Section, Duyun, Guizhou 558000, China. E-mail: xmeisci@yeah.net; arainbowl@163.com
bSchool of Crop Production Technology, Institute of Agricultural Technology, Suranaree University of Technology, Nakhon Ratchasima 30000, Thailand
cThe Second Affiliated Hospital of Guizhou University of Traditional Chinese Medicine, Guizhou 550000, China
First published on 26th August 2022
Abstract
This work aims to study the effect of compound green tea (CGT) on liver lipid metabolism in mice based on metabolomics of liquid chromatography-mass spectrometry (LC-MS), and preliminarily identify potential biomarkers and pathways of action by using a metabonomic network database to explore the lipid-lowering effect of CGT. In this study, forty mice were randomly divided into four groups: compound tea treatment group (DH), high-fat model control group (NK), normal control group (CK) and positive drug group (YK). After a month of different interventions, the mice were weighed and the blood lipid indexes were detected. In addition, differential liver metabolites were monitored by using LC-MS. The results showed that CGT and positive drug treatment were able to decrease body weight, liver coefficient, TC, TG and LDL levels of obese mice, while increasing HDL levels. Among the 110 compounds obtained, 54 metabolites were significantly altered in the four comparisons. More importantly, 15 remarkably downregulated metabolites involved in Lysopc 16:1, Lysopc 18:1, and Lysopc 18:2 were found in the DH group when the mice were treated with CGT; meanwhile, the positive drug Xuezhikang was able to significantly downregulate 14 compounds, including (±)18-HEPE, and 6 keto-PGF1α, compared with the NK group. Besides, KEGG enrichment analysis also revealed the important metabolic pathways, such as linoleic acid metabolism, Biosynthesis of unsaturated fatty acids, and α-linolenic acid metabolism, were related to fatty acid metabolism. These results suggested that CGT could regulate the lipid metabolism in the liver of hyperlipidemia mice, and may regulate 54 potential biomarkers in mice through a related metabolic pathway to make them return to a normal state and improve the disorder of lipid metabolism.
Introduction
Hyperlipidemia (HLP) is a common multiple lipid disorder disease, which is diagnosed by the assessment of low high-density lipoprotein and/or high total cholesterol, high low-density lipoprotein and high triglyceride.1 It was found that lipid metabolism disorders are closely related to fatty acid metabolism, glucose metabolism, and bile acid metabolism,2 and are generally regulated by the expression of AMPKα-2, PPARa and other genes.3,4 The occurrence of dyslipidemia causes excessive fat accumulation in the human body or organs, resulting in obesity, as well as its complications such as fatty liver, coronary heart disease, diabetes, cardiovascular and cerebrovascular diseases.5–7 HLP has become a global public risk factor to threaten people's health in recent decades, its incidence rate is gradually increasing and tends to be in younger people. Common lipid-lowering drugs are accompanied by adverse effects such as dose-dependence and liver toxicity,8 thereby, the development and utilization of natural low-toxicity or liver-protecting nutritional preparations is urgent.Tea is the second most popular natural non-alcoholic beverage after water, and has been consumed all over the world for thousands of years. Studies on both human and animals have showed that tea consumption are associated with the blood lipid reduction and body weight loss.9–11 Recently, considerable functional components were identified from tea, including polyphenols,12 catechin,13 EGCG and caffeine,14 which are involved in promoting cholesterol reverse transport15 through regulating key transcription factors of lipid metabolism16 and activating lipid catabolism in liver.17 Some reports have found that caffeine in tea was able to promote lipolysis in adipocytes, and it worked with catechins to inhibit triglyceride accumulation and adipocyte proliferation.18,19 Compound green tea (CGT), a famous folk formula to reduce HLP, hypertension and hyperglycemia, consists of green tea (Camellia sinensis L.) and other five herbs (Lithocarpus polystachyus Rehd., Ilex latifolia Thunb., Mentha canadensis L., Nelumbo nucifera Gaertn., and Lonicera japonica Thunb.), which are consumed by the local people. CGT, in our previous report, proved to be able to regulate intestinal flora imbalance caused by obesity.20 Polyphenols extracted from Ilex latifolia Thunb. had the beneficial effect of antioxidant and anti-inflammatory by inhibiting MAPK and NF-kB activation.21 In addition, it has also been found that Nelumbo nucifera Gaertn. extracts were responsible for potential efficiency on hyperglycemia, HLP and inflammation through stimulating glucose consumption in HepG2 cells, as well as inhibiting the activities of α-glucosidase, pancreatic lipase and COX-2.22 Furthermore, Lonicera japonica Thunb. was able to improve the abnormalities caused by diabetes by resisting hyperglycemic activity and inhibiting the formation of AGEs.23
Metabolomics is normal used to explore potential biomarkers and establish the relative relationship between endogenous substances and physiological functions of diseases.24,25 This technology has been widely used in the research of HLP, which can provide valuable information for the diagnosis and treatment of HLP,26 and is of great significance to the research progress of HLP and the development of corresponding drugs.27 Therefore, in this study, we investigated the lipid-lowering mechanism of CGT, and studied the effect on lipid metabolism in liver of hyperlipidemic mice by ultra-performance liquid chromatography (UPLC) technology, which provides reference for development and utilization of CGT.
Materials and methods
Materials and reagents
CGT is composed of Duyun ancient green tea (Camellia sinensis (L.) O. Ktze.), Duyun original tree sweet tea (Lithocarpus polystachyus Rehd.), Duyun broad-leaved Kuding (Ilex latifolia Thunb.), wild mint (Mentha canadensis L.), lotus leaf (Nelumbo nucifera Gaertn.) and honeysuckle (Lonicera japonica Thunb.) with the weight ratio of 2![[thin space (1/6-em)]](https://www.rsc.org/images/entities/char_2009.gif) :1:1:1:1:1. All plant materials were purchased from Guizhou Bishu Technology Co., Ltd, China. SPF male KM mice were provided by Shanghai Shrek Jingda experimental animal Co., Ltd, China. All other reagents used in this study were of analytical grade (purity > 98%; Merck, Germany).
:1:1:1:1:1. All plant materials were purchased from Guizhou Bishu Technology Co., Ltd, China. SPF male KM mice were provided by Shanghai Shrek Jingda experimental animal Co., Ltd, China. All other reagents used in this study were of analytical grade (purity > 98%; Merck, Germany).
Tea sample preparation
An appropriate amount of CGT was crushed and extracted in boiling water at 100 °C for 30 min at a tea–water ratio of 1:10. The tea dregs after vacuum filtration were extracted again by the same method, and then these two extracts were combined together. The filtrate was evaporated to a suitable concentration with a rotary evaporator. After being frozen at −80 °C for 12 h, it was vacuum dried for 30 h, and the final obtained dry powder was stored at −20 °C.
Animal experiment design
The experimental protocol was approved by animal care of Qiannan Medical College for Nationalities and institutional animal ethical committee (Guizhou, China). The mice were kept in a mouse room with a temperature of 22 ± 2 °C and a relative humidity of 55 ± 5%, allowing them to eat and drink freely. After seven days of adaptive feeding, the mice were randomly divided into four groups with ten mice in each group: compound tea treatment group (DH), high-fat model control group (NK), normal control group (CK) and positive drug group (YK). CK group was fed with conventional diet (20.0% flour, 10.0% rice flour, 20.0% corn, 26.0% bran, 20.0% soybean, 2.0% fishmeal and 2.0% bonemeal), while DH, NK and YK groups were fed with high-fat diet (1.5% cholesterol, 10.0% lard, 5.0% egg yolk powder, 0.5% bile salt and 83.0% normal diet). In addition, mice in the CK and NK groups were given purified water, while DH and YK groups were treated with CGT extracts (840 mg kg−1) and positive drug Xuezhikang (XZK) (91 mg kg−1) by gavage, respectively. Four groups of mice were kept separately, the bedding material and drinking water was replaced every two days and once a week, respectively. During the experiment, the activity and physiological status of mice were observed and recorded every day. The mice were weighed weekly, the intragastric dose of positive drug XZK and CGT was slightly adjusted according to changes in body weight. After 30 days of the experimental protocol, the mice were euthanized after fasting for 12 h. Then, liver tissues were harvested and blood was collected from the eyeball in heparinized tubes.Compositions of tea extract and individual catechins for LC-MS/MS analysis
Analysis of the individual catechins was performed according to the method of Susanti et al.28100 mg of tea powder for chemical composition analysis was dissolved in 1.2 mL of 70% methanol extract and vortexed 30 s every 30 min for 6 times in total. Then, samples were placed at 4 °C overnight. Following centrifugation for 10 min at 12000×g, the supernatant was collected and filtered with a microporous membrane (SCAA-104, 0.22 μm pore size; ANPEL, Shanghai). Subsequently, the samples were analyzed using an UPLC-ESI-MS/MS system (UPLC, SHIMADZU Nexera X2; MS, Applied Biosystems 4500 Q TRAP). The analytical conditions were as follows, UPLC: column, Agilent SB-C18 (1.8 μm, 2.1 mm × 100 mm); the mobile phase was consisted of solvent A (pure water with 0.1% formic acid) and solvent B (acetonitrile with 0.1% formic acid). Sample measurements were performed with a gradient program that employed the starting conditions of 95% A, 5% B. Within 9 min, a linear gradient to 5% A, 95% B was programmed, and a composition of 5% A, 95% B was kept for 1 min. Subsequently, a composition of 95% A, 5.0% B was adjusted within 1.1 min and kept for 2.9 min. The flow velocity was set as 0.35 mL min; The column oven was set to 40 °C; The injection volume was 4 μL. LIT and triple quadrupole (QQQ) scans were acquired on a triple quadrupole-linear ion trap mass spectrometer (Q TRAP), QTRAP® 6500+ LC-MS/MS System, equipped with an ESI Turbo Ion-Spray interface, operating in positive and negative ion mode and controlled by Analyst 1.6.3 software (AB Sciex). The ESI source operation parameters were as follows: source temperature 500 °C; ion spray voltage (IS) 5500 V (positive), −4500 V (negative); ion source gas I (GSI), gas II (GSII), curtain gas (CUR) was set at 55, 60, and 25.0 psi, respectively; the collision gas (CAD) was high.
Serum biochemical analysis
Blood samples were centrifuged for 10 min at 12000×g for analysis of serum total cholesterol (TC), triglyceride (TG), low-density lipoprotein (LDL-C) and high-density lipoprotein (HDL-C) levels using commercially available kits (Nanjing Jiancheng Biotechnology Co., Ltd, China).
Liver samples for LC-MS/MS analysis
The blood on liver tissue was rinsed with precooled normal saline prepared in advance. 50 mg of liver tissue was accurately weighed, and 1000 μL of pre-cooled extractant (70% methanol aqueous solution containing 1 μg mL−1 2-chlorophenylalanine as an internal standard) was added. After the homogenate was frozen for 3 min, the supernatant was obtained by centrifugation (12000 rpm) at 4 °C for 10 min, which was to be detected.
The sample extracts were analyzed using an LC-ESI-MS/MS system (UPLC, Shim-pack UFLC SHIMADZU CBM A system; MS, QTRAP® 6500+ System). The analytical conditions were as follows: Column, Waters ACQUITY UPLC HSS T3 C18 (1.8 μm, 2.1 mm × 100 mm), maintained at 40 °C. The mobile phase included phase A ultrapure water (0.04% acetic acid) and phase B acetonitrile (0.04% acetic acid). The gradient program was used: 95:5 V/V at 0 min, 5:95 V/V at 11.0 min, 5:95 V/V at 12.0 min, 95:5 V/V at 12.1 min, 95:5 V/V at 14.0 min. The flow rate was 0.4 ml min−1 and the injection volume was 2 μL. The mass spectrum conditions were the same as those of tea extract analyzed by LC-MS/MS.
Statistical analysis
Analyst 1.6.3 software and multiple reaction monitoring (MRM) mode of triple quadrupole mass spectrometry were used to process mass spectrum data and carry out quantitative analysis. Peak extraction and peak correction were performed for all metabolites. All data sets were analyzed by OPLS-DA model after processing, and the validity of the model was evaluated by the values of prediction parameters R2X, R2Y and Q2, whose size directly reflected the reliability of the model. Data were expressed as mean ± standard error and were subjected to one-way analysis of variance (ANOVA) followed by the statistical software SPSS statistics version 22 (IBM). Multiple comparisons between different groups were conducted by Tukey test, and P < 0.05 was considered statistically significant.Results
Composition of tea extract and catechins
A total of 1069 compounds in positive (572 species) and negative (497 species) ionization modes compared with the standard compound database were identified in CGT (ESI Table 1†), including flavonoids, phenolic acids, lipids, alkaloids, amino acids and derivatives, nucleotides and derivatives, lignans and coumarins, tannins, terpenoids, organic acids and others (Fig. 1). Among these compounds, flavonoids had the most abundant relative contents, with 318 compounds accounting for 29.8%, followed by phenolic acids (186 species, 17.4%) and lipids (113 species, 10.6%). In addition, a total of 4.2% catechins was detected in CGT, which consisted of 2.12% (−)-epigallocatechin-3-gallate (EGCG), 0.32% catechin (C), 0.31% (−)-epicatechin gallate (ECG), 0.34% (−)-gallocatechin gallate (GCG), 0.31% (−)-epigallocatechin (EGC), 0.26% (−)-catechin gallate (CG), 0.33% (−)-epicatechin (EC), and 0.17% (−)-gallocatechin (GC) (Fig. S1,† Table 1).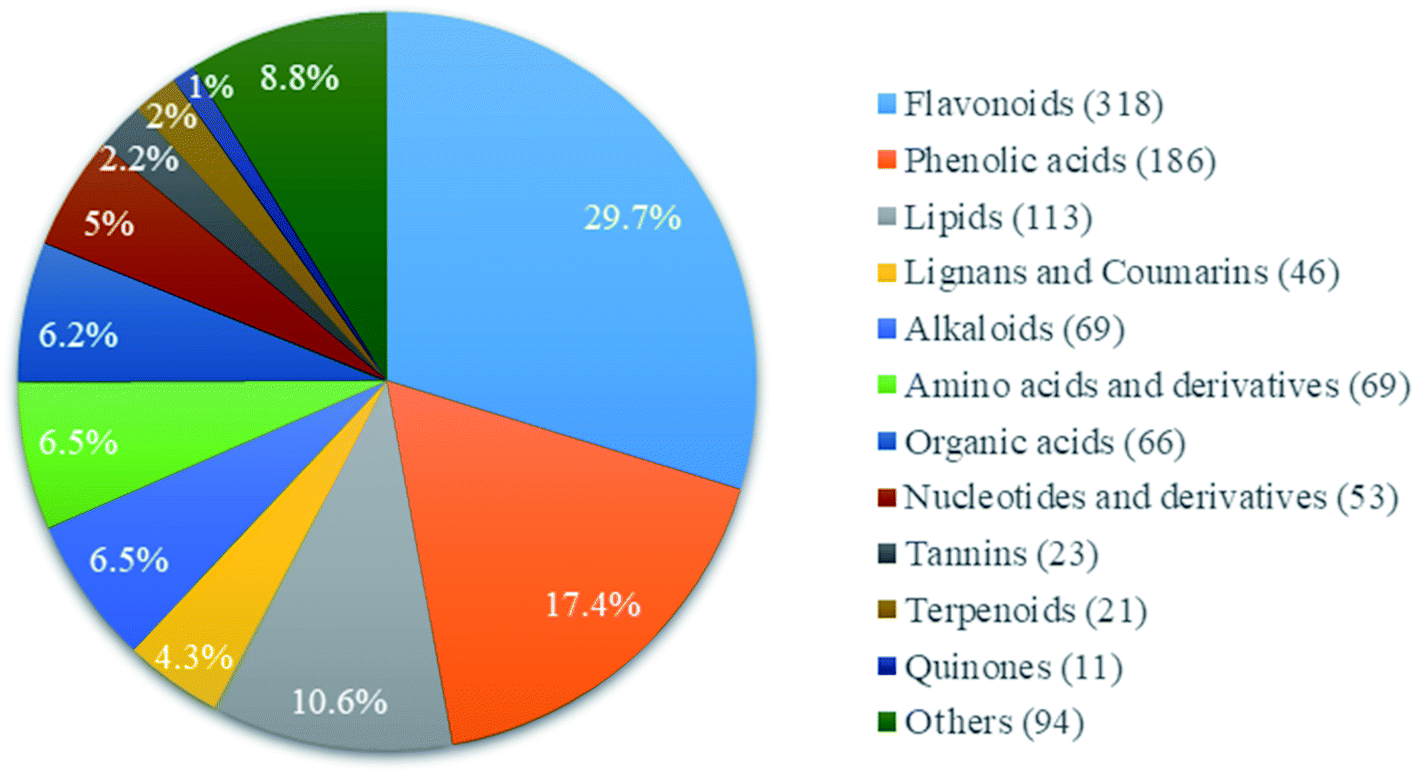 | ||
| Fig. 1 Types and relative contents of main chemical compositions in tea extract. | ||
| Catechins | Standard sample | Tea sample | mg ml−1 | Percent (%) | ||
|---|---|---|---|---|---|---|
| RT | Area | RT | Area | |||
| GC | 4.728 | 8042.9 | 2.923 | 254.5 | 0.03 | 0.17% |
| EGC | 7.001 | 4156.9 | 4.307 | 245.5 | 0.06 | 0.31% |
| C | 8.839 | 1058.5 | 5.913 | 996.0 | 0.06 | 0.32% |
| EC | 12.653 | 38353.5 |
9.449 | 2373.8 | 0.06 | 0.33% |
| EGCG | 12.985 | 45294.0 |
10.567 | 18209.4 |
0.40 | 2.12% |
| GCG | 15.035 | 29088.8 |
12.066 | 1869.6 | 0.06 | 0.34% |
| ECG | 22.540 | 68293.6 |
16.338 | 4139.1 | 0.06 | 0.32% |
| CG | 23.814 | 14202.9 |
17.906 | 709.3 | 0.05 | 0.26% |
Effects of CGT on body weight and serum biochemical indexes in HLP mice
To investigate the effects of CGT on blood lipids in mice, body weight, the serum levels of TC, TG, LDL-C and HDL-C were determined. As shown in Table 2, there was no significant difference in the initial body weight of mice (P > 0.05). After the end of the experiment, the final weight and the levels of TC, TG and LDL-C in NK group were significantly increased (P < 0.05), while HDL-C was remarkably decreased (P < 0.05), indicating that the model was successfully established and the HLP of mice was successfully induced by high-fat diet. Compared with the NK group, the final weight and TC, TG and LDL-C levels of mice in DH group and YK group decreased significantly (P < 0.05), while the HDL-C level showed a remarkable upward trend (P < 0.05), and there was no significant difference between DH group and CK group. These findings showed that CGT and positive drug XZK might regulate the level of blood lipid in mice.| Treatment | Initial body wt (g) | Final body wt (g) | TC/mmol L−1 | TG/mmol L−1 | LDL/mmol L−1 | HDL/mmol L−1 |
|---|---|---|---|---|---|---|
| a Values in capital letters are expressed as mean ± SD of 10 mice in each group, the values in lower case in the same column at p < 0.05. CK, normal control group; NK, high-fat model control group; YK, positive drug group; DH, compound tea treatment group. | ||||||
| CK | 27.23 ± 1.29a | 43.75 ± 1.03bc | 2.81 ± 0.16c | 0.64 ± 0.02b | 0.55 ± 0.02b | 1.05 ± 0.07a |
| NK | 28.01 ± 1.06a | 52.09 ± 1.56a | 3.69 ± 0.12a | 0.73 ± 0.09a | 0.69 ± 0.05a | 0.78 ± 0.03b |
| YK | 27.71 ± 1.93a | 45.46 ± 1.28b | 2.97 ± 0.19bc | 0.56 ± 0.05bc | 0.53 ± 0.06b | 1.03 ± 0.04a |
| DH | 27.08 ± 0.65a | 44.52 ± 1.16bc | 3.22 ± 0.06b | 0.47 ± 0.07c | 0.56 ± 0.03b | 1.04 ± 0.06a |
Qualitative and quantitative metabolites detection
The mass spectrum data were processed by the software analyst 1.6.3. Quality control (QC) samples prepared by mixing sample extracts were inserted into every 10 test samples to monitor the repeatability of the analysis process. Because mass spectrometry total ion current (TIC) is a spectrum obtained by continuously summing the intensities of all ions in the mass spectrum at each time point, the overlay display analysis of TIC can be used to determine the accuracy and repeatability of metabolite detection. The ion flux spectrum of each extracted substance in MRM can be determined by multi substance extraction ion chromatography (XIC). The mass spectrum peaks with different colors represent different metabolites detected, and the peak area represents the relative content of the corresponding substances. Thus, the overlapping spectra of TIC and QC samples in this study showed that the curve overlap of TIC was higher, and the retention time and peak intensity were the same, indicating that the signal stability of the same sample was better when detected by mass spectrometry (Fig. S2†). A total of 110 kinds of lipid metabolites were detected, including glycerol 3-phosphate, Lysopc 18:2, linoleic acid (LA) (C18:2), γ-linolenic acid (GLA) (C18:3), 6 keto-PGF1α, eicosapentaenoic acid (EPA), myristic acid, hexyl butyrate, 12-hydroxy-eicosatetraenoic acid, cholesterol, etc. (ESI Table 2†).Screening of differential metabolites
Significantly regulated metabolites between groups were screened by the combination of VIP ≥ 1 and absolute log2FC (fold change) ≥ 1 in all four pairwise comparisons. Among all the 110 differential metabolites detected, 54 significantly different metabolites were divided into five categories, including oxidized lipids (33), fatty acyls (16), lipids (5), phospholipids (21), and fatty acids (35) (Table 3).
| Metabolites | CK vs. NK | NK vs. DH | NK vs. YK | CK vs. DH | CK vs. YK | |||||
|---|---|---|---|---|---|---|---|---|---|---|
| VIP | log2FC |
VIP | log2FC |
VIP | log2FC |
VIP | log2FC |
VIP | log2FC |
|
| a The statistically selected metabolites with significant differences are shown in the annotations in the KEGG database. “↑” and “↓” indicate that metabolites are up-regulated and down-regulated, respectively. | ||||||||||
| Lysopg 18:1 | 1.95 | 1.34 ↑ | ||||||||
| Lysope 18:1 | 1.90 | 1.29 ↑ | ||||||||
| Lysopa 18:0 | 1.29 | 1.79 ↑ | 1.37 | 1.34 ↑ | ||||||
| Lysops 22:5 | 1.04 | −1.02 ↓ | 1.58 | 2.03 ↑ | ||||||
| Lysope 14:0 | 1.05 | −1.26 ↓ | ||||||||
| Lysopc 16:1 | 1.75 | −1.09 ↓ | 1.56 | −1.39 ↓ | ||||||
| Lysopc 18:1 | 1.69 | −1.17 ↓ | ||||||||
| Lysopc 18:2 | 1.74 | −1.02 ↓ | ||||||||
| Lysopc 20:2 | 1.58 | −1.00 ↓ | 1.44 | 1.14 ↑ | ||||||
| Lysopc 14:0 | 1.52 | −1.10 ↓ | ||||||||
| Lysopc 15:0 | 1.63 | −1.22 ↓ | ||||||||
| LysoPE (16:1(9Z)/0:0) | 1.17 | −1.23 ↓ | ||||||||
| (±)17-HETE [(±)17-hydroxy-5Z,8Z,11Z,14Z-eicosatetraenoic acid] | 1.77 | −8.23 ↓ | 1.40 | 8.61 ↑ | 1.59 | −8.23 ↓ | ||||
| 13-HOTrE [13S-hydroxy-9Z,11E,15Z-octadecatrienoic acid] | 1.33 | −4.89 ↓ | 1.30 | −6.38 ↓ | 1.60 | −5.31 ↓ | ||||
| cis-11,14-Eicosadienoic acid (C20:2) | 1.70 | 1.20 ↑ | 1.27 | 1.14 ↑ | ||||||
| 9-HOTrE [9S-hydroxy-10E,12Z,15Z-octadecatrienoic acid] | 1.64 | −1.41 ↓ | 1.68 | −1.34 ↓ | ||||||
| Tetradecanedioic acid | 1.07 | −1.30 ↓ | 1.64 | −1.96 ↓ | ||||||
| PE (18:1(9Z)/0:0) | 1.90 | 1.37 ↑ | 1.40 | 1.41 ↑ | ||||||
| (±)5-HEPE [(±)-5-hydroxy-6E,8Z,11Z,14Z,17Z-eicosapentaenoic acid] | 2.15 | −1.69 ↓ | ||||||||
| (±)7-HDHA [(±)7-hydroxy-4Z,8E,10Z,13Z,16Z,19Z-docosahexaenoic acid] | 1.26 | −1.14 ↓ | 1.10 | −1.10 ↓ | ||||||
| 13-oxo-ODE [13-oxo-9Z,11E-octadecadienoic acid] | 1.07 | −1.17 ↓ | 1.44 | −1.43 ↓ | ||||||
| Stearidonic acid | 1.19 | −1.56 ↓ | 2.17 | 1.71 ↑ | 1.64 | −2.04 ↓ | ||||
| p-Mentha-1,3,8-triene | 1.07 | −1.05 ↓ | 2.12 | 1.63 ↑ | 1.59 | −1.26 ↓ | ||||
| (±)12-HEPE [(±)-12-hydroxy-5Z,8Z,10E,14Z,17Z-eicosapentaenoic acid] | 1.17 | −2.28 ↓ | 1.28 | −5.55 ↓ | 1.24 | −4.98 ↓ | ||||
| (±)12-HETE [(±)12-hydroxy-5Z,8Z,10E,14Z-eicosatetraenoic acid] | 1.33 | −2.12 ↓ | 1.74 | −2.31 ↓ | 1.32 | −6.64 ↓ | 1.44 | −6.83 ↓ | ||
| (±)15-HEPE [(±)-15-hydroxy-5Z,8Z,11Z,13E,17Z-eicosapentaenoic acid] | 1.31 | −7.09 ↓ | 1.36 | −7.09 ↓ | 1.72 | −12.40 ↓ | 1.63 | −12.40 ↓ | ||
| (±)17-HDHA [(±)17-hydroxy-4Z,7Z,10Z,13Z,15E,19Z-docosahexaenoic acid] | 1.93 | −7.99 ↓ | 2.36 | −7.99 ↓ | 1.39 | −12.24 ↓ | 1.48 | −12.24 ↓ | ||
| 12,13-EpOME [(±)12(13)-epoxy-9Z-octadecenoic acid] | 1.08 | −1.48 ↓ | ||||||||
| 14(S)-HDHA [14S-hydroxy-4Z,7Z,10Z,12E,16Z,19Z-docosahexaenoic acid] | 1.15 | −1.93 ↓ | 1.19 | −2.04 ↓ | 1.31 | −6.71 ↓ | 1.38 | −6.82 ↓ | ||
| (±)18-HEPE [(±)-18-hydroxy-5Z,8Z,11Z,14Z,16E-eicosapentaenoic acid] | 1.28 | −7.45 ↓ | 1.39 | −12.01 ↓ | 1.48 | −12.01 ↓ | ||||
| (±)18-HETE [(±)18-hydroxy-5Z,8Z,11Z,14Z-eicosatetraenoic acid] | 1.36 | −1.65 ↓ | 1.43 | −2.56 ↓ | ||||||
| (±)9-HETE [(±)-9-hydroxy-5Z,7E,11Z,14Z-eicosatetraenoic acid] | 1.28 | −6.09 ↓ | 1.38 | −11.66 ↓ | 1.48 | −11.66 ↓ | ||||
| 11(S)-HETE [11S-hydroxy-5Z,8Z,12E,14Z-eicosatetraenoic acid] | 1.55 | −1.71 ↓ | 1.27 | −1.94 ↓ | ||||||
| 11,12-EET [(±)11,(12)-epoxy-5Z,8Z,14Z-eicosatrienoic acid] | 1.51 | −1.71 ↓ | 1.23 | −1.92 ↓ | ||||||
| 14,15-EET [(±)14(15)-epoxy-5Z,8Z,11Z-eicosatrienoic acid] | 1.46 | −1.63 ↓ | ||||||||
| Cuminaldehyde | 1.14 | −1.34 ↓ | 1.39 | −1.71 ↓ | ||||||
| 2-Methylbutyroylcarnitine | 1.23 | −2.08 ↓ | 1.02 | −2.15 ↓ | ||||||
| 6 keto-PGF1α [6-oxo-9α,11α,15S-trihydroxy-prost-13E-en-1-oic acid] | 1.08 | −1.54 ↓ | 1.19 | −2.03 ↓ | 1.09 | −3.87 ↓ | ||||
| PGF1α | 1.39 | 1.52 ↑ | ||||||||
| PGF2α | 1.10 | −2.11 ↓ | ||||||||
| PGD2 | 1.17 | −3.20 ↓ | ||||||||
| TXB2 | 1.28 | −2.58 ↓ | ||||||||
| Punicic acid | 1.05 | −2.22 ↓ | 1.40 | −2.42 ↓ | 1.38 | −2.61 ↓ | ||||
| 12-Hete | 1.16 | −2.86 ↓ | 1.33 | −3.09 ↓ | ||||||
| γ-Linolenic acid (C18:3N6) | 1.02 | −1.05 ↓ | ||||||||
| Palmitoleic acid (C16:1) | 1.04 | −1.10 ↓ | ||||||||
| EPA [5Z,8Z,11Z,14Z,17Z-eicosapentaenoic acid] | 1.00 | −1.31 ↓ | ||||||||
| 8,15-Dihete | 1.09 | −1.08 ↓ | ||||||||
| 3-Methylglutaric acid | 1.06 | −1.34 ↓ | 1.38 | −1.38 ↓ | ||||||
| cis-7-Hexadecenoic acid | 1.01 | −1.04 ↓ | ||||||||
| 2,2-Dimethyl succinic acid | 1.07 | −1.33 ↓ | 1.29 | −1.31 ↓ | ||||||
| 9-oxo-ODE [9-oxo-10E,12Z-octadecadienoic acid] | 1.36 | −1.25 ↓ | ||||||||
The expression of metabolites was found to be altered significantly in the NK group when the mice were fed with high-fat diet. Among them, 6 metabolites, Lysopg 18:1, Lysope 18:1, Lysopa 18:0, cis-11,14-eicosadienoic acid (C20:2), PE (18:1(9Z)/0:0), and PGF1α, were significantly upregulated in NK group, of which PE (18:1(9Z)/0:0) had the highest content in NK group with log2FC > 1.37, and Lysopa 18:0 increased most with log2FC > 1.79; Lysopc 18:0 and 18:1 were also increased but were not screened as significant substances; PGF1α was not significantly different in the comparison between other groups; ten metabolites were significantly downregulated in NK group compared to that in the CK group, of which (±)17-HETE had the lowest content with log2FC < −8.23.
When evaluated the substance level, it was found that 16 metabolites were screened in the comparison of NK vs. DH, among which 15 significantly downregulated metabolites, with the example of 6 keto-PGF1α, Lysopc 16:1, Lysopc 18:1, and Lysopc 18:2, were observed in the DH group with the exception of (±)17-HETE (log2FC > 8.61).
In addition, the positive drug XZK (the YK group) was applied to estimate the efficacy of lowering blood lipids. It was shown that 14 compounds were significantly downregulated compared with the NK group, with the example of (±)18-HEPE, 6 keto-PGF1α, and (±)12-HETE, while 2 compounds were upregulated in YK group, which were stearidonic acid, and p-mentha-1,3,8-triene.
Subsequently, we compared the blood lipids in CGT or XZK group with the normal diet group. The contents of all 27 differential metabolites showed a downward trend when mice were fed with CGT, of which (±)15-HEPE had the largest reduction with log2FC < −12.40, follow by (±)17-HDHA (log2FC < −12.24), and (±)18-HEPE (log2FC < −11.66), and GLA and EPA were slightly reduced with log2FC < 1.05 and 1.31, respectively; Lysopcs (16:1, 14:0, 15:0) also significantly decreased; in addition to the three abovementioned compounds in CK group, another 19 metabolites were found downregulated in the YK group, including 6 keto-PGF1α, (±)9-HETE, tetradecanedioic acid, (±)17-HETE, etc. However, Lysopc 20:2 was higher in the YK group than that in the CK group.
Functional annotation and enrichment analysis of differential metabolites
According to the KEGG database, we annotated the different metabolites to find the main secondary metabolite pathway and biosynthesis pathway, such as cis-11,14-eicosadienoic acid, GLA, EPA, palmitoleic acid, Lysopc 16:1, and arachidic acid (Fig. 2). The changes of these metabolites were related to the metabolism of LA, α-linolenic acid (ALA) metabolism, arachidonic acid metabolism, xylene degradation and serotonergic synapse might play an important role in maintaining normal physiological function of cells and antioxidation and lipid-lowering (Fig. 2). Obviously, linolenic acid metabolism, biosynthesis of unsaturated fatty acids, and ALA metabolism were closely related to fatty acid metabolism in the KEGG classification of CK vs. NK group, indicating that the induction of high-fat diet changed the biomarkers and metabolism levels associated with lipid metabolism in mice (Fig. 2A). But, instead, the decreased of linolenic acid metabolism, glycerophospholipid metabolism and choline metabolism in cancer were observed (Fig. 2B), which revealed that CGT treatment down-regulated the levels of metabolisms related to lipid metabolism and the risk of cancer. In addition, positive drug XZK consumption could also change the levels of metabolisms caused by high-fat diet (Fig. 2C). These results suggested that high-fat diet could disturb the level of lipid metabolism in vivo, while CGT or XZK treatment may effectively reverse risk of suffering from HLP.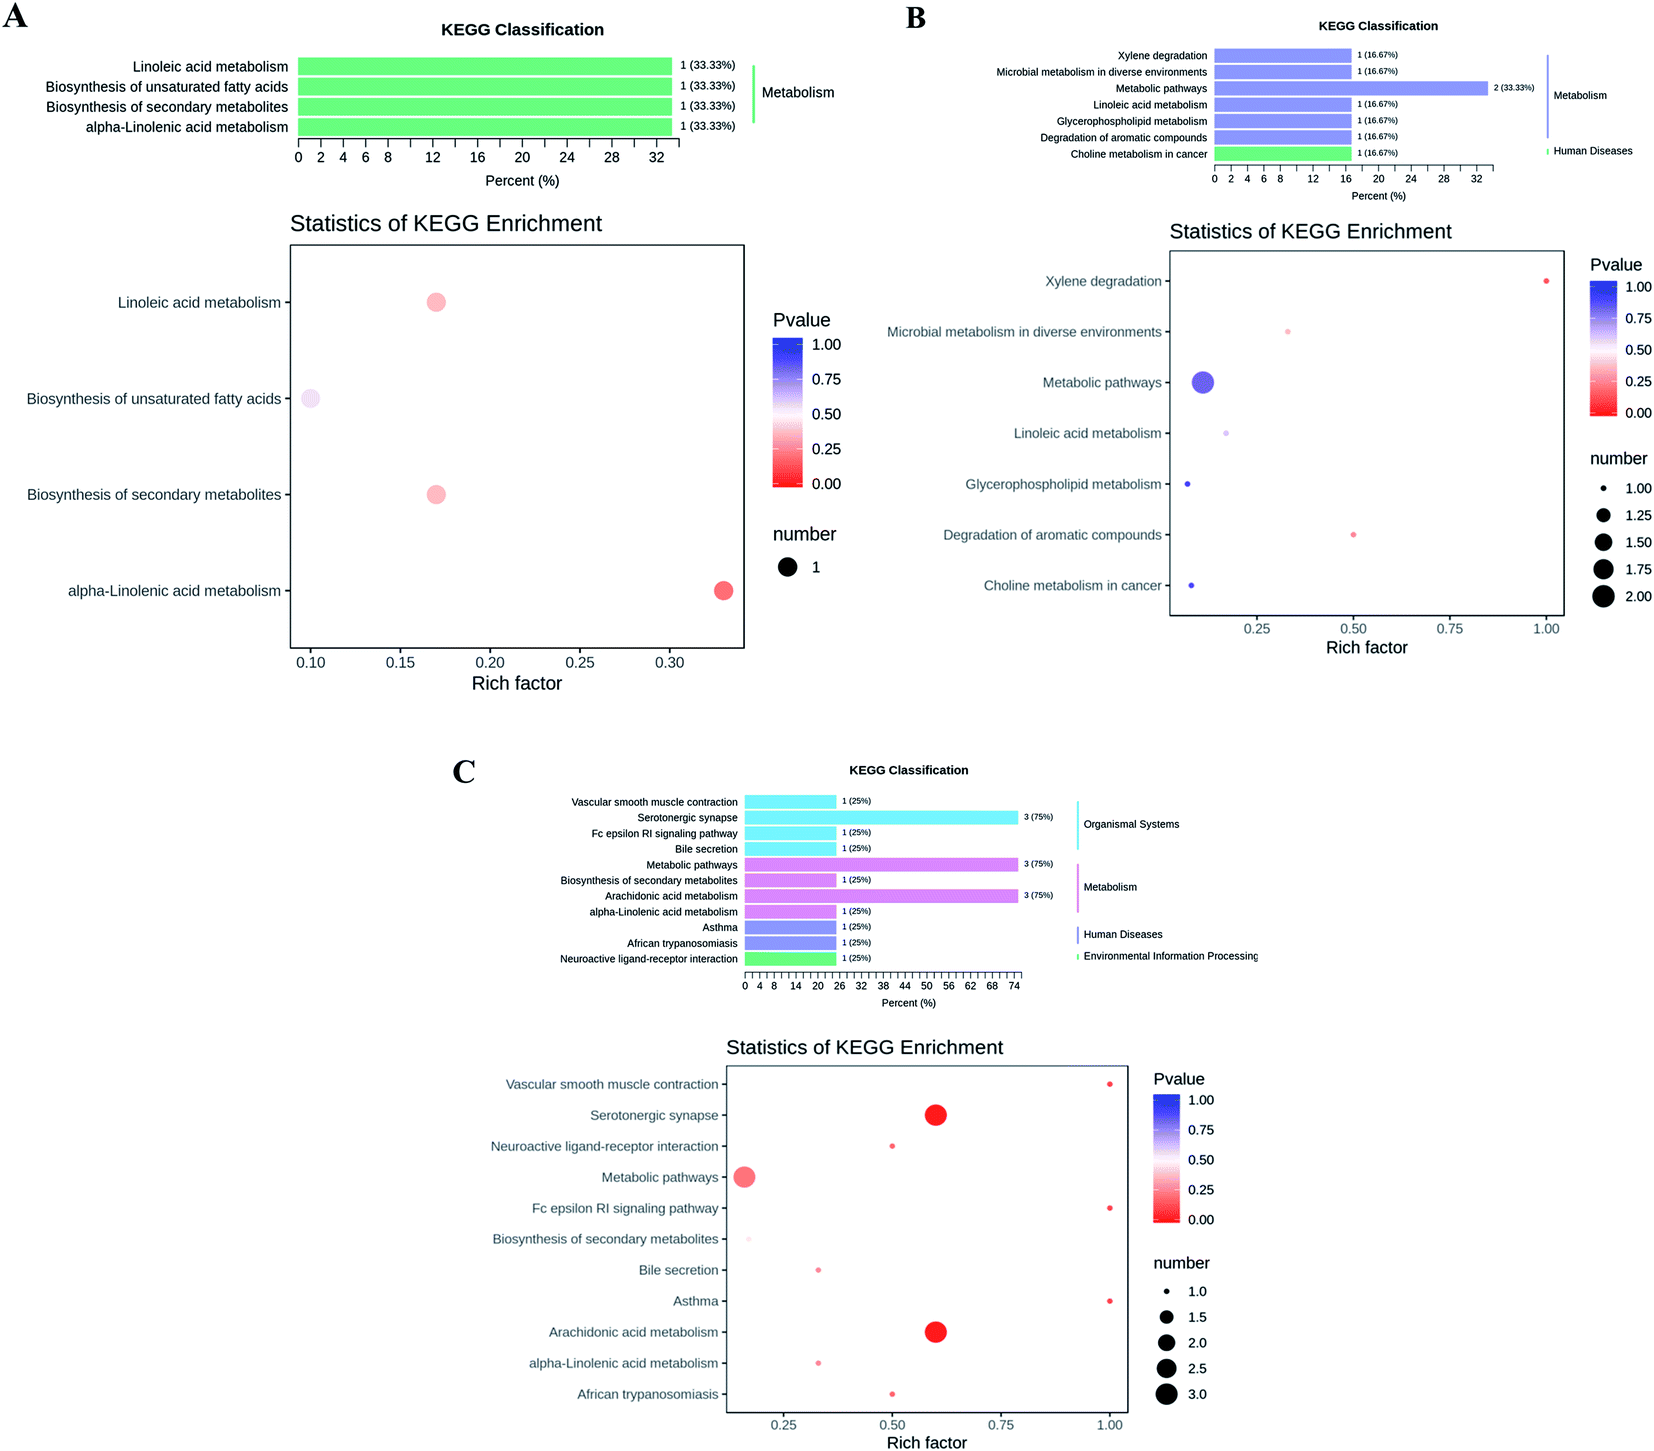 | ||
| Fig. 2 Differential metabolite KEGG classification diagram and enrichment analysis diagram. (A) CK vs. NK, (B) NK vs. DH, (C) NK vs. YK. The abscissa represents the rich factor corresponding to each pathway, and the ordinate is the pathway name. The color of the point is p-value, and the redder color means the more significant the enrichment. The size of the dots represents the number of differential metabolites enriched. | ||
Discussion
CGT is rich in beneficial compounds, such as flavonoids, alkaloids, vitamins, etc., which are widely consumed by local people owing to its biological functions, especially anti-obesity and anti-HLP. In this study, we identified 318 compounds from flavonoids in CGT (ESI Table 1†), and catechins including C, ECG, GCG, EGCG, EGC, CG, EC, and GC (Table 1). EGCG, the most popular catechins, have been reported to play an important role in reducing the accumulation of adipose tissue and alleviating dyslipidemia, as well as significantly decreasing liver TC levels in mice by promoting lipid excretion, promoting intestinal metabolic disorders and enhancing the expression of genes associated with fatty acid oxidation.12,29–31 Clinical trials have shown that high-dose EGCG was able to inhibit weight gain, decrease serum levels of TC and LDL.30 Thus, EGCG (2.12%) found in our study may contribute most to the regulation of dyslipidemia and lipid metabolism disorders.Clinically, TG, TC, LDL-C and HDL-C indicators are often used to diagnose HLP.32 Study indicated that the increased serum TC and LDL-C levels are major hazard factors for the occurrence of atherosclerosis. In this study, CGT successfully regulated the serum levels of TG, TC, LDL-C and HDL-C in HLP mice induced by high-fat diet. Firstly, the results showed that the final body weight, TC, TG and LDL-C levels of mice fed with high-fat diet were significantly increased, while HDL-C was notably decreased. Contrary to NK group, the final body weight, the serum levels of TC, TG, LDL-C and HDL-C of mice in DH group and YK group were reversed after one month of CGT treatment, and there was no significant difference from CK group. These results clearly suggested that CGT and positive drug XZK treatment may well regulate the serum lipid levels of HLP mice, and have preventive and therapeutic effects on HLP. CGT may also have an inhibitory effect on atherosclerosis, mainly due to the up-regulation of free radical scavenging enzymes and the reduction of risk factors for lipoprotein (a) and plasma oxidized LDL.
Lipid is an important component of cytomembrane, mainly composed of polyunsaturated fatty acids (PUFAs). Common PUFAs include GLA, diphenylmethyl-GLA (DGLA), EPA, docosahexaenoic acid (DHA) and arachidonic acid (AA), etc.33 They are derived from LA and ALA in the diet through the action of desaturase, and their activity decrease with age.34,35 LA, an essential PUFAs for the human body, is the precursor of prostaglandins (PGs), a class of lipid mediators produced by enzymatic metabolism of AA, and leucine trienes through the AA pathway. AA is converted into intermediate metabolites of PGs via the action of prostaglandin H synthase (PGH) catalyzed by phospholipase A2 (PLA2) under various physiological and pathological stimuli. In our study, the intake of a high-fat diet led to an increase in the content of PGF1α in mice, suggesting that PGF1α participated in the pathological process of diseases such as inflammation and lipid disorders. Moreover, the decreased content of 6-keto PGF1α could be explained by the fact that both CGT and positive drug XZK treatment may reverse the damage of high-fat diet to mice.
PUFAs, such as ALA, oleic acid (OA), and LA with the ability of inducing endoplasmic reticulum stress, regulating lipid production and lipolysis,36 and inhibiting hepatic steatosis, which are considered to have excellent potential in the treatment of various diseases.37 GLA, belongs to the n-6 series of PUFAs, was mainly involved in the metabolism of LA, which may regulate dyslipidemia through inhibiting the synthesis of serum TC, and eliminating the accumulation of serum TG.38 Furthermore, EPA consumption is thought to be associated with the formation of eicosanic acid, lipoxins and analytical proteins, as well as the regulation of dyslipidemia and the decrease of blood lipids.39 A report claimed that conjugated linoleic acid (CLA), the main PUFA in the organism, can reduce the oxidized form of glutathione, increase the activity of glutathione-dependent antioxidant enzymes, and prevent HLP dyslipidemia, ectopic lipid deposition, insulin resistance and the adverse consequences of metabolic syndrome. Furthermore, the slight reduced the levels of GLA and EPA were observed in DH group compared to CK group, which probably attributed to an increased LA and ALA metabolisms caused by CGT treatment, which resulted in alleviation of dyslipidemia in mice (Fig. 3).
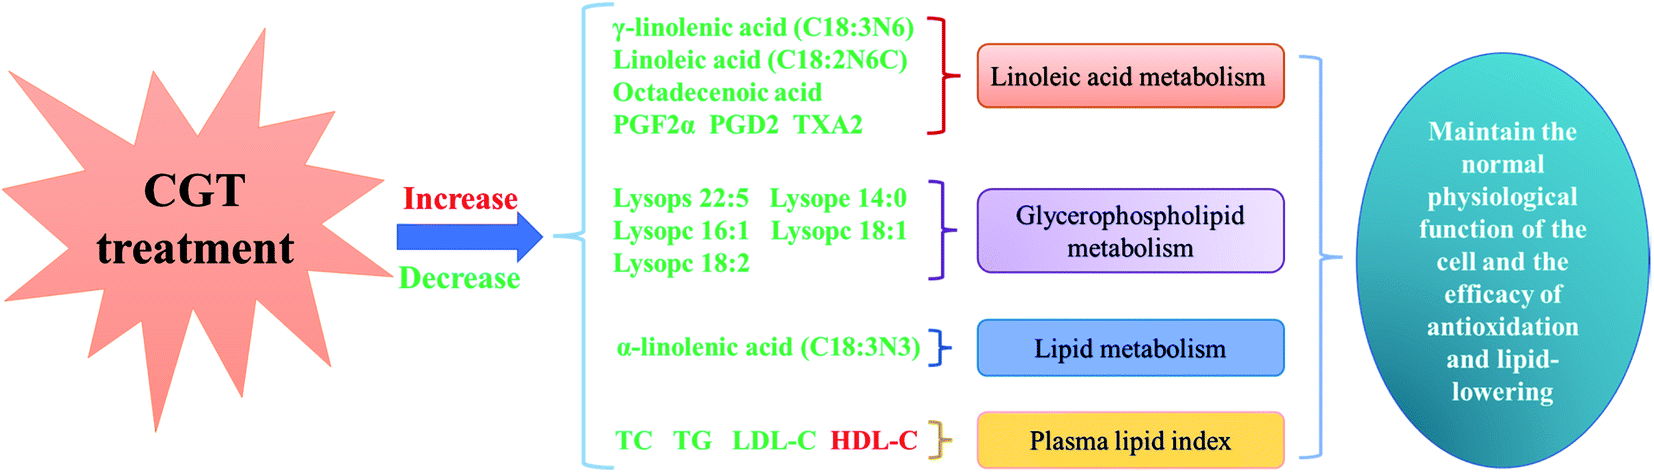 | ||
| Fig. 3 Lipid metabolism in liver of high fat mice treated with CGT. Red characters represent an increase in content, and green characters represent a decrease in content. | ||
Lysopcs, one of phospholipids, have a variety of physiological functions and are closely related to metabolic diseases such as diabetes, atherosclerosis, dyslipidemia, and cardiovascular diseases.40,41 Several reports have demonstrated that Lysopcs may change in certain diseases in vivo. For instance, Lysopcs have the ability to regulate the metabolism of LDL-C, and are involved in atherosclerosis caused by sterol, as well as may also damage endothelial cells by inducing lipid peroxidation of cytomembrane.42 In this study, the elevated levels of Lysopc 18:0 and Lysopc 18:1 in the hepatic tissue of hyperlipidemic mice was observed, suggesting that the intake of high-fat diet destroyed the balance of lipid metabolism and caused dyslipidemia in mice. By contrast, there were a significant decreased levels of Lysopc 16:1, Lysopc 18:1, and Lysopc 18:2 in DH group, which indicated that CGT consumption might be of therapeutic potential to treat dyslipidemia and reducing inflammation in patients with abnormal lipid metabolism. The fecal metabolites of 17 patients with liver cirrhosis and 24 healthy people were clinically detected, which was found that the concentrations of Lysopc 16:0, Lysopc 18:0, Lysopc 18:1 and Lysopc 18:2 in their metabolites were significantly increased, while the concentrations of bile acids and bile pigments were decreased, indicating that the metabolic homeostasis of fatty acids and lipids were also disturbed in patients with liver cirrhosis as liver function damage.43 Furthermore, numerous relevant studies have reported that the level of Lysopcs in serum appeared to increase in animals fed with high-fat diet.44,45 Thus, these findings were consistent with the results in this study, suggesting that Lysopcs level can be served as a specific metabolic marker to evaluate HLP induced by high-fat diet, however CGT treatment was able to alleviate metabolic disorders.
Conclusion
In our study, the HLP mice model was established by the induction of high-fat diet. Our findings have demonstrated that CGT treatment was able to improve body weight maintenance of mice while consuming a high-fat diet, and regulate blood lipid levels, which was similar to results in positive drug XZK. In order to further investigate the mechanism of CGT consumption in HLP mice, LC-MS/MS analysis approach was used to distinguish different metabolic profiling and potential biomarkers of mice in four groups. It was found that CGT could make the abnormal metabolic state return to normal by intervening in different metabolic pathways to partially reverse the lipid metabolism disorder, and reduce the risk of atherosclerosis and non-alcoholic fatty liver caused by high-fat diet feeding, which may be ascribed to the anti-HLP, anti-oxidant and anti-inflammatory effects of its ingredients. These findings indicate that CGT consumption provides new important perspectives for investigating the occurrence and development of lipid metabolism disorders and HLP, and may be helpful to explore new targets for the prevention of dyslipidemia and differential diagnosis of HLP.Abbreviations
| CGT | Compound green tea |
| LC-MS | Liquid chromatography-mass spectrometry |
| DH | Compound tea treatment group |
| NK | High-fat model control group |
| CK | Normal control group |
| YK | Positive drug group |
| XZK | Xuezhikang |
| HLP | Hyperlipidemia |
| HDL-C | High-density lipoprotein |
| TC | Total cholesterol |
| LDL-C | Low density lipoprotein |
| TG | Triglyceride |
| MRM | Multiple reaction monitoring |
| PUFAs | Polyunsaturated fatty acids |
| DGLA | Diphenylmethyl-GLA |
| EPA | Eicosapentaenoic acid |
| GLA | Gamma-linolenic acid |
| DHA | Docosahexaenoic acid |
| AA | Arachidonic acid |
| LA | Linoleic acid |
| ALA | α-Linolenic acid |
| PGH | Prostaglandin H synthase |
| PLA2 | Phospholipase A2 |
| PGF1α | Prostaglandin F1α |
| OA | Oleic acid |
| CLA | Conjugated linoleic acid |
| Lysopg | Lysophosphatidylglycerol |
| Lysope | Lysophosphatidylethanolamine |
| Lysopa | Lysophosphatidic acid |
| Lysops | Lysophosphatidylserine |
| Lysopc | Lysophosphatidylcholine |
| PGD2 | Prostaglandin D2 |
| TXB2 | Thromboxane B2 |
Ethical statement
All animal procedures were performed in accordance with the Guidelines for Care and Use of Laboratory Animals of Qiannan Medical College for Nationalities and approved by the Animal Ethics Committee of Qiannan Medical College for Nationalities (Duyun, China).Conflicts of interest
The authors declare that they have no conflict of interest.Acknowledgements
This work was supported by the Department of Education of Guizhou Province [QianjiaoheKYZi(2020)070, QianjiaoheKYZi(2020)193, QianjiaoheKYZi(2019)001, QianxueweiheZDXK(2016)23, Qianjiaogaofa(2015)337, QianjiaoheKYZi(2016)020, QNYSKYPT2018007, QianjiaoheKYZi(2022)089, QNSYYL2017001]; the Department of Science and Technology of Guizhou Province [QiankeheZhicheng(2019)2377]; the Department of Health of Guizhou Province [gzwkj2012-2-017]; and the Qiannan Normal University for Nationalities [2020qnsyrc06, QNSYKYPT2018004, QNYSKYTD2018004, qnsy2018001].References
- H. Ahmed and P. Adrian, Medicine, 2021, 17 Search PubMed.
- D. T. Fuller, A. T. Grainger, A. Manichaikul and W. Shi, Atherosclerosis, 2020, 293, 1–10 CrossRef CAS PubMed.
- C. Chen, J. Li, D. J. Matye, Y. Wang and T. Li, J. Lipid Res., 2019, 60, 539–549 CrossRef CAS PubMed.
- V. Perez, M. Behrens, C. C. DiRusso and P. N. Black, FASEB J., 2019, 33, 412–488 Search PubMed.
- Y. She, R. Mangat, S. Tsai, S. D. Proctor and C. Richard, Front. Nutr., 2022, 9, 840209 CrossRef PubMed.
- D. Dorota, A. Julio, W. Małgorzata, B. Claudio, G. Rosita, M. Artur, H. Vesna, L. B. Gonzalez, B. Michał, L. Empar and W. Elke, Nutrients, 2021, 13, 4176 CrossRef PubMed.
- T. M. Temu, P. Macharia, J. Mtui, M. Mwangi, P. W. Ngungi, C. Wanjalla, G. S. Bloomfield, C. Farquhar, L. Nyanjau, G. K. Gathecha and J. Kibachio, Medicine, 2021, 100, e27484 CrossRef CAS PubMed.
- A. D. T. Shamran and H. A. Ali, Res. J. Pharm. Technol., 2019, 12, 4310–4312 CrossRef.
- E. C. Anorue, E. C. Mbegbu, G. I. Ngwu, K. N. Ibemenuga and J. E. Eyo, Not. Sci. Biol., 2019, 11, 94–101 CrossRef CAS.
- P. M. Gowri, M. M. Tm, T. P. Mu, M. P. Mei and V. S. Wu, Asian J. Pharmaceut. Clin. Res., 2017, 10(4), 156–159 CrossRef.
- T. Mohsen, F. Narjes, T. Sara, M. Mahnaz, A. Hossein, K. Fatemeh and A. Zatollah, Ann. Nutr. Metab., 2017, 70, 277–285 CrossRef PubMed.
- K. Motofumi, Y. Mai, N. Yuki, T. Kanako, B. Jaehoon, Y. Shuya, Y. Shuhei, O. Hiroaki, N. Takashi, K. Kenji and T. Hirofumi, J. Immunol., 2018, 200, 2502–2504 CrossRef PubMed.
- B. Aadrika, A. Punita, R. Amita and K. Nitesh, Mini Rev. Med. Chem., 2021, 22, 821–833 Search PubMed.
- Z. MingZhi, Z. Fang, O. Jian, W. QiYe, L. YiLong, W. JianLin, H. JianAn and L. ZhongHua, Food Funct., 2021, 12, 4105–4116 RSC.
- H. Monika, S. Claudia, B. Anja, K. Christian, M. Bernhard, W. René, K. Christine, M. D. Shenegelegn and R. Andreas, Mol. Nutr. Food Res., 2021, 65, e2100371 CrossRef PubMed.
- J. H. Woo, L. J. Hae, C. J. Kyu, R. C. Su, L. J. Dae, P. Jaehong and P. Miyoung, Food Sci. Biotechnol., 2021, 30, 1581–1591 CrossRef PubMed.
- M. Kilicarslan, B. A. de Weijer, K. Simonyté Sjödin, P. Aryal, K. W. Ter Horst, H. Cakir, J. A. Romijn, M. T. Ackermans, I. M. Janssen, F. J. Berends, A. W. van de Laar, A. P. Houdijk, B. B. Kahn and M. J. Serlie, FASEB J., 2020, 34, 6099–6110 CrossRef CAS PubMed.
- S. Chikako, Z. Guodong, L. Litong and S. Kazutoshi, J. Food Sci., 2020, 85, 192–200 CrossRef PubMed.
- Z. Yan, Y. Licong, H. Zhanwang, L. Lezhen and Z. Guodong, Eur. J. Nutr., 2017, 56, 2309–2318 CrossRef PubMed.
- Z. Caibi, Z. Xiaolu, W. Zhirui, Y. Zaibo, M. Ren, S. Yuyan, M. Xin, R. D. O. Neill and D. Chongshan, J. Evidence-Based Complementary Altern. Med., 2021, 2021, 8832554 Search PubMed.
- Z. T. Tian, H. Ting, J. J. Guo, Z. J. Wen and Z. Wei, RSC Adv., 2018, 8, 7134–7141 RSC.
- Z. Hui, C. Guilin, Z. Yongli, Y. Mei, C. Jinming and G. Mingquan, Food Chem., 2022, 375, 131856 CrossRef PubMed.
- Y. Shimamura, M. Shibata, M. Sato, R. Nagai, P. Yang, K. Shiokawa, H. Kikuchi and S. Masuda, Food Sci. Technol. Res., 2020, 26, 825–835 CrossRef CAS.
- E. P. Rhee and R. E. Gerszten, Clin. Chem., 2012, 58, 139–147 CrossRef CAS PubMed.
- M. J. Müller and A. Bosy-Westphal, Eur. J. Clin. Nutr., 2020, 74, 1619–1629 CrossRef PubMed.
- H. K. Thandar, P. Jie, P. Duanghathai, T. Montree, U. Chatchanok, C. Sirirat, K. Siriprapa, K. H. Joo, K. Jakrapong and K. Suchart, Life, 2021, 11, 574 CrossRef PubMed.
- B. Chen, K. Su, L. Ye, X. Wang, X. Lu, X. Tu, X. Yang and Z. Yu, Curr. Pharm. Anal., 2021, 17, 702–709 CrossRef.
- E. Susanti, Ciptati, R. Ratnawati, A. Aulanni’Am and A. Rudijanto, Asian Pac. J. Trop. Biomed., 2015, 5, 1046–1050 CrossRef CAS.
- N. Yuji, U. Chihiro, M. Katsura, I. Ryo, Y. Zenta, A. Aya and T. Tomohisa, J. Clin. Biochem. Nutr., 2020, 67, 2–9 CrossRef PubMed.
- I. Chen, C. Liu, J. Chiu and C. Hsu, Clin. Nutr., 2016, 35, 592–599 CrossRef CAS PubMed.
- U. Tomonori, S. Mina and M. Shiho, J. Nutr. Sci. Vitaminol., 2014, 60, 213–219 CrossRef PubMed.
- R. M. Chang, R. J. Kauffman and Y. Kwon, Decis. Support Syst., 2014, 63, 67–80 CrossRef.
- K. Bharat, K. Dhriti, G. Shristy, S. Rahul and B. Savita, Curr. Nutr. Rep., 2021, 10, 1–11 CrossRef PubMed.
- P. C. Calder, Biochem. Soc. Trans., 2017, 45, 1105–1115 CrossRef CAS PubMed.
- A. H. Stark, M. A. Crawford and R. Reifen, Nutr. Rev., 2008, 66, 326–332 CrossRef PubMed.
- K. Kang, M. Miyazaki, J. M. Ntambi and M. W. Pariza, Biochem. Biophys. Res. Commun., 2004, 315, 532–537 CrossRef CAS PubMed.
- J. M. Lee, H. Lee, S. Kang and W. J. Park, Nutrients, 2016, 8, 23 CrossRef PubMed.
- B. Małgorzata and R. Jarosława, Postepy Hig. Med. Dosw., 2015, 69, 892–904 CrossRef PubMed.
- A. Hiroyuki, Y. Junichi, K. Erisa, O. Hisao, S. Haruki, O. Hiroshi and H. Nobuhisa, J. Cardiovasc. Pharmacol. Ther., 2020, 25, 548–555 CrossRef PubMed.
- S. Li, S. Jin, C. Song, C. Chen, Y. Zhang, Y. Xiang, Y. Xu, Y. Feng, Q. Wan and H. Jiang, J. Ethnopharmacol., 2016, 177, 10–18 CrossRef CAS PubMed.
- D. Anna, K. Daria, G. Anna and G. Edyta, Int. J. Mol. Sci., 2021, 22, 5748 CrossRef PubMed.
- S. Tselmin, G. Schmitz, U. Julius, S. R. Bornstein, A. Barthel and J. Graessler, Atheroscler. Suppl., 2009, 10, 27–33 CrossRef CAS PubMed.
- H. Huang, A. Zhang, H. Cao, H. Lu, B. Wang, Q. Xie, W. Xu and L. Li, Dig. Liver Dis., 2013, 45, 677–682 CrossRef CAS PubMed.
- T. Akira, K. Yumi, K. Masaki, M. Maki, Y. Yasuko and F. Kenji, J. Lipid Res., 2002, 43, 307–315 CrossRef.
- S. Li, S. Jin, C. Song, C. Chen, Y. Zhang, Y. Xiang, Y. Xu, Y. Feng, Q. Wan and H. Jiang, J. Ethnopharmacol., 2016, 177, 10–18 CrossRef CAS PubMed.
Footnotes |
| † Electronic supplementary information (ESI) available. See https://doi.org/10.1039/d2ra02831j |
| ‡ C. B. Zhou and L. H. Hu are first authors and contribute to this work. |
| This journal is © The Royal Society of Chemistry 2022 |