 Open Access Article
The effect of two anionic membranes (AMI 7001s and Neosepta AMX) on the electrodeposition of manganese from sulphate solutions
Q. L. Reyes-Morales a,
V. E. Reyes-Cruz
 *a,
A. Trujillo Estradab,
J. A. Cobos-Murciaa,
G. Urbano Reyesa,
M. Pérez Labraa,
A. Manzo Robledoc,
S. Vázquez Bautistad and
E. Ramírez Menesesd
aUniversidad Autónoma del Estado de Hidalgo, Área Académica de Ciencias de la Tierra y Materiales, Carr. Pachuca-Tulancingo km 4.5 s/n, Mineral de la Reforma, Hidalgo, México. E-mail: reyescruz16@yahoo.com
bConsejo Nacional de Ciencia y Tecnología, Depto. de Cátedras, Av. Insurgentes Sur 1582, Col. Crédito constructor, Deleg. Benito Juárez, Ciudad de México, CP 03940, México
cInstituto Politécnico Nacional, Escuela Superior de Ingeniería Química e Industrias Extractivas, Edificio N 7, Unidad Profesional Adolfo López Mateos. Colonia Lindavista, Del. Gustavo A. Madero, Ciudad de México, CP 07738, México
dUniversidad Iberoamericana, Departamento de Ingeniería Química, Industrial y de Alimentos, Prolongación Paseo de la Reforma 880, Lomas de Santa Fe, 01219, Ciudad de México, México
First published on 14th June 2022
Abstract
The effect of two different anionic membranes on manganese deposition was studied in a two-compartment electrochemical reactor with a titanium cathode and a dimensionally stable RuO2|Ti anode. Chronopotentiometry, ICP-OES, SEM, XRD and elemental mapping were used to understand the changes in concentration and characteristics of the metallic deposition at different current densities with the anionic membranes AMI 7001s and Neosepta AMX. The results demonstrate that AMI reduces more manganese than AMX below −100 A m−2, generating more metallic deposition but also more low-solubility manganous by-products, whereas both membranes exhibited similar behaviours above −100 A m−2 reaching the maximum current efficiency (63%) at −200 A m−2. It was also observed that the membranes have a significant effect on sulphate consumption since they are anions.
1. Introduction
High-purity metallic manganese (>99.9%) has a wide range of industrial applications, mainly as an anti-corrosive element, purifier and stabiliser in the manufacture of common steels, advanced high-strength steels (AHSS) and non-ferrous alloys.1,2 Also, it is especially useful in the manufacture of alkaline batteries, new-generation lithium-ion batteries and other widely used chemical reagents requiring controlled purity.3The growing demand and quality required for metallic manganese favour electrowinning as the main method for its production.4,5 Typically, electrowinning of manganese from sulphate solutions is performed to improve the process efficiency, as this type of electrolyte ensures uniform and stable deposition.6–8 An additional advantage of these solutions is achieving electrolytic manganese metal (EMM) in a minimal number of steps since manganese is extracted from minerals in the form of sulphates.9 However, this process consumes large amounts of energy as the electrodeposition of manganese requires an overpotential more cathodic than −1.18 V vs. SHE owing to its high electronegativity, which induces the generation of large amounts of hydrogen gas (H2).10–12 Consequently, most of the research efforts to date have focused on additives that improve current distribution, reduce the influence of hydrogen evolution, and promote and benefit manganese deposition. Additionally, the effects of temperature, agitation, pH and manganese concentration on improving the electrodeposition process have been investigated.13–23
Given the characteristics of manganese, manganese electrowinning is commonly performed in two-compartment electrochemical reactors separated by permeable polymeric diaphragms to retain the manganese on the cathode side.24 However, anion exchange membranes can improve the efficiency of the electrowinning process by effectively retaining the Mn2+ ions on the cathode side.25 These membranes can affect the movement of ions, the reaction speed of the species in the electrolyte and the energy performance of the electrochemical system.26
Nevertheless, there is a lack of studies addressing the effects of anionic membranes with different properties on the manganese deposition process. In this context, AMI 7001s (AMI) and Neosepta AMX (AMX) anionic exchange membranes have similar properties of interest for manganese electrowinning.27 Hence, in the present work, the effects of these membranes on the manganese deposition, the secondary electrochemical processes and the current efficiency of the process are evaluated.
2. Experimental
2.1 Electrolytes
All experiments were performed using a catholyte containing 0.27 M MnSO4 as the source of Mn2+ ions, 0.91 M (NH4)2SO4 as a stabilising agent and 5.4 × 10⁻⁴ M SeO2 as a hydrogen evolution inhibitor. A 0.5 M H2SO4 solution was utilised as the anolyte to provide common ions between both electrolytes.18,242.2 Electrode preparation
A Ti|RuO2 dimensionally stable anode (DSA) was used as the anode/counter electrode. The DSA electrode was prepared by the Pechini method using a precursor solution with 0.012 mol of citric acid, 0.050 mol of ethylene glycol, and 0.002 mol of RuCl3. The precursor was applied on a Ti plate previously treated by the method described by González et al.28 Subsequently, the coated plate was sintered with a heating ramp at 5°C min−1 until a temperature of 500 °C was achieved and this temperature was maintained for 5 hours to obtain the final RuO2 coating.A Ti plate mechanically polished to a mirror finish was used as the cathode/working electrode. The surface of the cathode was sanded with silicon carbide sandpaper 1200# and 1500# and rinsed with abundant deionised water before each experiment.
2.3 Ion exchange membranes
The two anion exchange membranes evaluated were Neosepta AMX and AMI 7001s and the individual properties of each membrane are provided in Table 1.27,29–31| Anion exchange membrane | AMI 7001s | Neosepta AMX |
|---|---|---|
| a Both membranes were stored and activated in a 5% sodium chloride solution for one day, then rinsed with deionised water before use. | ||
| Structure | PS/DVB | PS/DVB |
| Ion exchange capability [meq g−1] | 1.3 ± 0.1 | 1.55 ± 0.15 |
| Thickness [mm] | 0.45 ± 0.025 | 0.15 ± 0.03 |
| Electrical resistance [Ω cm2] | <40 | 27.5 ± 7.5 |
| Exchange ion | Cl− | Cl− |
| Functional group | Quaternary ammonium | Quaternary ammonium |
| Thermal stability [°C] | 90 | 40 |
2.4 Electrochemical experiments
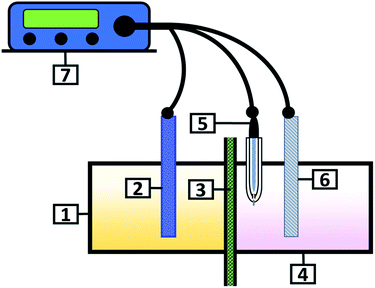
All experiments were performed in a two-compartment electrochemical reactor with a three-electrode arrangement (Fig. 1). The Ti electrode was placed in the cathode compartment maintaining an electroactive area of 38 cm2, as well as a saturated calomel electrode (SCE) as the reference electrode and the DSA electrode was used in the anodic compartment. Both electrodes were placed at a distance of 1 cm from the ionic membrane.Electrolysis tests were performed using a Princeton Applied Research 263A® potentiostat/galvanostat controlled by Powersuite 3.0® software over 120 minutes, applying current densities between −5 and −400 A m−2.
2.5 Characterisation of deposits and solutions
The morphological, superficial and elemental characterisation of the manganese deposits was conducted using a Hitachi model SU3500 scanning electron microscope (SEM) and a Quantax 200 X-ray energy dispersive spectroscope. The X-ray diffraction (XRD) study of the deposits was performed using an Equinox 2000 X-ray diffractometer (Inel) with monochromatic Co Ka radiation (l ¼ 1.789 Å) produced at 30 kV and 20 mA. The purity of the manganese and the concentration of the SO42− and Mn2+ ions in the solutions were determined by inductively coupled plasma atomic emission spectroscopy (ICP-OES).2.6 Current efficiency
The amount of manganese obtained at the different current densities was evaluated via the current efficiency of the process, calculated using eqn (1):
 | (1) |
3. Results and discussion
3.1 Electrolysis tests
Fig. 2A and B show the galvanostatic transients obtained using the AMI 7001s and Neosepta AMX membranes, respectively, within a two-compartment electrochemical reactor. The catholyte, anolyte, Ti cathode and Ti|RuO2 DSA were placed in their respective compartments. It was observed that upon increasing the cathodic currents densities, the reduction potentials also tended to increase with both membranes. However, there was a variation in the potential response between the two membranes depending on the current density and the electrolysis time.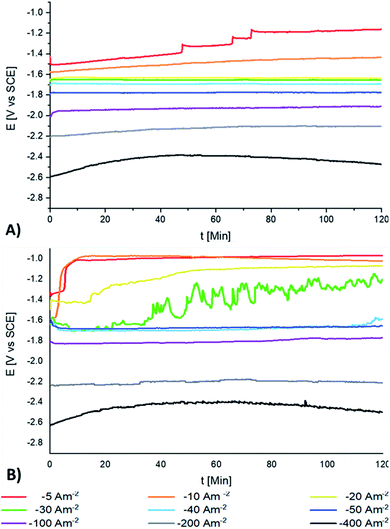 | ||
| Fig. 2 The galvanostatic transients obtained in the system with a Ti/RuO2 anode and a Ti cathode in the range of −5 to −400 A m−2 for 120 min using: (A) AMI 7001s and (B) Neosepta AMX. | ||
The most evident differences between the potential responses obtained with AMI and AMX were observed at −5, −10, −20, −30, and −40 A m−2. Fig. 2A shows four plateaus at −5 A m−2 with AMI, each one with a less cathodic potential than the previous one, which is attributable to changes in the surface of the cathode and the consumption of the reacting species at this current density. When the current density reaches −10 A m−2, a single slope is revealed, indicating the transformation of species by a single reaction. In both cases, only red-orange colloids are observed suspended in the catholyte, with the amount of colloids increasing with the electrolysis time and the applied current density. At −20, −30, and −40 A m−2, the galvanostatic transients show insignificant changes and it is possible to obtain a metallic deposit on the surface of the electrode.
Fig. 2B shows two slopes at −5 and −10 A m−2 using AMX: the first change in the slope is observed in the first 5 minutes at −5 A m−2, while the first change in the slope begins at a more cathodic potential at 2 minutes for −10 A m−2. Subsequently, the second change in the slope developed similarly for both current densities, reaching practically the same potential but with the formation of a red-orange colloid. This behaviour indicates the alteration of the electrode surface in the first few minutes, a process that accelerates and changes as the current density becomes more cathodic and leads to a secondary process that is not dependent on the current density.
Fig. 2B shows that at −20 A m−2, more colloids are observed than at less cathodic current densities with AMX. The galvanostatic transients reveal a slope in the first 20 minutes of the electrolysis, followed by a second slope between 20 and 60 minutes and a plateau that develops continuously for the next 60 minutes. This behaviour evidences an initial alteration of the electrode surface that results in a single process after 60 minutes.
At −30 A m−2, Fig. 2B shows that with AMX, the galvanostatic transient takes an irregular shape; simultaneously, the amount of colloids observed was more substantial than in previous cases. These characteristics were attributable to the unstable manganese deposition after 35 minutes of electrolysis. It is assumed that the metallic manganese was constantly dissolved and redeposited, producing variations over the electrode surface and in the potential response.
From −40 A m−2, the galvanostatic transients in Fig. 2A and B are similar for both membranes. However, at −40, −50 and −100 A m−2, the potential response was more cathodic with AMI than with AMX. In addition, the deposits generated with the AMI membrane were more uniform on the cathode surface than with AMX. Hydrogen evolution, colloids and manganese deposition were observed simultaneously with both membranes. At this point, it is important to mention that at −5, −10, −20, −30, −40, and −50 A m−2, the generation of colloids is lower with the naked eye with AMX.
At −200 and −400 A m−2, Fig. 2A and B show that the potential response is practically the same with both membranes, with similar deposition on the cathode surface. With these two current densities, the amount of colloids decreased, especially at the end of 120 minutes of electrolysis, where colloids were no longer distinguishable in the catholyte.
The metallic manganese obtained and concentration changes in solution during the electrolysis were analysed by gravimetry, XRD, SEM-EDS and ICP-OES to understand the effects of both membranes on the deposition process and concentration changes of the species present in the catholyte and anolyte.
3.2 Deposit and concentration changes of Mn2+
The amount of manganese deposited after 120 minutes of electrolysis with AMI and AMX is presented in Fig. 3 as a function of the applied current density. The behaviour of the membranes differs at −20, −30, −40, −50, and −100 A m−2. With the AMI, it is possible to obtain a metallic deposit from −20 A m−2, while for the AMX, the manganese deposit is recovered from −40 A m−2.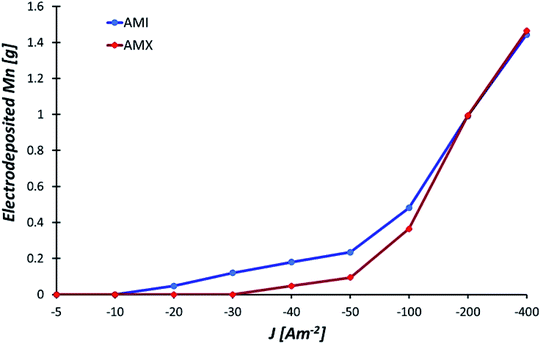 | ||
| Fig. 3 Mass of manganese deposited with the AMI 7001s and Neosepta AMX anionic membranes after 120 minutes of electrolysis at −5, −10, −20, −30, −40, −50, −100, −200, and −400 A m−2. | ||
Fig. 3 shows that at −30, −40, and −50 A m−2, the deposition increases with a more cathodic current density but there is more manganese deposition with AMI than with AMX. The difference between both membranes decreases at −100 A m−2. Above −200 A m−2, the amount of metallic deposition is practically the same with both membranes.
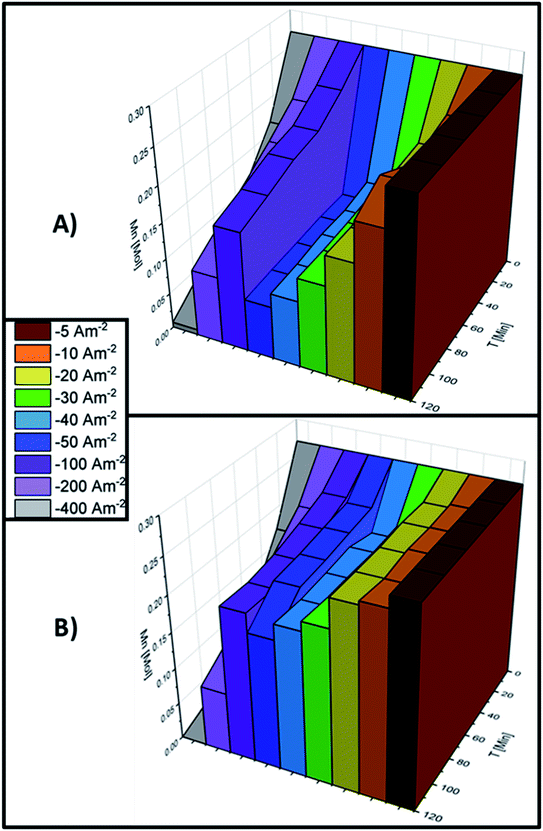
Fig. 4A and B show the variations in the Mn2+ concentration in the catholyte over the 120 minutes of electrolysis for AMI and AMX, respectively. The concentration of Mn2+ ions changes above −10 A m−2 for both anionic membranes but more manganese is consumed with AMI 7001s since the final concentration of Mn2+ ions is 0.22 M with AMI and 0.25 M with AMX. This difference becomes more significant at a current density of −50 A m−2, where the concentrations become 0.074 M with AMI and 0.18 M with AMX. Another important aspect evidenced by Fig. 4A and B is that the consumption of Mn2+ ions begins at −10 A m−2, even when the manganese deposition is observed at −20 with AMI and −40 A m−2 with AMX.
Fig. 4A and B show that at −100 A m−2, the amount of manganese removed from the catholyte for both membranes is lower than at less cathodic current densities but the amount of metallic manganese recovered on the cathode surface was higher. It is evident that even when the concentration gradient generated with AMI and AMX is less than that observed at −10, −20, −30, −40, and −50 A m−2, the amount of ionic manganese removed with AMI is greater than with AMX. Fig. 4A and B evidence that from −200 A m−2, the amount of Mn2+ removed is similar with both membranes. When comparing Fig. 4A and B with Fig. 3A and B, it is evident that the amount of manganese deposited on the cathode surface differs from the amount of manganese removed from the solution, which is attributable to the formation of manganese compounds with low solubility during the process.
Fig. 5A and B show the percentages of manganese recovered as a deposit, Mn2+ remaining in the catholyte, and low-solubility manganese compounds obtained at −5, −10, −20, −30, −40, −50, −100, −200, and −400 A m−2 using AMI 7001s and Neosepta AMX, respectively. Fig. 5A shows that most of the manganese consumed from the catholyte reacts to form by-products at −10, −20, −30, −40, and −50 A m−2 for AMI, whereas this is less significant for AMX (Fig. 5B) at the same current densities.
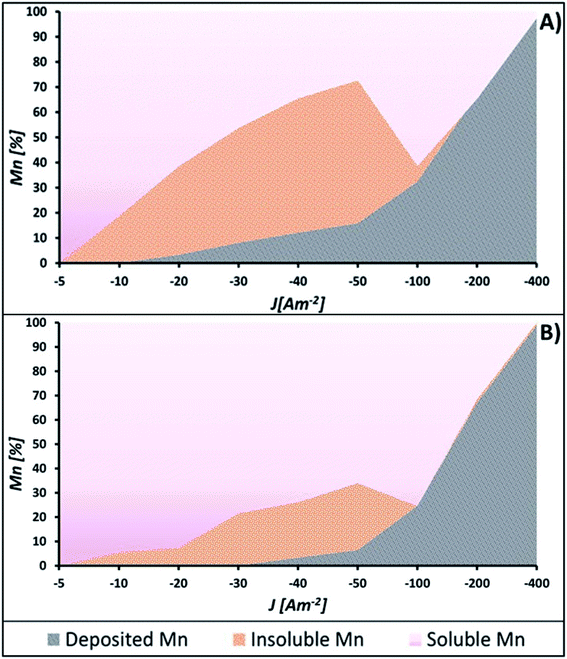 | ||
| Fig. 5 Different manganese species obtained after 120 minutes of electrolysis at −5, −10, −20, −30, −40, −50, −100, −200, and −400 A m−2 with: (A) AMI 7001s and (B) Neosepta AMX. | ||
The formation of low-solubility species in the solution shown in Fig. 5A and B is attributable to the instability of the deposited manganese in current densities lower than −100 A m−2, a phenomenon reported in other manganese recovery systems.25 Since manganese has a strong chemical affinity for sulphur and oxygen,32 the interaction between the deposited manganese and the solution could easily lead to the formation of sulphides or oxides through chemical reactions.
The differences in the amount of manganous by-products generated with both membranes observed in Fig. 5A and B are attributable to their effect on the reduction of Mn2+ ions. This implies that it is possible to reduce more manganese with AMI than with AMX at current densities lower than −100 A m−2. Nevertheless, most of the deposited manganese will react with the catholyte to generate low-solubility manganous compounds, electrochemically innocuous under these energetic conditions.
Fig. 5A and B show that by increasing the current density to −100 A m−2, the amount of low-solubility manganous by-products is considerably lower with both membranes. However, more manganese is deposited with AMI than AMX, 32.44 and 24.60% respectively. From −200 A m−2, the amount of manganese by-products is negligible, while the percentage of metallic manganese is practically the same with both membranes.
Fig. 5A and B also show that current densities more cathodic than −100 A m−2 enhance the manganese electrodeposition, while the generation of manganese by-products is considerably lower than at lesser current densities.
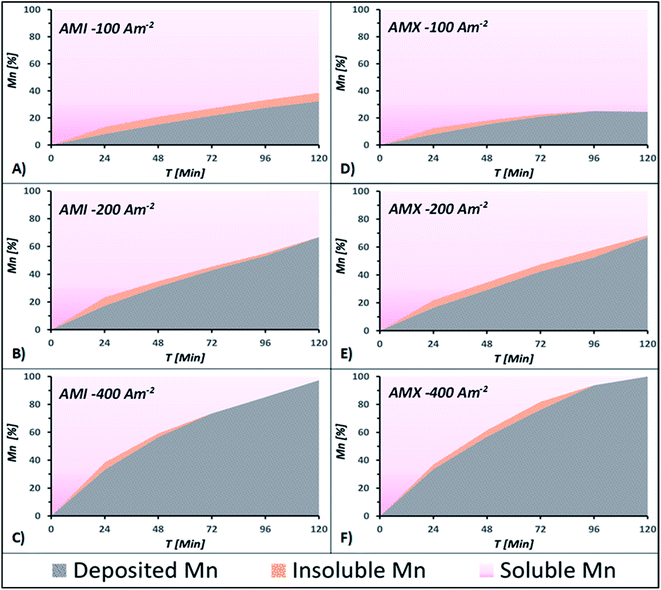
It is necessary to understand the process of manganese deposition as the solution and electrode surface change when current densities more cathodic than −100 A m−2 are applied since these energetic conditions improve manganese electrodeposition. Therefore, the changes in Mn2+ concentration on the electrolyte and the amount of manganese deposited at current densities of −100, −200 and −400 A m−2 were evaluated at different time intervals. The transformation of the manganese species during the 120 minutes of electrolysis is shown in Fig. 6A–C for AMI 7001s and Fig. 6D–F for Neosepta AMX at −100, −200 and −400 A m−2, respectively.
Fig. 6A shows that the manganese deposition increases as the electrolysis time increases at −100 A m−2 with AMI, suggesting that the quantity of manganese deposited increases with a longer electrolysis time than 120 minutes with AMI. In contrast, the maximum deposition is obtained at 96 minutes for AMX and remains unchanged thereafter producing less metallic manganese (Fig. 6D). Most manganous by-products are obtained in the first 24 minutes with both membranes and remain constant at higher electrolysis times for AMI (Fig. 6A) but decrease until consumption at 96 minutes for AMX (Fig. 6D).
After increasing the current density to −200 A m−2, Fig. 6B and E show that the increase in the deposition is similar with both membranes and remains constant throughout the 120 minutes of electrolysis. At −100 A m−2, the maximum quantity of manganous by-products is reached at 24 minutes of electrolysis but the quantity decreases until consumption at 120 minutes for both membranes.
At −400 A m−2, the electrodeposition process consumes the Mn2+ ions in the catholyte at the same rate for both membranes. However, Fig. 6C shows less generation of manganous by-products for AMI, with the maximum reached at 24 minutes, then decreasing due to consumption after 72 minutes of electrolysis. For AMX, the maximum quantity of by-products is reached at 72 minutes and decreases at 120 minutes of electrolysis (Fig. 6F).
The manganese deposition process is similar for both membranes over 120 minutes of electrolysis. Meanwhile, more manganous by-products are formed with AMX than with AMI and decrease with increasing electrolysis time, indicating their consumption.
It is of note that although the formation of manganous by-products decreases considerably at current densities more cathodic than −100 A m−2, there are still produced at −100, −200 and −400 A m−2 due to the reactive nature of dissolved manganese and its strong affinity for the sulphate ions in the catholyte. The anolyte and catholyte were analysed at different current densities and stages of electrolysis to understand the effect of this interaction and the manganese electrowinning process on the concentration of SO42− ions.
3.3 Changes in SO42− concentration
The concentration of sulphur related to SO42− ions in the anolyte and catholyte during 120 minutes of electrolysis is shown in Fig. 7A for AMI and Fig. 7B for AMX.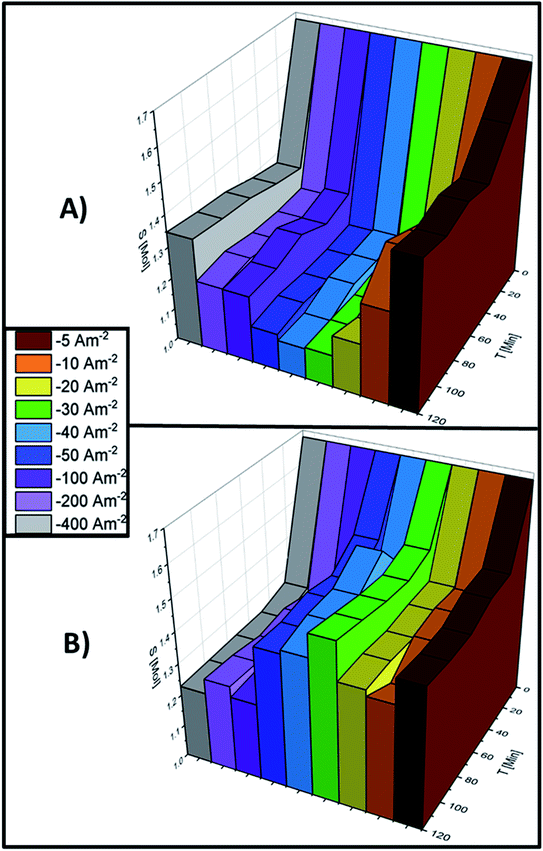 | ||
| Fig. 7 Changes in total sulphur concentration throughout the 120 minutes of electrolysis at −5, −10, −20, −30, −40, −50, −100, −200, and −400 A m−2 with (A) AMI 7001s and (B) Neosepta AMX. | ||
There are variations in the concentrations of SO42− ions at −5, −10, −20, −30, −40, −50, and −400 A m−2 for both membranes, with the highest consumption of SO42− ions at −40 A m−2 for AMI (Fig. 7A) and lower consumption for AMX at the same range of current densities (Fig. 7B).
There were less significant differences between membranes at −100 and −200 A m−2, with a lower final concentration for AMX than with AMI at −400 A m−2. The most significant change in sulphate concentration occurs at −50 A m−2 for AMI (Fig. 7A) and −400 A m−2 for AMX (Fig. 7B).
The most significant concentration change occurs in the initial 24 minutes with all current densities and both membranes (Fig. 7A and B), with only minor changes thereafter due to the redissolution of some of the by-products generated at the beginning of electrolysis.
To better understand the relationship between the consumption of Mn2+ and SO42− ions, it is necessary to compare the concentration changes at the end of the electrolysis time. Fig. 8 shows the molar concentration gradients for total SO42− ions, the amount of manganese deposited, and manganous by-products generated by the end of the 120 minute electrolysis process at −5, −10, −20, −30, −40, −50, −100, −200, and −400 A m−2 with AMI and AMX.
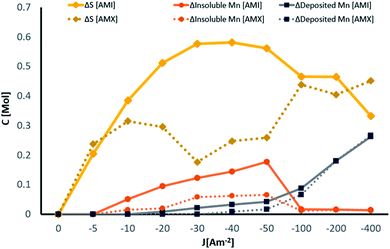 | ||
| Fig. 8 Changes in manganese and sulphur concentrations with AMI 7001s and Neosepta AMX anionic membranes after 120 minutes of electrolysis at −5, −10, −20, −30, −40, −50, −100, −200, and −400 A m−2. | ||
Fig. 8 shows that at −5 A m−2 for both AMI and AMX, the consumption of sulphates develops without metal deposition or manganous by-products being generated due to the influence of selenium on the sulphate reduction.33
The behaviour induced by each membrane is different from −10 A m−2 (Fig. 8), with the consumption of sulphates increasing at current densities more anodic than −50 A m−2 and decreasing as the current density becomes more cathodic for AMI. This behaviour coincides with the increased deposition and decreased amount of low-solubility manganous by-products observed after −50 A m−2.
For AMX, after the sulphate concentration gradient rises at −10 A m−2, the consumption drops at a current density of −30 A m−2 accompanied by a considerable increase in the generation of manganous by-products (Fig. 8). At −30, −40, and −50 A m−2, the concentration of sulphates increases while the first metal deposit is observed on the cathode surface and the amount of low-solubility manganous by-products remains constant. From −100 A m−2, the change in sulphate concentration is less significant than in the previous interval while the manganese deposited on the cathode surface increases considerably and the generation of manganous by-products decreases to be practically negligible.
In general, the influence of both membranes is considerably more significant when the SO42− ions are involved in the process due to the susceptibility of these anions to the selective nature of the membranes and their individual properties (Fig. 8). The deposits obtained at −100, −200 and −400 A m−2 with the AMI and AMX membranes were characterised by SEM, elemental mapping by EDX, XRD and ICP, to better understand the effects of the current density and the anionic membranes on the physical and chemical characteristics of the manganese deposit.
3.4 Characterisation of deposited manganese
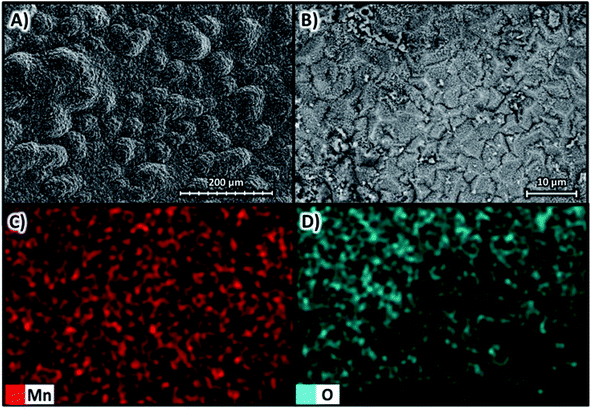
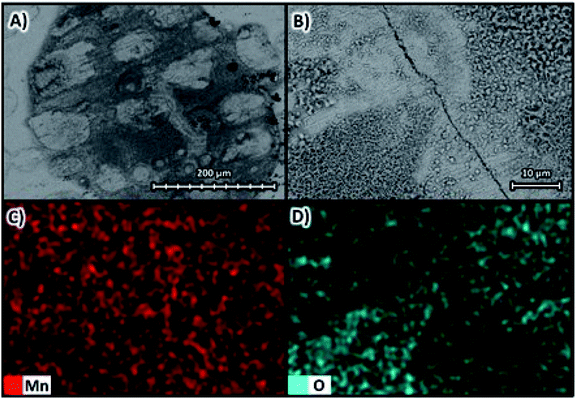
Fig. 9A shows the SEM images with magnifications of ×270 and Fig. 9B with magnifications of ×1600 at 10 kV for the deposit obtained at −100 A m−2 for the AMI 7001s membrane, as well as the elemental mapping at a magnification of ×1600 for manganese in Fig. 9C and oxygen in Fig. 9D.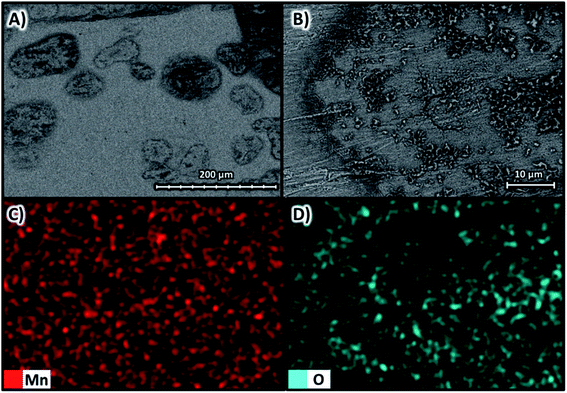 | ||
| Fig. 9 Surface morphology of the manganese deposit obtained at −100 A m−2 for the AMI 7001s membrane (A) ×270 and (B) ×1600 at 10 kV and elemental mapping of (C) manganese and (D) oxygen. | ||
Fig. 9A and B show a two-dimensional, smooth and uniform deposit, with small three-dimensional structures generated in circular regions 100 μm in diameter around microfractures attributed to hydrogen evolution.34 The deposition is homogeneously composed of manganese according to Fig. 9C but with regions with a higher oxygen concentration observed in Fig. 9D, especially on the three-dimensional structures around the cracks due to the oxidation of manganese that makes up these microstructures.
Fig. 10 shows the SEM images with magnifications of ×270 in Fig. 10A and ×1600 in Fig. 10B at 10 kV for the deposit obtained at −100 A m−2 with the Neosepta AMX membrane, as well as the elemental mapping at a magnification of ×1600 for manganese in Fig. 10C and oxygen in Fig. 10D.
Fig. 10A and 10B reveal a deposit formed by spherical growths smaller than 100 μm made up of granular structures and three-dimensional amorphous growths responsible for the rough surface. Elemental mapping showed a uniform manganese composition in Fig. 10C, while the oxides accumulate in rougher regions according to Fig. 10D.
The deposit obtained with AMI has a more uniform surface than that obtained with AMX due to the capacity of AMI to deposit more manganese than AMX, allowing a better development of the deposit.
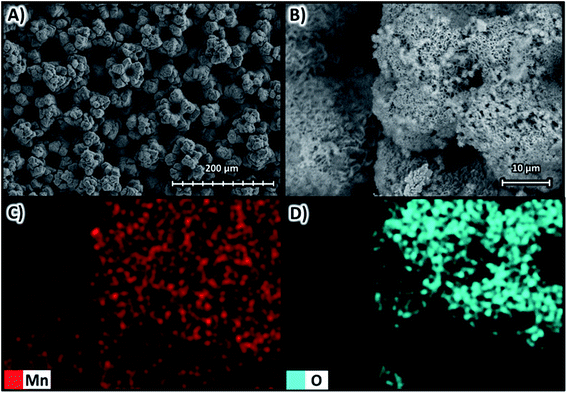
Fig. 11 shows the SEM images at magnifications of ×270 in Fig. 11A and ×1600 in Fig. 11B at 10 kV for the deposit obtained at −200 A m−2 with the AMI 7001s anion membrane, as well as the elemental mapping at a magnification of ×1600 for manganese in Fig. 11C and oxygen in Fig. 11D.
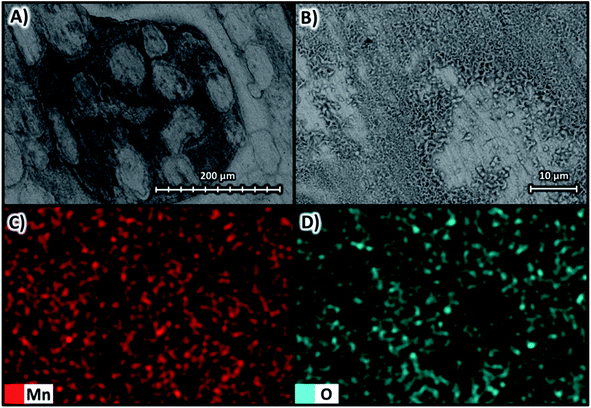 | ||
| Fig. 11 Surface morphology of the manganese deposit obtained at −200 A m−2 with the AMI 7001s membrane (A) ×270 and (B) ×1600 at 10 kV; as well as elemental mapping of (C) manganese and (D) oxygen. | ||
The manganese deposit under these conditions is white and uniform with a smooth and 2D surface covered by some 3D structures (Fig. 11A and 11B). Elemental mapping in Fig. 11C reveals a uniform distribution of manganese, while the oxides shown in Fig. 11D are bound to the rougher surface areas and are almost absent from the smoother regions.
Fig. 12 shows the SEM images at magnifications of ×270 in Fig. 12A and ×1600 in Fig. 12B at 10 kV for the deposit obtained at −200 A m−2 with the Neosepta AMX membrane, as well as the elemental mapping at a magnification of ×1600 for manganese in Fig. 12 and oxygen in Fig. 12D.
Under these conditions, the deposit presents very similar characteristics to those observed when using the AMI membrane with the same current density. Fig. 12A and B reveal a smooth and two-dimensional deposit mostly covered by three-dimensional structures, with a uniform composition of manganese (Fig. 12C) and the oxides concentrated mainly in three-dimensional structures (Fig. 12D).
Fig. 12A reveals three-dimensional microstructures forming circular regions of 300–400 μm in diameter with both membranes. These regions are delimited by microcracks that are also present inside them, as shown in Fig. 12B. The fractured surface is attributable to the stress exerted on these specific regions by hydrogen evolution coupled with the manganese deposition process.
Fig. 13 shows the SEM images at magnifications of ×270 in Fig. 13A and ×1600 in Fig. 13B, both at 10 kV for the deposit obtained at −400 A m−2 with the Neosepta AMX membrane, as well as the elemental mapping at a magnification of ×1600 for manganese in Fig. 13C and oxygen in Fig. 13D.
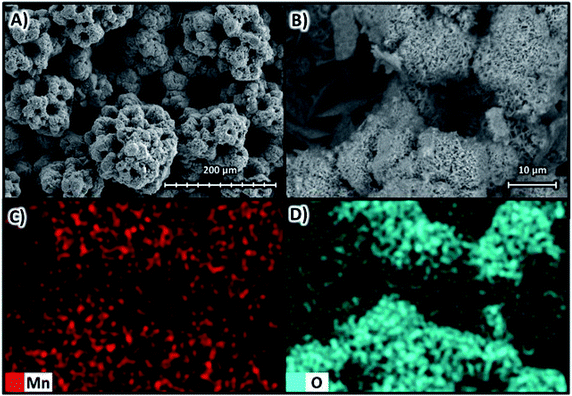 | ||
| Fig. 13 Surface morphology of the manganese deposit obtained at −400 A m−2 with the AMI 7001s membrane (A) ×270 and (B) ×1600 at 10 kV; as well as elemental mapping of (C) manganese and (D) oxygen. | ||
Fig. 13A and B reveal that at −400 A m−2, the deposit obtained is irregular and rough, formed by lumps of approximately 100 μm. As in previous cases, Fig. 13C evidences the deposit is composed solely of manganese while oxides are concentrated in the outermost parts of the agglomerations (Fig. 13D). Additionally, cavities of different sizes are evident, delimited by the 3D deposits.
The SEM images at magnifications of ×270 and ×1600 are shown in Fig. 14A and B, respectively, at 10 kV for the deposit obtained at −400 A m−2 with the Neosepta AMX membrane, as well as the elemental mapping at a magnification of ×1600 for manganese in Fig. 14C and oxygen in Fig. 14D.
In this case, the deposit has compact, smaller lumps of approximately 80 μm in diameter causing a rough deposit (Fig. 14A and B). The formation of cavities delimited by the agglomerations is also evident and is attributable to the evolution of massive amounts of hydrogen coupled to the manganese deposition at −400 A m−2. According to Fig. 14C, the manganese is found uniformly on the agglomerations and the smaller 3D structures that compose them. In Fig. 14D, oxides are observable over the surface of the agglomerations and the microstructures formed around them.
When comparing Fig. 13A and B with Fig. 14A and B, it is evident that the deposits obtained with AMI and AMX at −400 A m−2 have agglomerations of 40 μm in diameter spherical growths. However, the metallic deposition with AMX appears to be more compact and formed from smaller structures, as shown in Fig. 14A and B.
A general comparison of the SEM and elemental mapping images of both membranes reveals that most of the metallic manganese is in a compressed and 2D structure at −100 and −200 A m−2. However, as the current density becomes more cathodic in this range, the electrochemically reduced manganese generates three-dimensional structures on the surface of the smooth deposit. This behaviour is attributable to the incidence of hydrogen evolution coupled with the deposition process as the current density becomes more cathodic. The relationship between hydrogen evolution and manganese deposition is different at −400 A m−2 since the consumption of Mn2+ ions is more accelerated at this current density (Fig. 4A and B). In this way, manganese deposition must compete with the bubbling generated by the massive evolution of hydrogen.4
The elemental mapping also revealed that the three-dimensional microstructures formed by the deposited manganese are more susceptible to oxidation due to the grain boundaries of these structures being exposed and promoting oxidation upon contact with ambient oxygen.
Fig. 15 presents the XRD patterns for the deposits obtained at current densities of −100, −200, and −400 A m−2 with AMI 7001s and Neosepta AMX; these results are supported by ICP-OES analysis to determine the purity of the metallic manganese.
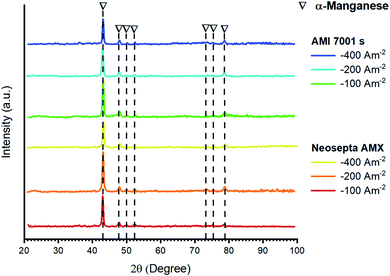 | ||
| Fig. 15 XRD patterns for metal deposits generated at −100, −200 and −400 A m−2 using AMI 7001s and Neosepta AMX. | ||
Fig. 15 shows the presence of α-manganese (JCPDS card number 9011108) when imposing any current density between −100 and −400 A m−2; this is a common feature of manganese recovered electrochemically from sulphated solutions at room temperature.35
For the manganese obtained at −100, −200, and −400 A m−2, the ICP-OES analysis reveals purities of 96.30, 92.71, and 89.70% for AMI and 92.57, 92.86, and 94.73% for AMX, respectively. The impurities in the deposits for both membranes are attributable to the oxidation of the metallic manganese, as evidenced by the elemental mappings of Fig. 9C and D to 14C and 14D, while a minor percentage is related to the incidence of sulphur and selenium.
The purity of the manganese decreases as the current density becomes more cathodic with AMI, while the purity increases with AMX due to the nature of the deposits obtained at each current density. As evidenced in Fig. 9A and B to 14A and 14B, the deposit becomes less compact as the current density becomes more cathodic for AMI, presenting areas susceptible to corrosion, whereas for AMX, the metallic manganese has a more compact structure on increasing current density making it less susceptible to oxidation.
Knowing the characteristics of the deposits, the chemical changes and the energy conditions associated with obtaining metallic manganese for both anionic membranes, it is possible to calculate the efficiency of the process for the evaluated current densities, thus establishing the best conditions for obtaining metallic manganese.
3.5 Current efficiency
Fig. 16 shows the current efficiency at −5, −10, −20, −30, −40, −50, −100, −200, and −400 A m−2 for the AMI 7001s and Neosepta AMX membranes.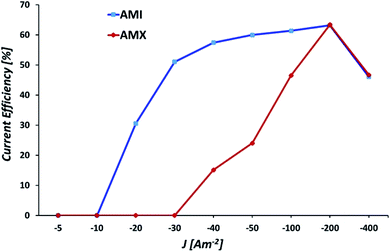 | ||
| Fig. 16 Current efficiencies for manganese deposition at −5, −10, −20, −30, −40, −50, −100, −200, and −400 A m−2 for the AMI 7001s and Neosepta AMX membranes. | ||
Fig. 16 reveals clear differences in the efficiencies of the membranes at −10, −20, −30, −40, −50, and −100 A m−2, the current efficiency increases considerably from 0 to 51% at −10, −20 and −30 A m−2 for AMI (blue line), subsequently increasing up to −200 A m−2. For AMX (red line), the current efficiency increases steadily at −30, −40, −50, −100, and −200 A m−2. For both membranes, the maximum efficiency of 63% is reached at −200 A m−2, decreasing to 46% on increasing the current density to −400 A m−2.
The inefficiencies observed at −100, −200 and −400 A m−2 are attributable to the increasing incidence of concomitant processes, such as the evolution of hydrogen or the reduction of sulphates due to the diminution of Mn2+ ions as the electrolysis advances (Fig. 8).
4. Conclusions
The effect of the anionic membranes on manganese deposition varies according to the current density imposed, with the AMI 7001s membrane allowing more manganese recovery than the Neosepta AMX membrane below −100 A m−2. However, most of the reduced manganese forms low-solubility by-products for both membranes but it is more relevant with the AMI 7001s membrane than with the Neosepta AMX membrane. Furthermore, similar amounts of metallic manganese are recoverable with both membranes at −100 A m−2, with a more stable deposit than at less cathodic current densities decreasing the quantity of manganous by-products generated, according to the gravimetric and ICP-OES analyses.Manganese deposition is most efficient at −200 A m−2 for both membranes with 67% recovery of manganese after 120 minutes of electrolysis with an efficiency of 63% The deposit obtained is smooth and compact with a purity of 92% for both membranes, as the SEM imaging, elemental mapping and ICP-OES analysis demonstrate.
Although manganese deposition was not influenced by the anionic membrane at current densities greater than −100 A m−2, the consumption of sulphate ions is different for each membrane due to the incidence of concomitant reactions: as the current density becomes more cathodic, more sulphates are consumed with AMI 7001s, whereas fewer sulphates are consumed with AMX.
Author contributions
Dr Victor Esteban Reyes Cruz contributed with the project administration and methodology of the research. Master Quink Luis Reyes Morales contributed with the realization of the research. Dr José Angel Cobos Murcia contributed with the conceptualization of the research. Dra Ariadna Trujillo Estrada contributed with the validation of the research. Dr Gustavo Urbano Reyes contributed with the writing – review & editing of the research. Dr Miguel Pérez Labra contributed with the formal analysis of the research. The Doctors Manzo Robledo, Vázquez Bautista and Ramírez Meneses contributed with the data curation.Conflicts of interest
The authors declare no conflict of interest.Acknowledgements
The authors are grateful to CONACYT (México) and UAEH for the scholarship and the Cátedras program financing received.References
- S. K. Padhy, B. C. Tripathy and A. Alfantazi, Can. Metall. Q., 2016, 55(4), 429–437 CrossRef CAS.
- R. P. Ferrando, S. S. Caballero, J. E. C. Amorós and M. Á. S. Cantó, 3c Tecnología, 2012, 1(1), 1 Search PubMed.
- J. Huang, Z. Wang, M. Hou, X. Dong, Y. Liu, Y. Wang and Y. Xia, Nat. Commun., 2018, 9(1), 1 CrossRef PubMed.
- Y. Fan, L. X. Jiang, X. Y. Yu, F. Y. Liu, Y. Q. Lai and L. I. Jie, Trans. Nonferrous Met. Soc. China, 2019, 29(11), 2430–2439 CrossRef.
- J. Gong and G. Zangari, J. Electrochem. Soc., 2002, 149(4), C209 CrossRef CAS.
- P. Radhakrishnamurthy and A. K. N. Reddy, J. Appl. Electrochem., 1974, 4(4), 317–321 CrossRef CAS.
- A. Sulcius, E. Griskonis, K. Kantminiene and N. Zmuidzinaviciene, Hydrometallurgy, 2013, 137, 33–37 CrossRef CAS.
- A. A. Baba, L. Ibrahim, F. A. Adekola, R. B. Bale, M. K. Ghosh, A. R. Sheik and I. O. Folorunsho, J. Miner. Mater. Charact. Eng., 2014, 2(3), 230 CAS.
- S. K. Padhy, P. Patnaik, B. C. Tripathy, M. K. Ghosh and I. N. Bhattacharya, Hydrometallurgy, 2016, 165, 73–80 CrossRef CAS.
- M. Fernández-Barcia, V. Hoffmann, S. Oswald, L. Giebeler, U. Wolff, M. Uhlemann and A. Gebert, Surf. Coat. Technol., 2018, 334, 261–268 CrossRef.
- J. Lu, D. Dreisinger and T. Glück, Hydrometallurgy, 2016, 161, 45–53 CrossRef CAS.
- S. K. Padhy, B. C. Tripathy and A. Alfantazi, Hydrometallurgy, 2018, 177, 227–236 CrossRef CAS.
- H. H. Oaks and W. E Bradt, ECS Trans., 1936, 69(1), 567–584 Search PubMed.
- D. Schlain and J. D. Prater, J. Electrochem. Soc., 1948, 94(2), 58–73 CrossRef CAS.
- P. Ilea, I. C. Popescu, M. Urdă and L. Oniciu, Hydrometallurgy, 1997, 46(1–2), 149–156 CrossRef CAS.
- P. Díaz-Arista, R. Antaño-López, Y. Meas, R. Ortega, E. Chaînet, P. Ozil and G. Trejo, Electrochim. Acta, 2006, 51(21), 4393–4404 CrossRef.
- J. K. Chang, C. H. Huang, W. T. Tsai, M. J. Deng, I. W. Sun and P. Y. Chen, Electrochim. Acta, 2008, 53(13), 4447–4453 CrossRef CAS.
- J. C. Rojas-Montes, R. Pérez-Garibay, A. Uribe-Salas and S. Bello-Teodoro, J. Electroanal. Chem., 2017, 803, 65–71 CrossRef CAS.
- L. Ding, X. Fan, J. Du, Z. Liu and C. Tao, Int. J. Miner. Process., 2013, 130, 34–41 CrossRef.
- J. Lu, D. Dreisinger and T. Glück, Hydrometallurgy, 2015, 161, 45–53 CrossRef.
- J. R. Xue, H. Zhong, S. Wang, C. X. Li and F. F. Wu, Trans. Nonferrous Met. Soc. China, 2016, 26(4), 1126–1137 CrossRef CAS.
- J. Xue, S. Wang, H. Zhong, C. Li and F. Wu, Hydrometallurgy, 2015, 160, 115–122 CrossRef.
- W. Zhang and C. Y. Cheng, Hydrometallurgy, 2007, 89(3–4), 137–159 CrossRef CAS.
- Q. Wei, X. Ren, J. Du, S. Wei and S. Hu, Miner. Eng., 2010, 23(7), 578–586 CrossRef CAS.
- J. C. Rojas-Montes, R. Pérez-Garibay and A. Uribe-Salas, J. Electroanal. Chem., 2014, 161, D67–D72 CAS.
- K. K. Kontturi, L. Murtomäki and J. A. Manzanares, Ionic transport processes: in electrochemistry and membrane science, Oxford UP, 2008 Search PubMed.
- K. S. Kim, W. Ryoo, M. S. Chun and G. Y. Chung, Desalination, 2013, 318, 79–87 CrossRef CAS.
- M. A. González-López, V. E. Reyes-Cruz, J. A. Cobos-Murcia, M. A. Veloz-Rodríguez, G. Urbano-Reyes and M. Pérez-Labra, Int. J. Electrochem. Sci., 2018, 13, 10873–10883 CrossRef.
- H. Jaroszek, W. Mikołajczak, M. Nowak and B. Pisarska, Desalin. Water Treat., 2017, 64, 223–227 CrossRef CAS.
- A. González, M. Grágeda, A. Quispe, S. Ushak, P. Sistat and M. Cretin, Membranes, 2021, 11(8), 575 CrossRef PubMed.
- S. A. Mareev, D. Y. Butylskii, N. D. Pismenskaya, C. Larchet, L. Dammak and V. V. Nikonenko, J. Membr. Sci., 2018, 563, 768–776 CrossRef CAS.
- R. D. Peacoc and R. D. Kemmett, The Chemistry of Manganese, Technetium and Rhenium, Elsevier, 1973 Search PubMed.
- Q. L. Reyes-Morales, V. E. Reyes-Cruz, A. Trujillo-Estrada, J. A. Cobos-Murcia, G. Urbano-Reyes and M. Pérez-Labra, RSC Adv., 2021, 11(41), 25542–25550 RSC.
- F. Xu, Z. Dan, W. Zhao, G. Han, Z. Sun, K. Xiao and N. Duan, J. Electroanal. Chem., 2015, 741, 149–156 CrossRef CAS.
- Y. Sun, X. Tian, B. He, C. Yang, Z. Pi, Y. Wang and S. Zhang, Electrochim. Acta, 2011, 56(24), 8305–8310 CrossRef CAS.
| This journal is © The Royal Society of Chemistry 2022 |

