 Open Access Article
Online determination of sulfide using an optical immersion probe combined with headspace liquid-phase microextraction
Arina Skoka,
Andriy Vishnikin *b and
Yaroslav Bazela
aDepartment of Analytical Chemistry, Institute of Chemistry, Faculty of Science, University of Pavol Jozef Šafárik in Košice, Moyzesova 11, 040 01 Košice, Slovak Republic
bDepartment of Analytical Chemistry, Faculty of Chemistry, Oles Honchar Dnipro National University, Gagarin Av. 72, 49010, Dnipro, Ukraine. E-mail: vishnikin@hotmail.com
First published on 15th June 2022
Abstract
A new design for headspace liquid phase microextraction in combination with an optical immersion probe (HS-LPME-OIP) was proposed and successfully tested for the determination of sulfide in wine and water samples. The developed method is based on the release of hydrogen sulfide from the aqueous phase after the addition of orthophosphoric acid and its extraction with an aqueous solution of 5,5′-dithiobis-(2-nitrobenzoic) acid (DTNB). The analytical signal was recorded using an optical probe immersed in a vial containing 200 μL of 0.1 mM DTNB solution. Using the optical immersion probe in combination with HS-LPME allowed to register the analytical signal online and significantly improve the reproducibility of sulfide determination compared to known microextraction approaches. In the proposed approach, the problems with drop stability, limitations in mixing rate or extraction time, too small volume of the acceptor phase and stability of the holding the acceptor phase in the hole of the optical probe were also satisfactorily solved. The calibration graph was linear in the range of 16–256 μg L−1 with a correlation coefficient of 0.9992. The limit of detection was 6 μg L−1.
1. Introduction
Sulfide is one of the most abundant forms of sulfur found in nature. Most metal sulfides are poorly soluble in water, so they are considered to be of low toxicity. However, the ingress of sulfide ions into an acidic environment leads to the formation of hydrogen sulfide, which has a characteristic smell of "rotten eggs" and is extremely toxic.1 A toxic effect of H2S is observed at concentrations in water at the level of 0.3 mg L−1 and above, and a concentration of 453 mg m−3 in air is lethal to humans.2 In the natural environment, hydrogen sulfide arises mainly as a result of the vital activity of bacteria, for example, during the spoilage of some products, especially of animal origin. Another well-known source of sulfide ions is the leaching of various sulfide ores, such as pyrite, pyrrhotite, chalcopyrite, etc. The anthropogenic factor also plays a significant role in the release of sulfide ions. An application of imperfect technologies in industry, for example, when enriching ores and minerals, or burning coal, also leads to the pollution of air with sulfides. Hydrogen sulfide can serve as an indicator of many cardiovascular diseases;3 its excess in the human body could be related to diabetes4 and other diseases. The increased amount of sulfide ions present in water is dangerous for all types of living organisms and can also contribute to corrosion and damage of communications and equipment.The most often used methods for sulfide determination in liquid samples are based either on the redox properties of sulfides or the determination of H2S after acidification of a sample. Iodine or less commonly other oxidizing agents, such as bromine, iodate, hexacyanoferrate, permanganate, etc., are used as oxidizing agents in titrimetric determinations of sulfide.5 However, such methods are not sufficiently sensitive and cannot be used to determine low concentrations of sulfide or hydrogen sulfide.
Spectrophotometry is widely used for sulfide determination. Both direct and indirect approaches can be used. Spectrophotometric determination with methylene blue (N,N-dimethyl-p-phenylenediamine) is commonly used for the determination of trace sulfide.5,6 The method is characterized by good sensitivity with LOD of 0.2 mg L−1, but the strict control of the temperature is necessary to obtain reproducible results. Another problem is that the full development of the color takes several hours. Spectrophotometric methods are usually well combined with extraction preconcentration, but in this case it is necessary to use relatively large amounts of highly toxic extractants, such as benzene, toluene, chloroform, etc., which does not meet the modern requirements of green chemistry. These disadvantages can be largely eliminated by microextraction techniques. However, only a few examples of the use of microextraction for the determination of sulfides are described in the literature.7–12
Solid-phase microextraction (SPME) does not require the use of organic solvents and provides a high degree of preconcentration and separation. However, SPME fibers are expensive, perishable and need frequent replacement. The combination of SPME with GC-MS is the most promising while other detection systems are used more rarely.10,11 Liquid-phase microextraction (LPME) is combined with spectroscopic techniques more frequently.7–9,12 Such methods are fairly easy to use and much less expensive than SPME. Direct immersion single drop microextraction (DI-SDME) and dispersive liquid–liquid microextraction (DLLME) are among the most demanded LPME methods, but when analyzing objects with a complex matrix, problems with the selectivity of determination may arise.13 These approaches are incompatible with many types of extraction solvents, for example, with aqueous reagent solutions.
The application of headspace single-drop microextraction (HS-SDME) is recognized as one of the most promising approaches used for the preconcentration of volatile compounds. HS-SDME is fully compatible with such important methods as gas chromatography, capillary electrophoresis and some others, and allows you to obtain extracts that are completely free of non-volatile compounds. However, problems associated with the stability of the suspended drop, limitations in the extraction time, stirring rate, and absorbance measurement of the microvolume of the acceptor phase, which is very important for compatibility with spectrophotometry, are significant for this approach. These factors also have a negative impact on the reproducibility of the determination.
Use of an optical probe and holding the acceptor phase in a designed vessel14 allows solving most of these problems. Compared to measuring absorbance in a cuvette, the use of an optical probe speeds up the analysis; since the sample does not need to be transferred to the cuvette, and the determination precision is increased.15–17 Optical probe can be directly immersed in the plastic vial in headspace mode, which solves the problem of droplet stability and limitations in the volume of the acceptor phase.
In this article, a newly designed approach for headspace microextraction combined with an optical immersion probe HS-LPME-OIP is proposed for the highly sensitive and selective online spectrophotometric determination of sulfide using its reaction with 5,5′-dithiobis-(2-nitrobenzoic) acid (DTNB). DTNB is often used as a reagent for the determination of sulfhydryl compounds and sulfite.18–20 A few studies were devoted to the sulfide determination with the help of DTNB and, what is more, no separation or preconcentration stage was used.21–23 The application of DTNB does not require organic solvents, which is in line with the goals of green chemistry. Also, no additional heating or other complication of the determination procedure is required. The proposed method was successfully applied to the determination of sulfide in wines and waters.
2. Experimental
2.1 Reagents and equipment
All reagents used in this study were of analytical grade purity. A 0.01 M Na2S solution was prepared by dissolving 60 mg of Na2S × 9H2O in distilled water and diluting up to the mark in a 25 mL flask. This solution was prepared every two weeks and standardized by iodometric method every time before carrying out the series of experiments. 5 M orthophosphoric acid was used to acidify the donor phase. 1 mM DTNB stock solution was prepared by dissolving 19.8 mg of DTNB in 5 mL of ethanol and diluting it with phosphate buffer having pH 7.0 up to 50 mL in a volumetric flask. Solutions of interfering ions, oxalic, tartaric, citric, and ascorbic acids were prepared by dissolving the appropriate amount of substances in distilled water.The experimental setup for the determination of sulfide by the developed method is shown in Fig. 1. Double pass optical immersion probe with a 1 cm path length (Expedeon, UK) was connected to a USB 4000 fiber optic spectrometer (Ocean Optics, USA) and DH-2000 UV-VIS-NIR light source (Ocean Optics, USA). Biochrom WPA Lightwave II UV/Visible Spectrophotometer (Biochrom Ltd) equipped with 1 cm path length Hellma Ultra-Micro-cuvette 105.210-QS with a volume of 5 μL was used to measure absorbance. OceanView spectroscopy software was used to collect the data. The reaction system was stirred with a magnetic stirrer with an RH digital heating model (IKA®-Werke GmbH & Co. KG, D-79219 Staufen Germany).
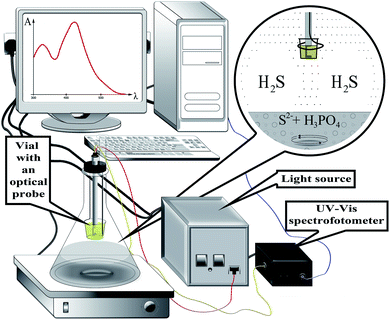 | ||
| Fig. 1 Schematic representation of the experimental setup for the HS-LPME-OIP of sulfide coupled with optical probe. | ||
2.2 Determination of sulfide by HS-LPME-OIP method
A glass flat-bottomed flask with a stirrer bar was fixed on a magnetic stirrer and filled with 10 mL of a sample containing sulfide ions with a concentration in the range from 0.5 to 8 μM. Then it was closed with a cork, in which an optical immersion probe together with a plastic vial for the acceptor phase and a syringe for acid injection were previously fixed. Acceptor phase consisted of 200 μL of a 0.1 mM DTNB solution in phosphate buffer with pH 7. 1 mL of 5 M orthophosphoric acid was injected through the syringe into the donor phase and then magnetic mixer was set to 1000 rpm. Right after that, the recording of changes in the analytical signal was initiated. The detection wavelength was set at 412 nm. The absorbance measurements were carried out for 15 minutes.3. Results and discussion
3.1 Optimization of reaction parameters
Determination of sulfide is based on the absorption of hydrogen sulfide by a solution of DTNB with the formation of 2-nitro-5-thiobenzoate anion having yellow color when the disulfide bond is broken (Fig. 2). The mechanism of the reaction is similar to the reaction with thiols.24 2-Nitro-5-thiobenzoic acid molar absorptivity at 412 nm is reported as 15![[thin space (1/6-em)]](https://www.rsc.org/images/entities/char_2009.gif) 500 M−1 cm−1,22 which is the same value as determined in this study.
500 M−1 cm−1,22 which is the same value as determined in this study.
Because DTNB reacts with any thiol-containing compound, this reaction in aqueous solutions can often be non-selective. Thus, the use of this reagent in combination with separation by headspace microextraction can significantly increase the number of sample types for analysis, for which the direct use of the reagent is impossible.
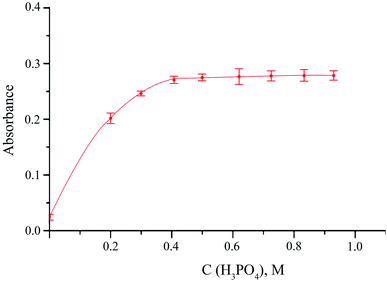
The influence of main variables affecting, from one side, the release of hydrogen sulfide from the donor phase and, on the other side, undergoing the reaction between sulfide and DTNB in the acceptor phase was studied. The main factor on which the release of gaseous hydrogen sulfide from the donor phase depends is the acidity of the reaction medium. Orthophosphoric acid was used to acidify the reaction solution. When using it, in comparison with other inorganic acids, the best results were obtained. The effect of orthophosphoric acid was studied up to 1 M concentration. Dependence of the analytical signal on the H3PO4 concentration showed that 0.5 M acid concentration is enough to reach the maximum possible release of H2S (Fig. 3). After that the analytical stops to increase. 0.5 M concentration of orthophosphoric acid was chosen as an optimal one.
Previously, it was shown that the reaction of sulfide with DTNB goes to completion at pH above 7.21,22 To clarify the optimal acidity conditions for the reaction of DTNB with H2S, we studied the dependence of the absorbance on the pH of the acceptor phase in the range from 1 to 10. It was shown that at pH greater than 6.0 maximum absorbance was observed. Additional issue is acidification of acceptor phase with orthophosphoric acid caused by its evaporation from the donor phase with a time, which should also be taken into account while choosing the pH of acceptor solution. Therefore, a pH of 7 was chosen to ensure that no unwanted acidification was observed during the determination.
DTNB concentration in the acceptor phase determines the completeness of the investigated reaction. Effect of DTNB concentration was studied in the range from 0.05 to 0.5 mM. The experiment showed that 0.1 mM reagent concentration is high enough for the complete reaction between DTNB and H2S. After that, the analytical signal practically stops changing. 0.1 mM concentration of DTNB was used in further experiments.
The temperature effect was studied in the range from 20 to 55 °C. The analytical signal is the maximum and constant in the temperature range from 20 to 30 °C, and then gradually decreases. According to the literature,22 DTNB decomposes under alkaline conditions at temperatures under 25 °C. DTNB solution in the vial heats up worse than the sample solution, but its temperature also rises. So, after 30 °C, the decomposition of DTNB begins. In further experiments, the reaction was conducted at room temperature. Stirring speed seriously affects the total mass transfer rate of sulfur dioxide. The study of this parameter in the range from 500 to 1500 rpm showed that when using 1000 rpm, the maximum absorbance of the acceptor phase is achieved. Analytical signal does not increase after reaching 1000 rpm. This indicates that at sufficiently high stirring rates, the mass transfer in the donor phase stops to be a limiting factor for the overall rate of the entire extraction process. So, this value was chosen as an optimal one.
Maximum analytical signal value was reached after 15 minutes of sulfide extraction (Fig. 4). This time was taken as optimal. It is worth noting that the use of an optical probe makes it possible to realize accurate and reproducible measurements of the rate of a chemical reaction, and thus, using the initial section of the dependence of the absorbance versus time curve, significantly reduces the measurement time without loss in the sensitivity of the determination.
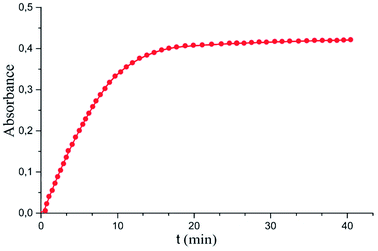 | ||
| Fig. 4 Absorbance dependence on the microextraction time. Extraction conditions: similar to those in Fig. 3, except for orthophosphoric acid concentration of 0.5 M and sample solution pH of 7.0. | ||
The sensitivity of procedures using HS-LPME preconcentration strongly depends on the volume ratio of the donor and acceptor phases. The minimum volume of the acceptor phase depends on the capacity of the receiving vial. The volume of the reagent solution has to cover optical probe path completely to get reproducible analytical signal and should give sufficiently large surface area of the gas and acceptor phase distribution to provide fast enough mass transfer of H2S from the gas phase to the reagent solution. 200 μL of acceptor phase fit all these requirements. As could be seen from Fig. 5a, a decrease in the volume of the acceptor phase does not significantly affect the sensitivity.
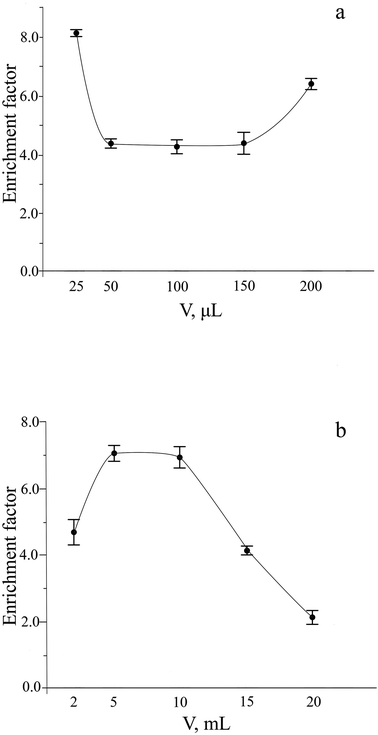 | ||
| Fig. 5 Influence of the acceptor (a) and donor (b) phase volume on the extraction of sulfide. Extraction conditions: similar to those in Fig. 4, except for sodium sulfide concentration of 4 μM and extraction time of 15 min. | ||
The enrichment factor usually increases by increasing the volume of the donor phase, provided that the volume of the extracting phase is kept constant. Dependence of the analytical signal on the donor phase volume was studied in the range from 2 to 20 mL (Fig. 5b). The absorbance of extraction phase increases with an increase in the ratio of the volumes of the donor and acceptor phases up to 5 mL volume of the donor phase that leads to improvement of the enrichment factor. The maximum and approximately constant enrichment factor was observed in the range of extraction phase volumes from 5 to 10 mL. At volumes of extracting phase higher than 10 mL, the extraction efficiency was strongly decreased that can be explained by worsened conditions for mass transfer of analyte between three phases. To determine sulfide, a 10 mL volume of donor phase was chosen as an optimal.
3.2 Interference study
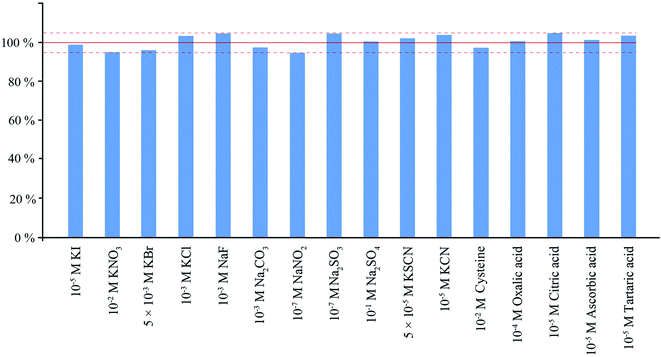
Interference study was performed with 4 μM concentration of sulfide ions. As could be seen from Fig. 6, relatively high concentrations of halide, sulfate, nitrate, and carbonate anions as well as most common cations do not have statistically significant influence on the determination. Nitrite ions are able to oxidize sulfide in an acidic medium already at 0.1 μM concentration. Sulfite strongly interferes even at the concentration of 0.2 μM due to the reaction of the released SO2 with DTNB. Substances containing a sulfhydryl group such as cysteine can react with DTNB in aqueous solutions, but since they and their reaction products are non-volatile, they have no effect on the determination of hydrogen sulfide by the proposed method. Hydroxy acids can also cause interference with sulfide determination at high concentrations. The study of the effect of hydroxy acids on the reaction system showed that, at high concentrations of these compounds, their interfering effect can be eliminated by the method of standard additions. Cyanide can react with DTNB, but only if present at a concentration greater than 10 μM. Maximum permissible levels of cyanide in water samples vary significantly under different regulations. The highest one for free cyanide in drinking water is 200 μg L−1 in the USA, but other regulations have much lower values.25 Maximum permissible concentration for thiocyanate in sewage waters is 2 mg L−1, in the drinking water this value is much lower (0.1 mg L−1).26 Maximum permissible concentrations and typical concentrations for both compounds in natural waters are lower than their interfering concentrations in the case of sulfide determination.3.3 Analytical characteristics of the HS-LPME-OIP method for the determination of sulfide
Analytical characteristics of the proposed method obtained under optimal conditions are represented in Table 1. Limit of detection was calculated as a concentration equivalent to three-times the ratio of the standard error of the regression to the slope of the calibration plot. A similar procedure was followed for the calculation of the limit of quantification, but the factor used for the multiplication of standard error of the regression was equal to 10. The enrichment factor was expressed as the ratio of sulfide concentrations in the acceptor and donor phases and was equal to 7. The developed method is characterized by high precision of 1.3%.| Parameter | Value |
|---|---|
| Analytical wavelength, nm | 412 |
| Linear range, μg L−1 | 16–256 |
| Calibration curve | A = 0.03 + 0.0029 × C (μg L−1) |
| Correlation coefficient | 0.9992 |
| LOD, μg L−1 | 6 |
| LOQ, μg L−1 | 16 |
| RSD, % | 1.3 |
| Enrichment factor | 7 |
3.4 Determination of sulfide in artificial and real samples
The developed method was tested in the analysis of different water matrices and wine. The results are summarized in the Table 2. Maximum permissible concentration of sulfide ions in drinking water is 0.5 mg L−1, while the recommended maximum permissible concentration of hydrogen sulfide in water is much lower (50 μg L−1).27 The detection limit of the proposed method (6 μg L−1) is much lower than maximum permissible concentration for sulfide ions. The recoveries obtained for artificial samples ranged from 97.9% to 103.9% and showed no significant loss of sulfide.| Samples | Sulfide concentration, μg L−1 ± confidence interval (n = 5, P = 0.95) | Recovery (%) | |
|---|---|---|---|
| Added | Found | ||
| a Composition of artificial sample: 8 μM KI; 8 μМ KSCN; 0.5 mM CaCl2; 1 mM KBr, 1 mM Na2CO3; 2 mM KNO3; 0.01 M MgSO4.b N.d. – not detected. | |||
| Artificial samplesa | 30 | 29.4 ± 1.4 | 97.9 |
| 60 | 62.3 ± 3.6 | 103.9 | |
| Tap water 1 | — | N.d.b | — |
| 60 | 58.4 ± 2.4 | 97.4 | |
| 188 | 192 ± 13 | 102.1 | |
| Tap water 2 | — | N.d. | — |
| 15 | 13.8 ± 1.8 | 92.0 | |
| 30 | 29.4 ± 0.7 | 98.0 | |
| River water | — | N.d. | — |
| 30 | 31.2 ± 2.1 | 104.2 | |
| 60 | 61.7 ± 2.0 | 102.9 | |
| Wine | — | N.d. | — |
| 144 | 140 ± 10 | 97.2 | |
4. Conclusions
In this work, the new method for determination of sulfide using headspace liquid phase microextraction preconcentration combined with online detection of analyte with optical immersion probe HS-LPME-OIP has been proposed. Developed approach permits to solve the problems with drop stability in HS-LPME,8,12 does not have any limitations in mixing rate and extraction time. Problem of combination of HS-LPME with UV-Vis spectrophotometry due too small volume of the acceptor phase and stability the holding of the acceptor phase in the hole of the optical probe are also satisfactorily solved. Also, method does not require any organic solvents, which is in line with the goals of green chemistry.Comparative characteristics of the developed method with the methods proposed in the literature for the sulfide determination combined with different microextraction techniques are given in Table 3. In contrast to dispersive liquid–liquid microextraction,9 the proposed method has better selectivity due to the absence of contact between the donor and acceptor phases. Application of this method also simplifies the procedure of the analysis and reduces the analysis time, since optical probe permits to avoid the stage of transferring the analyte to the microcuvette and a time-consuming and complicated preparation stage before analysis. An important advantage of the HS-LPME-OIP method is better reproducibility than in previously proposed microextraction methods7–12 due to the continuous measurements without transferring step. Optical probe also permits to conduct the measurements online during all reaction time. This makes it possible to carry out the kinetic determination of the analyzed substances. The last is the prerequisite for the development of the methods for the simultaneous determination of several substances in the future.
| Microextraction method | Detection technique | Reagent | Samples | Detection limit (μg L−1) | Linear range (μg L−1) | RSD (%) | References |
|---|---|---|---|---|---|---|---|
| a GC-MS – gas chromatography with mass spectrometric detection; GC-FPD – gas chromatography with flame photometric detector; CV – cyclic voltammetry; MS-FIA – multisyringe flow injection; СAR–PDMS – carboxene-polydimethylsiloxane fiber; DPD - N,N-diethyl-p-phenylenediamine. | |||||||
| None | UV-Vis | N,N-Dimethyl-p-phenylenediamine | Water samples | 200 | 680–6800 | 1.4 | 6 |
| None | MS-FIA-UV-Vis | N,N-Dimethyl-p-phenylenediamine | Spiked water matrices | 90 | 200–2000 | 1.4 | 28 |
| DLLME | UV-Vis | N,N-Dimethyl-p-phenylenediamine | Natural and wastewater, urine | 0.019 | 0.1–5 | 2.7–3.5 | 9 |
| SPME | GC-MS | N-Ethylmaleimide | — | 0.1 | 1–1000 | <11 | 11 |
| HS-SPME | GC-FPD | CAR–PDMS fiber | Wine | 0.5 | 0.25–80 | 3–20 | 10 |
| HS-LPME | CV | — | Fuel oil | 0.6 | 2–20 | 8 | 7 |
| HS-SDME | UV-Vis | Silver–gold core–shell nanoprism | Eggs, milk | 0.24 | 0.34–340 | <4.8 | 12 |
| HS-SDME | Turbidimetry | Zn(II) | Natural water | 0.5 | 5–100 | 5.8 | 8 |
| HS-LPME-OIP | UV-Vis | 5,5′-Dithiobis-(2-nitrobenzoic) acid | Wine, water samples | 6 | 16–256 | 1.3 | This work |
Author contributions
Arina Skok: writing – original draft, writing – review & editing, investigation, data curation, validation, visualization. Andriy Vishnikin: writing – original draft, writing – review & editing, conceptualization, methodology. Yaroslav Bazel: writing – original draft, writing – review & editing, project administration, conceptualization, resources.Conflicts of interest
The authors declare no competing financial interest.Acknowledgements
The work was the result of the research project No. 1/0220/21 financed by the Scientific Grant Agency of the Ministry of Education of the Slovak Republic and the Slovak Academy of Sciences. Andriy Vishnikin would like to thank to Slovak Academic Information Agency for providing a five-month scholarship.References
- D. Li and S. Liu, in Water Quality Monitoring and Management, Academic Press, 2019, ch. 12. Water Quality Monitoring in Aquaculture, pp. 303–328 Search PubMed.
- X. Qin, W. Feng, X. Yang, J. Wei and G. Huang, Sens. Actuators, B, 2018, 272, 60–68 CrossRef CAS.
- K. Kashfi, Biochem. Pharmacol., 2018, 149, 1–4 CrossRef CAS PubMed.
- C. Szabo, Antioxid. Redox Signaling, 2012, 17, 68–80 CrossRef CAS PubMed.
- W. J. Williams, Handbook of Anion Determination, Butterworths, London, 1979 Search PubMed.
- N. A. Matheson, Analyst, 1974, 99, 577–579 RSC.
- D. Nechaeva, A. Shishov, S. Ermakov and A. Bulatov, Talanta, 2018, 183, 290–296 CrossRef CAS PubMed.
- I. Lavilla, F. Pena-Pereira, S. Gil, M. Costas and C. Bendicho, Anal. Chim. Acta, 2009, 647, 112–116 CrossRef CAS PubMed.
- H. Eskandari and M. Shahbazi-Raz, Turk. J. Chem., 2016, 40, 1019–1033 CrossRef CAS.
- M. Mestres, M. P. Martí, O. Busto and J. Guasch, J. Chromatogr. A, 1999, 849, 293–297 CrossRef CAS PubMed.
- E. Frerot, A. Bagnoud and E. Cicchetti, ChemPlusChem, 2013, 79, 77–82 CrossRef PubMed.
- S. Tang, T. Qi, D. Xia, M. Xu, M. Xu, A. Zhu, W. Shen and H. K. Lee, Anal. Chem., 2019, 91, 5888–5895 CrossRef CAS PubMed.
- G. Leng, Q. Hu, W.-F. He, Z. Liu, W.-J. Chen, W.-B. Xu, Q.-H. Yang and J. Sun, J. Chromatogr. A, 2019, 1584, 72–79 CrossRef CAS PubMed.
- A.-E. Tamen and A. Vishnikin, Anal. Chim. Acta, 2021, 1172, 338670 CrossRef CAS PubMed.
- A. Vishnikin, Y. Miekh, T. Denisenko, Y. Bazel and V. Andruch, Talanta, 2018, 188, 99–106 CrossRef CAS PubMed.
- J. Tóth, Y. Bazeľ and I. Balogh, Talanta, 2021, 226, 122185 CrossRef PubMed.
- S. Zaruba, A. Vishnikin, J. Škrlíková, A. Diuzheva, I. Ozimaničová and V. Andruch, RSC Adv., 2017, 7, 29421–29427 RSC.
- R. E. Humphrey, M. H. Ward and W. Hinze, Anal. Chem., 1970, 42, 698–702 CrossRef CAS.
- E. Gómez-Otero, M. Costas, I. Lavilla and C. Bendicho, Anal. Bioanal. Chem., 2013, 406, 2133–2140 CrossRef PubMed.
- Y. Zhang and P. Qi, J. Pharm. Biomed. Anal., 2021, 201, 114092 CrossRef CAS PubMed.
- V. Gonzalez, B. Moreno, D. Sicilia, S. Rubio and D. Perez-Bendito, Anal. Chem., 1993, 65, 1897–1902 CrossRef CAS.
- R. E. Humphrey, W. Hinze and W. M. Jenkines, Anal. Chem., 1971, 43, 140–142 CrossRef CAS PubMed.
- A. S. Nashef, D. T. Osuga and R. E. Feeney, Anal. Biochem., 1977, 79, 394–405 CrossRef CAS PubMed.
- E. Cuevasanta, M. Lange, J. Bonanata, E. L. Coitiño, G. Ferrer-Sueta, M. R. Filipovic and B. Alvarez, J. Biol. Chem., 2015, 290, 26866–26880 CrossRef CAS PubMed.
- A. K. Meher, N. Labhsetwar and A. Bansiwal, Food Chem., 2018, 240, 131–138 CrossRef PubMed.
- Y. V. Matveychuk, J. Anal. Chem., 2020, 75, 662–668 CrossRef CAS.
- WHO, Hydrogen Sulfide in Drinking Water, 2003, WHO/SDE/WSH/03.04/07 Search PubMed.
- L. Ferrer, G. Armas, M. Miro, J. M. Estela and V. Cerda, Talanta, 2004, 64, 1119–1126 CrossRef CAS PubMed.
| This journal is © The Royal Society of Chemistry 2022 |


