 Open Access Article
Thiourea modified low molecular polyamide as a novel room temperature curing agent for epoxy resin
Zhiyong Huang ,
Huixin Zhu
 *,
Guofeng Jin
 *,
Yuanzheng Huang
 and
Minna Gao
Xi'an Institute of High Technology, Xi'an 710000, China. E-mail: zhuhx21@126.com
First published on 21st June 2022
Abstract
A thiourea modified low molecular weight polyamide (TLMPA) as a room temperature curing agent was synthesized by a two-step method. Firstly, a low molecular weight polyamide curing agent (LMPA) with low viscosity and high amine value was synthesized by amidation of sebacic acid with tetraethylenepentamine, then the synthesized curing agent was modified with thiourea to increase its reactivity at room temperature. The optimal reaction conditions were studied by L9(33) orthogonal experiments. The structure of the prepared curing agent was analyzed by Fourier transform infrared spectroscopy (FT-IR). The kinetics of TLMPA curing of E-51 epoxy resin was analyzed using the Kissinger method with non-isothermal differential scanning calorimetry (DSC). The activation energy of TLMPA/E-51 calculated by the Kissinger method and FWO method was 38.79 kJ mol−1 and 42.73 kJ mol−1. The nano-SiO2 filler was compounded with E-51 epoxy resin, TLMPA, allyl glycidyl ether diluent, and KH-560 coupling agent to prepare the room temperature curing epoxy resin (EP) system. L9(34) orthogonal experiments were carried out to study the effect of various factors on the mechanical properties of the cured resin systems. The best formulation of the system is that the content of nano-SiO2, curing agent, diluent, and coupling agent is 3, 35, 15, 1 wt%, respectively. With the optimal formulation, the tensile and shear strength, tensile strength, impact strength, and bending strength of the cured EP system was 13.19 MPa, 53.8 MPa, 52.16 kJ m−2, and 94.95 MPa, respectively.
1. Introduction
Epoxy resin systems have the advantages of low curing shrinkage, good material compatibility, high bonding strength, and good corrosion resistance.1–3 Commercial applications have included the most versatile multi-functional polymerization for more than half a century. However, EP itself has a chain-like thermoplastic structure, which has an application value only after cross-linking into a three-dimensional network structure under the action of a curing agent.4 According to the classification of curing conditions, cold curing (including low temperature curing and room temperature curing), hot curing, and other curing methods (including UV curing, acoustic curing, etc.) are distinguished. Compared with other curing methods, room temperature curing (curing temperature 15–40 °C) has the advantages of low shrinkage caused by the thermal expansion difference, low internal stress, low energy consumption, and low toxicity. It is usually used in oilfield plugging, building structural repairs, cultural relics' restoration, and other occasions where heating curing is not allowed.5 Aliphatic amines, modified aliphatic amines, and low molecular weight polyamines can be used as room temperature curing agents of EP among which low molecular weight polyamines and phenolic amines are the most commonly used room temperature curing agents of EP.6The low molecular weight polyamide curing agent (LMPA) is generally formed by polycondensation of dimer acid and polyamine. Compared with other curing agents, the low molecular polyamide has low toxicity, good flexibility, strong adhesion, and other advantages. However, the low molecular weight polyamide synthesized from the dimer acid has low active hydrogen content and exhibits shortcomings such as low amine value, high viscosity, and low curing speed, which limit its application in casting and room temperature curing.7–9 Compared with the traditional dimer acid, the low molecular polyamide prepared from a dibasic acid has a lower relative molecular mass, exhibits lower viscosity, and has higher active hydrogen and amide content per unit mass, showing higher reactivity. It also has a longer rotatable single bond molecular skeleton, showing better flexibility.10,11 In order to speed up the curing reaction, thiourea can also be used to modify the amine curing agent or as a reinforcement accelerator.12 At the same time, the introduction of –SH group can significantly increase the curing speed of amine curing agent, improve the brittleness of curing agent, and reduce its toxicity. Under certain reaction conditions, the highly electronegative N atom of the primary amine in the amine curing agent reacts with the C atom in the thiourea (H2NCSNH2) in a nucleophilic reaction, and the thiourea modified curing agent is obtained by removing NH3 and condensation.13 The reaction principle is as follows: Fig. 1.
In order to improve the application and performance of EP, diluents are used to reduce the viscosity of the system after preparing the curing agent at room temperature. Fillers are used to increase the thermal conductivity of the system during curing to prevent detonation and improve mechanical properties. Coupling agents are used to improve the dispersion state and bonding performance of filler.14 The performance of epoxy adhesive is affected by the interaction of various components. Therefore, it is necessary to use the orthogonal experiment method to optimize the multi-component design, and the trends can be analyzed by the average of the experimental results of each group at the same level of different factors in the orthogonal test.
In this study, the LMPA was initially synthesized and then the –SH group was introduced by modifying the structure of polyamide with a thiourea group. The physicochemical properties of LMPA before and after modification were characterized, and its curing kinetics was analyzed. Based on the modified curing agent, the EP system was formed by doping the KH-560 coupling agent, AGE diluent, and modified nano-SiO2 filler. A room temperature curing EP system with good mechanical properties was constructed.
2. Experimental
2.1 Materials
Diglycidyl ether of bisphenol A DGEBA (commercial name: E51) was supplied by the Sinopec Corp. Baling Branch. Sebacic acid (≥99%) was obtained from Tianjin Fuchen Chemical Reagent Factory. Tetraethylenepentamine (≥99%) was purchased from Chengdu Kelon Chemical Reagent Factory. Thiourea (≥99%) was obtained from the fine chemical plant of Laiyang Economic and Technological Development Zone. Acetic acid (≥99%), benzene (≥99%), and ethanol (99.5%) were purchased from Xi'an Sanpu Chemical Reagent Co. Ltd. N2 (99.999%) was acquired from Shaanxi Xinkang Medical Gas Co., Ltd. γ-(2,3-Epoxypropoxy)propyltrimethoxysilane (KH-560, ≥97%) was obtained from Jinan Xingchi Industry Co. Ltd. Nano-SiO2 (average particle size 20 nm, content 99.5%) was purchased from Jiangsu Tianxing New Material Co. Ltd. Alkyl (C12–C14) glycidyl ether (AGE) was supplied by Guangzhou Yuebao Chemical Technology Co. Ltd.2.2 Synthesis of curing agents
| Factors | Reaction time/h | Reaction temperature/°C | Ratio of raw materials |
|---|---|---|---|
| Level 1 | 1.5 | 160 | 2 |
| Level 2 | 2 | 180 | 2.5 |
| Level 3 | 2.5 | 200 | 3 |
The specific process was: the certain amount of sebacic acid was placed in a 250 mL three-necked flask equipped with magnetic stirring, a condenser, and a nitrogen-protection device and heated to 130 °C in an oil bath. At 130 °C, the sebacic acid began to dissolve. 50 mL of tetraethylenepentamine was added via a constant pressure dropping funnel, stirred at medium speed, and heated to 200 °C under N2 protection. After the reaction for 2 h, the heating was stopped, and the generated water and excess of tetraethylenepentamine were removed by distillation under reduced pressure at 5 mm Hg for 30 min, and cooled to 40 °C for storage at room temperature to obtain LMPA. Finally, a pale-yellow transparent product was acquired.
2.3 Preparation of EP system
In this study, the effects of various factors on curing speed and mechanical properties of room temperature cured EP system were investigated by orthogonal experiments. Four factors and three levels of KH-560 coupling agent (1, 3, 5 wt%), AGE diluent (10, 15, 20 wt%), modified nano-SiO2 filler (0, 3, 5 wt%), and curing agent (30, 35, 40 wt%) were selected to design L9(34) orthogonal experiments, as shown in Table 2.| Level | Factors | |||
|---|---|---|---|---|
| Dosage of coupling agent/wt% (A) | Dosage of diluent/wt% (B) | Dosage of filler/wt% (C) | Dosage of curing agent/wt% (D) | |
| 1 | 1 | 10 | 0 | 30 |
| 2 | 3 | 15 | 3 | 35 |
| 3 | 5 | 20 | 5 | 40 |
The specific process was: the certain amount of modified nano-SiO2 was dissolved in acetone, and the nano-SiO2 was evenly dispersed in acetone by ultrasonic treatment for 10 min. The acetone solution of nano-SiO2 was added to E-51 epoxy resin, stirred evenly, and dispersed in E-51 by ultrasound at 70 °C for 2 h. After that, the acetone in the system was removed in water bath at 70 °C for 10 h. E-51/nano-SiO2, AGE diluent, and KH-560 coupling agent were mixed according to the proportion and stirred evenly, and then vacuum degassing was performed. Finally, a certain proportion of curing agent was added and stirred evenly to obtain the EP system.
2.4 Characterization
The amine value of LMPA was determined by perchloric acid non-aqueous titration. Viscosity was measured with an NDJ-1S rotary viscometer. Infrared spectra were recorded with a Nexus FT-IR spectrometer. Curing kinetics of the TLMPA/E-51 systems (5.0–10.0 mg) was analyzed by the DSC method (SDT-Q600 TG-DSC Analyzer) at different heating rates of 5, 10, 15, 20 °C min−1 under N2 atmosphere at a constant flow of 50 mL min−1. Lap tensile shear strength and bending strength were measured on a SANS CMT 7204 microcomputer control electronic universal testing machine at a bending rate of 2 mm min−1 and stretching rate of 2 mm min−1. The charpy impact strength of the samples was examined with a ZBC-50B Impact Tester. Five samples of each compound were measured, and the average values were recorded. The fracture surfaces of the impact samples were examined with a VEGA II XMU scanning electron microscope (SEM).3. Results and discussion
3.1 Determination of the best reaction conditions
The value of amine groups and viscosity measured under various conditions are shown in Table 3, and range analysis is shown in Table 4 and Fig. 2. It can be seen from Fig. 2 that within each factor level, amine value increased first and then decreased with the increase of reaction time. This is because the reaction time was too short, and a large amount of tetraethylenepentamine was not involved in the reaction and was not steamed out. The reaction temperature had a little effect on the amine value. When the amount of amine increased, the condensation degree was lower, the content of free amine increased, the amine value increased, and the viscosity decreased. The viscosity increased with the increase of reaction time and decreased with the increase of reaction temperature. This is because the reaction time increased, the degree of condensation increased, the content of free amine decreased, and when the reaction temperature increased, part of the amide terminal rings was converted into imidazoline rings, reducing the viscosity of the system. It can be seen from Table 3 that the importance of each factor regarding viscosity and amine value is as follows: raw material ratio > reaction time > reaction temperature; raw material ratio > reaction temperature > reaction time. The optimal reaction conditions were as follows: reaction time 2 h, temperature 200 °C, ratio of amine to acid 3 when low viscosity and high amine value were used as indexes. Under these conditions, the value of LMPA was 745 mg KOH g−1 and the viscosity was 3.172 Pa s, which is consistent with the results of orthogonal experiments. According to the amine value, the theoretical dosage of LMPA was 33%. According to the ratio of E-51/LMPA, the gel time of EP adhesive measured at room temperature (25 °C) was 64 min, and the curing time was 173 min.| Factors | Reaction time/h | Reaction temperature/°C | Ratio of raw materials | Amine value/mg KOH g−1 | Viscosity/Pa s |
|---|---|---|---|---|---|
| Experiment 1 | 1.5 | 160 | 2 | 427 | 62.125 |
| Experiment 2 | 1.5 | 180 | 2.5 | 592 | 6.265 |
| Experiment 3 | 1.5 | 200 | 3 | 680 | 3.428 |
| Experiment 4 | 2 | 160 | 2.5 | 676 | 16.700 |
| Experiment 5 | 2 | 180 | 3 | 740 | 4.178 |
| Experiment 6 | 2 | 200 | 2 | 595 | 50.371 |
| Experiment 7 | 2.5 | 160 | 3 | 744 | 4.670 |
| Experiment 8 | 2.5 | 180 | 2 | 493 | 73.120 |
| Experiment 9 | 2.5 | 200 | 2.5 | 628 | 9.362 |
| Factors | Reaction time/h | Reaction temperature/°C | Ratio of raw materials |
|---|---|---|---|
| Mean amine values 1 | 566.33 | 615.67 | 505.00 |
| Mean amine values 2 | 670.33 | 608.33 | 632.00 |
| Mean amine values 3 | 621.67 | 634.33 | 721.33 |
| Range of amine values | 104.00 | 26.00 | 216.33 |
| Average viscosity 1 | 23.936 | 27.831 | 61.872 |
| Average viscosity 2 | 23.749 | 27.851 | 10.772 |
| Average viscosity 3 | 29.050 | 21.053 | 4.092 |
| Range of viscosities | 5.301 | 6.797 | 57.780 |
3.2 FTIR characterization
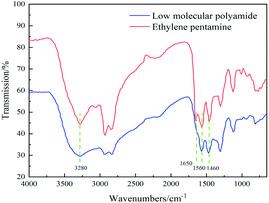
The LMPA synthesized under optimal reaction conditions was characterized by FTIR, and the results are shown in Fig. 3. It can be seen that the stretching vibration peak intensity of –NH2 of LMPA at about 3280 cm−1 is lower than that of tetraethylenepentamine, indicating that the reaction consumes –NH2 of tetraethylenepentamine. The stretching vibration peaks of C–N and C![[double bond, length as m-dash]](https://www.rsc.org/images/entities/char_e001.gif) O in the amide group are at 1460 cm−1 and 1650 cm−1, respectively, and the bending vibration peak of N–H in the amide group is at 1560 cm−1, indicating that the reaction product has a polyamide structure.15,16
O in the amide group are at 1460 cm−1 and 1650 cm−1, respectively, and the bending vibration peak of N–H in the amide group is at 1560 cm−1, indicating that the reaction product has a polyamide structure.15,16
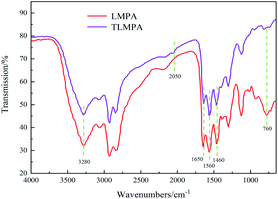
When modifying LMPA, the amount of modifier, reaction temperature, and reaction time are the main factors affecting the properties of TLMPA. In Fig. 4, 1450 cm−1, 1560 cm−1, and 1650 cm−1 are characteristic peaks of amide groups. The absorption strength of TLMPA at the stretching vibration peak of –NH2 at about 3280 cm−1 and the bending vibration peak of primary amine N–H at 760 cm−1 was obviously lower than that of LMPA because the deamination condensation reaction removed part of primary amine groups of LMPA. The characteristic absorption peak at 2050 cm−1 is C![[triple bond, length as m-dash]](https://www.rsc.org/images/entities/char_e002.gif) N, indicating that a small amount of NH4SCN is generated by a side reaction.17
N, indicating that a small amount of NH4SCN is generated by a side reaction.17
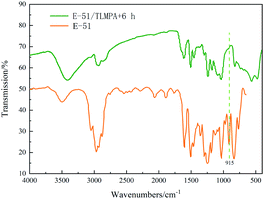
Fig. 5 shows the FTIR diagram before and after 6 h curing at 25 °C after mixing TLMPA and E-51. It can be seen from the figure that the characteristic peak of epoxy group (at 915 cm−1) of the EP system corresponding to the synthetic curing agent completely disappeared after curing for 6 h, indicating that the curing degree was relatively complete.18
It is worth noting that after curing the E-51/TLMPA mixture, no characteristic peak was found at 2500–2600 cm−1, the common spectrum segment of the –SH group.19 The strength of –SH group itself is weak and difficult to detect also due to the interference of conjugated double bonds or triple bonds in the system.20 At the same time, because LMPA itself is a kind of polymer and its specific molecular weight is difficult to measure, the modified TLMPA is a mixture, so it is difficult to measure the probability of the occurrence of –SH group in the curing process. As can be seen from the references,21–24 the nucleophilic reaction between the C atom in thiourea and the N atom with strong electronegativity in the primary amine is relatively complete in the oil bath heating environment. At the same time, because thiourea itself is a solid, if the reaction had not been completed, the mechanical properties of E-51/TLMPA would have been reduced, but such a situation was not found in the test, so the modification of thiourea was relatively complete.
3.3 Curing kinetics of TLMPA
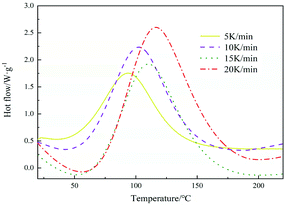
The DSC curve of E-51/TLMPA system is shown in Fig. 6. As can be seen from the figure, there is only one peak in the curing process of TLMPA, indicating that the prepared hardener has good compatibility with E-51.The Kissinger equation is as follows:25–27
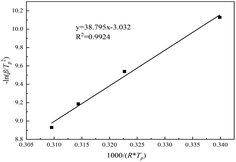
The linear fitting diagram of ln(β/Tp2) and 1/(R × Tp) is shown in Fig. 7. The regression coefficient of the fitting line is 0.9924, indicating that the Kissinger equation fits well. Ea and A can be obtained by combining its slope a1 and intercept B. If Ea = a1, A = Ea × exp(−b)/R, the rate constant k = A × exp(−Ea/RT) can be calculated by the Arrhenius equation. From the slope 38.795 and intercept −3.032, the apparent activation energy Ea is 38.795 kJ mol−1, Arrhenius constant A = 9.68 × 10⁴, and the reaction rate constant K = 0.0154 at 25 °C.
The Flynn–Wall–Ozawa equation is as follows:
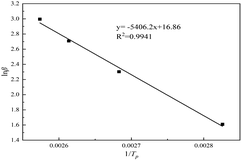
Table 5 shows the characteristic temperature values of the system at different heating rates, according to which the linear fitting diagram of ln![[thin space (1/6-em)]](https://www.rsc.org/images/entities/char_2009.gif) β and 1/Tp is shown in Fig. 8. It can be seen from Fig. 8 that the regression coefficient of the fitting line is 0.9997, indicating that the Flynn–Wall–Ozawa equation is accurately fitted. From its slope a2, the activation energy Ea = –R × a2/1.052 = 42.73 kJ mol−1.
β and 1/Tp is shown in Fig. 8. It can be seen from Fig. 8 that the regression coefficient of the fitting line is 0.9997, indicating that the Flynn–Wall–Ozawa equation is accurately fitted. From its slope a2, the activation energy Ea = –R × a2/1.052 = 42.73 kJ mol−1.
| Heating rate/(K min−1) | Ti/°C | Tp/°C | Tf/°C | Tp/K |
|---|---|---|---|---|
| 5 | 43.1 | 80.72 | 121.35 | 353.87 |
| 10 | 58.1 | 99.58 | 145.75 | 372.73 |
| 15 | 66.93 | 109.46 | 158.67 | 382.61 |
| 20 | 70.1 | 115.41 | 170.91 | 388.56 |
The Crane method to calculate the reaction order n:
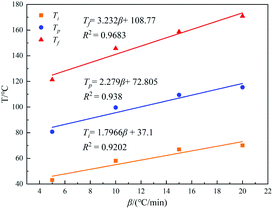
The T–β extrapolation method was used to study the gel temperature, curing temperature, and post-curing temperature of the curing system when β was zero. The T–β fitting diagram is shown in Fig. 9. It can be seen from the figure that the linear fitting degree between the three characteristic temperatures and the heating rate is high (R2 is greater than 0.92). When β is zero, the Ti, Tp, and Tf of the curing system are 37.10, 72.81, and 108.77 °C, respectively, indicating that the curing agent synthesized meets the requirements of room temperature curing.
3.4 Performance of EP system
Mechanical properties and gel time of each group in orthogonal tests are shown in Table 6.| Group | Factors | Shear strength/MPa | Impact strength/kJ m−2 | Tensile strength/MPa | Bending strength/MPa | Gel time/min | |||
|---|---|---|---|---|---|---|---|---|---|
| A | B | C | D | ||||||
| 1 | 1 | 1 | 1 | 1 | 8.01 | 25.33 | 30.25 | 74.18 | 28 |
| 2 | 1 | 2 | 2 | 2 | 13.19 | 52.16 | 53.8 | 94.95 | 24 |
| 3 | 1 | 3 | 3 | 3 | 11.67 | 34.84 | 46.61 | 91.18 | 24 |
| 4 | 2 | 1 | 3 | 2 | 12.74 | 40.72 | 43.12 | 89.15 | 23 |
| 5 | 2 | 2 | 1 | 3 | 8.97 | 35.71 | 34.7 | 82.04 | 22 |
| 6 | 2 | 3 | 2 | 1 | 14.08 | 44.58 | 52.19 | 93.38 | 31 |
| 7 | 3 | 1 | 2 | 3 | 12.79 | 52.95 | 46.46 | 93.41 | 20 |
| 8 | 3 | 2 | 3 | 1 | 12.38 | 39.5 | 48.08 | 87.56 | 27 |
| 9 | 3 | 3 | 1 | 2 | 10.23 | 28.44 | 35.44 | 83.92 | 26 |
| Factors | A | B | C | D |
|---|---|---|---|---|
| Mean 1 | 10.96 | 11.18 | 9.07 | 11.49 |
| Mean 2 | 11.93 | 11.51 | 13.35 | 12.05 |
| Mean 3 | 11.80 | 11.99 | 12.26 | 11.14 |
| Range | 0.97 | 0.81 | 4.28 | 0.91 |
| Factors | A | B | C | D |
|---|---|---|---|---|
| Mean 1 | 37.44 | 39.67 | 29.83 | 36.47 |
| Mean 2 | 40.34 | 42.46 | 49.90 | 40.44 |
| Mean 3 | 40.30 | 38.58 | 40.98 | 43.79 |
| Range | 2.90 | 3.88 | 20.07 | 7.32 |
| Factors | A | B | C | D |
|---|---|---|---|---|
| Mean 1 | 43.55 | 39.94 | 33.46 | 43.51 |
| Mean 2 | 43.34 | 45.53 | 50.82 | 44.12 |
| Mean 3 | 43.33 | 44.75 | 45.94 | 42.59 |
| Range | 0.23 | 5.58 | 17.35 | 1.53 |
| Factors | A | B | C | D |
|---|---|---|---|---|
| Mean 1 | 86.77 | 85.58 | 80.05 | 85.04 |
| Mean 2 | 88.19 | 88.18 | 93.91 | 89.34 |
| Mean 3 | 88.30 | 89.49 | 89.30 | 88.88 |
| Range | 1.53 | 3.91 | 13.87 | 4.30 |
As can be seen from the SEM figure, the intersection of light and shade of the three groups of fracture sections indicates that the section is uneven and rough, and the cracks have many branches and obvious fish scales and ripples, which are typical ductile fracture characteristics. When the amount of nanoparticles was 0 wt%, the dimple content in the section was the least. When the amount of nanoparticles was 3 wt%, the dimple content in the section was the highest, and the distribution of the river line direction of the fracture was more divergent, indicating that the addition of nano-SiO2 can effectively absorb part of the impact energy and interrupt or change the crack growth, and the corresponding impact strength was the highest. When the amount of nanoparticles was 5 wt%, the dimple content was less than 3 wt% but more than 0 wt%, and it is obvious that there are some secondary agglomerated nanoparticles on the surface, which are relatively loosely bonded with the epoxy system.31
The amount of filler is the primary factor affecting mechanical properties and heat resistance. For mechanical properties, C2 is the best, while for heat resistance, C3 is the best. But improving mechanical properties is the main purpose of this paper, so the level was determined as C2. The amount of diluent is the second factor affecting the impact and bending strength, the third factor affecting the impact strength, and the fourth factor affecting the tensile and shear strength. For the impact and tensile strength, B2 is the best. For tensile, shear, and bending strength, B3 is the best. In order to give consideration to the performance and the actual use, this level was determined as B2. The amount of curing agent is the second factor affecting the bending and impact strength and the third factor affecting the tensile, shear and tensile strength. For the tensile, shear, and bending strength, D2 is the best. For impact strength, D3 is optimal. All things considered, this level was determined to be D2. The amount of coupling agent has a little effect on the casting properties, and A1 is the best for tensile properties. For tensile, shear, and impact strength, A2 is the best. For bending strength, A3 is the best. Considering application cost, this level is A1. Therefore, the optimal ratio was determined as A1B2C2D2 (ratio no. 2). In this case, the corresponding tensile and shear strength was 13.19 MPa, tensile strength was 53.8 MPa, impact strength was 52.16 kJ m−2, bending strength was 94.95 MPa, and Tmax was 371.98 °C, indicating good comprehensive performance.33
4. Conclusions
In conclusion, a TLMPA was synthesized by a two-step method. After that, the optimal formulation of the room temperature curing EP system was 3, 35, 15, and 1 wt% of nano-SiO2, curing agent, diluent, and coupling agent, respectively. The tensile and shear strength was 13.19 MPa, the tensile strength was 53.8 MPa, the impact strength was 52.16 kJ m−2, and the bending strength was 94.95 MPa. It provides a good idea for preparing a room temperature curing agent for EP and its application.Author contributions
Zhiyong Huang: in this research activity, his main contributions are visualization, conceptualization and project administration. Huixin Zhu: in this research activity, his main contributions are methodology, formal analysis and writing – original draft. Guofeng Jin: in this research activity, his main contributions are supervision, funding acquisition and writing – review & editing. Yuanzheng Huanga: in this research activity, his main contributions are data curation, resources and software. Minna Gao: in this research activity, her main contributions are investigation and validation.Conflicts of interest
All the authors declare no conflict of interest.Acknowledgements
This work is supported by the Natural Science Foundation of Shaanxi Province of China (No. 2022JM-243).References
- D. Liu, D. Wang, Z. Li, Z. Li, X. Peng, C. Liu, Y. Zhang and P. Zheng, Materials, 2020, 13, 2145–2184 CrossRef PubMed.
- J. Kúdelčík, E. Jahoda and J. Kurimský, Eur. Phys. J. Appl. Phys., 2019, 85, 10401–10409 CrossRef.
- Y. Xu, C. Chen, W. Rao, M. Qi, D. Guo, W. Liao and Y. Wang, Chem. Eng. J., 2018, 347, 223–232 CrossRef CAS.
- Z. Shao, Z. Tang, X. Lin, J. Jin, Z. Li and C. Deng, Mater. Des., 2020, 187, 108417–108428 CrossRef CAS.
- C. Jie, C. Na, Z. Miao, J. Fan and S. Park, J. Appl. Polym. Sci., 2020, 137, 49592–49612 CrossRef.
- Y. Xu, A. Dayo, J. Wang, A. Wang, D. Lv, A. Zegaoui, M. Derradji and W. Liu, Mater. Chem. Phys., 2018, 203, 293–301 CrossRef CAS.
- A. Rudawska, J. Adhes., 2019, 96, 402–422 CrossRef.
- Y. Lu, C. Li and Y. Wu, J. Polym. Res., 2021, 28, 68–80 CrossRef CAS.
- A. Rudawska, I. Haniecka, M. Jaszek and D. Stefaniuk, Polymers, 2018, 10, 344–357 CrossRef PubMed.
- D. Arati, T. Asiya, G. Shivaji, T. Aslam, T. Mohaseen and M. Noormahamad, J. Appl. Polym. Sci., 2022, 139, 52221–52232 CrossRef.
- M. Zahra, S. Zulfiqar, W. Skene and M. Sarwar, Polym. Int., 2019, 69, 50–60 CrossRef.
- B. Zhu, C. Zuo, X. Lin and J. Jin, Mater. Des., 2020, 187, 108417–108428 CrossRef.
- G. You, H. He, B. Feng, Y. Tang, Z. Cheng and F. Fan, Chem. Zvesti, 2020, 74, 2403–2414 CrossRef CAS.
- Y. Zhao, X. Zeng and W. Zhang, Adv. Mater. Res., 2013, 652–654, 127–130 Search PubMed.
- B. Liang, J. Wang, J. Hu, C. Li, R. Li, Y. Liu, K. Zeng and G. Yang, Polym. Degrad. Stab., 2019, 169, 108954–108962 CrossRef CAS.
- B. A. Kash, M. Aaron, M. Kennedy, W. Richard, G. Marianne and C. Patrice, Polym. Chem., 2021, 12, 1487–1497 RSC.
- P. Ramesh, L. Ravikumar and A. Burkanudeen, J. Therm. Anal. Calorim., 2013, 115, 713–722 CrossRef.
- Y. Li, Z. Zhou, X. Xu and L. Xie, Adv. Mater. Res., 2013, 634–638, 3008–3016 Search PubMed.
- N. B. Cramer and C. N. Bowman, J. Polym. Sci. 1 Polym. Chem., 2001, 39, 3311–3319 CrossRef CAS.
- T. M. Roper, C. A. Guymon, E. S. Jonsson and C. E. Hoyle, J. Polym. Sci. 1 Polym. Chem., 2004, 42, 6283–6298 CrossRef CAS.
- V. C. Rufino and J. R. Pliego, Asian J. Org. Chem., 2021, 10, 1–15 CrossRef.
- O. V. Serdyuk, C. M. Heckel and S. B. Tsogoeva, Org. Biomol. Chem., 2013, 11, 7051–7071 RSC.
- F. E. Held and S. B. Tsogoeva, Catal. Sci. Technol., 2016, 6, 645–667 RSC.
- Y. J. Li, Z. G. Zang, K. Ji, P. Q. Ji, W. G. Ding and J. Liu, Acta Chim. Sin., 2007, 9, 834–840 Search PubMed.
- F. Yeasmin, A. Mallik, A. Chisty, F. Robel, M. Shahruzzaman, P. Haque, M. Rahman, N. Hano, M. Takafuji and H. Ihara, Heliyon, 2021, 7, e05959 CrossRef PubMed.
- B. L. Roger and H. Kissinger, Thermochim. Acta, 2012, 540, 1–6 CrossRef.
- L. Liu, S. Gao, Z. Jiang, Y. Zhang, D. Gui and S. Zhang, Ind. Eng. Chem. Res., 2019, 58, 14088–14097 CrossRef CAS.
- X. Li, G. Li and X. Su, J. Polym. Eng., 2018, 39, 10–15 CrossRef.
- J. Zheng, X. Zhang, J. Cao, R. Chen, T. Aziz, H. Fan and C. Bittencourt, J. Appl. Polym. Sci., 2020, 138, 50138–50149 CrossRef.
- H. Li, Z. Zhang, X. Ma, M. Hu, X. Wang and P. Fan, Surf. Coat. Technol., 2007, 201, 5269–5272 CrossRef CAS.
- C. Xiao, Y. Tan, X. Yang, T. Xu, L. Wang and Z. Qi, Chem. Phys. Lett., 2018, 695, 34–43 CrossRef CAS.
- A. Andrea, R. Katharina, M. A. Raj and W. Günter, Macromol. Mater. Eng., 2019, 304, 1900031–1900040 CrossRef.
- X. Fan, J. Miao, L. Yuan, Q. Guan, A. Gu and G. Liang, Appl. Surf. Sci., 2018, 447, 315–324 CrossRef CAS.
| This journal is © The Royal Society of Chemistry 2022 |


