 Open Access Article
Creative Commons Attribution 3.0 Unported Licence
Construction and application of highly sensitive spinel nanocrystalline zinc chromite decorated multiwalled carbon nanotube modified carbon paste electrode (ZnCr2O4@MWCNTs/CPE) for electrochemical determination of alogliptin benzoate in bulk and its dosage form: green chemistry assessment†
Khalid A. M. Attiaa,
Ahmed H. Abdel-Monema,
Ashraf M. Ashmawyb,
Amr S. Eissa *c and
Ahmed M. Abdel-Raoof
 *a
*a
aPharmaceutical Analytical Chemistry Department, Faculty of Pharmacy, Al-Azhar University, 11751, Nasr City, Cairo, Egypt. E-mail: Ahmedmeetyazeed79@Azhar.edu.eg
bChemistry Department, Faculty of Science, Al-Azhar University, Nasr City, Cairo, 11884, Egypt
cPharmaceutical Chemistry Department, Faculty of Pharmacy, Egyptian Russian University, Badr 11829 City, Cairo, Egypt. E-mail: amr.eissa@eru.edu.eg
First published on 30th June 2022
Abstract
A new sensor for alogliptin benzoate (ALG) estimation based on a simple and sensitive method was evolved on multiwalled-carbon-nanotube modified nanocrystalline zinc chromite carbon paste electrodes (ZnCr2O4@MWCNTs/CPEs). ALG electrochemical behavior was evaluated using a cyclic voltammetry (CV), square wave voltammetry (SWV) and chronoamperometry (CA). The new electrode materials were characterized by scanning electron microscope (SEM), transmission electron microscope (TEM), energy dispersive X-ray analysis (EDX) for elemental analysis and mapping, and X-ray diffraction (XRD) and the X-ray photoelectron spectroscopy (XPS) measurements. All these measurements exhibiting enhanced activity and high conductivity compared to the bare electrode without modification. The calibration curves obtained for ALG were in the ranges of 0.1–20 μmol L−1 with a quantification and detection limits of 0.09 and 0.03 μmol L−1, respectively. The prepared sensor showed a good sensitivity and selectivity with less over potential for ALG determination. Finally, the presented method was successfully applied as a simple, precise and selective electrochemical electrode for the estimation of ALG in its pharmaceutical dosage form.
1. Introduction
Diabetes is the ninth leading cause of mortality.1 Diabetes has a detrimental effect on an individual's health and quality of life. Treatment of diabetes has become critical owing to its beneficial effect on patient satisfaction and life quality. Diabetes occurs when the pancreas's beta cells are unable to release enough insulin to maintain a normal blood sugar level. There are two forms of diabetes: type 1 diabetes, which is considered an autoimmune illness, and type 2 diabetes, which is defined by inappropriate proglucagon gene expression.2 There are many categories of oral antidiabetic drugs, such as sulfonylureas, meglitinides, biguanides, thiazolidines, α-glucosidase inhibitors, dipeptidyl peptidase (DPP-4) inhibitors, and sodium-glucose transport protein 2 inhibitors.3 They act via a variety of mechanisms, including increasing insulin secretion, increasing muscle glucose uptake, increasing hepatic gluconeogenesis, increasing sensitivity to insulin, inhibiting polysaccharide reabsorption, inhibiting sucrose metabolism, decreasing glucagon release, increasing satiation, inhibiting glucose reabsorption, decreasing glucose production, and reversing insulin resistance.3,4 Many considerations, such as comorbidities, cardiovascular assessment, and mortality, influence the selection of an oral antidiabetic medication.5Alogliptin (ALG) is an oral antidiabetic that works by inhibiting the dipeptidyl peptidase enzyme, which is responsible for the degradation of glucagon like peptide 1 (GLP-1) and incretins glucose-dependent insulinotropic polypeptide (GIP). Inhibiting DPP 4 increases incretin levels, which has a beneficial impact on glycemic control. Additionally, inhibiting GIP and GLP-1 stimulates insulin secretion. Additionally, GLP-1 suppresses the release of glucose-dependent glucagon, induces satiety, lowers food intake, and slows stomach emptying rate.6 ALG may decrease inflammatory responses by inhibiting the production of proinflammatory cytokines by toll-like receptor 4 (TLR-4).7 ALG is a (2-((6-((3R)-3-aminopiperidin-1-yl)-3-methyl-2,4-dioxo-3,4-dihydropyrimidin-1(2H)-yl)methyl) benzonitrile, its chemical structure is shown in Fig. 1S.†7 Its molecular weight is 339.4 g and soluble in dimethylsulfoxide; slightly soluble in ethanol; sparingly soluble in water, methanol; very slightly soluble in isopropyl acetate and octanol.7 While ALG as benzoate salt is more soluble in water than alogliptin free base.8
ALG has been determined spectrophotometric,9–11 spectrofluorometric,12,13 chromatographic,14–20 and HPTLC.21 While the literature review revealed no electrochemical method.
On a practical level, electrochemical methods provide a number of significant benefits include their high sensitivity, selectivity, reproducibility, portability, and economics, as well as their design flexibility, disposable nature, rapid analysis, minimal sample requirement, ease of use, wide variety of electrodes, and speedy readout.22–26 Electrochemical methods can be applied in the detection of exosomes from certain diseases, drug analysis, food analysis, the precipitation of organic layers on other metals, the corrosive effect of metals on stainless steel, soil cleaning from oil contamination, and the analysis of biological fluids are all examples of electrochemistry being used in numerous sectors.22,23,25–29
Moreover, nanoparticles inclusion to electrodes enhance electrical conductivity, charge-transfer complex transfer ability, surface area, mass transport, long-term stability, multiple functionalization, amplification of signals, and catalytic activity all of which have a positive impact on the processing of the data collect.22,30–32 Cr/ZnO is an example of these nanoparticles and has a variety of applications, including the photolytic degradation of aniline, the removal of nitrogen oxide pollutants, the photocatalytic degradation of thymol blue, the strengthening of antibacterial activity, and the photodegradation of congo red under visible light.33–37 Spinel-structured ZnCr2O4 has a limited research studies in pharmaceutical field.
The present study describes the development of the first electrochemical technique for determining ALG in bulk and dosage form. Additionally, the inclusion of different nanoparticles as ZnCr2O4 or ZnCr2O4/MWCNT nanoparticles during electrode fabrication allows marvelous electrocatalytic activity toward ALG, thus enhancing the sensitivity and voltammetric signal-to-noise ratios as well as the resulting response stability for CPE quickly and accurately. Finally, the produced novel nanoparticle electrode was assessed on an eco-scale for environmental friendliness.
2. Experimental
2.1. Instrument
Gamry instrument (potentiostat/galvanostat/ZRA model Reference 3000™) linked to a private computer. The electrodes used in this study were bare CPE, ZnO/CPE, ZnCr2O4/CPE, or ZnCr2O4/MWCNT/CPE. Reference electrode was silver/silver chloride and auxiliary electrode a platinum electrode. X-ray diffractometer (XRD; Rigaku Smart Lab). Scanning electron microscope (SEM) (Japan Electro Company) linked to the energy dispersive X-ray analysis for elemental mapping (EDX). Transmission electron microscopy (TEM; Hitachi-H-7500, Japan). The X-ray photoelectron spectroscopy (XPS) analysis was performed on a Thermo Fisher Scientific ESCALAB, USA. FT-IR, Nicolet IR 200 (Thermo electron corporation, USA). pH-meter Jenway 3510. Sonicator (cleanwise®) model WUC-A06H (Korea).2.2. Materials and reagents
Hikma pharma generously contributed ALG for research use. Its purity was (99.00 ± 0.21). Graphite powder with high purity (10–20 μm), paraffin oil, zinc acetate dihydrate Zn(CH3COO)2·2H2O and chromium nitrate tetrahydrate (Cr(NO3)2·4H2O) were purchased (Sigma-Aldrich, Germany). The phosphate buffer solution (0.1 mol L−1) consists of a mixture of 1.0 mol L−1 Dipotassium phosphate K2HPO4 and 1.0 mol L−1 Dihydrogen potassium phosphate KH2PO4, using a specific volume of 0.1 mol L−1 H3PO4 and 0.1 mol L−1 NaOH for pH adjustment.2.3. Standard solution
To make a standard stock solution of ALG (1 × 10⁻³ mol L−1), we dissolved 46.15 mg of ALG in 70 ml of distilled water, stirring it for 15 minutes, and then ultrasonically dissolving the remaining water to make it 100 ml. The final standard solution was prepared by transferring the necessary aliquots into a 10 ml volumetric flask.2.4. Synthesis of ZnO, ZnCr2O4 and ZnCr2O4/MWCNT nanoparticles
In order to synthesize ZnO nanoparticles, 10 mmole Zn(CH3COO)2·2H2O dissolved in 50 ml water under stirring. 20 ml of 2 mol L−1 NaOH solution was slowly added dropwise and pH of the solution was maintained at 11 into the starting materials under vigorous stirring. The solution was transferred into Teflon lined sealed stainless steel autoclaves and maintained at 180 °C for 12 h under endogenous pressure. After completion the reaction, the formed white solid precipitate was washed with ethanol, filtered and dried in oven at 60 °C.38 ZnCr2O4 nanoparticles were prepared by the same procedure in addition to 3 mmol of amount Cr(NO3)2·4H2O was added to the starting solution. After completion the reaction, the formed grey black precipitate was washed with ethanol, filtered and dried in oven at 60 °C.39 ZnCr2O4/MWCNT nanoparticles was prepared as before under ultrasonication of ZnCr2O4 to MWCNT in a ratio 1![[thin space (1/6-em)]](https://www.rsc.org/images/entities/char_2009.gif) :
:![[thin space (1/6-em)]](https://www.rsc.org/images/entities/char_2009.gif) 4, then the grey black powder was dried under the same condition.40
4, then the grey black powder was dried under the same condition.40
2.5. Working electrode construction
For the bare carbon electrode, 0.4 g graphite powder and 0.2 ml paraffin oil were mixed into a homogenous paste, then the electrode cavity was filled with formulated carbon paste, smoothing the electrode surface to give a shiny surface, and finally, dipping copper wires into the electrode to connect electricity. ZnO, ZnCr2O4 and ZnCr2O4/MWCNT modified electrodes fabrication, blend 0.6 g graphite powder and different percent modifier ranged from (2–12%) nanoparticles powder with 0.4 ml paraffin oil to create a homogenous paste, then pack the electrode cavity with the formulated carbon paste and smooth the electrode surface to get a shiny surface. Finally, through dipping copper wire, connect the electrode to the electrical supply.2.6. General procedure
An adequate volume of ALG standard solution was added to the voltammetric cell, which had been previously prefilled with 25 ml of PBS buffer, pH 3.0 to obtain a final concentration of 1.00 × 10⁻⁴ μmol L−1. Then, for a set period of time, each prepared electrode is exposed to a known voltage. After the specified time interval, the potential and stirring were suspended for 5.0 seconds. Each concentration sample was treated identically. Finally, square wave voltammograms were recorded at the same optimal condition in CV in concentration range 0.1–20 μmol L−1 with a sweep rate of 100 mV s−1, pulse amplitude of 20 mV and frequency of 20 Hz.2.7. Application to pharmaceutical formulation
To calculate inhiglip® 12.5 mg, smash twenty tablets containing 12.5 mg ALG. The crushed tablets were weighed, and the weight equivalent to one tablet was transferred to a 100 ml volumetric flask, to which 70 ml of distilled water was added for dissolution. After vigorously shaking for ten minutes, the mixture was sonicated for 15 minutes. Distilled water was utilized to fill the volumetric flask to the mark. The linear regression equation used to determine the concentration of ALG per tablet after centrifugation of the prepared solution at 5000 rpm for 20 minutes at a temperature of 20°.3. Results and discussion
3.1. Characterization of the synthetized nanoparticles (ZnO, ZnCr2O4 and ZnCr2O4/MWCNT)
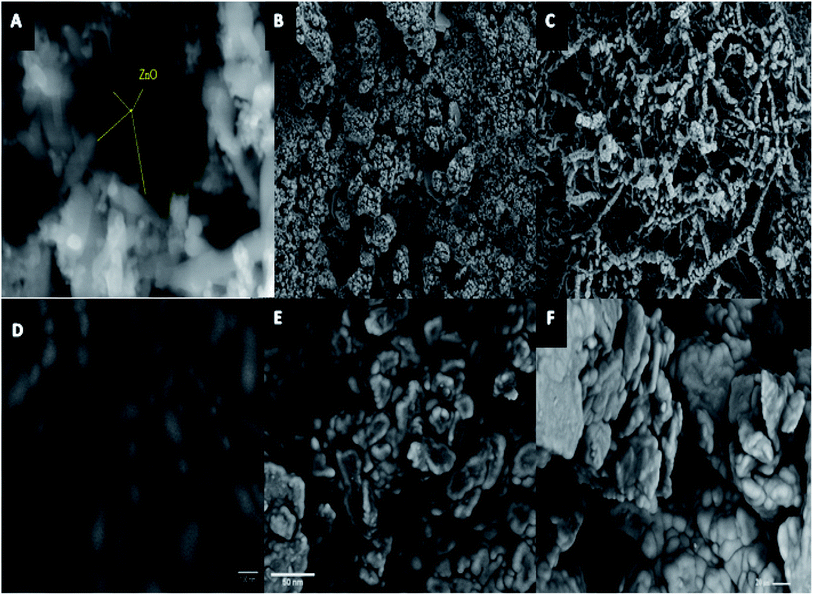 | ||
| Fig. 1 (A) ZnO SEM image, (B) ZnCr2O4 -NPs SEM image, (C) ZnCr2O4 -NPs/MWCNTs SEM image, (D) carbon paste (CP)SEM image, (E) ZnCr2O4/CP SEM image and (F) ZnCr2O4/MWCNTs/CP SEM image. | ||
Fig. 1D shows bare carbon paste (CP) SEM images with the graphite paste surfaces electrodes following their fabrication with ZnCr2O4/CP and ZnCr2O4/MWCNT/CP respectively, Fig. 1E and F which indicates the presence of multi-layered compact graphite, confirming the observations suggests that the synthetic graphite is of high quality with some surface modification owing to nanoparticles incorporation.41,42
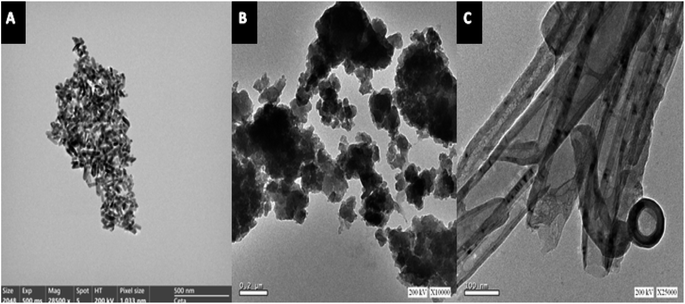
Fig. 2A–C shows the TEM images of ZnO, ZnCr2O4 and ZnCr2O4/MWCNT, which suggests ZnO nanoparticle formation with an average size ranged 5–10 nm, Fig. 2A. Interestingly, chromium nanoparticles' dispersion on ZnO surface with spinel structure is evident from the TEM image as shown in Fig. 2B, where particle size is about (25–35 nm) with little aggregation. Moreover, ZnCr2O4 nanoparticles' dispersion on the MWCNTs surface is evident from the TEM image as shown in Fig. 2C, where MWCNTs were further stripped and the lumen was opened completely for more zinc and chromium ions inclusion.
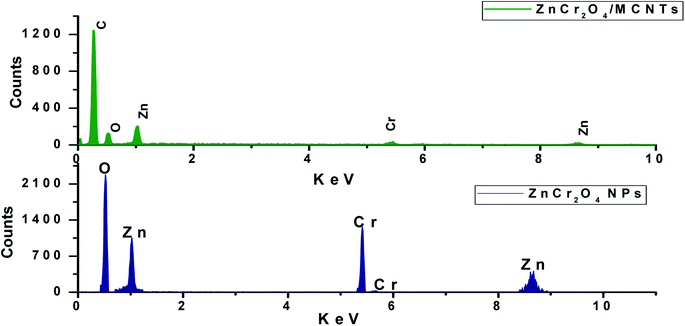
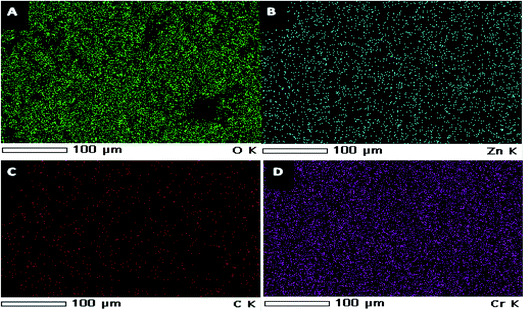
EDX spectra of ZnO nanorods, ZnCr2O4NPs and ZnCr2O4/MWCNT confirmed no other impurity element present in the nanocomposite. EDX spectrum of ZnCr2O4NPs EDX spectrum demonstrates the presence of chromium, zinc and oxygen. Thus, the presence of chromium in the modified ZnCr2O4NPs is the proof for surface modification with no other peaks for any other element has been detected in the EDX spectrum for ZnCr2O4 which again confirmed that the grown spinel nanocrystalline are pure ZnCr2O4 Fig. 3. Moreover, ZnCr2O4/MWCNT reveals close chemical composition with low intensity and higher carbon percentage related to MCNTs addition, Fig. 3. Also, the homogenous dispersion of chromium nanoparticles with ZnO NPs associated with MWCNT was shown by EDX color mapping of ZnCr2O4/MWCNT NPs, Fig. 4A–D.
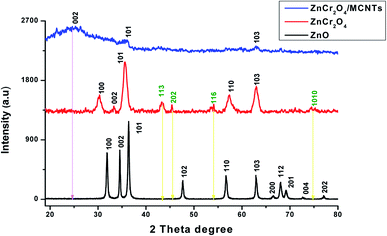
X-ray diffraction of studied nanoparticles reveal that, no characteristic peaks were detected other than ZnO and all the diffraction peaks acceptable with the reference JCPDS no. 36-1451 data39,43 which assured ZnO phase for the synthesized nanorods. The diffraction peaks located at 31.77°, 34.58°, 36.41°, 47.49°, 56.43°, 62.74°, 66.48°, 68.21, 69.49, 72.72 and 77.17° have been keenly indexed as nanorods phase of pure ZnO. XRD for ZnCr2O4 NPs pattern has the most corresponding peaks as pure ZnO but with shifting and more broaden. Also, it has appearance of a new diffraction peaks located at 43.28°, 45.38°, 54.07° and 74.66° accordance to JCPDS card no. 38-1479 (ref. 44 and 45) and disappearance of some peaks for ZnO NPs which confirms formation of two phase. Moreover, the small shifting and broadening of the diffraction peaks increases which confirms the substitution of smaller chromium atoms on zinc sites surface.46 The full width at half maximum of the peaks for ZnCr2O4NPs increase due to a segregation of chromium atoms to the particle. Upon incorporation of MCNTs with ZnCr2O4, the most diffraction peaks for ZnO NPs and ZnCr2O4 were disappeared and appearance of broad peak at 25.12° (corresponding to (002) crystal plane), which assure the high percent ratio of MCNTs to ZnCr2O4 spinel nanocrystalline particles, Fig. 5.
Scherrer equation applied for the crystallite size determination on the highest peak (101) using the following formula
D = Kλ/β![[thin space (1/6-em)]](https://www.rsc.org/images/entities/char_2009.gif) cos cos![[thin space (1/6-em)]](https://www.rsc.org/images/entities/char_2009.gif) θ θ |
The obtained results indicate that ZnO, ZnCr2O4 and ZnCr2O4/MWCNT samples exhibit a good structural characteristic observed in SEM, TEM, EDX and XRD analysis.
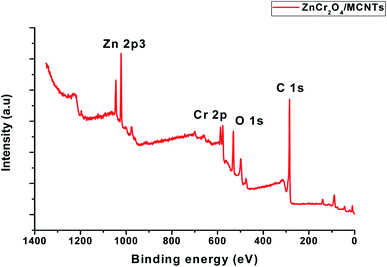
Fig. 6 shows a full survey spectrum of the ZnCr2O4/MCNTs nanocrystalline. Characteristic peaks for Zn, Cr, O and C elements can be observed in the obtained curve. XPS spectra examination of nanoparticles spectrum shows presence of a main peak Cr(III) species with value of binding energy equal 576.98 and 586.4 eV Fig. 2S.† One can generally deduce the oxidation state of chromium and we find oxidation states which correspond to Cr2O3.47 In the survey of spectrum for Zn 2p, the strong resolution Zn 2p spectrum is presented in Fig. 3S,† in which two strong peaks at 1022.07 and 1044.40 eV can be clearly seen, corresponding to the binding energy of Zn 2p3/2 and Zn 2p1/2 respectively, indicating the presence of Zn2+ in the ZnCr2O4 structure. From the O 1s spectrum Fig. 6, it can be seen that the spectrum can be fitted to gauss peak at 529.52 eV is attributed to the lattice oxygen from the ZnCr2O4 nanoparticles48 XPS results in Fig. 6 with the high resolution of C 1s and O 1s explain the deconvoluted peaks of MWCNTs where the peak at 285.29 eV confirmed the decorated MWCNTs with ZnCr2O4.47
3.2. ALG's electrochemical behavior and response at different electrodes
Cyclic voltammograms for a solution of K4 [Fe(CN)6] (1 × 10⁻³ mol L−1) in 0.1 mol L−1 KCl were prepared for the reaction. The Randles–Sevcik equation was used to figure out the active surface area of the electrodes49| Ipa = (2.69 × 10⁵)n3/2A0C0D01/2υ1/2 |
Accordingly, the signal from ZnCr2O4/MWCNT was superior to that from the other modified electrodes ZnO/CPE, ZnCr2O4/CPE and bare CPE due to the fact that the inclusion of the nanoparticle increased the electrochemical signal and the effective surface area of ZnCr2O4/MWCNT electrode was 0.281 compared to 0.195 and 0.146, 0.052 for ZnCr2O4, ZnO and plain CPE electrodes, respectively. The higher surface area implies the existence of more active sites, which improves the electrostatic interaction between ALG and ZnCr2O4/MWCNT surface. When these four unique electrode responses were compared to a solution that contains (1.0 × 10⁻⁴ mol L−1) ALG at a pH of 3 and a scan rate of 100 mV s−1, it was determined that ZnCr2O4/CPE had a greater intensity than plain CPE, ZnO where the highest current response and less positive overpotential shift at ZnCr2O4/MNCT/CPE which related to the capability of ZnCr2O4 NPs to penetrate through the spacing between MCNTs and graphite layers of CPE and owing to less surface fouling ability and the higher unique surface/volume MCNTs ratio, Fig. 7.
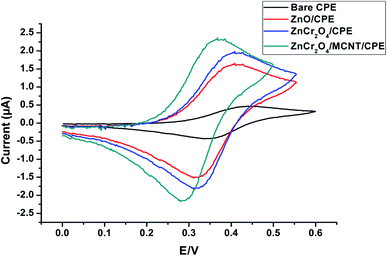 | ||
| Fig. 7 CV of the four distinctive electrodes behavior for 1.00 × 10⁻⁴ mol L−1 ALG conducted in PBS of pH 3 at scan rate of 100 mV s−1. | ||
These results suggest that inclusion of the electrode with ZnCr2O4/MWCNT enhances its surface area, increasing the number of active sites accessible for interaction with ALG and thereby improving the electrode's conductivity and sensitivity to ALG. On further investigation, it was found that 10% ZnCr2O4/MWCNT NPs was excellent for achieving the appropriate conductivity and sensitivity, as demonstrated by SWV, whereas larger concentrations of ZnCr2O4/MWCNT were found to be undesirable Fig. 4S,† leading in a loss to active sites and electrode surface blocking.
3.3. Optimization of the experimental conditions
![[thin space (1/6-em)]](https://www.rsc.org/images/entities/char_2009.gif) :
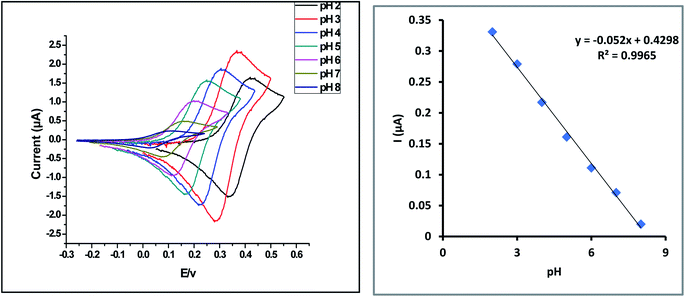
:![[thin space (1/6-em)]](https://www.rsc.org/images/entities/char_2009.gif) 1, and the slope of the reaction is 0.052, which is quite near to the Nernstian theoretical value (0.059). As a result, the reaction is pH-dependent.
1, and the slope of the reaction is 0.052, which is quite near to the Nernstian theoretical value (0.059). As a result, the reaction is pH-dependent.| Epa (V) = −0.052 pH + 0.4298 | (1) |
| Ipa = 3.2265υ1/2 + 1.1483 | (2) |
Moreover, on plotting the logarithm of peak current response vs. logarithm of the scan rate, the relation was linear, Fig. 5S (inset B).†
log![[thin space (1/6-em)]](https://www.rsc.org/images/entities/char_2009.gif) Ip = 0.216 + 0.55 Ip = 0.216 + 0.55![[thin space (1/6-em)]](https://www.rsc.org/images/entities/char_2009.gif) log log![[thin space (1/6-em)]](https://www.rsc.org/images/entities/char_2009.gif) ν ν
| (3) |
The slope value was 0.55 which confirm that the mechanism of electroactive transport is diffusion technique.
Upon plotting log(i) versus potential Fig. 5S (inset C),† α value can be determined from the Tafel plot.51 The experimentally slope value was 7.69 is compatible with the value of 0.46 for transfer coefficient.
The transfer coefficient value (αn) for ALG can be calculated by using the following equation52
4. Chronoamperometric studies
Chronoamperometry investigations were used to determine the diffusion coefficient of ALG. The study employs four different concentrations of ALG, and choronoamperogrammes were obtained for a ZnCr2O4/MWCNT/CPE over a fixed potential (pH = 3), as shown in the Fig. 6S (inset A).† Further analysis of the obtained choronoamperogramms revealed a linear relationship between current obtained and t−1/2 for the all studied concentrations, as illustrated in Fig. 6S (inset B).† To calculate the diffusion coefficient, the obtained slopes were plotted against the corresponding concentration of ALG, as illustrated in Fig. 6S (inset C)† and the diffusion coefficient was calculated to be 1.18 × 10⁻⁵ using the Cottrell equation.534.1. Determination of ALG in pure form
The working potential range 0–1.4 V utilized for ALG electro oxidation on the ZnCr2O4/MWCNT/CPE in. However, ALG showed an oxidation peak at 0.34 V potential at ZnCr2O4/MWCNT/CPE by square voltammetry as described in Fig. 9. The calibration curve of ALG versus peak current was linear. The linearity of the method was found to be 0.1–20 μmol L−1 and statistical parameters are described in Table 1.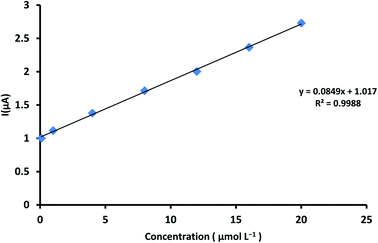 | ||
| Fig. 9 Calibration curve set down for ALG concentrations range from 0.1 to 20 μmol L−1 at ZnCr2O4/MWCNT/CPE in PBS at pH 3.0 and scan rate 100 mV s−1. | ||
| Parameters | SWV method |
|---|---|
| a n = five determinations mean.b n = three determinations mean. | |
| Linearity (μmol L−1) | 0.1–20 |
| Slope | 0.085 |
| Intercept | 1.017 |
| Slope SD | 0.001 |
| Intercept SD | 0.014 |
| Correlation coefficient (r) | 0.9988 |
| Accuracya (% R) | 99.45 |
| Repeatability (% RSD) | 1.223 |
| Intermediate precisionb (% RSD) | 0.887 |
| LOQ (μmol L−1) | 0.09 |
| LOD (μmol L−1) | 0.03 |
5. Methods validation
5.1. Linearity, limit of detection (LOD) and limit of quantitation (LOQ)
The linearity, the coefficient of determination and percent relative standard deviation (% RSD) of ALG were determined utilizing the new ZnCr2O4/MWCNT/CPE as reported in Table 1. For each concentration, the average of three replicates was calculated; the linear regression parameters for the approach are provided in Table 1. According to ICH recommendations, the limit of detection (LOD) and limit of quantitation (LOQ) are the lowest concentrations that can be detected and quantified, as stated in Table 1.| LOD = 3.3 × SD/slope and LOQ = 10 × SD/slope |
5.2. Accuracy
As a consequence of the new ZnCr2O4/MWCNT/CPE fabrication, accuracy should be assessed through measuring % recovery of ALG concentrations, the final result should be close to the theoretical value that was previously recorded. The novel ZnCr2O4/MWCNT electrode's accuracy was tested by comparing the new suggested technique for determining drug concentration with the real concentration of ALG. Table 1 shows the average percentage of recovery as calculated.5.3. Precision (repeatability, intermediate precision)
Three distinct ALG concentrations were evaluated on one day and three consecutive days to determine the repeatability and intermediate precision (inter-day and intra-day) of the novel ZnCr2O4/MWCNT electrode method. The novel ZnCr2O4/MWCNT electrode method findings were analyzed and found to have a good degree of precision, enabling it to be utilized for quality control of ALG as shown in Table 1.5.4. Robustness, reusability, reproducibility and stability
Robustness is a term that relates to an analytical technique's ability to stay unaffected by little changes in the procedure's conditions.54 The used technique robustness was established by noticing peak current response to purposefully minor changes in method parameters. Among the circumstances tested were the equilibrium period (10 s ± 0.2 s) and pH variation (3 ± 0.1). The peak current of ALG remained unaffected by these minor alterations that occurred throughout the experimental method, indicating the suggested approach's robustness. The sensor's reusability was determined by comparing the voltammetric response of a previously used new ZnCr2O4/MWCNT/CPE to that of the newly synthesised sensor (more than ten times). The fact that both sensors generated a similar response demonstrates the sensor's reusability. The reproducibility of the ZnCr2O4/MWCNT/CPE was evaluated by fabricating five sensors under similar conditions and all sensors produced almost similar response with a % RSD of 1.87, showing that the sensor is highly reproducible. The constructed sensor's stability was tested over a 30 day period by measuring the resultant current gathered using the provided technique. The stability of the constructed sensor is investigated through this period. According to previous data, the newly synthesized ZnCr2O4/MWCNT/CPE exhibits a high degree of reliability.5.5. Analytical applications of commercial tablets
An investigation was conducted into the effectiveness of a novel ZnCr2O4/MWCNT/CPE electrode for the analysis of commercial tablets containing ALG. To accurately measure ALG in pharmaceutical products using a novel ZnCr2O4/MWCNT/CPE electrode sensor, the SWV method was applied. Standard addition technique was applied and satisfactory results were obtained. The results displayed provided successful application with good recovery as presented in Table 2.| Tablets | Method | % Found ± SD | Standard addition technique | ||
|---|---|---|---|---|---|
| Added (μg mL−1) | Found (μg mL−1) | % Recovery | |||
| Inhiglip® labeled (12.5 mg per tab) | SWV | 100.23 ± 0.54 | 0.5 | 0.49 | 98.00 |
| 2.00 | 1.96 | 98.50 | |||
| 4.00 | 4.03 | 100.75 | |||
| 11.00 | 11.19 | 101.73 | |||
| 16.00 | 15.93 | 99.56 | |||
| Mean ± % RSD | 99.70 ± 1.387 | ||||
5.6. Interference study
Analyses of pre-prepared laboratory mixtures containing various ALG were used to examine the novel ZnCr2O4/MWCNT/CPE electrode's selectivity. The systematic error caused by other materials may be present or incorporated in the same pharmaceutical dosage form with ALG can be estimated by the interference experiment using standard solutions of the interferent analyte to be able to introduce the interference at a known concentration. Metformin hydrochloride (MET) was effective and safe to be used as adjunct therapy in advanced diabetic patients and co-formulated with ALG in the same dosage form. The solutions containing ALG and different MET concentration in PBS (pH 3.0) were prepared prior to the analyzing step. The proposed method exhibited a high resolution, very small % RSD and accurate quantification where the obtained SWV curves show no change in ALG oxidation peak current relative with increasing MET concentrations Fig. 7S† along with a linear relationship of the oxidation peak current versus ALG concentrations Fig. 7S (inset A).†5.7. Statistical comparison
Statistical analysis of the gained results of estimation of ALG in its dosage form was applied and compared to those of a reported HPLC method.15 F- and t-values were then estimated and compared as in Table 3. The recovery percentage obtained for the results of the pharmaceutical dosage form for the proposed sensors and the reported HPLC method were statistically compared using one way-ANOVA at a 95% confidence interval (P = 0.05). No statistically significant difference between the proposed electrodes assay and the reported HPLC method from the results obtained from ANOVA test, as shown in Table 4 to confirm the precise assessment of studied drug in the bulk and its pharmaceutical formulation and assuring the validity of applying the adopted method. Moreover, the proposed method was more applicable than the published methods as the proposed method is more sensitive than the reported methods (Table 5).| Matrix | Method | Linearity range | LOD | Reference |
|---|---|---|---|---|
| Bulk and pharmaceutical dosage forms | HPLC/UV | 85–306![[thin space (1/6-em)]](https://www.rsc.org/images/entities/char_2009.gif) μg mL−1 μg mL−1 |
0.03 μg mL−1 | 15 |
| Spiked human plasma | LC-MS/MS | 0.04–16.096 μg mL−1 | 0.0425 μg mL−1 | 14 |
| Impurities and degradants in bulk drugs | LC-MS/MS | 0.1–75![[thin space (1/6-em)]](https://www.rsc.org/images/entities/char_2009.gif) μg mL−1 μg mL−1 |
— | 18 |
| Spiked human plasma | HPLC/UV | 0.1 to 50 μg mL−1 | 0.019 μg mL−1 | 20 |
| Bulk and pharmaceutical dosage forms | HPTLC | 0.25 to 15 μg mL−1 | 0.067 μg mL−1 | 21 |
| Bulk and pharmaceutical dosage forms | Visible spectrophotometric | 1–10![[thin space (1/6-em)]](https://www.rsc.org/images/entities/char_2009.gif) μg mL−1 μg mL−1 |
0.115 μg mL−1 | 9 |
| Bulk and pharmaceutical dosage forms | UV spectrophotometric | 2–16![[thin space (1/6-em)]](https://www.rsc.org/images/entities/char_2009.gif) μg mL−1 μg mL−1 |
— | 10 |
| Bulk and pharmaceutical dosage forms | Spectrofluorometry | 0.1–0.5 μg mL−1 | 0.022 μg mL−1 | 13 |
| Bulk and pharmaceutical dosage forms | Voltammetry | 0.1–20 μmol L−1 | 0.03 μmol L−1 | Our work |
5.8. Assessment of greenness of the analytical methods greenness
According to the eco-scale approach, the new fabricated electrode was assessed for its greenness by calculating penalty points from the newly established processes, including chemicals, instruments, and trash.55,56 The approach was determined by the result of deducting these penalty points from 100; a high result implies that the method is more environmentally friendly. The penalty points in these new approaches were 12, which resulted in a total score of 88, as shown in Table 6, indicating that this newly created electrode is regarded as environmentally favorable.| Reagents/instruments | Penalty points |
|---|---|
| Water | 0 |
| Phosphate buffer | 1 |
| Water | 0 |
| Heating > 1 h | 3 |
| ZnCr2O4/MWCNT | 3 |
| Occupational hazard instrument | 0 |
| Pressure equipment | 0 |
| Energy (≤0.1 kW h per sample) | 0 |
| Waste | 5 |
| Total penalty scores | 12 |
| Total analytical Eco-scale | 100–12 = 88 |
6. Conclusion
The proposed electrochemical method was applied successfully to determine ALG in its pure and dosage forms (inhiglip). ZnCr2O4/MWCNT electrode increased the process of electron transfer as well as improved the electrode active surface area mainly due to the ability of ZnCr2O4 NPs to penetrate through the spacing between graphite layers of CPE and MCNTs. The higher molecular-scale wires resemblance and less surface fouling ability of MCNTs with unique high surface/volume ratio and their high porosity character of ZnCr2O4 nanocrystalline exhibits very sensitive results with low detection limits and higher stability with no risk of interference from excipients and its co-formulation drug were acquired.Conflicts of interest
All authors declare that there is no conflict of interest regarding the publication of this work.References
- M. A. B. Khan, et al., J. Epidemiol. Glob. Health, 2020, 10, 107 CrossRef PubMed , https://www.ncbi.nlm.nih.gov/pmc/articles/PMC7310804/.
- D. K. I. Rother, N. Engl. J. Med., 2007, 356, 1499 CrossRef PubMed , https://www.ncbi.nlm.nih.gov/pmc/articles/PMC4152979/.
- K. Ganesan, M. B. M. Rana and S. Sultan, StatPearls, 2021 Search PubMed , PMID: 29494008, https://www.ncbi.nlm.nih.gov/books/NBK482386/.
- A. Chaudhury, et al., Front. Endocrinol., 2017, 8, 6 Search PubMed.
- D. Qian, et al., Diabetes Ther., 2018, 9, 1945–1958, DOI:10.1007/s13300-018-0482-5.
- R. Christopher, et al., Clin. Ther., 2008, 30, 513–527 CrossRef CAS PubMed.
- L. K. Golightly, C. C. Drayna and M. T. McDermott, Clin. Pharmacokinet., 2012, 51, 501–514 CrossRef CAS PubMed.
- S. Kim, et al., Nucleic Acids Res., 2021, 49, D1388–D1395 CrossRef CAS PubMed.
- A. V. V. N. K. Sunil Kumar, T. V. Reddy and C. B. Sekharan, Karbala Int. J. Mod. Sci., 2017, 3, 8–17 CrossRef.
- P. J. Yadav, V. N. Kadam and S. K. Mohite, J. Curr. Pharma Res., 2014, 4, 1286–1290 CrossRef , https://www.jcpronline.in.
- A. V. V. N. K. Sunil Kumar, T. V. Reddy and C. B. Sekharan, Bull. Fac. Pharm. (Cairo Univ.), 2017, 55, 177–184 Search PubMed.
- S. M. Derayea, A. A. Gahlan, M. A. Omar, G. A. Saleh and A. M. Haredy, Luminescence, 2020, 35, 1028–1035, DOI:10.1002/bio.3812.
- S. Zhang, et al., Spectrochim. Acta, Part A., 2021, 246, 119040 CrossRef CAS PubMed.
- S. Biswal, S. Mondal and P. Mondal, Egypt. Pharm. J., 2021, 20, 82 Search PubMed , http://www.epj.eg.net/article.asp?issn=1687-4315;year=2021;volume=20;issue=1;spage=82;epage=91;aulast=Biswal.
- H. Naseef, R. Moqadi and M. Qurt, J. Anal. Methods Chem., 2018, 2018 DOI:10.1155/2018/1902510.
- M. Vinyas, S. Velivela, G. Yadav, N. B. Pati and V. R. M. Gupta, Res. J. Pharm. Technol., 2016, 9, 775–778 CrossRef.
- Y. Zhang, et al., J. China Pharm. Univ., 2020, 51, 488–493 Search PubMed.
- Y. Zhou, et al., J. Sep. Sci., 2014, 37, 1248–1255, DOI:10.1002/jssc.201301384.
- Y. Lu, D. Yang, Z. Li, T. Hang and M. Song, J. Pharm. Biomed. Anal., 2016, 128, 253–263 CrossRef CAS PubMed.
- S. F. Hammad, I. A. Abdallah, A. Bedair and F. R. Mansour, BMC Chem., 2021, 15, 1–10, DOI:10.1186/s13065-020-00729-8.
- K. R. Patil, T. A. Deshmukh and V. R. Patil, Am. J. PharmTech., 2019, 9, 333–343 Search PubMed.
- A. Vasilescu, A. Hayat, S. Gáspár and J. L. Marty, Electroanalysis, 2018, 30, 2–19, DOI:10.1002/elan.201700578.
- S. Yadav, et al., ChemElectroChem, 2017, 4, 967–971, DOI:10.1002/celc.201600391.
- H. Karimi-Maleh, F. Karimi, M. Alizadeh and A. L. Sanati, Chem. Rec., 2020, 20, 682–692, DOI:10.1002/tcr.201900092.
- F. Cui, Z. Zhou and H. S. Zhou, J. Electrochem. Soc., 2020, 167, 037525, DOI:10.1149/2.0252003JES.
- M. J. A. Shiddiky, M. A. Rahman and Y. B. Shim, Anal. Chem., 2007, 79, 6886–6890, DOI:10.1021/ac0710127.
- V. V. Pryanichnikova, N. S. Shulaev, N. A. Bykovsky and R. R. Kadyrov, Key Eng. Mater., 2017, 743, 314–318 Search PubMed , https://www.scientific.net/KEM.743.314.
- P. Allongue, et al., Electrochim. Acta, 1998, 43, 2791–2798 CrossRef CAS.
- A. M. Abdel-Raoof, et al., J. Electrochem. Soc., 2019, 166, B948–B955, DOI:10.1149/2.0631912jes.
- X. Wang, Z. Kang, E. Wang and C. Hu, Mater. Lett., 2002, 56, 393–396 CrossRef CAS.
- C. M. Welch and R. G. Compton, Anal. Bioanal. Chem., 2006, 384, 601–619, DOI:10.1007/s00216-005-0230-3.
- B. Bozal-Palabiyik, C. Erkmen, S. Kurbanoglu, S. A. Ozkan and B. Uslu, Curr. Anal. Chem., 2020, 17, 1322–1339 CrossRef.
- M. Pirsaheb, et al., Sci. Rep., 2017, 71(7), 1–12 Search PubMed , https://www.nature.com/articles/s41598-017-01461-5.
- S. N. Nguyen, et al., ACS Omega, 2019, 4, 12853–12859, DOI:10.1021/acsomega.9b01628.
- A. Nibret, O. P. Yadav, I. Diaz and A. M. Taddesse, Bull. Chem. Soc. Ethiop., 2015, 29, 247–258 CrossRef CAS , https://www.ajol.info/index.php/bcse/article/view/119296.
- K. Vijayalakshmi and D. Sivaraj, RSC Adv., 2015, 5, 68461–68469 RSC , https://pubs.rsc.org/en/content/articlehtml/2015/ra/c5ra13375k.
- N. Elamin, et al., J. Mater. Sci. Mater. Electron., 2021, 32, 2234–2248, DOI:10.1007/s10854-020-04988-y.
- P. M. Aneesh, K. A. Vanaja and M. K. Jayaraj, Nanophotonic Mater., 2007, 6639, 66390J Search PubMed , https://www.researchgate.net/publication/281543286_Synthesis_of_ZnO_nanoparticles_by_hydrothermal_method.
- A. K. Worku, et al., SN Appl. Sci., 2021, 3, 1–10, DOI:10.1007/s42452-021-04682-6.
- S. Naz, S. K. Durrani, M. Mehmood and M. Nadeem, J. Saudi Chem. Soc., 2016, 20, 585–593 CrossRef CAS.
- A. J. Slate, et al., Phys. Chem. Chem. Phys., 2001, 20 10.1039/C8CP02196A , https://www.craigbanksresearch.com.
- L. C. S. Figueiredo-Filho, et al., Analyst, 2013, 138, 6354–6364 RSC , https://pubs.rsc.org/en/content/articlehtml/2013/an/c3an00950e.
- JCPDS Card No. 36-1451, (n.d.).
- R. F. K. Gunnewiek, C. F. Mendes and R. H. G. A. Kiminami, Mater. Lett., 2014, 129, 54–56 CrossRef CAS.
- XRD patterns of the synthesized Cr2O3 (JCPDS Card 38-1479), (n.d.)..
- Z. Mousavi, F. Soofivand, M. Esmaeili-Zare, M. Salavati-Niasari and S. Bagheri, Sci. Rep., 2016, 61(6), 1–18 Search PubMed , https://www.nature.com/articles/srep20071.
- C. Battistoni, J. L. Dormann, D. Fiorani, E. Paparazzo and S. Viticoli, Solid State Commun., 1981, 39, 581–585 CrossRef CAS.
- R. Sadri, et al., J. Colloid Interface Sci., 2017, 504, 115–123 CrossRef CAS PubMed , https://pubmed.ncbi.nlm.nih.gov/28531649/.
- A. M. Abdel-Raoof, et al., J. Electrochem. Soc., 2019, 166, B948–B955, DOI:10.1149/2.0631912jes.
- D. A. C. Brownson, et al., J. Mater. Chem. A, 2013, 1, 5962–5972 RSC , https://pubs.rsc.org/en/content/articlehtml/2013/ta/c3ta10727b.
- J. Wang, Anal. Electrochem., 2002 DOI:10.1021/ed078p457.2.
- A. J. Bard and L. R. Faulkner, Electrochem. Methods Fundam. Appl., 2001, 156–225 Search PubMed , https://www.wiley.com/en-us/Electrochemical+Methods%3A+Fundamentals+and+Applications%2C+2nd+Edition-p-9780471043720.
- G. Denuault, M. V. Mirkin, A. J. Bard and J. Electroanal, Chem. Interfacial Electrochem., 1991, 308, 27–38 CrossRef CAS.
- Y. Vander Heyden, A. Nijhuis, J. Smeyers-Verbeke, B. G. M. Vandeginste and D. L. Massart, J. Pharm. Biomed. Anal., 2001, 24, 723–753 CrossRef CAS PubMed.
- F. P. Byrne, et al., Sustainable Chem. Processes, 2016, 41(4), 1–24, DOI:10.1186/s40508-016-0051-z.
- M. Tobiszewski, Anal. Methods, 2016, 8, 2993–2999 RSC , https://pubs.rsc.org/en/content/articlehtml/2016/ay/c6ay00478d.
Footnote |
| † Electronic supplementary information (ESI) available. See https://doi.org/10.1039/d2ra02685f |
| This journal is © The Royal Society of Chemistry 2022 |

