
 Open Access Article
 This Open Access Article is licensed under a Creative Commons Attribution-Non Commercial 3.0 Unported Licence
A comparative study of Cu-anchored 0D and 1D ZnO nanostructures for the reduction of organic pollutants in water
Hazim M. Alia,
Samia M. Ibrahimb,
Essam F. Abo Zeidc,
Ahmed F. Al-Hossainy b and
Mohamed Abd El-Aal*d
b and
Mohamed Abd El-Aal*d
aDepartment of Chemistry, College of Science, Jouf University, P.O. Box 2014, Sakaka, Aljouf, Saudi Arabia
bChemistry Department, Faculty of Science, New Valley University, El-Kharga, 72511, New Valley, Egypt
cPhysics Department, Faculty of Science, Assiut University, Assiut 71516, Egypt
dCatalysis and Surface Chemistry Lab, Chemistry Department, Faculty of Science, Assiut University, Assiut, 71516, Egypt. E-mail: dmdsa13@gmail.com; mohamedabdelaal@aun.edu.eg
First published on 6th June 2022
Abstract
In this work, Cu NPs were loaded at a fixed percentage (5 wt%) on 1D, (1D + 0D) and 0D ZnO nanostructures to investigate the effect of the support morphology on the reduction of organic pollutants in water. The synthesized materials were characterized by high-resolution transmission electron microscopy (HR-TEM), ultraviolet-visible spectroscopy (UV-Vis), Fourier transform infrared spectroscopy (FTIR), X-ray diffraction (XRD), N2 adsorption–desorption and X-ray photoelectron spectroscopy (XPS). The results reveal that the loading of Cu NPs decreases the optical band gap, and a slight change in the crystallite sizes increases the specific surface area value of the nanocomposites. The TEM images reveal that 1D ZnO has an average width of 44.7 nm and an average length of 211 nm, while 0D ZnO has an average diameter of 54.5 nm. The HR-TEM and XPS data confirm the loading of metallic Cu NPs on the surface of the ZnO nanostructures. The pure ZnO and nanocomposites were tested for 4-nitrophenol (4-NP) reduction in the presence of NaBH4 at room temperature. The obtained results show that pure ZnO nanostructures have no catalytic performance, while the nanocomposites showed good catalytic activities. The catalytic reduction efficiency of 4-NP was found to follow the order of Cu/0DZnO > Cu/(1D + 0D)ZnO > Cu/1DZnO. The complete reduction of 4-NP has been observed to be achievable within 60 s using the Cu/0DZnO nanocomposite, with a kapp value of 8.42 min−1 and good recyclability of up to five cycles. This nanocomposite was then applied in the reduction of organic dyes in water; it was found that the reduction rate constants for the methylene blue, Congo red, and acriflavine hydrochloride dyes were 1.4 min−1, 1.2 min−1, and 3.81 min−1, respectively. The high catalytic performance of this nanocomposite may be due to the small particle size, high specific surface area, and the high dispersion of Cu NPs on the surface of ZnO.
1 Introduction
Water pollution is mainly caused by the discharge of industrial effluents, which contain substantial amounts of heavy metal ions,1 nitro aromatic compounds, azo dyes, and hydrolysis products of pesticides and herbicides. Therefore, the elimination of toxic dyes and nitro aromatic compounds should get more attention. The removal of such materials from wastewater is very difficult due to their chemical and biological stability.2 Moreover, forgoing the utilization of these hazardous materials in human life is difficult because of their use in many important fields such as pharmaceuticals, textile dyes, paints, plastics, fungicidal agents, and industrial solvents. 4-Nitrophenol (4-NP) and organic dyes in industrial and agricultural wastewater are common organic contaminants, which are very toxic, carcinogenic, and mutagenic to human beings and aquatic organisms. The removal of organic pollutants from water is essential to protect aquatic ecosystems, protect the health of human beings, and solve the problem of water shortage. Thus, it is crucial to develop advanced technologies for the removal of these toxic materials from wastewater.Different approaches such as electrocatalytic reduction,3 membrane separation,4 photocatalytic degradation,5 ozone oxidation,6 adsorption7 and biological treatment8 have been successfully established for the effective removal of these hazardous compounds or converting them to less toxic species. However, some of these techniques have the following disadvantages: (1) some cannot destroy the pollutants but transfer them from one phase to another, (2) some can degrade the pollutants but they require expensive apparatus, and (3) some methods can also effectively decompose the pollutants; however, they use algae, fungi, bacteria, and yeasts, and these are toxic and carcinogenic to microorganisms. The catalytic reduction of these pollutants has been reported as an effective approach for wastewater treatment technology.9,10 It can effectively degrade pollutants with good stability and recyclability. However, a highly active catalyst is required for effective pollution reduction in the environment.
The use of noble and transition metal nanoparticles-based catalysts as a heterogeneous catalyst for the reductive degradation of organic contaminants is very promising.11–13 These catalysts have a high density of active catalytic sites due to their recyclability, chemical and physical toughness, and a large surface area. Copper nanoparticles (Cu NPs) exhibit high potential in the field of nanoscience and nanotechnology due to their inexpensive cost and novel physiochemical characteristics; thus, they are being used to replace noble metal NPs. Recently, Cu NPs have been considered as promising catalysts for the oxidation of alcohols,14 oxidation of CO,15 C–C bond formation reactions,16 C–heteroatom bond formation,17 and various coupling reactions.18,19 Unfortunately, thermodynamically unstable Cu NPs are prone to coalescence and agglomeration, resulting in a significant reduction in their catalytic activity. Immobilizing Cu NPs on specific supporting substrates, such as carbon materials,20 porous silica,21 polymers,22 metal oxides,23 and metal–organic frameworks,24 are the most effective approaches for overcoming this drawback. Catalyst supports serve a critical function in preventing nanoparticle agglomeration and offer a high surface area, which makes it easier to be recovered and reused.25 Consequently, this prevents the leaching of nanoparticles in the environment and minimizes the cost at the same time. Benefiting from the good loading capacity, geological abundance, ecofriendliness, easy synthesis, and remarkable structural stability, ZnO was widely utilized as a promising catalyst support. In this issue, Rasaki et al.26 synthesized Ag/ZnO nanorods catalyst, which showed the high catalytic reduction of 4-NP. A Ag/ZnO nanohybrid material was prepared by Oualid et al.27 using the sodium alginate method for the sonocatalytic reduction of 4-NP and antibacterial activity. The Ag@ZnO/MWCNT nanocomposite was investigated by García-Valdivieso et al.28 for 4-NP reduction. Behera et al.29 synthesized maghemite/ZnO nanocomposites for 4-NP reduction. The CuO/ZnO nanocomposite was synthesized in a green manner by the assistance of Melissa officinalis L. leaf extract and investigated for the reduction of 4-NP and Rhodamine B by Bordbar et al.30 Alamro et al.31 synthesized ZnO supported on carbon nanotubes for 4-NP reduction via the laser assistance method. The ZnO/CdO thin film for 4-NP catalytic degradation was investigated by Mostafa et al.32 Alula et al.33 prepared silver-coated ZnO/Fe3O4 composites for the reduction of 4-NP.
The physicochemical properties of ZnO supports such as effective charge separation, photovoltaic, electron trapping, photoluminescence, Lewis acid/base properties, defect formation, and strong metal–ZnO interactions have been reported to play important roles in catalytic reactions.34 Their morphologies and nanostructures have a great impact on these properties. The Cu–ZnO interactions influence the interface structure and stability, which contributes significantly to improve its catalytic properties, such as increasing the available active sites.35 As a result, studying the effect of the ZnO support shape and its role in the catalytic reduction reaction is of significant interest. However, the influence of the support morphology on the catalytic reduction of 4-NP and organic dyes over Cu NPs/ZnO has not been documented to our knowledge.
In this paper, the effect of the support morphology on the catalytic activity of Cu/ZnO nanocomposites for the reduction of 4-NP was studied. The pure ZnO and Cu/ZnO nanocomposites were characterized via transmission electron microscopy (TEM), UV-Vis spectroscopy, Fourier transform infrared (FTIR) spectroscopy, X-ray diffraction (XRD), surface area, and X-ray photoelectron spectroscopy (XPS). The relationships between the catalytic performance of the nanocomposites with their surface area and their physicochemical properties were determined. The results revealed that the nanocomposite that contains 0D ZnO support showed the highest catalytic performance for the reduction of 4-NP. Moreover, this nanocomposite was applied for the reduction of organic dyes such as methylene blue, Congo red, and acriflavine hydrochloride.
2 Materials and methods
2.1. Chemicals
All materials were of analytical grade and used without any further purification. All solutions were prepared using double-distilled water. Zinc acetate dihydrate (Zn (CH3COO)2·2H2O, assay: 99.5%), sodium hydroxide (NaOH, assay: 99%), potassium hydroxide (KOH, assay: 99%), and L-ascorbic acid (assay: 98%) were purchased from Alpha Chemika. Copper nitrate Cu (NO3)2·3H2O (assay: 98%, Laboratory Chemicals) and 4-nitrophenol (assay: 98%) was supplied by Research-Lab Fine Chem Industries (India), sodium borohydride NaBH4 (assay: 98%) was purchased from SDFCL, while absolute ethanol (ADWIC), methylene blue (MB), Congo red (CR), and acriflavine hydrochloride (ACF) dyes were bought from Sigma-Aldrich (Germany). The chemical structures of 4-NP, MB, CR, and ACF are depicted in Fig. 1.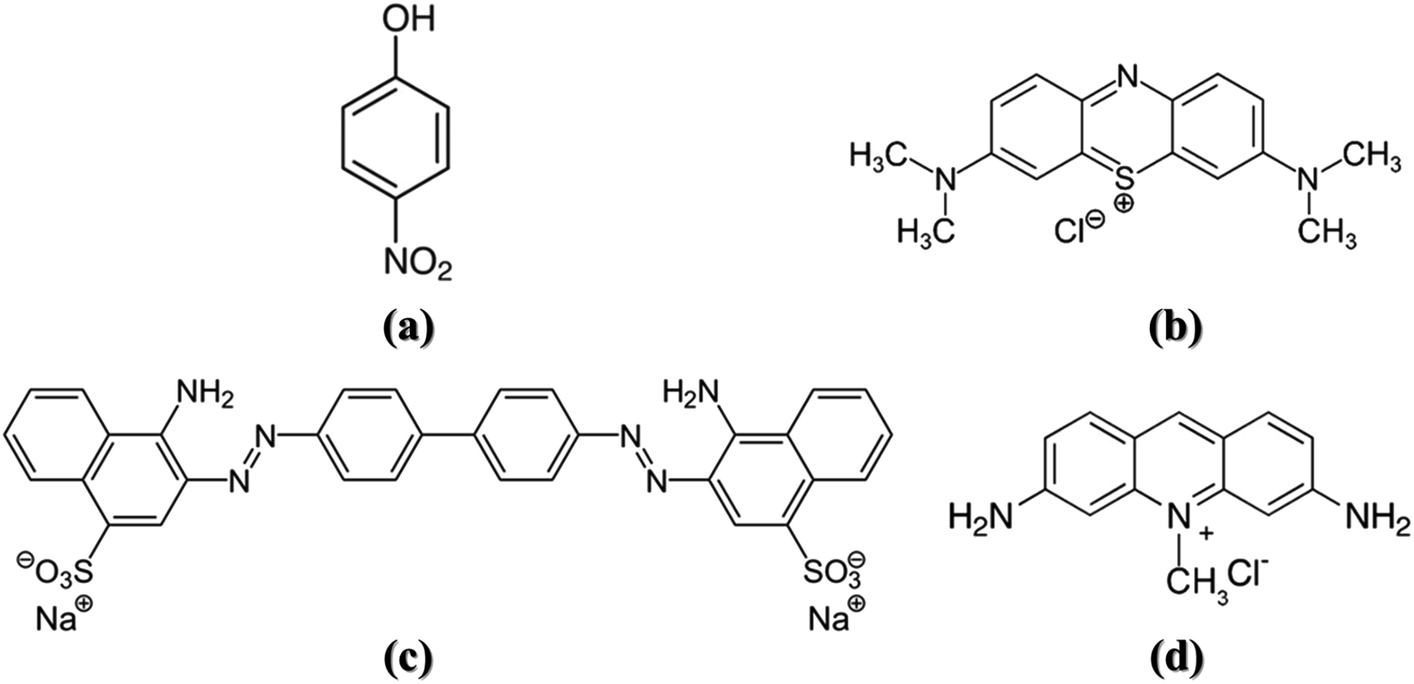 | ||
| Fig. 1 The chemical structures of (a) 4-nitrophenol, (b) methylene blue, (c), Congo red, and (d) acriflavine hydrochloride. | ||
2.2. Synthesis of ZnO nanoparticles (NPs)
![[thin space (1/6-em)]](https://www.rsc.org/images/entities/char_2009.gif) :1 V/V). Solution (B) was added dropwise to solution (A) with vigorous stirring for 2.25 h at 60 °C. The resulting precipitate was filtered off and thoroughly washed with double-distilled water and ethanol once the solution had cooled to room temperature. The precipitate was then dried overnight at 80 °C and calcinated for 1 h in a static air atmosphere at 500 °C.
:1 V/V). Solution (B) was added dropwise to solution (A) with vigorous stirring for 2.25 h at 60 °C. The resulting precipitate was filtered off and thoroughly washed with double-distilled water and ethanol once the solution had cooled to room temperature. The precipitate was then dried overnight at 80 °C and calcinated for 1 h in a static air atmosphere at 500 °C.2.3. Synthesis of the Cu/ZnO nanocomposite
A calculated amount of Cu(NO3)2·3H2O corresponding to the theoretical yield of ZnO NPs, 5% (w/w), was respectively dissolved in 100 mL double-distilled water with stirring at room temperature. An amount of ZnO NPs powder was dispersed in copper nitrate solution (pH = 3.3) with sonication for 15 min. The solution pH was changed to 8.52 after the complete dispersion of ZnO NPs, which indicates the formation of Cu(OH)2.39 After that, about 50 mL L-ascorbic acid solution ([L-ascorbic acid] = 5[Cu(NO3)2·3H2O]) was added dropwise into the above mixture with continuous stirring at 90 °C for 2.5 h. The pH of the mixture was changed to 5.54 after the complete addition of the L-ascorbic acid solution, which confirmed the transformation of Cu(OH)2 to Cu NPs through the formation of Cu2O as an intermediate.39 The precipitate was filtered out and rinsed with ethanol and double-distilled water multiple times when the solution cooled to room temperature. Finally, the precipitate was dried for 5 h at 80 °C. The formation of Cu NPs on the surface of ZnO support is expected to follow these steps. Cu2+ ions were first converted to Cu(OH)2, which was subsequently reduced to Cu2O by L-ascorbic acid. Finally, Cu2O was converted to Cu particles. The reduction process can be represented as follows.39| 2Cu(OH)2 + C6H8O6 → Cu2O + C6H6O6 + H2O | (1) |
| Cu2O + C6H8O6 → 2Cu + C6H6O6 + H2O | (2) |
2.4. Characterization techniques
The morphologies of the pure ZnO nanostructures and the Cu/ZnO nanocomposites were determined by transmission electron microscopy (TEM, JSM-2100 JEOL, Japan) operated at an acceleration voltage of 200 kV.The optical properties of the Cu/ZnO nanocomposites were checked by recording the UV-Vis spectra of the aqueous suspension of each sample using a SHIMADZU UV-3101 UV-Vis-NIR spectrometer at room temperature.
The surface functionality and presence of organic impurities was estimated via FTIR spectroscopy (Nicolet spectrophotometer, model 6700) using the KBr pellet technique in the 400–4000 cm−1 range.
The phase and crystal structure of Cu/ZnO nanocomposite were investigated using X-ray diffraction technique (XRD, Philips diffractometer, model PW 2103/00) equipped with a Ni-filtered Cu Kα radiation (λ = 1.5408 Å). The samples were scanned over 4–80° of the 2θ range at a scan rate of 3° min−1.
The surface area and texture of the catalysts were determined via N2 adsorption at −196 °C using a Nova 3200 gas adsorption apparatus (Quantachrom Instrument Corporation, USA). The Brunauer–Emmett–Teller (BET) theory was used to calculate the surface area.
X-ray photoelectron spectroscopy (XPS) measurements were obtained on a K-ALPHA instrument (Thermo Fisher Scientific, USA) with monochromatic X-ray Al K-alpha radiation in the range from −10 to 1350 eV with a spot size of 400 μm at a pressure of 10−9 mbar with a full spectrum pass energy of 200 eV and at narrow spectrum of 50 eV.
2.5. Catalytic reduction of 4-NP
The reduction of 4-NP to 4-aminophenol (4-AP) as a model reaction in the presence of excess NaBH4 was used to investigate the catalytic characteristics of the Cu/ZnO nanocomposites. Briefly, about 0.3783 g NaBH4 was dissolved in 100 mL double-distilled water in 250 mL beaker; then 1 mL 4-NP (1 × 10⁻² M) solution was added, and then the solution mixture changed from colorless to intense yellow.40 UV-Vis spectroscopy in the wavelength range of 200–600 nm was used to monitor the reaction progress using a small amount of the reaction mixture after a certain time interval. In the reaction process, the catalytic conversion efficiency of 4-NP to 4-AP could be calculated using the formula.
 | (3) |
3 Results and discussion
3.1. Characterization of Cu/ZnO nanocomposites
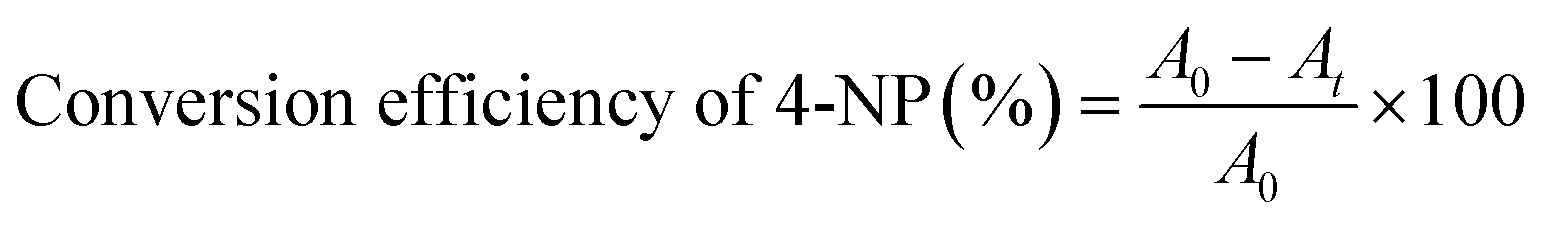
The morphologies of pure ZnO nanostructures and Cu/ZnO nanocomposites were observed by TEM. As shown in Fig. 2a of 1D ZnO, the sample has rod-like particles with an average width of 44.7 nm and an average length of 211 nm. Fig. 2b shows the micrograph of (1D + 0D) ZnO; the polydispersed nanostructure contains rod particles with an average width and length of 38.1 nm and 149.5 nm, respectively. Semi-spherical particle with an average diameter of 54.5 nm were observed from Fig. 2c of 0D ZnO. Also, the same morphology of semi-spherical particles of the Cu/0DZnO nanocomposite was obtained (Fig. 2d). The HR-TEM image of the Cu/0DZnO nanocomposite (Fig. 2e) showed a lattice spacing of 0.26 nm and 0.21 nm corresponding to the d-spacing of ZnO (002)41 and Cu (111),42 respectively. EDX mapping analysis was used to study the elemental distribution of Cu, Zn, and O in the Cu/0D nanocomposite (Fig. 3a–e). It can be observed that the Cu NPs was successfully loaded and uniformly distributed on the surface of the ZnO support.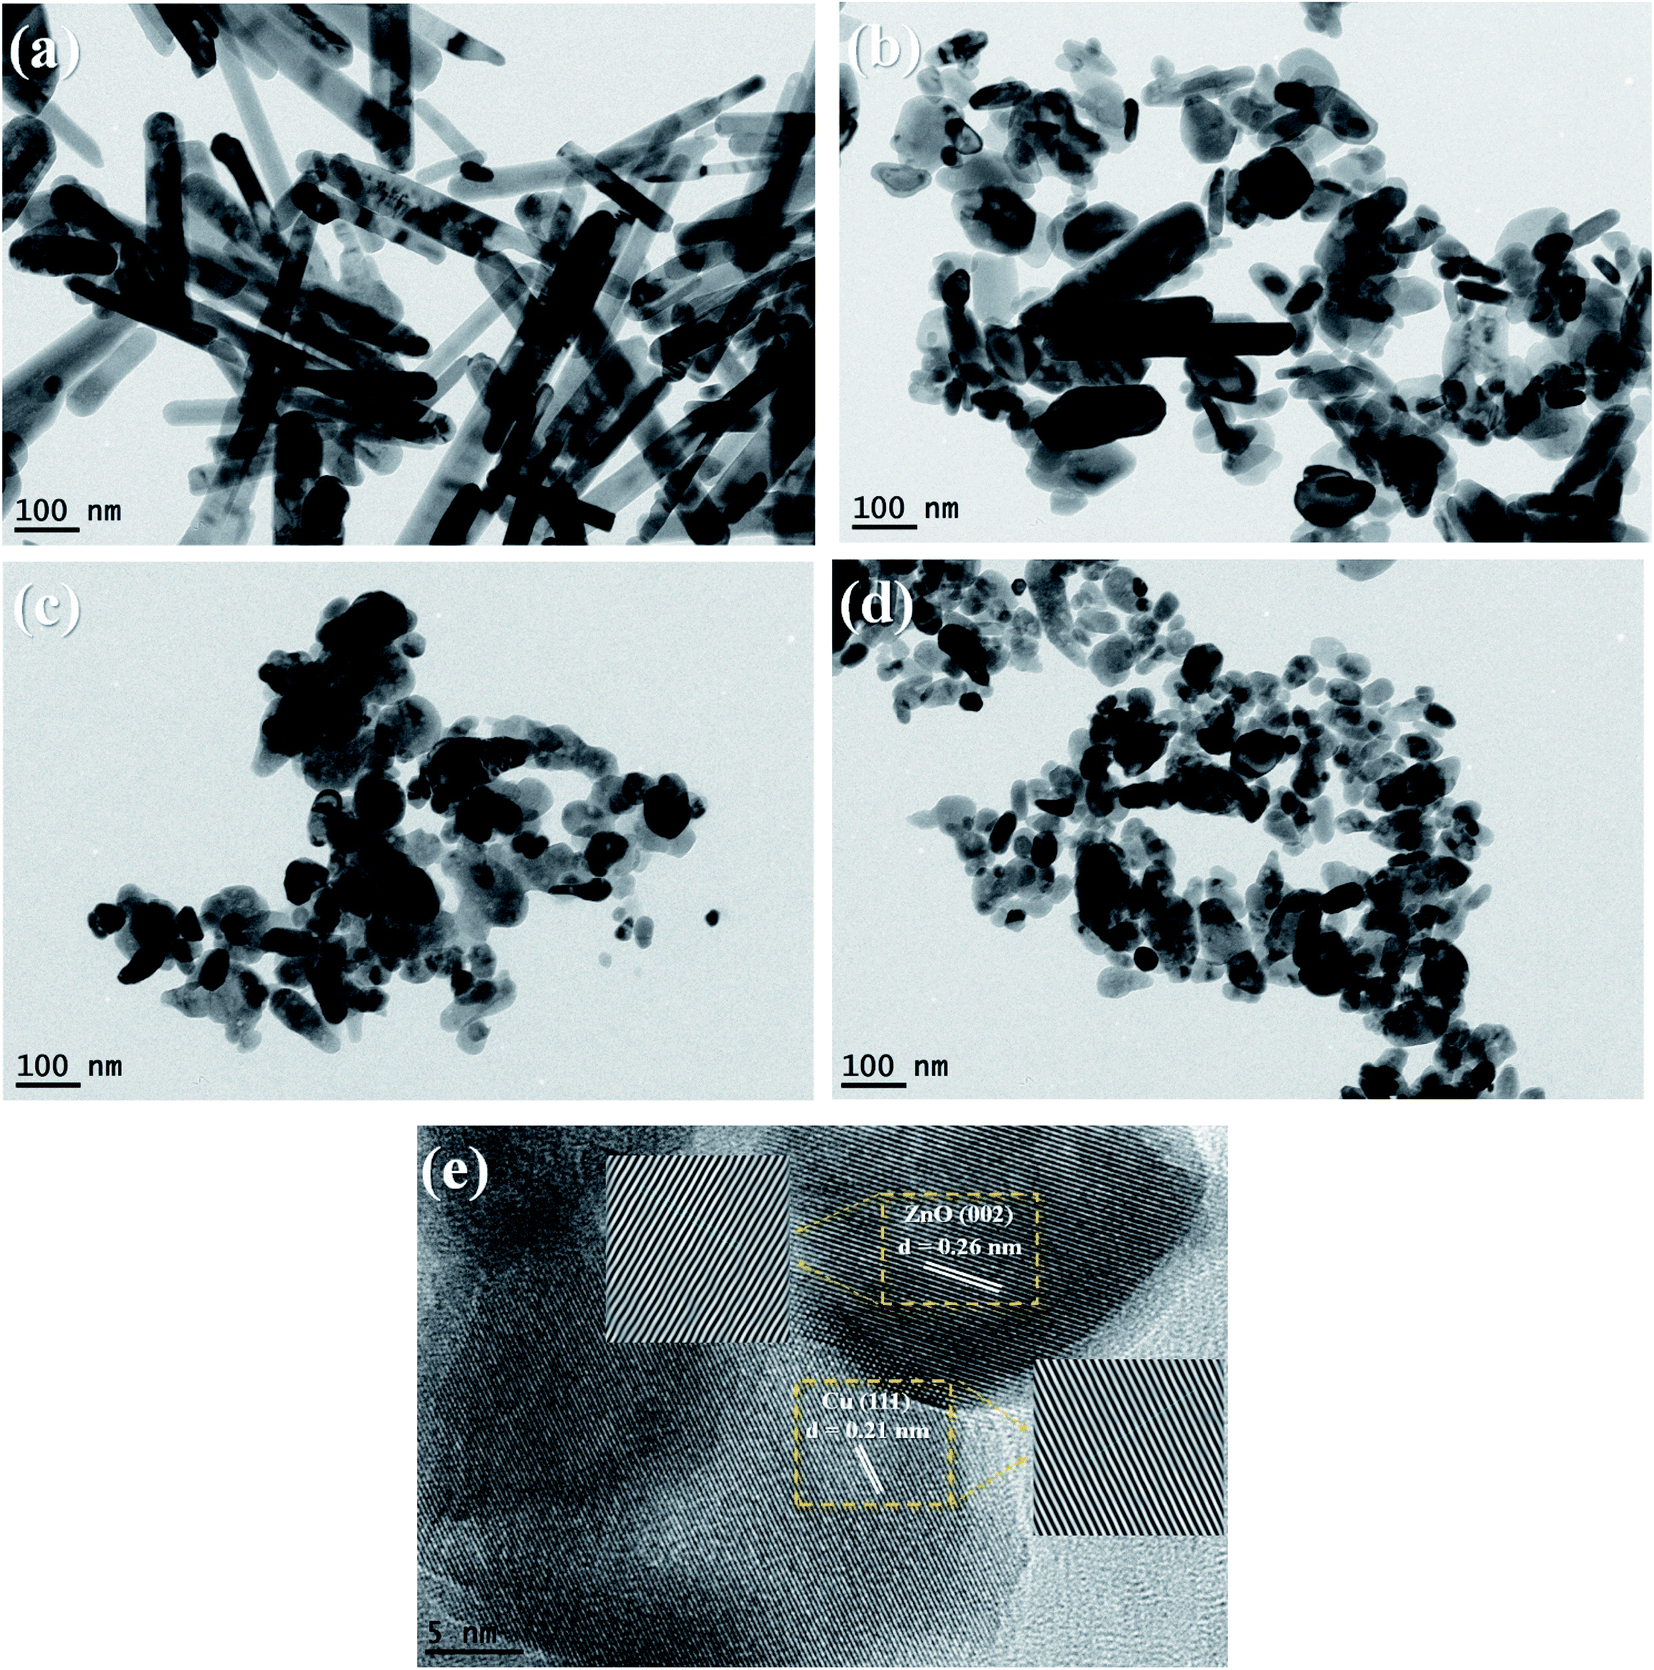 | ||
| Fig. 2 TEM images of (a) 1D ZnO, (b) (1D + 0D) ZnO, (c) 0D ZnO, (d) the Cu/0DZnO nanocomposite, and (e) the HR-TEM image of the Cu/0D ZnO nanocomposite. | ||
 | ||
| Fig. 3 EDX mapping images of the Cu/0DZnO nanocomposite. | ||
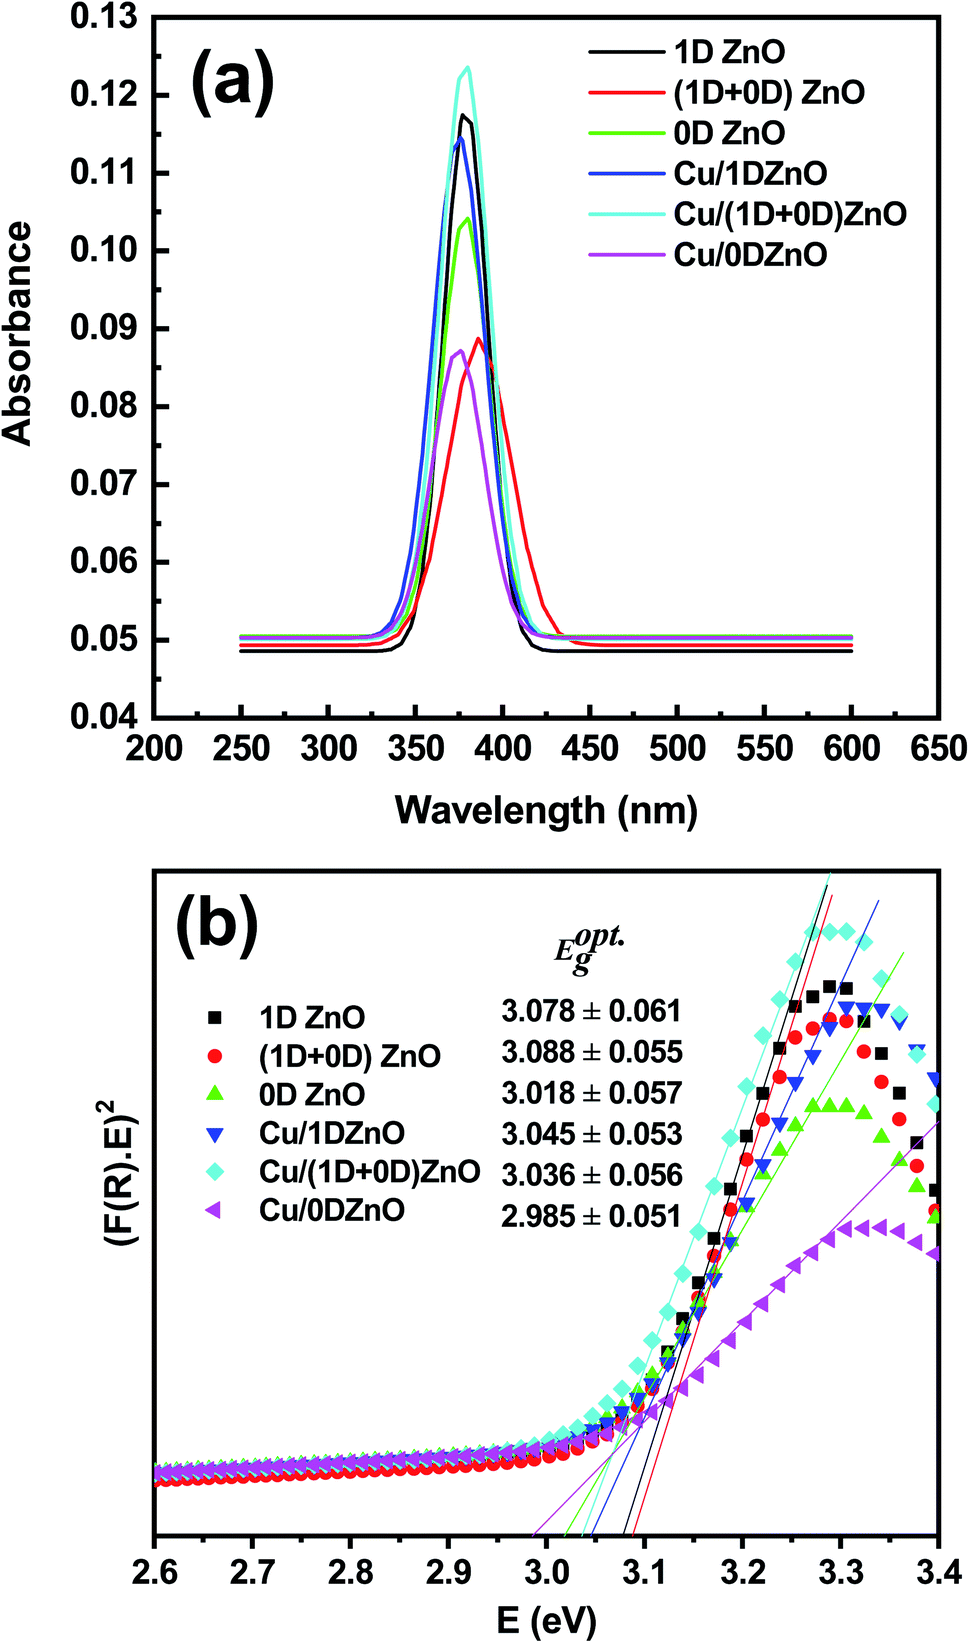
As shown in Fig. 4, as a nondestructive tool, diffused reflectance spectroscopy (DRS) was utilized to characterize the optical parameters of ZnO nanostructures and Cu/ZnO nanocomposites with infinite thickness. By utilizing the Kubelka–Munk model, the prepared nanocomposites' photocatalyst band gap was evaluated from the DRS data. From the curve between (F(R)E)2 and E, the optical band gap is estimated according to Kubelka–Munk and Tauc's equations.43,44 The optical band gap was estimated from the x-axis at the intercept with an extended straight line. The calculated values of the optical band gaps for 1D, (1D + 0D), 0D ZnO, Cu/1D, (1D + 0D), and 0D ZnO were found to be 3.078 ± 0.061 eV, 3.088 ± 0.055 eV, 3.018 ± 0.057 eV, 3.045 ± 0.053 eV, 3.036 ± 0.056 eV, and 2.985 ± 0.051 eV, respectively. It was noted that the loading of Cu NPs on ZnO nanostructures leads to a decrease in the optical band gap of the nanocomposite, which results in absorption edge redshift. The decrease in the optical band gap energy could be attributed to high density oxygen vacancies and syndromes corresponding to the difference in the ionic radius and electronegativity between the Cu and ZnO ions because of the substitution procedure of Zn2+ by Cu2+ in the matrix. E. Gurger et al. have evaluated the optical band gap of ZnO to be 3.24 eV and by introducing Ag and Cu impurity atoms in the nanocomposite, the band gap narrowed to 3.18 eV and 3.12 eV for ZnO–Cu and ZnO–Ag, respectively.45 Chakraborty et al.46 found that copper doping decreases the electron–hole recombination, and the optical band gap value was reduced from 3.21 eV (ZnO) to 3.07 eV (Zn0.9Cu0.1O); these values are similar to our results. In addition, these impurities created a special imperfection, which seems to raise the Fermi level toward the conduction band.47,48 The light absorption in the semiconductor nanocomposites results in the transportation of the valence band electrons to a particular state through the conduction band to provide electron in the conduction band and hole in the valence band. If the size of the nanoparticle is equal to the de Broglie wavelength, then the conduction band is regarded as a quantum cavity of the electrons. According to the obtained results, we can conclude that the optical band gap of the prepared semiconductor nanocomposites could be affected by its morphological changes, and demonstrated a prospective agent for photovoltaics and other optical applications.
 | ||
| Fig. 4 (a) UV-vis diffuse reflectance spectra of the ZnO nanostructures and Cu/ZnO nanocomposites, and (b) the determination of their band gap. | ||
FTIR studies were performed to ascertain the purity and nature of the functional groups available on the Cu/ZnO nanocomposites. The FTIR spectra of the ZnO nanostructures and Cu/ZnO nanocomposites are depicted in Fig. 5. The pristine 1D and (1D + 0D) ZnO nanostructures exhibited almost the same bands. They showed bands for functional groups located at 3412 cm−1, 2922 cm−1, 2852 cm−1, 2359 cm−1, 2341 cm−1, 1561 cm−1, 1383 cm−1, 871 cm−1, and 421 cm−1. The band located at 3412 cm−1 is assigned to the stretching vibration of the OH groups, which resulted from water molecules adsorbing on the ZnO surface. The asymmetric and symmetric (C–H) vibration modes of acetate CH2 groups were detected at 2922 cm−1 and 2852 cm−1.49 The vibration bands at 2359 cm−1 and 2341 cm−1 are assigned to atmospheric CO2.50 The bands ranging from 1561 cm−1 to 1383 cm−1 are attributed to the symmetric and asymmetric stretching vibration of the C![[double bond, length as m-dash]](https://www.rsc.org/images/entities/char_e001.gif) O group,51 which may be due to zinc acetate used in the reaction. The bands detected at 871 cm−1 and 421 cm−1 are attributed to the stretching vibrational mode of the metal–oxygen bond (Zn–O).52 In addition to the bands showed by 1D and (1D + 0D) ZnO, 0D ZnO exhibited three signals at 1775 cm−1, 1436 cm−1, and 880 cm−1, which could be because of the adsorbed carbonate moieties,53 the in-plane bending vibrations of the methyl group (CH3),54 and the metal–oxygen bond (Zn–O) stretching vibrational mode,52 respectively. The differences in the bands positions and intensities for the acetate group may be due to the different amounts of acetate adsorbed on the ZnO surface. The FTIR spectra of Cu/ZnO nanocomposites showed that some bands are similar to pristine ZnO, while some new bands emerged. These new bands were detected at 1605 cm−1, 1427 cm−1, 1350 cm−1, 1160 cm−1, 1076 cm−1, and 1043 cm−1, which might be attributed to the presence of L-ascorbic acid55 since the reaction occurs under an excess of it. It was also noted that the band intensity of the hydroxyl group in the nanocomposite is sharper than that of pure ZnO.
O group,51 which may be due to zinc acetate used in the reaction. The bands detected at 871 cm−1 and 421 cm−1 are attributed to the stretching vibrational mode of the metal–oxygen bond (Zn–O).52 In addition to the bands showed by 1D and (1D + 0D) ZnO, 0D ZnO exhibited three signals at 1775 cm−1, 1436 cm−1, and 880 cm−1, which could be because of the adsorbed carbonate moieties,53 the in-plane bending vibrations of the methyl group (CH3),54 and the metal–oxygen bond (Zn–O) stretching vibrational mode,52 respectively. The differences in the bands positions and intensities for the acetate group may be due to the different amounts of acetate adsorbed on the ZnO surface. The FTIR spectra of Cu/ZnO nanocomposites showed that some bands are similar to pristine ZnO, while some new bands emerged. These new bands were detected at 1605 cm−1, 1427 cm−1, 1350 cm−1, 1160 cm−1, 1076 cm−1, and 1043 cm−1, which might be attributed to the presence of L-ascorbic acid55 since the reaction occurs under an excess of it. It was also noted that the band intensity of the hydroxyl group in the nanocomposite is sharper than that of pure ZnO.
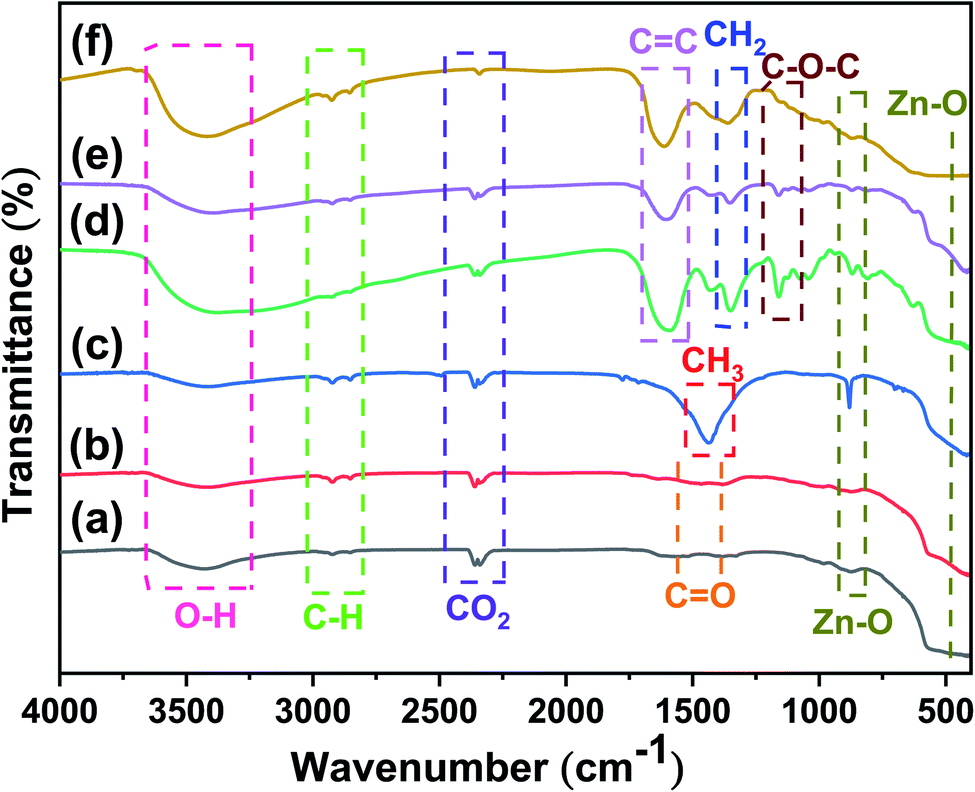 | ||
| Fig. 5 FTIR spectra of (a) 1D ZnO, (b) (1D + 0D) ZnO, (c) 0D ZnO, (d) Cu/1DZnO, (e) Cu/(1D + 0D)ZnO, and (f) Cu/0DZnO. | ||
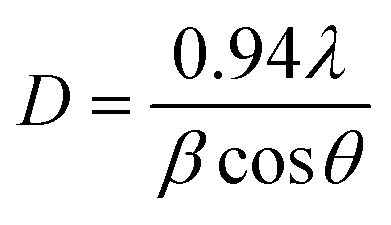
The XRD patterns of the ZnO nanostructures and Cu/ZnO nanocomposites are shown in Fig. 6. The clear, intense diffraction peaks indicate the extremely crystalline quality of the grown nanoparticles. After the analysis of positions and comparative intensities of the diffracted peaks, the occurrence of single-phase hexagonal wurtzite of ZnO with space group P63mc was established.56 The XRD patterns of the ZnO nanostructures were similar, except for the variation in line broadening due to the change in the morphologies. The pristine ZnO nanostructures exhibit well-defined XRD peaks at 2θ = 31.8°, 34.5°, 36.3°, 47.6°, 56.7°, 62.9°, 66.5°, 68°, 69.2°, 72.6°, and 77°, which are corresponding to the (100), (002), (101), (102), (110), (103), (200), (112), (201), (004), and (202) crystal planes, respectively. All the diffraction peak positions and their corresponding crystal planes are described by the standard spectrum (JCPSD card no. 01-089-0511).57 In addition, no additional reflections can be detected related to the other impurities, indicating the high purity of the produced ZnO. On the other hand, the XRD patterns of Cu/ZnO nanocomposites showed typical reflections of the pristine ZnO nanostructures. Moreover, a new reflection was noticed at 2θ = 42.7° (for Cu/1D and 0D ZnO) and 42.2° (for Cu/(1D + 0D) ZnO), which corresponded to (111), the preferred oriented plane of the FCC structure of Cu NPs, and no obvious reflections arising from possible impurity phases such as CuO and Cu2O were detected. The Scherrer equation was used to determine the average crystallite size of the ZnO nanostructures.
 | (4) |
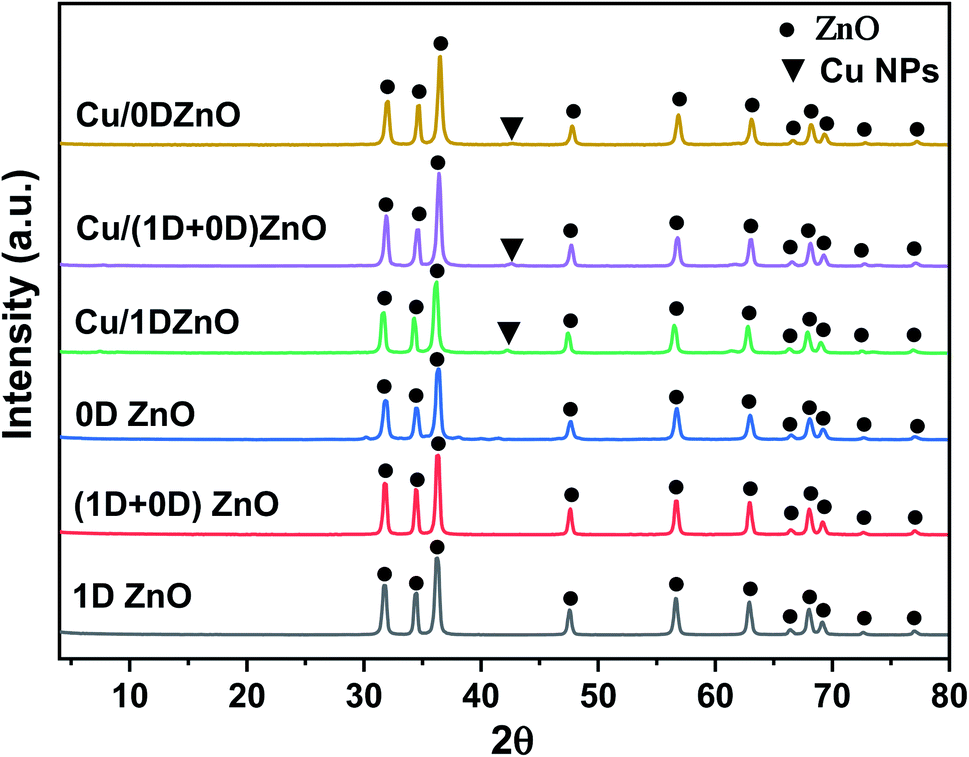 | ||
| Fig. 6 XRD diffraction patterns of the ZnO nanostructures and Cu/ZnO nanocomposites. | ||
To establish the level of defects within the matrix crystal, the dislocation density (δ) was estimated from the following equation.
 | (5) |
Corresponding to interior lattice straining and Williamson–Hall equations,30 the micro-diffraction (ε) in the crystal nanostructure and the crystallite size were evaluated from XRD by:
 | (6) |
 | (7) |
cosθ vs. 4sinθ for estimating the gradient and intercept.
From the results of Table 1, we can note that the average crystallite size of the (1D + 0D) ZnO sample is larger than both that of 1D ZnO and 0D ZnO, respectively, as pure nanostructures. Although the amount of copper added to the zinc oxide samples of different shapes is a fixed percentage of 5%, we note that the difference in size is not significant, i.e., 22.90 nm, 22.95 nm, and 22.00 nm, respectively. Therefore, the decrease in the crystallite size after adding Cu NPs to zinc oxide is attributed to the difference in the radius between the added copper atom and the host zinc atoms. The incompatibility in the volumes of zinc and copper atoms led to a strain caused by non-uniform lattice deformation and dislocation in the crystal phase, which appeared in the broadening of the peak in the nanocomposite. In the case of 1D ZnO, adding copper to its crystals increases the micro-strain of the crystal because the nature of stacking the atoms in the form of rods decreases the interatomic distances during the stacking process, which makes the copper atoms substitute in the crystal sparsely. For (1D + 0D) zinc oxide crystals of larger size, adding copper decreases the micro-strain of the lattice crystal, which might be due to the nature of the mixed particles and how the atoms are packed. The increase in the inside crystal lattice strain of zinc oxide's spherical shape might be due to the presence of rather large interspaces within the spherical crystal nanostructure.
| Samples | Average crystallite size D (nm) | SBET (m2 g−1) | |||
|---|---|---|---|---|---|
| Scherrer's equation (D) | Williamson–Hall equation | Dislocation density (δ) × 10−4 (lines nm−2) | |||
| (D) | Microstrain (ε) × 10−4 | ||||
| 1D ZnO | 22.50 | 19.60 | −5.95789 | 19.75 | 10.1 |
| (1D + 0D) ZnO | 24.42 | 22.73 | −2.74854 | 16.77 | 29.0 |
| 0D ZnO | 19.95 | 18.12 | −4.65576 | 25.12 | 23.9 |
| Cu/1DZnO | 22.90 | 21.52 | −2.32384 | 19.07 | 17.2 |
| Cu/(1D + 0D)ZnO | 22.95 | 21.87 | −7.14024 | 18.98 | 35.5 |
| Cu/0DZnO | 22.00 | 22.14 | 0.534299 | 20.66 | 36.1 |
The N2 adsorption–desorption isotherms (not shown) of ZnO nanostructures and Cu/ZnO nanocomposites, as obtained from Brunauer–Emmett–Teller (BET) analysis, are type II, according to the IUPAC classification. The calculated specific areas of all the catalysts are cited in Table 2. The SBET of 1D ZnO, (1D + 0D) ZnO, 0D ZnO, Cu/1DZnO, Cu/(1D + 0D)ZnO, and Cu/0DZnO was about 10.1, 29.0, 23.9, 17.2, 35.5, and 36.1 m2 g−1, respectively. It is well known that the SBET increases with decreasing particle size and increases if the particles are multi-particle agglomerates or have a rough surface structure.58 Among the prepared samples, 1D ZnO has a larger particle size (Fig. 2a) than that of the other samples, and thus, it has the smallest SBET value. Although (1D + 0D) ZnO has a particle size larger than that of 0D ZnO, it has a higher SBET value because it has multi-particle agglomerates (Fig. 2b). It was observed that the addition of Cu NPs to ZnO materials enhances their specific surface area due to the doping effect and the formation of new pores due to effective Cu species diffusion in the ZnO support.59 The observed increase in the surface area would be helpful for improving the catalytic activity of the nanocomposite catalyst.
| Catalyst | k (× 10−3 s−1) | TOF (× 10−6 mmol mgCu−1 s−1) | Ref. |
|---|---|---|---|
| Cu NPs | 1.59 | 0.08 | 64 |
| Cu/polymers | 2.10 | 2.82 | 65 |
| Hierarchical Cu microspheroids | 4.65 | 0.33 | 66 |
| Porous Cu microspheres | 5.26 | 9.26 | 67 |
| Cu nanopolyhedrons | 5.70 | 6.48 | 68 |
| Hollow porous Cu NPs | 9.30 | 12.8 | 69 |
| Cu nanoplates | 9.50 | 31.7 | 70 |
| Cu nanocubes | 10.1 | 11.1 | 68 |
| Cu NPs-aggregated cages | 10.4 | 34.7 | 71 |
| Cu/carbon | 13.0 | 3.05 | 72 |
| Cu/rGO | 17.3 | 104.4 | 73 |
| Cu/carbon | 24.0 | 3.51 | 74 |
| Cu/rGO | 23.2 | 298.7 | 63 |
| Cu/0DZnO | 140.4 | 300 | This work |
The chemical states and surface compositions of the Cu/0DZnO nanocomposite were examined using XPS, and the results are shown in Fig. 7. The full survey spectrum in Fig. 7a indicates the presence of Zn, Cu, O, and C. The high-resolution spectrum for the Zn 2p region (Fig. 7b) shows two peaks at binding energies of 1044.8 eV and 1021.9 eV assigned to Zn 2p1/2 and Zn 2p3/2, respectively. The two peaks are separated by a spin-energy of 23 eV, indicating the existence of Zn in the +2 oxidation state.60 The narrow spectrum of Cu 2p reveals two main binding energy peaks at 952.1 eV and 932.2 eV, which correspond to the 2p1/2 and 2p3/2 spin system of zerovalent Cu, respectively.42 Moreover, two peaks at binding energies of 944.7 eV and 934 eV as characteristics of Cu2+ were also detected, which indicates the formation of CuO during the synthesis of Cu NPs.61 Fig. 7d displays the O 1s spectrum, which was divided into two peaks with binding energies of 531.5 eV and 530.5 eV indexed to chemisorbed oxygen species and lattice oxygen in ZnO, respectively.62
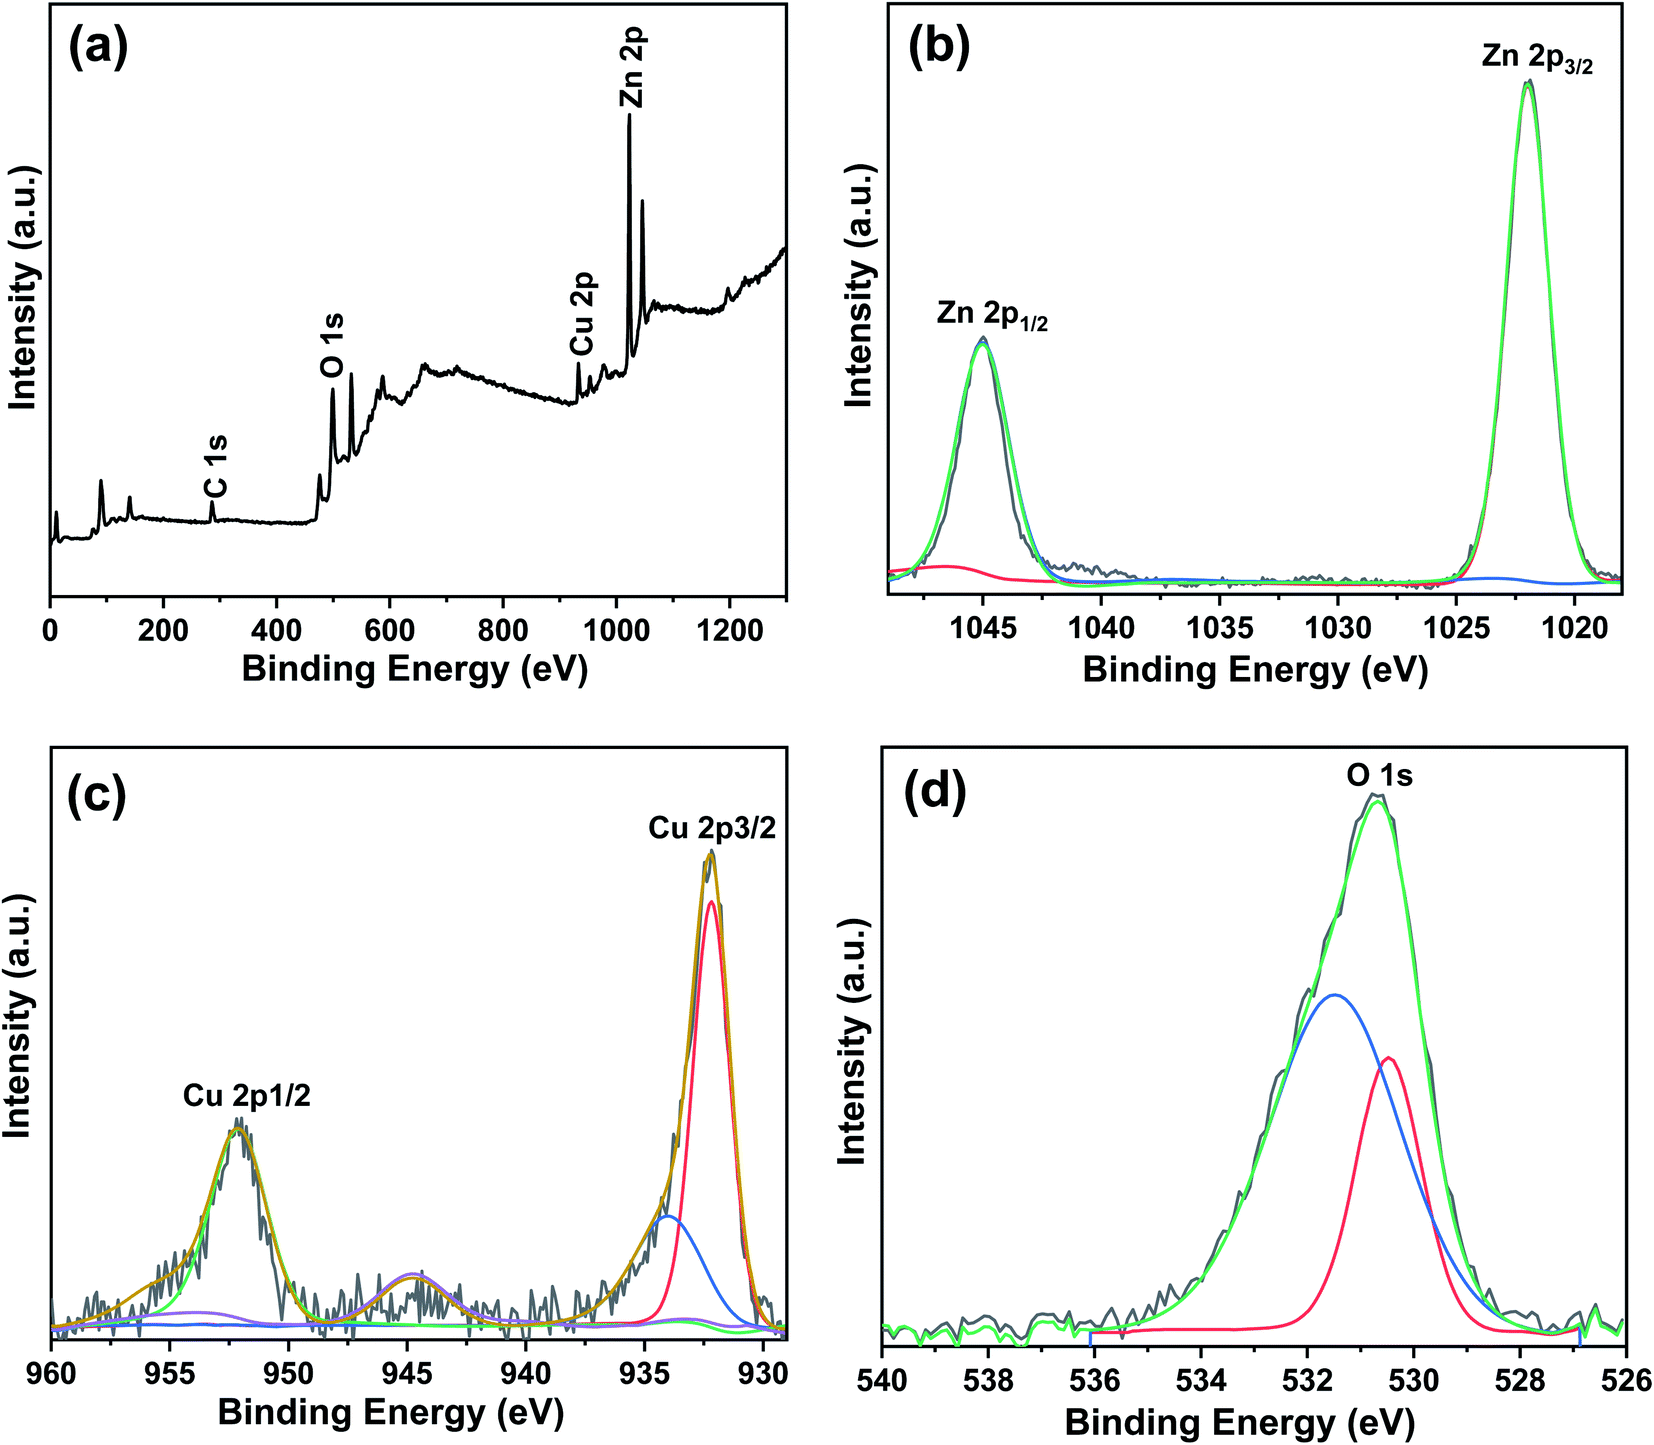 | ||
| Fig. 7 XPS spectra of the Cu/0DZnO nanocomposite: (a) full survey spectrum, (b) Zn 2p spectrum, (c) Cu 2p spectrum, and (d) O 1s spectrum. | ||
3.2. Catalytic performance of Cu NPs/ZnO nanocomposites
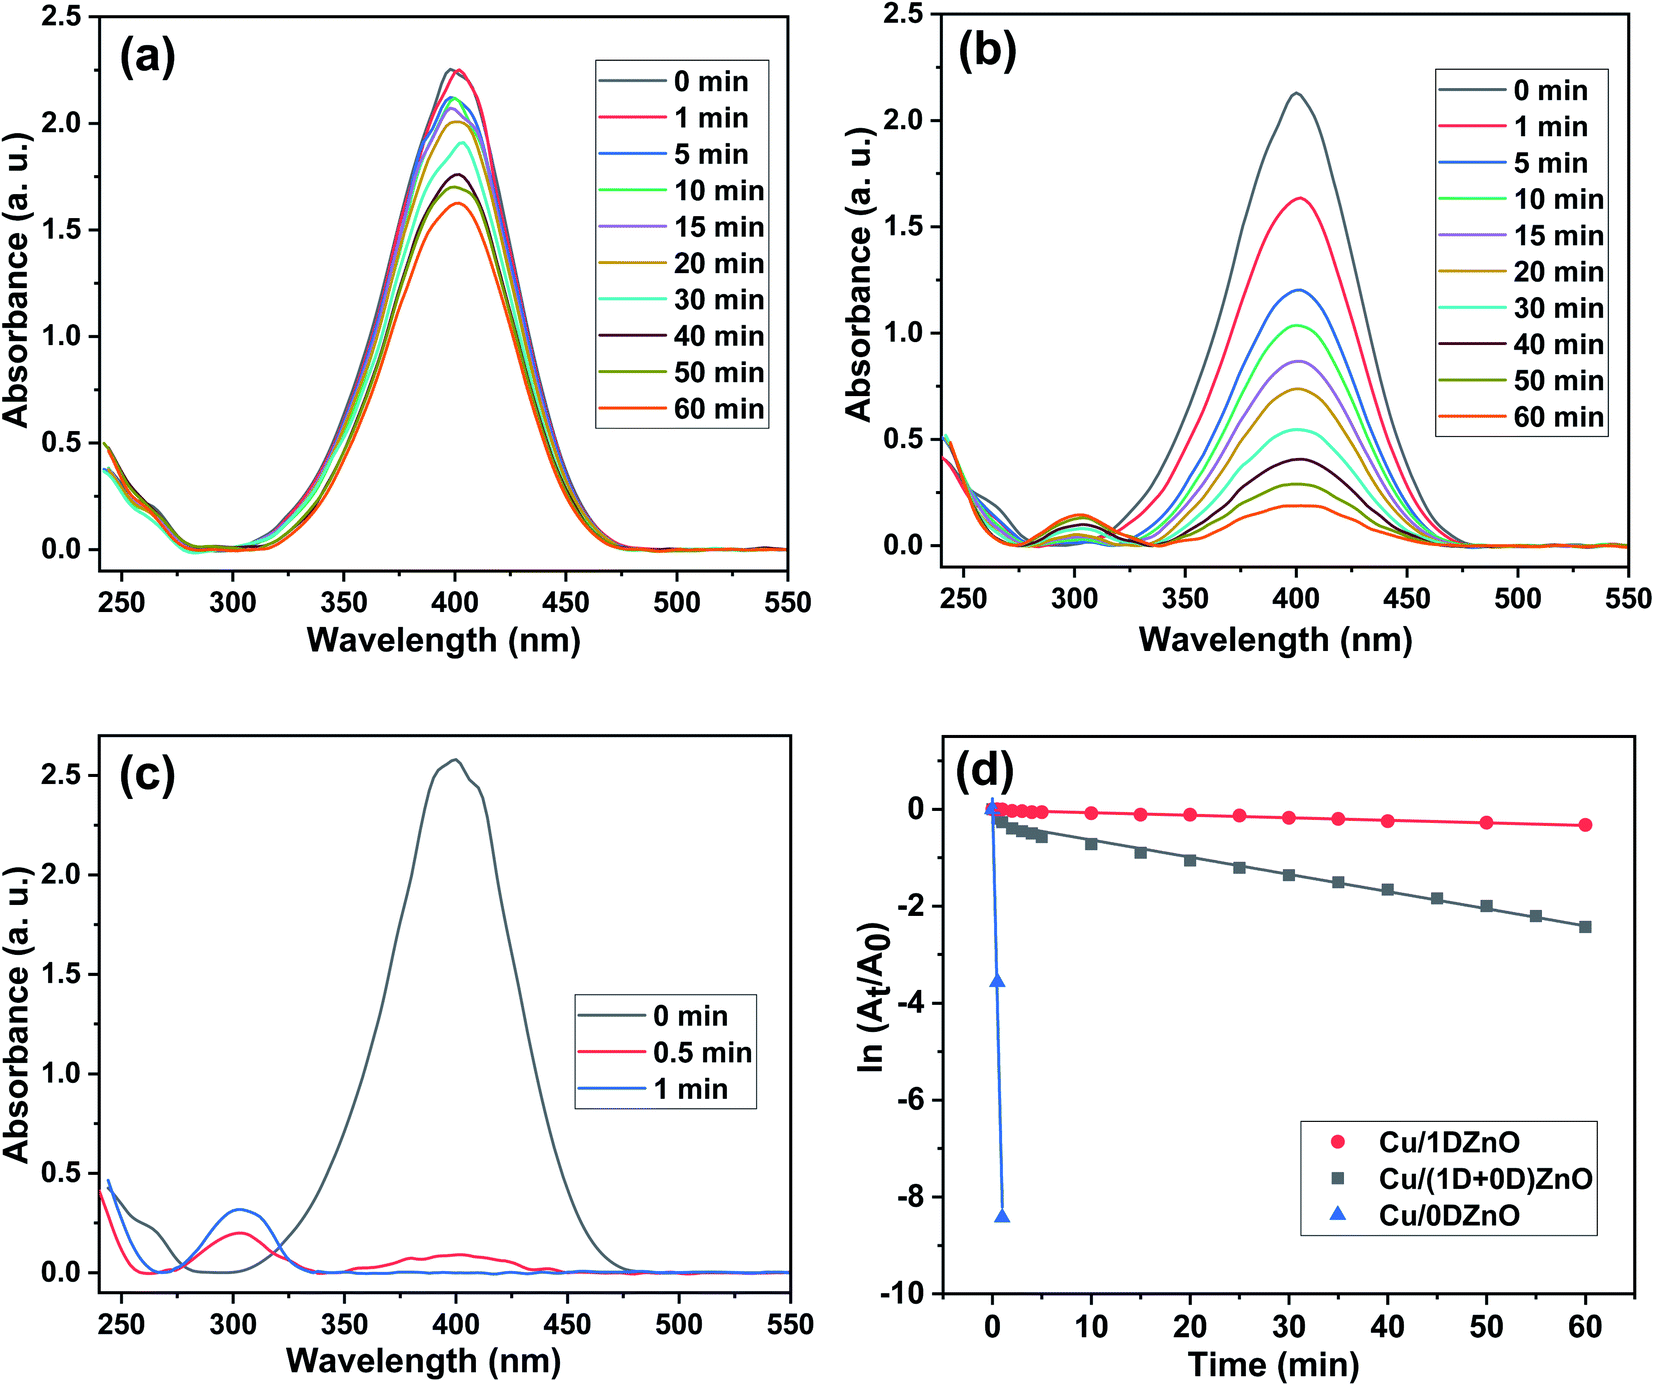 | ||
| Fig. 8 UV-Vis spectra of the reduction of 4-NP using (a) the Cu NPs/1DZnO nanocomposite as a catalyst, (b) Cu NPs/(1D + 0D)ZnO nanocomposite as a catalyst and (c) Cu NPs/0DZnO nanocomposite as a catalyst, and (d) plots of ln(At/A0) versus reaction time in the presence of the Cu/ZnO nanocomposites as catalysts. | ||
Because the concentration of NaBH4 is substantially higher than that of 4-NP, the reaction is thought to follow pseudo first order kinetics, as shown by the equation
 | (8) |
 | (9) |
Based on the previous investigations,75,76 the catalytic reduction of 4-NP over Cu/0DZnO nanocomposite is an electron transfer process and proceeded via two steps. The BH4− ions were first diffused from the solution to the surface of the Cu NPs, forming a Cu-hydride complex via π–π stacking interactions. Meanwhile, 4-NP was reversibly adsorbed on the surface of Cu NPs. Then, electron transfer occurred from BH4− and 4-NP near the surface of the Cu NPs supported on ZnO as the electron mediator. The hydrogen was transferred from the Cu hydride complex to the nitro group, which was then reduced. The final product (4-AP) was desorbed from the surface of the nanocomposite. We may deduce from the previous explanation that the ZnO support can stabilize Cu NPs against aggregation and boost the reduction activity via a synergistic action.
Stability and reusability are important factors for a catalyst's practical application. To investigate if the Cu/0DZnO nanocomposite could be reused, five successive cycles were carried out using 0.01 g of the catalyst; the results are shown in Fig. 9a. After each cycle, the catalyst was filtered out of the reaction mixture, washed several times with double-distilled water and ethanol, and dried at 60 °C in an oven. Only a slight decrease in the catalytic activity of the nanocomposite was observed after five cycles. The primary cause of the decline in the catalytic activity is the loss of small portions of the catalyst during the separation process.
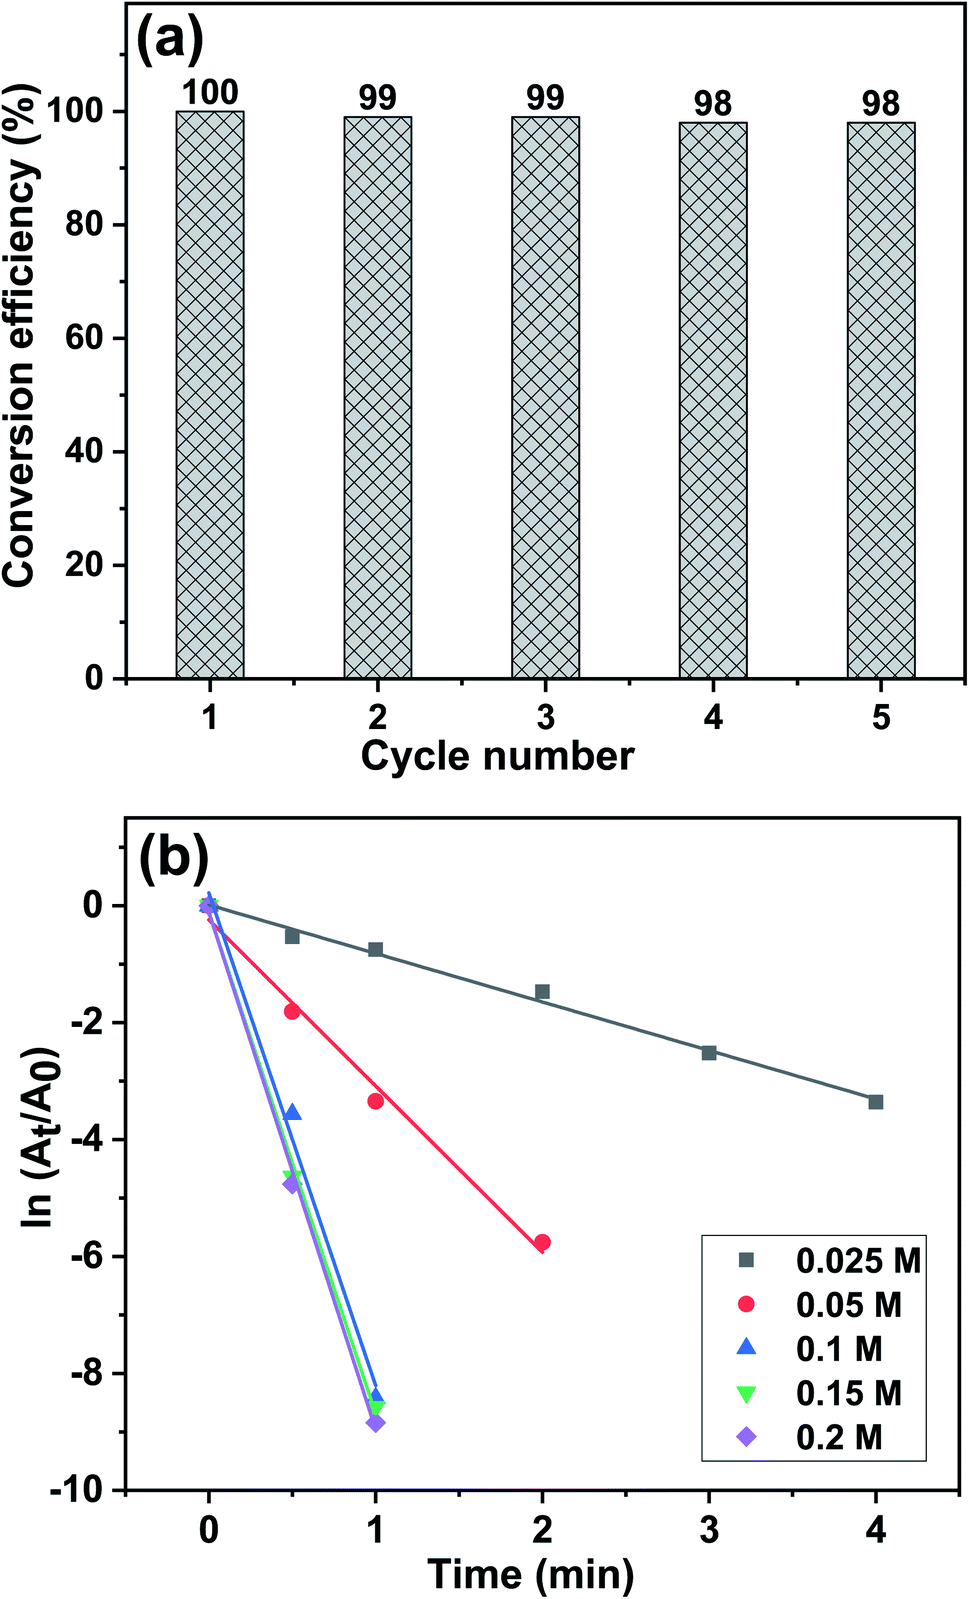 | ||
| Fig. 9 (a) Recyclability of the Cu/0DZnO nanocomposite towards catalytic 4-NP reduction, and the (b) relationship between ln(At/A0) and reaction time and under various NaBH4 concentrations in the presence of the Cu/0DZnO nanocomposite as a catalyst. | ||
The effect of NaBH4 concentration variation (0.05 M to 0.2 M) on the catalytic performance of the Cu/0DZnO nanocomposite for the reduction of 4-NP was investigated while keeping the 4-NP concentration constant (0.1 mM). The plot of ln(At/A0) against time for every concentration of NaBH4 tested is displayed in Fig. 9b. It was found that when NaBH4 concentration shifts from 0.05 M to 0.2 M, the kapp increases from 0.38 min−1 to 8.84 min−1. With increasing concentration of NaBH4, the produced BH4− is increased, and more electrons are delivered to the 4-NP; thus, the reduction occurs rapidly with a higher kapp value and vice versa.77
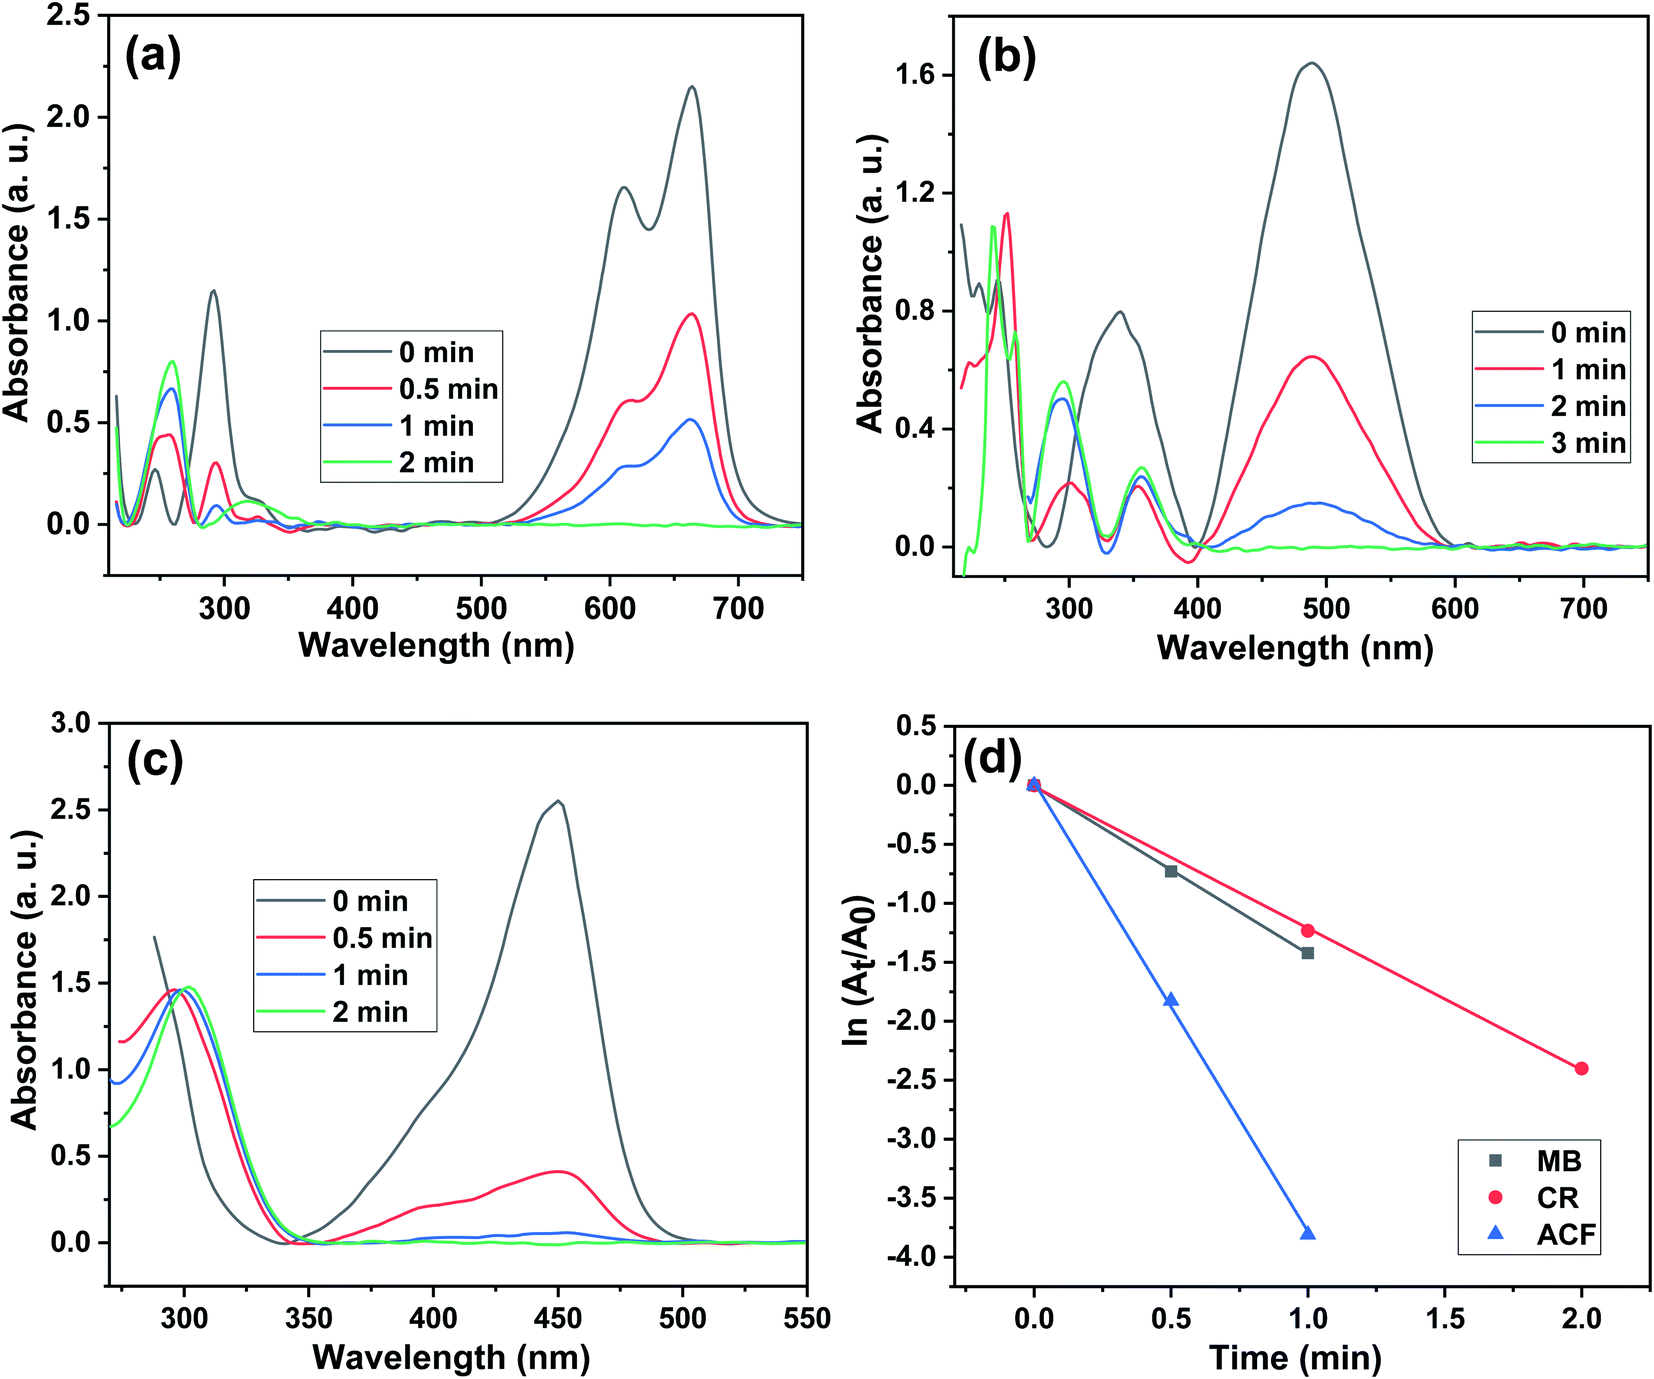 | ||
| Fig. 10 UV-Vis spectra of the reduction of (a) MB, (b) CR, and (c) ACF using the Cu/0DZnO nanocomposite as a catalyst, and (d) plots of ln(At/A0) versus reaction time in the presence of the Cu/0DZnO nanocomposite as a catalyst. | ||
4 Conclusion
Three different ZnO morphologies were successfully synthesized using three different methods (thermal decomposition, microwave-assisted, and precipitation methods). Metallic Cu NPs (5 wt%) were loaded on ZnO nanostructures by a simple reduction method using L-ascorbic acid as a reducing agent. The loading of Cu NPs on ZnO nanostructures leads to a decrease in the optical band gap, slight change in the crystallite sizes, increase in the specific surface area, and increase in the catalytic reduction of 4-NP. The catalytic performance of the nanocomposites takes the following order: Cu/0DZnO > Cu/(1D + 0D) ZnO > Cu/1DZnO. The Cu/0DZnO nanocomposite can reduce 4-NP in a very short time (60 s) with 100% efficiency. The high catalytic performance of this nanocomposite may be attributed to its small particle size, high surface area, and the high distribution of Cu NPs on the surface of ZnO. This composite also showed good catalytic performance in the reduction of organic dyes such as methylene blue, Congo red, and acriflavine hydrochloride. The Cu/0DZnO nanocomposite could be easily recycled with just a minor change in its catalytic activity, indicating its potential for use at a broad scale in chemical process industries.Data availability
All data generated or analyzed during this study are included in this published article.Author contributions
Hazim M. Ali: conceptualization, methodology, software, writing – original draft, writing – review & editing. Samia M. Ibrahim: conceptualization, methodology, software, writing – original draft, writing – review & editing. Essam F. Abo Zeid: conceptualization, methodology, writing – review & editing. Ahmed F. Al-Hossainy: conceptualization, methodology, writing – review & editing. Mohamed Abd El-Aal: conceptualization, methodology, writing – original draft, software, validation, writing – review & editing.Conflicts of interest
The authors declare that they have no known competing financial interests or personal relationships that could have appeared to influence the work reported in this paper.Acknowledgements
This work was funded by the Deanship of Scientific Research at Jouf University under grant No. (DSR-2021-03-0348).References
- I. A. Abdelhafeez, S. A. El-Tohamy, M. A. Abd Ul-Malik, S. A. A. Abdel-Raheem and F. M. S. El-Dars, Curr. Chem. Lett., 2022, 11, 43–62 CrossRef
.
- A. N. Chishti, L. Ni, F. Guo, X. Lin, Y. Liu, H. Wu, M. Chen and G. W. Diao, J. Environ. Chem. Eng., 2021, 9, 104948 CrossRef CAS
- K. Subalakshmi, K. A. Kumar and J. Senthilselvan, AIP Conf. Proc., 2017, 1832, 110057 CrossRef
- A. A. Yahya, K. T. Rashid, M. Y. Ghadhban, N. E. Mousa, H. S. Majdi, I. K. Salih and Q. F. Alsalhy, Membr, 2021, 11 Search PubMed
- A. Nezamzadeh-Ejhieh and S. Khorsandi, J. Ind. Eng. Chem., 2014, 20, 937–946 CrossRef CAS
- M. Trapido and J. Kallas, Environ. Technol., 2000, 21, 799–808 CrossRef CAS
- K. S. Thangamani, N. Muthulakshmi Andal, E. Ranjith Kumar and M. Saravanabhavan, J. Environ. Chem. Eng., 2017, 5, 2820–2829 CrossRef CAS
- M. Kornaros and G. Lyberatos, J. Hazard. Mater., 2006, 136, 95–102 CrossRef CAS PubMed
- S. Xie, P. Huang, J. J. Kruzic, X. Zeng and H. Qian, Sci. Rep., 2016, 6, 21947 CrossRef CAS PubMed
- A. F. Baye, R. Appiah-Ntiamoah and H. Kim, Sci. Total Environ., 2020, 712, 135492 CrossRef CAS PubMed
- M. T. Alula, B. A. Aragaw, S. T. Modukanele and J. Yang, Inorg. Chem. Commun., 2021, 127, 108504 CrossRef CAS
- M. S. Bashir, X. Jiang and X. Z. Kong, Eur. Polym. J., 2020, 129, 109652 CrossRef CAS
- S. Ni, L. Yang, H. Qu, X. Zhu, Z. Xu, M. Yuan, H. Xing, L. Wang, J. Yu and H. Liu, J. Environ. Chem. Eng., 2021, 9, 105101 CrossRef CAS
- B. L. Ryland, S. D. McCann, T. C. Brunold and S. S. Stahl, J. Am. Chem. Soc., 2014, 136, 12166–12173 CrossRef CAS PubMed
- B. Eren, C. Heine, H. Bluhm, G. A. Somorjai and M. Salmeron, J. Am. Chem. Soc., 2015, 137, 11186–11190 CrossRef CAS PubMed
- M. Donnard and N. Blanchard, Copper-Mediated Cross-Coupling React., 2013, 683–723 Search PubMed
- G. Sekar, S. Sangeetha, A. Nandy and R. Saha, Copper Catal. Org. Synth., 2020, 395–422 CAS
- Z. Xie, Y. Cai, H. Hu, C. Lin, J. Jiang, Z. Chen, L. Wang and Y. Pan, Org. Lett., 2013, 15, 4600–4603 CrossRef CAS PubMed
- S. Thapa, B. Shrestha, S. K. Gurung and R. Giri, Org. Biomol. Chem., 2015, 13, 4816–4827 RSC
- L. Hang, Y. Zhao, H. Zhang, G. Liu, W. Cai, Y. Li and L. Qu, Acta Mater., 2016, 105, 59–67 CrossRef CAS
- H. Sun, A. B. Abdeta, O. A. Zelekew, Y. Guo, J. Zhang, D.-H. Kuo, J. Lin and X. Chen, J. Mol. Liq., 2020, 313, 113567 CrossRef CAS
- T. Kamal, A. M. Asiri and N. Ali, Spectrochim. Acta, Part A, 2021, 261, 120019 CrossRef CAS PubMed
- R. Xu, H. Bi, G. He, J. Zhu and H. Chen, Mater. Res. Bull., 2014, 57, 190–196 CrossRef CAS
- A. A. Kassem, H. N. Abdelhamid, D. M. Fouad and S. A. Ibrahim, J. Environ. Chem. Eng., 2021, 9, 104401 CrossRef CAS
- M. T. Islam, N. Dominguez, M. A. Ahsan, H. Dominguez-Cisneros, P. Zuniga, P. J. J. Alvarez and J. C. Noveron, J. Environ. Chem. Eng., 2017, 5, 4185–4193 CrossRef CAS
- S. A. Rasaki, C. Zhao, R. Wang, J. Wang, H. Jiang and M. Yang, Mater. Res. Bull., 2019, 119, 110536 CrossRef CAS
- H. A. Oualid, O. Amadine, Y. Essamlali, I. M. Kadmiri, H. El Arroussi and M. Zahouily, Nanoscale Adv., 2019, 1, 3151–3163 RSC
- G. García-Valdivieso, E. Arenas-Sánchez, P. Horta-Fraijo, A. Simakov, H. R. Navarro-Contreras and B. Acosta, Nanotechnology, 2021, 32, 315713 CrossRef PubMed
- M. Behera, N. Tiwari, A. Basu, S. Rekha Mishra, S. Banerjee, S. Chakrabortty and S. K. Tripathy, Adv. Powder Technol., 2021, 32, 2905–2915 CrossRef CAS
- M. Bordbar, N. Negahdar and M. Nasrollahzadeh, Sep. Purif. Technol., 2018, 191, 295–300 CrossRef CAS
- F. S. Alamro, A. M. Mostafa, H. A. Ahmed and A. Toghan, Surf. Interfaces, 2021, 26, 101406 CrossRef CAS
- A. M. Mostafa and E. A. Mwafy, J. Mol. Struct., 2020, 1221, 128872 CrossRef CAS
- M. T. Alula, P. Lemmens and M. L. Madingwane, Microchem. J., 2020, 156, 104976 CrossRef CAS
- Y. Sun, L. Chen, Y. Bao, Y. Zhang, J. Wang, M. Fu, J. Wu and D. Ye, Catalysis, 2016, 6, 188 Search PubMed
- K. H. Ernst, A. Ludviksson, R. Zhang, J. Yoshihara and C. T. Campbell, Phys. Rev. B, 1993, 47, 13782–13796 CrossRef CAS PubMed
- G. P. Singh and M. K. Roy, Mater. Today: Proc., 2021, 46, 5878–5880 CAS
- S. K. Nikhil, A. Das, P. M. Kumar, M. Bhagavathiachari and R. G. Nair, Opt. Mater., 2021, 121, 111551 CrossRef
- D. Cao, S. Gong, X. Shu, D. Zhu and S. Liang, Nanoscale Res. Lett., 2019, 14, 210 CrossRef PubMed
- Q. Liu, T. Yasunami, K. Kuruda and M. Okido, Trans. Nonferrous Met. Soc. China, 2012, 22, 2198–2203 CrossRef CAS
- M. Abd El-Aal and T. Seto, Res. Chem. Intermed., 2020, 46, 3741–3756 CrossRef CAS
- P. Fageria, S. Gangopadhyay and S. Pande, RSC Adv., 2014, 4, 24962–24972 RSC
- M. A. El-Aal, T. Seto and A. Matsuki, Appl. Phys. A, 2020, 126, 572 CrossRef CAS
- W. Z. Tawfik, Z. S. Khalifa, M. S. Abdel-wahab and A. H. Hammad, J. Mater. Sci.: Mater. Electron., 2019, 30, 1275–1281 CrossRef
- E. F. A. Zeid, I. A. Ibrahem, W. A. A. Mohamed and A. M. Ali, Mater. Res. Express, 2020, 7, 26201 CrossRef
- E. Gurgur, S. S. Oluyamo, A. O. Adetuyi, O. I. Omotunde and A. E. Okoronkwo, SN Appl. Sci., 2020, 2, 911 CrossRef CAS
- M. Chakraborty, A. Ghosh and R. Thangavel, J. Sol-Gel Sci. Technol., 2015, 74, 756–764 CrossRef CAS
- O. I. Omotunde, A. E. Okoronkwo, A. F. Aiyesanmi and E. Gurgur, J. Photochem. Photobiol., A, 2018, 365, 145–150 CrossRef CAS
- A. Ghosh, N. Kumari and A. Bhattacharjee, Pramana, 2015, 84, 621–635 CrossRef CAS
- M. Sathya and K. Pushpanathan, Appl. Surf. Sci., 2018, 449, 346–357 CrossRef CAS
- A. Modwi, K. K. Taha, L. Khezami, A. S. Al-Ayed, O. K. Al-Duaij, M. Khairy and M. Bououdina, J. Inorg. Organomet. Polym. Mater., 2020, 30, 2633–2644 CrossRef CAS
- T. Chitradevi, A. Jestin Lenus and N. Victor Jaya, Mater. Res. Express, 2019, 7, 15011 CrossRef
- A. A. Othman, M. A. Osman, E. M. M. Ibrahim, M. A. Ali and A. G. Abd-Elrahim, Mater. Sci. Eng., B, 2017, 219, 1–9 CrossRef CAS
- S. Ebrahimiasl, A. Zakaria, A. Kassim and S. N. Basri, Int. J. Nanomed., 2015, 10, 217–227 Search PubMed
- J. Liu, Y. Chen and H. Zhang, Sensors, 2021, 21 Search PubMed
- V. Sreeja, K. N. Jayaprabha and P. A. Joy, Appl. Nanosci., 2015, 5, 435–441 CrossRef CAS
- V. U. Siddiqui, A. Ansari, M. T. Ansari, M. K. Akram, W. A. Siddiqi, A. M. Alosaimi, M. A. Hussein and M. Rafatullah, Catalysis, 2021, 11 Search PubMed
- T. R. Chetia, M. S. Ansari and M. Qureshi, ACS Appl. Mater. Interfaces, 2015, 7, 13266–13279 CrossRef CAS PubMed
- E. C. Arvaniti, M. C. G. Juenger, S. A. Bernal, J. Duchesne, L. Courard, S. Leroy, J. L. Provis, A. Klemm and N. De Belie, Mater. Struct., 2015, 48, 3687–3701 CrossRef CAS
- A. E.-A. A. Said, M. M. M. Abd El-Wahab and M. Abd El-Aal, Monatsh. Chem., 2016, 147, 1507–1516 CrossRef CAS
- S. S. Patil, M. G. Mali, M. S. Tamboli, D. R. Patil, M. V Kulkarni, H. Yoon, H. Kim, S. S. Al-Deyab, S. S. Yoon, S. S. Kolekar and B. B. Kale, Catal. Today, 2016, 260, 126–134 CrossRef CAS
- H. Nie, L. Fu, J. Zhu, W. Yang, D. Li and L. Zhou, Mater, 2018, 11 Search PubMed
- G. Qu, G. Fan, M. Zhou, X. Rong, T. Li, R. Zhang, J. Sun and D. Chen, ACS Omega, 2019, 4, 4221–4232 CrossRef CAS PubMed
- X. Kang, D. Teng, S. Wu, Z. Tian, J. Liu, P. Li, Y. Ma and C. Liang, J. Colloid Interface Sci., 2020, 566, 265–270 CrossRef CAS PubMed
- P. Deka, R. C. Deka and P. Bharali, New J. Chem., 2014, 38, 1789–1793 RSC
- S. Haider, T. Kamal, S. B. Khan, M. Omer, A. Haider, F. U. Khan and A. M. Asiri, Appl. Surf. Sci., 2016, 387, 1154–1161 CrossRef CAS
- S. Ghosh, R. Das, I. H. Chowdhury, P. Bhanja and M. K. Naskar, RSC Adv., 2015, 5, 101519–101524 RSC
- S. Gao, X. Jia, J. Yang and X. Wei, J. Mater. Chem., 2012, 22, 21733–21739 RSC
- P. Zhang, Y. Sui, G. Xiao, Y. Wang, C. Wang, B. Liu, G. Zou and B. Zou, J. Mater. Chem. A, 2013, 1, 1632–1638 RSC
- J. Jiang, Y. Soo Lim, S. Park, S.-H. Kim, S. Yoon and L. Piao, Nanoscale, 2017, 9, 3873–3880 RSC
- Y. Sun, L. Xu, Z. Yin and X. Song, J. Mater. Chem. A, 2013, 1, 12361–12370 RSC
- J. Jiang, G. H. Gunasekar, S. Park, S.-H. Kim, S. Yoon and L. Piao, Mater. Res. Bull., 2018, 100, 184–190 CrossRef CAS
- S. Wang, S. Gao, Y. Tang, L. Wang, D. Jia and L. Liu, J. Solid State Chem., 2018, 260, 117–123 CrossRef CAS
- C.-C. Yeh, P.-R. Wu and D.-H. Chen, Mater. Lett., 2014, 136, 274–277 CrossRef CAS
- Z.-Y. Xiao, S.-R. Zhai, X.-P. Ma, Z.-Y. Zhao, X. Wang, H. Bai and Q.-D. An, New J. Chem., 2017, 41, 13230–13234 RSC
- M. Nasrollahzadeh, Z. Issaabadi and S. M. Sajadi, RSC Adv., 2018, 8, 3723–3735 RSC
- W. Liu, K. Tian, H. Jiang and H. Yu, Green Chem., 2014, 4198–4205 RSC
- S. A. Hira, H. S. Hui, M. Yusuf and K. H. Park, Catal. Commun., 2020, 141, 106011 CrossRef CAS
- B. R. Ganapuram, M. Alle, R. Dadigala, A. Dasari, V. Maragoni and V. Guttena, Int. Nano Lett., 2015, 5, 215–222 CrossRef CAS
- K. Naseem, Z. H. Farooqi, R. Begum and A. Irfan, J. Cleaner Prod., 2018, 187, 296–307 CrossRef CAS
- F. Farzaneh and S. Haghshenas, Mater. Sci. Appl., 2012, 03, 697–703 CAS
| This journal is © The Royal Society of Chemistry 2022 |