 Open Access Article
Determination of atypical antipsychotics in human plasma by UPLC-UV with polystyrene nanofibers as a solid-phase extraction sorbent
Liju Fanab,
Jing Anb,
Jin Gaoc,
Yanjun Cuia and
Zhanjun Dong *ab
*ab
aCollege of Graduate Studies, Hebei Medical University, Shijiazhuang, 050017, Hebei, China. E-mail: hbghzhanjundong@163.com
bPharmaceutical Department, Hebei General Hospital, Shijiazhuang, 050051, Hebei, China
cDepartment of Glandular Surgery, Hebei General Hospital, Shijiazhuang, 050051, Hebei, China
First published on 31st May 2022
Abstract
A novel extraction procedure was developed using polystyrene (PS) nanofibers as a solid-phase extraction sorbent to collect atypical antipsychotics (AAPs) from human plasma. The extraction targets were then monitored by ultra high performance liquid chromatography with an ultraviolet detector system. Parameters affecting extraction efficiency such as fiber packing amount, wash solution, and eluted solvent were investigated. Under optimized conditions, the linear range of seven AAPs was 1–50 μgmL−1 (R2 > 0.996). Inter-day and intra-day relative standard deviations were less than 15.1%, and relative error varied from −17.1% to 12.0%. Furthermore, 50.5–79.3% extraction recoveries were obtained. The lower limit of quantification was 1 μg mL−1, and detection limit was 0.5 μg mL−1. The method developed in this study may be applied to simultaneous quantification of seven AAPs in human plasma due to its simplicity, selectivity, and efficiency.
1 Introduction
Schizophrenia is a complex polygenic trait shaped by multiple environmental or genetic factors.1 The onset of schizophrenia spectrum disorder usually occurs in adolescence and young adulthood, and the prevalence peaks around age 40.2 Early, comprehensive and complete treatment of schizophrenia is necessary. Drugs are one of the first choices in treating schizophrenia. Atypical antipsychotics (AAPs) have been widely prescribed for managing patients with schizophrenia, bipolar disorders, and other psychotic disorders due to their long-term efficacy and good safety profile.3 In particular, these drugs are thought to better alleviate negative symptoms and improve cognitive function compared with typical antipsychotic drugs.4 However, adverse events related to cardiovascular system and metabolism deserve special attention.5 Moreover, patients often need combination drug therapy for managing schizophrenia. Clinical treatment often faces the difficulty of insufficient drug response or poor adherence. Therefore, the existing guideline has recommended monitoring these therapeutic drugs when using them to optimize the patient's medication regimen based on test results, improve prognosis and reduce recurrence rate.6However, the determination of trace analytes in complex matrices is the major sticking point of an analytical procedure, and the sample usually needs to be enriched.7,8 The ideal pretreatment technology should be simple and efficient. Solid-phase extraction (SPE) can yield high extraction efficiency and high throughput and is currently the most widely used pretreatment technology.9–13 The type of adsorbent is one of the key factors that affect the extraction efficiency of SPE. Traditional SPE mainly use C18 and silica as the matrix adsorbents. However, these typical adsorbents are characterized by low adsorption capacity and selectivity, which limits their widespread use.14 In recent years, analysts have devoted to develop new adsorbents such as nanofibers, molecularly/ion-imprinted polymers, magnetic nanoparticles, graphene and graphene oxide, metal–organic frameworks.15–18 Nanofibers form a three-dimensional net structure with a high surface-to-volume ratio, exhibiting good chemical stability and high porosity.19,20 Various methods have been adopted for preparing nanofibers. Electrostatic spinning technique relies on repulsive electrostatic forces to make viscoelastic solutions into nanofibers. It is the simplest and most flexible method for preparing nanofibers because electrospinning can easily control the orientation of nanofibers.19 Fiber arrangement exerts an important impact on subsequent performance of SPE equipment.21 Polymer solutions are the most common type of electrostatic spinning materials applied in SPE due to their necessary viscoelasticity.22
At present, the methods for the quantitative detection of such drugs in biological samples have been developed.23–26 Protein precipitation, solid phase extraction and liquid–liquid extraction are the most frequently used methods for sample preparations. Liquid–liquid extraction could greatly improve the sensitivity and recovery efficiency, but the procedure is complicated and not suitable for the processing of large quantities of clinical samples. Matric effects of protein precipitation methods are more obvious compared with liquid–liquid extraction or solid phase extraction method. Protein precipitation method is often combined with other methods.27 In this study, a novel extraction procedure was developed to detect olanzapine, risperidone, paliperidone, clozapine, quetiapine, ziprasidone, and aripiprazole in plasma samples using polystyrene (PS) nanofibers as the SPE sorbent, combined with ultra-high-performance liquid chromatography with an ultraviolet detector (UPLC-UV) system. All extraction efficiency parameters of the method, including fiber type, fiber packing amount, eluted solvent, pH of the liquid phase, protein precipitant, and elution solutions, were thoroughly investigated and optimized. This method needed only 90 μL of the sample, and simple equipment and procedure were adopted. Hence, it was a convenient, high throughput and cost-saving method, which improved its clinical applicability. The newly developed extraction method might be used as an analytical tool to quantify AAPs in human plasma samples.
2 Materials and methods
2.1 Reagents and materials
Paliperidone (C11598313, 98.0%) was purchased from Macklin (Shanghai, China). Olanzapine (0521A022, 98.0%) was purchased from Solarbio (Beijing, China). Clozapine (100323-201703, 99.7%), risperidone (100570-201704, 99.9%), aripiprazole (100766-202003, 99.7%), quetiapine (100815-201904, 99.6%), and ziprasidone (100865-200601, 100.0%) were purchased from the National Institute for Food and Drug Control (Beijing, China). Acetonitrile and methanol with high performance liquid chromatography (HPLC) grade were purchased from Fisher Scientific (Fair Lawn, MA, USA). Analytical grade tetrahydrofuran, N,N-dimethylformamide, and potassium dihydrogen phosphate were all purchased from Sinopec Chemical Reagent Company (Beijing, China). Polystyrene (Mw 230![[thin space (1/6-em)]](https://www.rsc.org/images/entities/char_2009.gif) 000) was purchased from Aldrich. Blank human plasma was obtained from healthy volunteers at Hebei General Hospital (Hebei, China).
000) was purchased from Aldrich. Blank human plasma was obtained from healthy volunteers at Hebei General Hospital (Hebei, China).
2.2 Instruments and chromatography conditions
Acquity UPLC H-Class system (Waters, MA, USA), SS-2535 Electrospinning Equipment (Ucalery, Beijing, China), Electron scanning microscopy (SEM, S-4800I, Hitachi, Japan), and a constant-temperature oscillator (Zhicheng, Shanghai, China) were used in this study. Chromatographic separation was carried out on a C18 column (Zorbax Eclipse XDB-C18 column, 150 × 4.6 mm, 5 μm) with a column temperature of 35 °C. A mixture of 50 mmol L−1 potassium dihydrogen phosphate (A) solution and acetonitrile (B) solution was used as the mobile phase. At a flow rate of 1 mL min−1, the gradient program was set as follows: 0–1 min 10% B, 1–15 min, 10% → 40% B, 15–20 min 40% B, and 21–25 min 10% B. The wavelength of UV detector were set at 280 nm (olanzapine, paliperidone, risperidone), 254 nm (clozapine, quetiapine, ziprasidone) and 220 nm (aripiprazole). The injection volume was 10 μL.2.3 Preparation of PS nanofibers
The nanofibers were synthesized according to the methodology proposed by An et al.28 Fifteen percent (w/v) PS solution was prepared by dissolving an appropriate amount PS in a mixture of dimethylformamide and tetrahydrofuran (1![[thin space (1/6-em)]](https://www.rsc.org/images/entities/char_2009.gif) :
:![[thin space (1/6-em)]](https://www.rsc.org/images/entities/char_2009.gif) 1, v/v). This solution was stirred at room temperature for 4 h to obtain an electrospinning solution. This solution was loaded into a glass syringe (10 mL volume). A high-voltage generator was linked with the needle through a copper pin. A grounded iron drum mantled with a copper grid served as the collection screen. Negative voltage was −9 kV, and positive voltage was 14 kV. Injection speed was 0.15 mm min−1, and receiving speed was 0.8 mm min−1. After electrospinning for 12 h, a dense web of the fibers was collected on the copper grid. The fibers were washed with methanol and water and then dried for later use.
1, v/v). This solution was stirred at room temperature for 4 h to obtain an electrospinning solution. This solution was loaded into a glass syringe (10 mL volume). A high-voltage generator was linked with the needle through a copper pin. A grounded iron drum mantled with a copper grid served as the collection screen. Negative voltage was −9 kV, and positive voltage was 14 kV. Injection speed was 0.15 mm min−1, and receiving speed was 0.8 mm min−1. After electrospinning for 12 h, a dense web of the fibers was collected on the copper grid. The fibers were washed with methanol and water and then dried for later use.
2.4 Standards and reagents
Paliperidone, olanzapine, clozapine, risperidone, aripiprazole, quetiapine, and ziprasidone were prepared at a concentration of 5 mg mL−1 using methanol. Seven analytes were added together and diluted with water to make a series of standard and control solutions. All solutions were stored at 4 °C and diluted with water into a series of mixed working solutions with concentrations of 500, 400, 300, 200, 150, 100, 50, and 10 μg mL−1, and a series of mixed control solutions with concentrations of 400, 250, and 25 μg mL−1.2.5 Preparation of calibration standards and quality control (QC) samples
The calibration standards were prepared by spiking 10 μL of the mixed working solution with 90 μL of blank human plasma. The final concentrations of the calibration curves were 1, 5, 10, 15, 20, 30, 40, and 50 μg mL−1 for analytes. The QC samples were processed in the same manner as the calibration standards with the final concentrations of 2.5, 25, and 45 μg mL−1 for seven analytes. Both calibration standards and QC plasma samples were prepared in blank human plasma by ten times dilution of working solutions. Next, 200 μL of methanol was added, vortexed, mixed for 2 min, and centrifuged at 13![[thin space (1/6-em)]](https://www.rsc.org/images/entities/char_2009.gif) 000 rpm for 10 min. The supernatant was transferred to another Eppendorf tube, and the supernatant was diluted to 1 mL with water for further use.
000 rpm for 10 min. The supernatant was transferred to another Eppendorf tube, and the supernatant was diluted to 1 mL with water for further use.
2.6 Preparation of spiked plasma sample
An aliquot of 10 μL of the mixed working solution was mixed with 90 μL of blank human plasma to obtain the spiked plasma sample. Next, 200 μL of methanol was added, vortexed, mixed for 2 min, and centrifuged at 13![[thin space (1/6-em)]](https://www.rsc.org/images/entities/char_2009.gif) 000 rpm for 10 min. The supernatant was transferred to another Eppendorf tube, and the supernatant was diluted to 1 mL with water for further use.
000 rpm for 10 min. The supernatant was transferred to another Eppendorf tube, and the supernatant was diluted to 1 mL with water for further use.
2.7 SPE procedure
SPE column was prepared by packing 20 mg PS fibers into a 1 mL syringe. Before loading the sample, the SPE column was preconditioned with 1 mL of ethanol and 1 mL of water. Sample after dilution (1 mL) was pushed through the SPE cartridge at uniform speed using a vacuum pump. Sorbent was washed with 200 μL of 2.5% aqueous methanol, and the analytes were eluted with 200 μL of methanol. Subsequently, 10 μL of the solution was analyzed using UPLC system. Fig. 1 shows the schematic diagram of PS-SPE device.3 Results and discussion
3.1 Nanofiber characterization
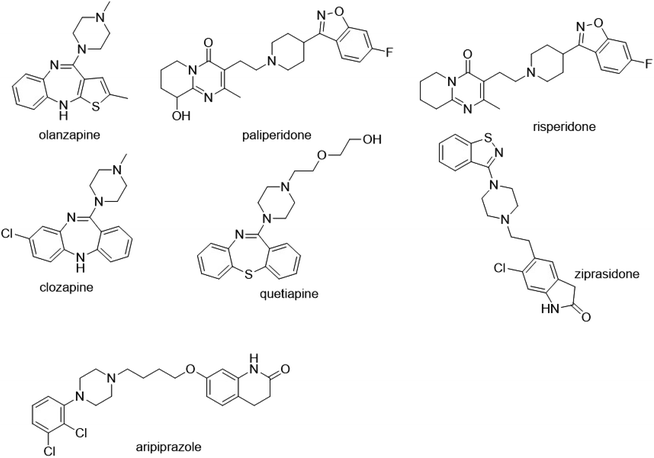
Due to high porosities and large surface areas, the main benefit of using nanofibers is to facilitate the miniaturization of SPE using a small amount of adsorbent, achieving high extraction efficiency. A series of spinning technology parameters were optimized to prepare good polystyrene nanofibers, which formed a three-dimensional network. Chemical structures of seven analytes are shown in Fig. 2. All analytes possess aromatic and hydrophobic molecular parts. In addition, polystyrene, also known as aromatic adsorbent, is a typical non-polar adsorbent. Therefore, the mechanism of adsorption may involve hydrophobic and π–π interaction. As shown in Fig. 3, scanning electron microscopy exam results demonstrated that the surface morphology and porous structure of the nanofiber packing were uniform, smooth, and homogeneous without any obvious defects. The diameter of the nanofibers was about 400 nm. The Brunauer–Emmett–Teller (BET) has also been used to measure the specific surface area of nanofiber. The Brunauer–Emmett–Teller (BET) surface area analysis was conducted using the ASAP 2460 surface area and pore size analyzer (Micromeritics Instrument Corporation, USA). The surface area of PS nanofibers is 2.65 m2 g−1. PS nanofibers had a smooth surface and formed a fibriform three-dimensional mesh-like structure. This loose structure not only facilitates the filling but also helps to reduce the resistance of the SPE column.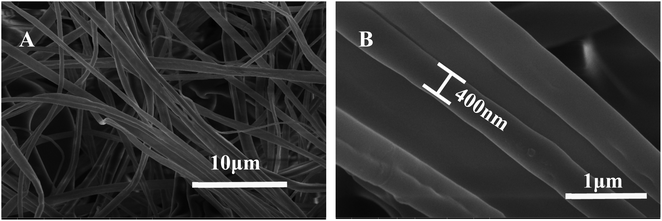 | ||
| Fig. 3 SEM images of porous structure of the nanofiber packing. Low-resolution (A), high-resolution (B). | ||
3.2 Chromatographic mobile phase conditions
In this study, several parameters including mobile phase composition and its pH were optimized to enable efficient separation. The effect of ionic strength of mobile phase was tested with ammonium acetate and potassium dihydrogen phosphate. Improvements in peak shape and resolution of targets were achieved when potassium dihydrogen phosphate (50 mM) was added to the mobile phase. Next, we compared the chromatographic behaviors of seven substances under different pH conditions (pH = 3, 5, 7, 9), and higher signal response and resolution were achieved when pH was adjusted to 5 or 7. The pH value of the mobile phase containing potassium dihydrogen phosphate solution was approximately 5. Therefore, pH 5 was selected as the optimum pH value in this study.3.3 Optimization of packing quantity of polystyrene nanofibers
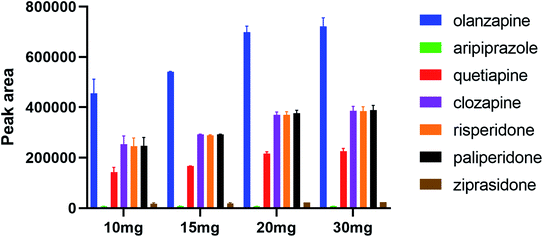
In the SPE procedure, the amount of adsorbent is a key factor in extracting analytes. The study investigated the effect of the packing quantity of polystyrene nanofibers on adsorption and extraction efficiency of analytes to ensure that the analytes were completely adsorbed. Further, 5, 10, 15, 20, and 30 mg were used in the study. It was not suitable for the packing of the column when the amount of adsorbent was less than 10 mg. When the amount of adsorbent was increased from 10 to 20 mg, the recovery rate of seven analytes was improved with increased fiber mass. When elevating the fiber mass from 20 to 30 mg, no significant difference in adsorption recovery rate was observed (Fig. 4). Based on the principle of complete adsorption and saving cost, 20 mg was chosen as the optimal packing mass of polystyrene nanofibers in the SPE column in this study.3.4 Selection of elution solutions
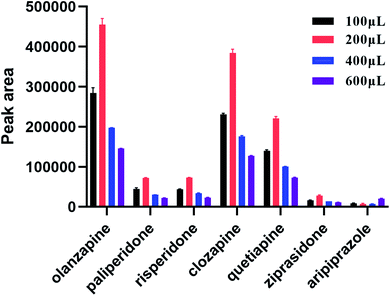
During SPE, the choice of elution solvent is another key factor for the extraction of analytes. This study investigated the influence of different elution solvents on elution efficiency of target analytes to ensure that the targets were completely eluted. Five different solvents (ethyl acetate, acetonitrile, water, methanol, and methyl tert-butyl ether) were examined. It was found that polystyrene nanofibers were dissolved in ethyl acetate, and nanofibers were clumped together in acetonitrile. The elution of the target compound in water, methanol, and methyl tert-butyl ether were further compared, and the results revealed that methanol eluting had the best result. Thus, we chose methanol as the elution solution. Next, to optimize the volume of elution solution, elution efficiency was investigated using a methanol volume of 0.1, 0.2, 0.4, and 0.6 mL. As shown in Fig. 5, the optimum elution volume was 0.2 mL.3.5 Selection of washing solutions
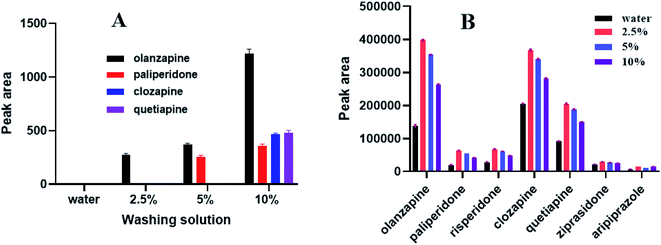
Before the sample is eluted, choosing a suitable solution for impurity elution is a key step during SPE. Selecting appropriate washing solutions can reduce the influence of biological sample matrix on sample analysis and detection. This study sequentially used water, 2.5% aqueous methanol solution, 5% aqueous methanol solution, and 10% aqueous methanol solution to elute impurities. As shown in Fig. 6, the target analytes and impurities were not eluted when water was used. Impurities and a small amount of olanzapine were eluted with a 2.5% aqueous methanol solution. More analytes and impurities were eluted with a 5% aqueous methanol solution. Furthermore, as shown in Fig. 6, the peak area (representative of extraction efficiency) was the largest when a 2.5% aqueous methanol solution was applied. We finally chose a 2.5% aqueous methanol solution to wash impurities so as to ensure the extraction efficiency for each substance.3.6 Cycle time of SPE column
A 10 μg mL−1 plasma sample solution was used for measuring the cycle time of SPE columns. The column was washed with 5 mL of methanol and 5 mL of water after each treatment. The recovery of the target analytes did not change significantly after five treatments and washes. However, the resistance of the column increased and the fiber properties also changed. Plasma samples are complex, and some endogenous impurities may remain on the fiber after each use, thus causing an increase in the pressure of an SPE column. The SPE column shall not be reused for more than five times.3.7 Reduction of protein binding
The majority of drugs showed strong bindings with plasma proteins. Some standard methods have been used to enhance the extraction recovery, such as dilution of blood samples, alteration of pH, and addition of a protein precipitant and an organic modifier to plasma.29 Using protein precipitation method, effects of two precipitators, perchloric acid (6% v/v) and methanol, were compared. The results showed that methanol provided better extraction recovery. In addition, we found that methanol (200 μL) could clean the precipitate. However, when the volume of methanol continued to increase, it was not conducive for drug adsorption. Thus, 200 μL of methanol was used to precipitate the protein from the plasma sample (100 μL).3.8 Method validation
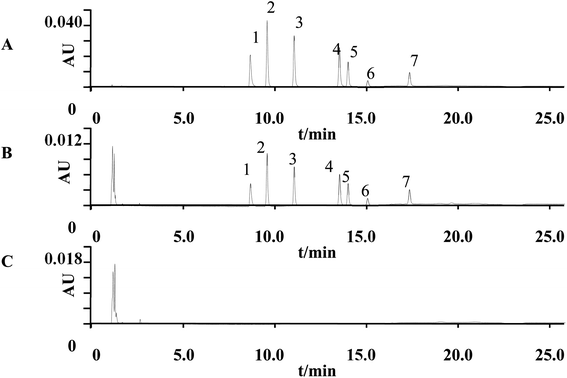
Processed calibration standards and quality control samples were used to develop the calibration curve for method validation. This method was validated according to the US FDA Bioanalytical Method Validation Guidance (Guidance for Industry: Bioanalytical Method Validation, 2018) and China pharmacopeia (version 2020). Validation was conducted considering selectivity, linearity, and lower limit of quantitation (LLOQ), precision, accuracy, extraction recovery and stability.Selectivity. Six blank plasma samples from different sources were used to evaluate the interference. The interfering component with a response less than 20% of the LLOQ sample response was not considered. Fig. 7 shows the typical chromatograms of blank and spiked plasma sample. Seven analytes were well separated. No signal interfered with the analytes in the blank plasma.
Calibration curve. Calibration standards, refer to a biological matrix to which a known amount of analyte has been added. Calibration standards are used to construct calibration curves from which the concentrations of analytes in QC samples and in study samples are determined. The external calibration curves were fitted by using weighted (1/x2) linear regression analysis. We also tried to use the internal standard method for the calculation, but since no specific internal standard was found for all analytes, and considering that the sample matrix and sample pretreatment were not complicated, the external standard method was finally chosen for the determination in this paper. As shown in Table 1, the calibration curve showed good linearity over the concentration range of 1–50 μg mL−1 for the seven analytes, and the correlation coefficients were all greater than 0.996.
| Analytes | Regression equation | Linear range (μg mL−1) | R2 | LLOQs (μg mL−1) | LODs (μg mL−1) |
|---|---|---|---|---|---|
| Aripiprazole | A = 3.30 × 10³C − 8.28 × 10² | 1–50 | 0.9978 | 1 | 0.5 |
| Paliperidone | A = 1.28 × 10⁴C − 4.15 × 10³ | 1–50 | 0.9954 | 1 | 0.5 |
| Clozapine | A = 1.68 × 10⁴C − 3.91 × 10³ | 1–50 | 0.9971 | 1 | 0.5 |
| Ziprasidone | A = 3.55 × 10³C − 4.81 × 10² | 1–50 | 0.9984 | 1 | 0.5 |
| Olanzapine | A = 2.43 × 10⁴C − 5.79 × 10³ | 1–50 | 0.9961 | 1 | 0.5 |
| Quetiapine | A = 8.77 × 10³C − 2.29 × 10³ | 1–50 | 0.9959 | 1 | 0.5 |
| Risperidone | A = 1.34 × 10⁴C − 3.49 × 10³ | 1–50 | 0.9967 | 1 | 0.5 |
LLOQ. The LLOQ is the lowest amount of an analyte that can be quantitatively determined with acceptable precision and accuracy (the accuracy should be ±20% of nominal and the precision should be ±20% RSD).30–32 The LLOQs were 1 μg mL−1. The limit of detection (LOD) refers to the minimum amount of a substance that can be detected. In addition, the LODs of seven analytes were 0.5 μg mL−1, and S/N ratio was about 3
![[thin space (1/6-em)]](https://www.rsc.org/images/entities/char_2009.gif) :
:![[thin space (1/6-em)]](https://www.rsc.org/images/entities/char_2009.gif) 1.
1.
| Analytes | Intra-day (n = 5) | Inter-day (n = 5) | Extraction efficiency | ||||
|---|---|---|---|---|---|---|---|
| Mean ± SD (%) | RE (%) | RSD (%) | Mean ± SD (%) | RE (%) | RSD (%) | ||
| Aripiprazole | 2.7 ± 0.1 | 8.0 | 3.7 | 2.7 ± 0.2 | 8.0 | 7.4 | 51.4 |
| 26.6 ± 2.1 | 6.4 | 7.8 | 27.2 ± 1.8 | 8.8 | 6.6 | 53.8 | |
| 48.6 ± 5.4 | 8.0 | 11.1 | 49.4 ± 4.5 | 9.8 | 9.1 | 50.5 | |
| Paliperidone | 2.8 ± 0.1 | 12.0 | 3.6 | 2.7 ± 0.1 | 8.0 | 3.7 | 72.4 |
| 21.6 ± 1.8 | −13.6 | 8.3 | 23.9 ± 3.4 | −4.4 | 14.2 | 78.2 | |
| 37.3 ± 0.9 | −17.1 | 2.4 | 39.7 ± 6.0 | −11.8 | 15.1 | 74.2 | |
| Clozapine | 2.8 ± 0.1 | 12.0 | 3.6 | 2.6 ± 0.2 | 4.0 | 7.7 | 62.9 |
| 24.8 ± 2.0 | −0.8 | 8.1 | 26.0 ± 2.3 | 4.0 | 8.8 | 73.3 | |
| 43.3 ± 0.9 | −3.8 | 2.1 | 43.9 ± 5.9 | −2.4 | 13.4 | 65.4 | |
| Ziprasidone | 2.8 ± 0.1 | 12.0 | 3.6 | 2.8 ± 0.1 | 12.0 | 3.6 | 55.0 |
| 26.5 ± 1.3 | 6.0 | 4.9 | 26.8 ± 1.2 | 7.2 | 4.5 | 66.1 | |
| 47.1 ± 5.1 | 4.7 | 10.8 | 45.1 ± 5.1 | 0.2 | 11.3 | 58.1 | |
| Olanzapine | 2.5 ± 0.1 | 0.0 | 4.0 | 2.4 ± 0.1 | −4.0 | 4.2 | 68.3 |
| 23.6 ± 3.1 | −5.6 | 13.1 | 24.8 ± 3.3 | −0.8 | 13.3 | 70.1 | |
| 37.3 ± 1.3 | −17.1 | 3.5 | 39.4 ± 5.4 | −12.4 | 13.7 | 72.4 | |
| Quetiapine | 2.8 ± 0.1 | 12.0 | 3.6 | 2.7 ± 0.1 | 8.0 | 3.7 | 69.1 |
| 23.3 ± 0.9 | −6.8 | 3.9 | 25.4 ± 2.5 | 1.6 | 9.8 | 68.7 | |
| 40.9 ± 1.0 | −9.1 | 2.4 | 42.3 ± 5.4 | −6.0 | 12.8 | 79.3 | |
| Risperidone | 2.8 ± 0.1 | 12.0 | 3.6 | 2.7 ± 0.1 | 8.0 | 3.7 | 72.3 |
| 24.1 ± 2.6 | −3.6 | 10.8 | 25.4 ± 3.0 | 1.6 | 11.8 | 79.9 | |
| 39.6 ± 1.7 | −12.0 | 4.3 | 43.6 ± 6.9 | −3.1 | 15.8 | 71.5 | |
The extraction efficiency of an analytical process, calculated as a percentage of the known amount of an analyte carried through the sample extraction and processing steps of the method. The recovery was calculated at low, medium, and high QC concentrations (n = 3). The extraction efficiency of analytes from plasma extracted using SPE was calculated as the ratio of peak areas from the pre-extraction spiked plasmas and post-extraction spiked samples. The extraction efficiency of the seven drugs from the plasma exceeded 50%. The detailed results are shown in Table 2.
Long-term storage stability of the matrix was examined after the samples were placed at −20 °C for 7 days. The sample was placed at room temperature and repeatedly thawed three times to examine the freeze–thaw stability. As shown in Table 3, the results showed that the RSD of each sample placed in the autosampler for 24 h was 3.6–13.7%. The RSD for the freeze–thaw cycle was 3.8–16.7%, except for olanzapine. The RSD of analytes in long-term stability experiment was 2.1–14.4%, except for olanzapine and paliperidone. Five analytes (clozapine, risperidone, aripiprazole, quetiapine, ziprasidone) were in the range of 85–115% of the nominal concentrations. Paliperidone was partially degraded under long-term stability experiment. Five replicates were prepared in parallel, three of which were reduced to about half of the nominal concentration. The concentration of olanzapine dropped to 60% under long-term storage and freeze–thaw conditions. Olanzapine exhibited long-term storage instability.23,33 There has been much controversy regarding olanzapine stability in biological specimens. Most studies have shown that its stability depends on sample matrix and physical storage conditions such as light exposure and temperature.34
| Analytes | Spiked conc. (μg mL−1) | Post-preparation stability (4 °C for 24 h) | Long-term stability (−20 °C, 7 days) | Freeze–thaws (−20 °C to 25 °C) | |||
|---|---|---|---|---|---|---|---|
| Mean ± SD | RSD (%) | Mean ± SD | RSD (%) | Mean ± SD | RSD (%) | ||
| Aripiprazole | 2.5 | 2.7 ± 0.3 | 11.1 | 2.4 ± 0.2 | 8.3 | 2.5 ± 0.2 | 8.0 |
| 45 | 46.3 ± 1.9 | 4.1 | 52.7 ± 1.1 | 2.1 | 44.0 ± 2.1 | 4.8 | |
| Paliperidone | 2.5 | 2.8 ± 0.1 | 3.6 | 2.6 ± 0.3 | 11.5 | 2.4 ± 0.4 | 16.7 |
| 45 | 44.2 ± 6.0 | 13.6 | 39.8 ± 14.9 | 37.4 | 41.1 ± 6.4 | 15.6 | |
| Clozapine | 2.5 | 2.6 ± 0.1 | 3.9 | 2.9 ± 0.1 | 3.4 | 2.6 ± 0.2 | 7.7 |
| 45 | 44.7 ± 3.7 | 8.3 | 48.4 ± 3.3 | 6.8 | 45.5 ± 4.4 | 9.7 | |
| Ziprasidone | 2.5 | 2.9 ± 0.5 | 17.2 | 2.2 ± 0.2 | 9.1 | 2.6 ± 0.3 | 11.5 |
| 45 | 48.2 ± 4.7 | 9.8 | 50.5 ± 1.1 | 2.2 | 44.9 ± 3.5 | 7.8 | |
| Olanzapine | 2.5 | 2.4 ± 0.3 | 12.5 | 2.6 ± 0.3 | 11.5 | 2.0 ± 0.5 | 25.0 |
| 45 | 43.7 ± 6.0 | 13.7 | 31.1 ± 2.5 | 8.0 | 44.4 ± 5.4 | 12.3 | |
| Quetiapine | 2.5 | 2.7 ± 0.1 | 3.7 | 2.7 ± 0.2 | 7.4 | 2.6 ± 0.1 | 3.8 |
| 45 | 44.6 ± 4.6 | 10.3 | 48.5 ± 7.0 | 14.4 | 46.1 ± 4.9 | 10.6 | |
| Risperidone | 2.5 | 2.7 ± 0.2 | 7.4 | 2.8 ± 0.1 | 3.6 | 2.6 ± 0.1 | 3.9 |
| 45 | 46.1 ± 6.2 | 13.4 | 50.2 ± 7.1 | 14.1 | 45.5 ± 5.1 | 11.2 | |
4 Comparison of PS-SPE with other methods
The method developed for determining AAPs in human plasma was compared with other reported methods in terms of pretreatment, sample volume, LOQ, running time, and recovery parameters. The results are summarized in Table 4. Compared with other methods, this method needed only 90 μL of the sample, and simple equipment and procedure were adopted. Hence, it was a convenient, high throughput and cost-saving method, which improved its clinical applicability.| Analytes | Sample volume | LOQ | Extraction recovery | Method | Ref. |
|---|---|---|---|---|---|
| Clozapine, lanzapine, quetiapine | 500 μL | 2.0 ng mL−1 | ≥0.79 | SPE-GC-MS/MS | 35 |
| Amisulpride, aripiprazole, clozapine, olanzapine, quetiapine, risperidone sulpiride | 200 μL | 1.0–5.0 ng mL−1 | ≥0.67 | LLE-LC-MS/MS | 23 |
| Amisulpride, olanzapine, aripiprazole, paliperidone ziprasidone | 20 μL | 0.1–9.0 ng mL−1 | ≥0.86 | PP-UPLC-MS/MS | 24 |
| Olanzapine, clozapine, quetiapine | — | 1.25–40 ng mL−1 | ≥0.93 | Column-switching -HPLC-UV | 36 |
| Olanzapine, quetiapine, clozapine, haloperidol, chlorpromazine | 200 μL | 0.05-1 ng mL−1 | — | MEPS LC-MS/MS | 37 |
| Clozapine, risperidone, quetiapine, aripiprazole, olanzapine | 450 μL | 0.5–1.0 ng mL−1 | ≥0.51 | LLE-LC-MS/MS | 25 |
| Risperidone, clozapine, quetiapine, aripiprazole | 1500 μL | 4.7–18.8 ng mL−1 | ≥0.80 | SPE-HPLC-DAD | 38 |
| Olanzapine, risperidone, paliperidone, clozapine, quetiapine, ziprasidone aripiprazole | 90 μL | 1.0 μg mL−1 | ≥0.58 | PS-SPE-UPLC-UV | This paper |
5 Conclusions
In this study, a method was developed based on PS nanofiber-SPE-UPLC-UV and its feasibility of determining seven nontraditional antipsychotic drugs in human plasma was verified. Polystyrene nanofibers were selected as the adsorption medium for SPE. They were suitable for extracting and determining trace target analytes in complex matrices due to large specific surface area and high adsorption capacity. Also, our study provided a reliable analytical method for detecting psychotropic drugs. In general, PS-SPE-UPLC-UV method is simple and economical and can be applied for simultaneous extraction and determination of AAPs in human plasma samples.Ethics approval and consent to participate
The study was approved by the Medical Ethics Committee of Hebei General Hospital (Approval No. 2019219 and date of approval: 2019.10.23).Conflicts of interest
There are no conflicts to declare.References
- M. J. Owen, A. Sawa and P. B. Mortensen, Lancet, 2016, 388, 86–97 CrossRef.
- F. J. Charlson, A. J. Ferrari, D. F. Santomauro, S. Diminic, E. Stockings, J. G. Scott, J. J. McGrath and H. Whiteford, Schizophr. Bull., 2018, 44, 1195–1203 CrossRef PubMed.
- T. Kishimoto, K. Hagi, M. Nitta, J. M. Kane and C. U. Correll, World Psychiatry, 2019, 18, 208–224 CrossRef PubMed.
- S. Leucht, C. Corves, D. Arbter, R. R. Engel, C. Li and J. M. Davis, Lancet, 2009, 373, 31–41 CrossRef CAS.
- A. Uçok and W. Gaebel, World Psychiatry, 2008, 7, 58–62 CrossRef PubMed.
- A. Hiemke, N. Bergemann, H. W. Clement, A. Conca, J. Deckert, K. Domschke, G. Eckermann, K. Egberts, M. Gerlach, C. Greiner, G. Grunder, E. Haen, U. Havemann-Reinecke, G. Hefner, R. Helmer, G. Janssen, E. Jaquenoud, G. Laux, T. Messer, R. Mossner, M. J. Muller, M. Paulzen, B. Pfuhlmann, P. Riederer, A. Saria, B. Schoppek, G. Schoretsanitis, M. Schwarz, M. S. Gracia, B. Stegmann, W. Steimer, J. C. Stingl, M. Uhr, S. Ulrich, S. Unterecker, R. Waschgler, G. Zernig, G. Zurek and P. Baumann, Pharmacopsychiatry, 2018, 51, 9–62 CrossRef PubMed.
- H. Bagheri, F. Manshaei and O. Rezvani, Mikrochim. Acta, 2018, 185, 322–332 CrossRef PubMed.
- Z. Mehrani, H. Ebrahimzadeh, A. R. Aliakbar and A. A. Asgharinezhad, Mikrochim. Acta, 2018, 185, 384–393 CrossRef PubMed.
- A. L. Dawidowicz and M. P. Dybowski, J. Sep. Sci., 2014, 37, 393–397 CrossRef CAS PubMed.
- H. Liu, T. Hwang, I. Tsai and C. Kuo, Electrophoresis, 2015, 36, 534–542 CrossRef CAS PubMed.
- J. Lv, S. Zhang, L. Luo and D. Cao, Anal. Chim. Acta, 2016, 948, 55–61 CrossRef CAS PubMed.
- M. Arabi, A. Ostovan, A. R. Bagheri, X. Guo, L. Wang, J. Li, X. Wang, B. Li and L. Chen, TrAC, Trends Anal. Chem., 2020, 128, 1–29 CrossRef.
- A. Ostovan, M. Ghaedi, M. Arabi, Q. Yang, J. Li and L. Chen, ACS Appl. Mater. Interfaces, 2018, 10, 4140–4150 CrossRef CAS PubMed.
- A. Hashemi, P. Zohrabi and M. Shamsipur, Talanta, 2018, 337, 337–347 CrossRef PubMed.
- H. Taghvimi, M. Hamishehkar and M. Ebrahimi, J. Chromatogr. B: Anal. Technol. Biomed. Life Sci., 2016, 1009, 66–72 CrossRef PubMed.
- Y. Hu, C. Song, J. Liao, Z. Huang and G. Li, J. Chromatogr. A, 2013, 1294, 17–24 CrossRef CAS PubMed.
- Er E. Öztürk, G. Dalgıç Bozyiğit, C. Büyükpınar and S. Bakırdere, Crit. Rev. Anal. Chem., 2022, 52, 231–249 CrossRef PubMed.
- I. Silvestro, C. Ciarlantini, I. Francolini, P. Tomai, A. Gentili, C. Dal Bosco and A. Piozzi, Int. J. Mol. Sci., 2021, 22, 8374 CrossRef CAS PubMed.
- S. Chigome, G. Darko and N. Torto, Analyst, 2011, 136, 2879–2889 RSC.
- X. Wang and B. Hsiao, Curr. Opin. Chem. Eng., 2016, 12, 62–81 CrossRef.
- W. E. Teo and S. Ramakrishna, Nanotechnology, 2006, 17, 89–106 CrossRef PubMed.
- A. Frenot and I. S. Chronakis, Colloid Interface Sci., 2003, 8, 64–75 CAS.
- D. S. Fisher, S. J. Partridge, S. A. Handley, L. ouchman, P. E. Morgan and R. J. Flanagan, Forensic Sci. Int., 2013, 229, 145–150 CrossRef CAS PubMed.
- S. Wang and Y. Li, Biomed. Chromatogr., 2017, 31, 1–27 CAS.
- I. I. Miroshnichenko and N. V. Baymeeva, J. Chromatogr. Sci., 2018, 56, 510–517 CAS.
- L. Mercolini, M. Grillo, C. Bartoletti, G. Boncompagni and M. A. Raggi, Anal. Bioanal. Chem., 2007, 388, 235–243 CrossRef CAS PubMed.
- R. Urinovska, H. Brozmanova, P. Sistik, P. Silhan, I. Kacirova, K. Lemr and M. Grundmann, J. Chromatogr. B: Anal. Technol. Biomed. Life Sci., 2012, 907, 101–107 CrossRef CAS PubMed.
- J. An, Z. Dong, W. Zhang, Y. Yan and W. Kang, Microchem. J., 2021, 168, 106475 CrossRef CAS.
- X. Kang, C. Pan, Q. Xu, Y. Yao, Y. Wang, D. Qi and Z. Gu, Anal. Chim. Acta, 2007, 587, 75–81 CrossRef CAS PubMed.
- Food and Drug Administration (FDA) of the United States, Guidance for Industry Bioanalytical Method Validation, U.S Department of Health and Human Services, Center for Drug Evaluation and Research and Center for Veterinary Medicine, 2018 Search PubMed.
- M. N. Abou-Omar, A. M. Annadi, N. M. El Zahar, A. O. Youssef, M. A. Amin, M. S. Attia and E. H. Mohamedf, RSC Adv., 2021, 11(47), 29797–29806 RSC.
- Y. F. Zhang, X. J. Zheng, J. Tian, H. Shuang, X. H. Bai and X. Chen, J. Chromatogr. A,, 2021, 1643, 462058 CrossRef CAS PubMed.
- E. Saar, D. Gerostamoulos, O. H. Drummer and J. Beyer, Forensic Sci. Int., 2012, 215, 152–158 CrossRef CAS PubMed.
- T. N. Andreassen, B. M. H. Falch and O. Spigset, J. Chromatogr. B: Anal. Technol. Biomed. Life Sci., 2015, 1006, 112–120 CrossRef CAS PubMed.
- T. Rosado, D. Oppolzer, B. Cruz, M. Barroso, S. Varela, V. Oliveira, C. Leitao and E. Gallardo, Rapid Commun. Mass Spectrom., 2018, 32, 2081–2095 CrossRef CAS PubMed.
- M. Silva Gracia, A. Koppl, S. Unholzer and E. Haen, Biomed. Chromatogr., 2017, 31, 1–21 CrossRef PubMed.
- I. D. De Souza, D. S. Domingues and M. E. C. Queiroz, Talanta, 2015, 140, 166–175 CrossRef CAS PubMed.
- K. Petruczynik, M. Wroblewski, B. Szultka-Mlynska, H. Buszewski, J. Karakula-Juchnowicz, J. Gajewski, J. Morylowska-Topolska and M. Waksmundzka-Hajnos, J. Pharm. Biomed. Anal., 2016, 127, 68–80 CrossRef PubMed.
| This journal is © The Royal Society of Chemistry 2022 |


