 Open Access Article
Novel aspartic-based bio-MOF adsorbent for effective anionic dye decontamination from polluted water
Eslam Salama *a,
Mohamed Ghanimbc,
Hassan Shokry Hassande,
Wael A. Amer
 bf,
El-Zeiny M. Ebeidb,
Ahmed H. El-Shazlyc,
Mona Ossmana and
Marwa F. Elkadycg
aEnvironment and Natural Materials Research Institute (ENMRI), City of Scientific Research and Technological Applications (SRTA-City), New Borg El-Arab City, Alexandria 21934, Egypt. E-mail: esalama@srtacity.sci.eg
bChemistry Department, Faculty of Science, Tanta University, Tanta 31527, Egypt
cChemical and Petrochemical Engineering Department, Egypt-Japan University of Science and Technology (E-JUST), New Borg El-Arab City, Alexandria 21934, Egypt
dElectronic Materials Research Department, Advanced Technology and New Materials Research Institute (ATNMRI), City of Scientific Research and Technological Applications (SRTA-City), New Borg El-Arab City, Alexandria 21934, Egypt
eEnvironmental Engineering Department, Egypt-Japan University of Science and Technology, New Borg El-Arab City, Alexandria 21934, Egypt
fDepartment of Chemistry, College of Science, University of Bahrain, Sakhir 32038, Bahrain
gFabrication Technology Research Department, Advanced Technology and New Materials Research Institute (ATNMRI), City of Scientific Research and Technological Applications (SRTA-City), New Borg El-Arab City, Alexandria 21934, Egypt
First published on 22nd June 2022
Abstract
In this study, a cost-effective powdered Zn L-aspartic acid bio-metal organic framework (Zn L-Asp bio-MOF) was reported as an efficient adsorbent for Direct Red 81 (DR-81) as an anionic organic dye. The prepared bio-MOF was characterized using Fourier-transform infrared spectroscopy (FTIR), X-ray diffraction (XRD), scanning electron microscopy (SEM), field emission transmission electron microscopy (FETEM), surface area analysis (BET), and thermal gravimetrical analysis (TGA). The resulting bio-MOF has a large surface area (180.43 m2 g−1) and large mesopore volume (0.144 cm3 g−1), as well as good chemical inertness and mechanical stability. The optimum dosage from the Zn L-Asp bio-MOF was 1.0 g L−1 at pH = 7 for 95.3% adsorption of 10 ppm DR-81 after 45 min. Thermodynamic analysis results demonstrated that the decontamination processes were done with spontaneous, thermodynamically, and exothermic nature onto the fabricated bio-MOF. Kinetic parameters were well-fitted with pseudo-second-order kinetics, and the adsorption process was described by the Freundlich isotherm. The adsorption data proved that Zn L-Asp bio-MOF is an effective adsorbent for DR-81 from aqueous solutions with high stability and recycling ability for eight cycles, as well as the easy regeneration of the sorbent.
1. Introduction
Water is considered one of the most essential components of this world and plays a vital role in the proper functioning of the Earth's ecosystems. Despite this, safe drinking water is not easily available in some parts of the world. The water resource value is failing exponentially according to their contamination levels. Both point and non-point sources are contaminating our water resources because of tremendous population growth, civilization, modern industrialization, domestic and agricultural activities, and other environmental, geological, and global changes. Nowadays, water pollution is the most serious issue because it affects our lives.1 However, there is a gradual decrease in water quality because of a wide range of contamination and harmful substances such as dyes, personal care products (PCPs), pharmaceuticals, and agrochemicals.2 Separate from all the other types of wastewaters, wastewater contaminated with dyes has attracted considerable recognition. Organic dyes are used enormously in different fields for coloring textiles, rubber, paper, leather, plastic, printing, etc.3 Mainly, more than 700![[thin space (1/6-em)]](https://www.rsc.org/images/entities/char_2009.gif) 000 tons of dyes are utilized in the textile industry, and they are one of the most abundant pollutants in modern times. Most of these utilized dyes are carcinogenic and teratogenic.4,5
000 tons of dyes are utilized in the textile industry, and they are one of the most abundant pollutants in modern times. Most of these utilized dyes are carcinogenic and teratogenic.4,5
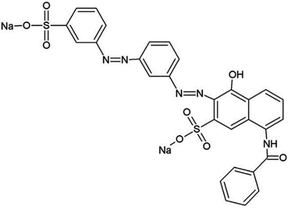
One of the hazardous dyes is Direct Red-81 (DR-81), Fig. 1, which is a sulfonated azo dye, disodium; (3E)-7-benzamido-4-oxo-3-[[4-[(4-sulfonatophenyl)diazenyl]phenyl]hydrazinylidene]naphthalene-2-sulfonate, having molecular formula C29H19N5Na2O8S2 and molecular weight 676 g mol−1. DR-81 is a toxic sulphonated azo-based anionic dye, known for its toxicity nature and carcinogenic effect on animals and humans. Furthermore, DR-81 is selected as a synthetic model for experimentation because of its wide usage in many industries.5,6
Since increasing the awareness of the dyes' hazardous nature, scientists have worked hard to overcome this obstacle problem, and accordingly, they have developed numerous chemical, physical and biological methods for wastewater treatment. These techniques include flocculation, photocatalysis, adsorption, coagulation, biodegradation, electrochemical process, separation using membranes, advanced oxidation, and ion-exchange processes.7 The adsorption process is one of the most suitable techniques, which is regularly used for the remediation of wastewater contaminated with dyes due to the flexibility, low-cost treatment, and high effectiveness of this route.8 Traditional adsorbent materials have some limitations in their application, such as poor adsorbing capacity or difficulty being separated. There was a need for an efficient and cost-effective adsorbent that possesses a large capacity, easy separation, and fast uptake rate that could remove organic dyes such as DR-81 from wastewaters.9
Metal–organic frameworks (MOFs) are infinite crystalline materials composed of metal clusters bonded to organic ligands. The key characteristic advantage of MOFs is that they have a porous and flexible structure due to their chemical structure and tenability.4 MOFs have found uses in adsorption, gas storage, catalysis, and other industrial applications. MOFs that contain biomolecule ligands are called bio-MOFs, and they represent an overlap between material, inorganic and medicinal sciences, so that a porous framework can be used for biologically relevant purposes.10
Amino acid biomolecules are considered one of the most important bio-ligands in bio-MOF formulations among all of the other biomolecules. They consist of the smallest functional units of proteins, which are responsible for their interactions with other molecules through weak non-covalent interactions. The existed carboxylate and amino groups act like metal chelation/complexing sites. In addition, amino acids have many functional side groups with different natures, such as charged, aromatic/aliphatic, or hydrophobic/hydrophilic moieties, which are utilized as binding sites for metal ions and aid in maintaining protein functions.11 Numerous MOFs preparations with different metal ions have been formulated from different amino acids such as L-tryptophan,12 L-glutamic acid,13 L-glutamine,14 L-alanine,15 L-tyrosine,16 L-serine,17 L-glycine,18 L-histidine,19 and L-aspartic acid.20
In this study, L-aspartic acid has been chosen as a natural organic ligand (bio-ligand) (NH2CH(COOH)CH2COOH, aspH2) and zinc metal which displays multiple coordination metal geometries to prepare the targeted bio-MOF. Zinc metal generally reacts with aspartic acid to form a crystalline 1-dimensional chain, in which the Zn atom is linked with an oxygen atom of the carboxylate functional group involved in the 6-membered chelation formation.21
In this research area, we aim to design highly efficient compatible adsorbent bio-MOF with no toxicity, excellent moisture stability, and a low-cost preparation method. Additionally, the present investigation is aimed to study the kinetics and adsorption isotherms of the adsorption of DR-81 with an objective to reach the optimum conditions for the dye removal using the prepared Zn L-Asp bio-MOF with high reusability and a meager cost compared to other MOFs.
2. Experimental
2.1 Materials
L-Aspartic acid (L-AA, 98%, Fisher), zinc carbonate basic ([ZnCO3]2·[Zn(OH)2] 98%, Merck), methanol (HPLC grade, Fisher), ethanol (HPLC grade, Fisher), sodium hydroxide (NaOH, 99%, Merck), hydrochloric acid (HCl, 36.5%, Sigma Aldrich) were used as received. DR-81 (50% dye content, M.Wt = 675.60 g mol−1) was procured from Sigma-Aldrich.2.2 Synthesis of Zn L-Asp bio-MOF
In a round-bottomed flask, L-aspartic acid (1 g, 7.51 mmol) was dissolved in a 100 mL water/methanol mixture (34/66 mL, respectively) at 500 rpm stirring. 1 M NaOH solution was added dropwise until complete dissolution of L-aspartic acid, and the pH of the solution was adjusted to 7.0 using 1 M HCl solution. ZnCO3 basic was added (0.85 g, 7.51 mmol by Zn). The resulting mixture was refluxed for 8 h, to yield a white crystalline powder. After cooling down to room temperature, the precipitate was collected by centrifugation at 6000 rpm for 10 min. Afterward, the crystalline powder was washed three times with deionized water followed by water/ethanol several times. In the end, the precipitate was soaked in pure ethanol for 12 h then it was collected by centrifugation, and subsequently dried at 70 °C for 12 h yielding Zn–L-aspartic MOF as a white powdered material.2.3 Determination of the point of zero charge
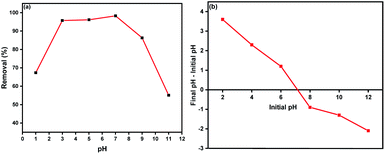
The point of zero charge (pHPZC) of the Zn L-Asp bio-MOF adsorbent was measured using the pH drift method.22 The pHPZC of the adsorbed bio-MOF was determined by adding 20 mL of 0.05 mol L−1 NaCl to several 50 mL flasks. A range of the NaCl solutions with different initial pH (pHi) values was prepared from 2 to 12 by adding 0.1 mol L−1 of HCl and NaOH. The total volume of the solution in each flask was completed to 30 mL by further addition of 0.05 mol L−1 NaCL solution. 50 mg of Zn L-Asp bio-MOF powder was added to each flask. The suspension was stirred at 400 rpm at 298 K. After two days, the suspensions were centrifuged at 10![[thin space (1/6-em)]](https://www.rsc.org/images/entities/char_2009.gif) 000 rpm for 10 min and the final pH (pHf) values of the separated supernatants liquid were recorded. The value of pHZPC can be detected from the curve at the point where the curve of ΔpH (pHf–pHi) versus pHi crosses the line equal to zero.22
000 rpm for 10 min and the final pH (pHf) values of the separated supernatants liquid were recorded. The value of pHZPC can be detected from the curve at the point where the curve of ΔpH (pHf–pHi) versus pHi crosses the line equal to zero.22
2.4 Characterization of Zn L-Asp bio-MOF
FT-IR spectra of Zn L-Asp bio-MOF were recorded in the wavenumber range of 4000–500 cm−1 using PerkinElmer Spectrum, and the average of four internal scans was collected by attenuated total reflection (ATR) method. X-ray powder diffraction (XRD) pattern of the Zn L-Asp bio-MOF was recorded by Shimadzu XRD-6100 with Cu–Kα radiation (λ = 1.54 Å) at 30 kV and 30 mA. The prepared nanopowder material was placed into a flat aluminium holder. The scan velocity was fixed at 2° min−1 from 5° to 80°. The chemical states of the prepared Zn L-Asp bio-MOF were assessed using X-ray photoelectron spectroscopy (XPS, Thermo Fisher Scientific, USA) analysis with an X-ray Al kα radiation source was used. The scanning electron microscope (SEM, JEOL JSM 6010LV) was used for surface characterization of Zn L-Asp bio-MOF morphology. For this purpose, a certain amount of the dried sample was mounted on SEM stubs and sputtered with platinum/palladium alloy coating source using auto fine coater (JEOL, JEC-3000FC), and the imaging was performed under vacuum at 20.00 kV operation voltage. For obtaining high-resolution images, field emission transmission electron microscopy (TEM, JEOL JEM-2100F) equipped with energy-dispersive X-ray spectroscopy (EDX, Oxford instrument X-Max, 80 mm2) was used to specify the chemical composition of the prepared Zn L-Asp bio-MOF. The surface area measurements and the pore size distribution of the prepared bio-MOF were calculated using Belsorp-max automated apparatus after degassing the material at 70 °C for 12 h before the measurements. The thermal behaviour was characterized by a thermogravimetric analyzer (TGA, SII 6300, Exstar). Briefly, specific amounts of Zn L-Asp bio-MOF sample were placed into TGA pans and heated up to 1000 °C underflow of N2 gas with a 10 °C min−1 heating rate.2.5 Batch adsorption for water purification
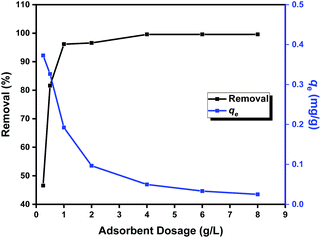
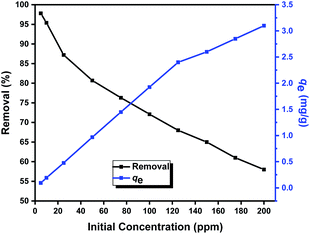
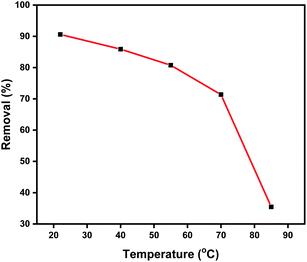
The adsorption performance of the prepared Zn L-Asp bio-MOF towards DR-81 dye as a water pollutant was performed using the batch technique. 10 mg of bio-MOF was mixed with 100 mL from the DR-81 solution at various initial concentrations at 20 °C with 400 rpm stirring using a shaking incubator. The adsorption performance of the Zn–L-aspartic MOF was studied through several processing parameters, including contact time (0–180 min), pH (1–11), adsorbent dosage (0.25–8 g L−1), initial concentration of the pollutant (5–100 mg L−1), and reaction temperature (20–85 °C). All the adsorption experiments were done in triplicate, and the mean values were utilized in data analysis processes to confirm reliability. After finishing the treatment process, the final pollutant concentration was determined by separating the precipitated adsorbent material by centrifugation and through the colorimetric method using a UV spectrophotometer at 465 nm. The percentage of the pollutant removal by Zn L-Asp bio-MOF was calculated from (eqn (1)):23| Removal% = ((C0 − Ce)/C0) × 100 | (1) |
| qe = V(C0 − Ce)/m | (2) |
2.6 Equilibrium, kinetics, and thermodynamics adsorption behaviour of Zn L-Asp bio-MOF
Thermodynamic parameters regarding the adsorption process of DR-81 dye were evaluated. Moreover, the equilibrium behaviour of the adsorption processes was tested using Langmuir, Freundlich, and Temkin isotherm models to identify the relationship between adsorption of DR-81 onto Zn L-Asp bio-MOF and its equilibrium concentration in water. In the Langmuir model, the adsorption is supposed to be monomolecular and occur only on a homogeneous surface with all the adsorption sites giving identical affinities for the adsorbate, while for the Freundlich isotherm model, the adsorption is often applicable to a heterogeneous surface with multilayer adsorption (eqn (3) and (4)).25| Ce/qe = 1/qmK + Ce/qm | (3) |
log![[thin space (1/6-em)]](https://www.rsc.org/images/entities/char_2009.gif) qe = log qe = log![[thin space (1/6-em)]](https://www.rsc.org/images/entities/char_2009.gif) KF + 1/nF KF + 1/nF![[thin space (1/6-em)]](https://www.rsc.org/images/entities/char_2009.gif) log log![[thin space (1/6-em)]](https://www.rsc.org/images/entities/char_2009.gif) Ce Ce
| (4) |
qe = B![[thin space (1/6-em)]](https://www.rsc.org/images/entities/char_2009.gif) ln ln![[thin space (1/6-em)]](https://www.rsc.org/images/entities/char_2009.gif) A + B A + B![[thin space (1/6-em)]](https://www.rsc.org/images/entities/char_2009.gif) ln ln![[thin space (1/6-em)]](https://www.rsc.org/images/entities/char_2009.gif) Ce Ce
| (5) |
For investigating the nature of adsorption processes, the kinetics of DR-81 adsorption onto Zn L-Asp bio-MOF was analysed using both pseudo-first-order and pseudo-second-order kinetic models. The pseudo-first-order kinetic model (eqn (6)):
ln(qe − qt) = ln![[thin space (1/6-em)]](https://www.rsc.org/images/entities/char_2009.gif) qe − k1t qe − k1t
| (6) |
The pseudo-second-order constants were calculated from (eqn (7)).
| t/qt = (1/k2q2) + t/q | (7) |
qt = α + β![[thin space (1/6-em)]](https://www.rsc.org/images/entities/char_2009.gif) ln ln![[thin space (1/6-em)]](https://www.rsc.org/images/entities/char_2009.gif) t t
| (8) |
![[thin space (1/6-em)]](https://www.rsc.org/images/entities/char_2009.gif) t using the slope and the intercept.
t using the slope and the intercept.
2.7 Reusability of the prepared Zn L-Asp bio-MOF
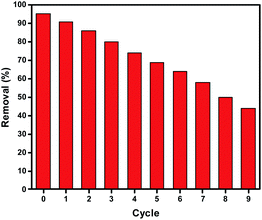
For improving the economic feasibility of the processes which are used for water treatment, the utilized Zn L-Asp bio-MOF adsorbate material was regenerated ten times. For this purpose, 0.5 g of Zn L-Asp bio-MOF was suspended in 100 mL from 0.01 M NaOH solution and stirred at 300 rpm for 24 h. The regenerated materials were washed with deionized water twice and at the end with ethanol, then dried at 70 °C overnight for further reuse.3. Results and discussion
3.1 Characterization of the synthesized Zn L-Asp bio-MOF
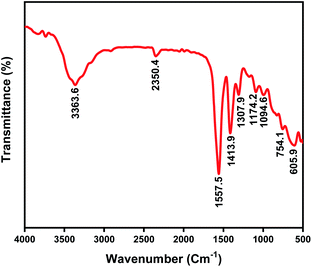
In the FT-IR spectrum of Zn L-Asp MOF, the peak at 1413 cm−1 is attributed to COOH stretching vibrations. In addition, the FT-IR peak recorded around 1557 cm−1 is assigned to N–H bending frequencies of NH2 groups, while the peaks appearing at 1174 and 1094 cm−1 are attributed to NH2 rocking modes. The appearance of the band at 3363 cm−1 may be attributed to N–H stretching modes, suggesting that the amino N atom is also coordinated with the metal ion.27 FT-IR peaks observed at around 606, 754, and 2922 cm−1, represent the bonding between Zn–O and C–H![[thin space (1/6-em)]](https://www.rsc.org/images/entities/char_2009.gif) 28 (Fig. 2).
28 (Fig. 2).
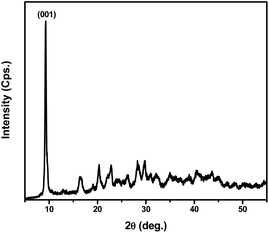
XRD pattern of the Zn L-Asp MOF is provided in Fig. 3. It displays the main sharp peak at 2θ 9.28°, which is assigned to the (001) plane. The intense diffraction peaks in Fig. 3, suggest the presence of good crystallinity in Zn L-Asp MOF coordination. Moreover, the relative diffraction intensities and peak positions of the Zn L-aspartic MOF sample were identical to those reported in the literature.21
The chemical states of Zn L-Asp bio-MOF are investigated by XPS (Fig. 4a), indicating that the elements of Zn, C, O, and N are existing in Zn L-Asp bio-MOF. The XPS spectra of C 1s at 284.8, 286.6, and 288.8 eV were related to the C–C, C–O, and C![[double bond, length as m-dash]](https://www.rsc.org/images/entities/char_e001.gif) O bonds in the Zn L-Asp bio-MOF (Fig. 4b). As shown in Fig. 4c, the Zn 2p spectra had two main characteristic peaks at 1045.5 and 1022.4 eV, which could be related to Zn 2p1/2 and Zn 2p3/2, respectively. The N 1s peak (Fig. 4d) was observed at 401.2 and 398.5. The XPS spectra show binding energy of O 1s (Fig. 4e) was split into three peaks at 532.4 eV (C–O), 531.2 eV (C
O bonds in the Zn L-Asp bio-MOF (Fig. 4b). As shown in Fig. 4c, the Zn 2p spectra had two main characteristic peaks at 1045.5 and 1022.4 eV, which could be related to Zn 2p1/2 and Zn 2p3/2, respectively. The N 1s peak (Fig. 4d) was observed at 401.2 and 398.5. The XPS spectra show binding energy of O 1s (Fig. 4e) was split into three peaks at 532.4 eV (C–O), 531.2 eV (C![[double bond, length as m-dash]](https://www.rsc.org/images/entities/char_e001.gif) O), and 530.1 eV (Zn–O). These results give good agreement with results reported previously.29
O), and 530.1 eV (Zn–O). These results give good agreement with results reported previously.29
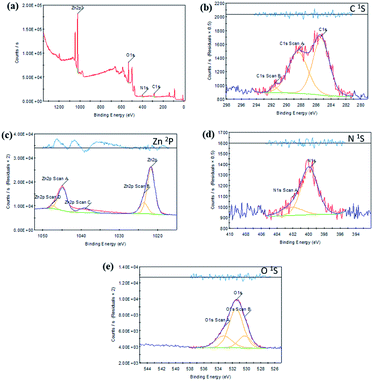 | ||
| Fig. 4 XPS analysis of Zn L-Asp bio-MOF (a) different elements, (b) C 1s, (c) Zn 2p, (d) N 1s, and (e) O 1s. | ||
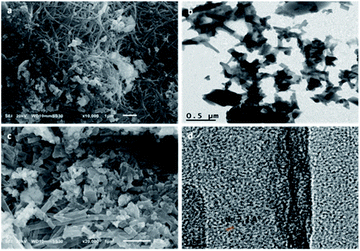
The morphological structure of the Zn L-Asp bio-MOF was analysed by both SEM and TEM shown in Fig. 5a, c and b, d, respectively. The SEM micrographs show that the fabricated Zn L-Asp bio-MOF have rod-like or fibre-like morphologies with an average diameter of 44 nm, which can be more visibly realized from close-up SEM images (at 200![[thin space (1/6-em)]](https://www.rsc.org/images/entities/char_2009.gif) 00× magnifications) given in Fig. 5c. However, TEM analysis shows more in-depth detailed topography of the fabricated Zn L-Asp bio-MOF, and the nano-rod crystallinity was revealed from the HR-TEM image (Fig. 5d), with interplanar distance d of 0.22 nm. Consequently, the fabricated Zn L-Asp bio-MOF produced from the refluxing system was uniformly distributed with nano-rods morphological structure.
00× magnifications) given in Fig. 5c. However, TEM analysis shows more in-depth detailed topography of the fabricated Zn L-Asp bio-MOF, and the nano-rod crystallinity was revealed from the HR-TEM image (Fig. 5d), with interplanar distance d of 0.22 nm. Consequently, the fabricated Zn L-Asp bio-MOF produced from the refluxing system was uniformly distributed with nano-rods morphological structure.
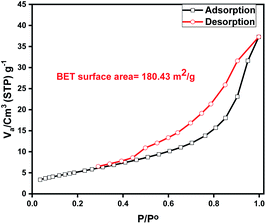
The porous properties and pore structure of particles of Zn L-Asp bio-MOF were investigated by the Brunauer–Emmett–Teller (BET) as shown in Fig. 6. The N2 adsorption–desorption isotherm was type IV, showing a broad hysteresis loop in the relative pressure (p/p0) range of 0.4 to 0.9, which confirms the mesoporosity of Zn L-Asp bio-MOF had an average surface area and total pore volume of were determined to be 180.43 m2 g−1 and 0.114 cm3 g−1, respectively. The large specific surface area and high porosity could provide multiple access channels for DR-81 adsorption.30,31
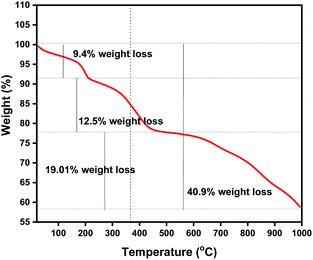
In order to investigate the thermal stability of the fabricated Zn L-Asp bio-MOF, thermogravimetric analysis was applied in a nitrogen atmosphere. Various weight-loss degradation steps were observed, as shown in Fig. 7. The thermogram shows three different regions: (1) the first mass loss (9.4%) region between 30 and 250 °C indicating the loss of moisture; (2) the region between 250 and 500 °C with a slow loss of mass of 12.5% is related to the oxidation of Zn2+ (3) the region between 500 and 1000 °C with a slow loss of mass of 19.01% is related to the decomposition of the framework to ZnO + (organics), this loss of mass is completed and almost stable up to 1000 °C.1,5 The stable residue was 58.8% of the original mass. These data indicate that the synthesized bio-MOF has excellent thermal stability compared to other MOF materials used in wastewater treatment processes.
3.2 Adsorption of DR-81 dye onto Zn L-Asp bio-MOF
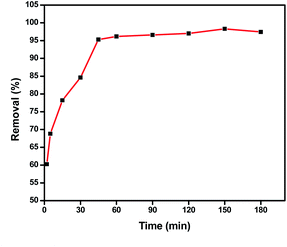
The feasibility of Zn L-Asp bio-MOF was tested to adsorb DR-81 from wastewater via batch technique.Three kinetic models were applied to study the adsorption process. The obtained results for the comparable correlation coefficient values for linear plots of the three studied kinetic models for adsorption DR-81 ions onto Zn L-Asp bio-MOF from aqueous solutions are tabulated in Table 1. It was indicated that the linearity of plotting t/qt versus time gives high correlation coefficient values for DR-81 pollutant (R2 = 0.998), indicating that the adsorption processes onto Zn L-Asp bio-MOF follow the second-order rate kinetic model.33 Moreover, as evident from the table, it is found that the calculated value of qe for the pseudo-second-order model is very close to the experimental value. These results confirm that DR-81 adsorption processes were mainly controlled via a pseudo-second kinetic model for the different studied water pollutants.5
| Isotherms | Parameters | Values |
|---|---|---|
| Pseudo-first order | qexp (mg g−1) | 27.14 |
| qtheor (mg g−1) | 19.22 | |
| K1 (min−1) | 0.02 | |
| R2 | 0.938 | |
| Pseudo-second order | qexp (mg g−1) | 27.14 |
| qtheor (mg g−1) | 28.86 | |
| K2 (g mg−1 min−1) | 0.0014 | |
| R2 | 0.998 | |
| Elovich kinetic model | qexp (mg g−1) | 27.14 |
| α (mg mg−1 min−1) | 101.05 | |
| β (g mg−1) | 16.31 | |
| R2 | 0.968 |
3.3 Thermodynamics parameters of the adsorption process
For investigating the adsorption processes nature, standard free energy (ΔG°), changes in enthalpy (ΔH°), and entropy (ΔS°) as different thermodynamic parameters should be determined. The standard enthalpy and entropy values can be calculated from the following eqn (9)–(11);36
ΔG = −RT![[thin space (1/6-em)]](https://www.rsc.org/images/entities/char_2009.gif) ln ln![[thin space (1/6-em)]](https://www.rsc.org/images/entities/char_2009.gif) Kd Kd
| (9) |
| ΔG° = ΔH° − TΔS° | (10) |
 | (11) |
![[thin space (1/6-em)]](https://www.rsc.org/images/entities/char_2009.gif) Kd versus 1000/T was represented as a straight line with an acceptable value of R2. ΔH° and ΔS° values can be determined from the plot slope and the intercept, respectively. All the data are tabulated in Table 2. The negative values of ΔG° designate the thermodynamically and spontaneous nature of DR-81 decontamination processes onto Zn L-Asp bio-MOF. On the contrary, the negative values of enthalpy illustrate the exothermic nature of the adsorption processes. However, the negative entropy value change, ΔS°, indicates that the activation stage is more ordered. A negative value of ΔS° suggests that the adsorption process mechanism involves an associative mechanism.25,37
Kd versus 1000/T was represented as a straight line with an acceptable value of R2. ΔH° and ΔS° values can be determined from the plot slope and the intercept, respectively. All the data are tabulated in Table 2. The negative values of ΔG° designate the thermodynamically and spontaneous nature of DR-81 decontamination processes onto Zn L-Asp bio-MOF. On the contrary, the negative values of enthalpy illustrate the exothermic nature of the adsorption processes. However, the negative entropy value change, ΔS°, indicates that the activation stage is more ordered. A negative value of ΔS° suggests that the adsorption process mechanism involves an associative mechanism.25,37
| Temp. (K) | 1000/T | Ke | ln![[thin space (1/6-em)]](https://www.rsc.org/images/entities/char_2009.gif) Ke Ke |
ΔG° (kJ mol−1) | ΔH° (kJ mol−1) | ΔS° (J mol−1 K−1) |
|---|---|---|---|---|---|---|
| 293 | 3.41 | 1.93 | 0.66 | −1.60 | −34.73 | −110.46 |
| 313 | 3.19 | 1.22 | 0.20 | −0.51 | ||
| 328 | 3.05 | 0.84 | −0.17 | −0.47 | ||
| 343 | 2.92 | 0.50 | −0.69 | −1.98 | ||
| 358 | 2.79 | 0.11 | −2.21 | −6.57 |
3.4 Equilibrium isotherm analysis for adsorption of DR-81 anionic dye
There are three equilibrium models that are usually used for studying the adsorption processes on different substrates.38–40 Making a comparison between the linearization fittings of the three models in Table 3, it was found that the Freundlich model is the most fitted model for representing the pollutant adsorption processes onto Zn L-Asp bio-MOF. Meanwhile, the Freundlich adsorption intensity (nF) recorded 0.815 for adsorption DR-81, which is less than unity, demonstrating that the decontamination processes on Zn L-Asp bio-MOF are favourable. Therefore, the Freundlich model is the best favourable model for the description of the multilayer adsorption of DR-81 on the Zn L-Asp bio-MOF surface.| Isotherm model | Parameters | Values |
|---|---|---|
| Freundlich | KF (mg g−1)(L mg−1)1/n | 0.5337 |
| 1/nF | 1.23 | |
| R2 | 0.993 | |
| Langmuir | qm (mg g−1) | 29.152 |
| kL (L mg−1) | 0.122 | |
| R2 | 0.713 | |
| Temkin | A (L g−1) | 2.787 |
| B (J mol−1) | 7.197 | |
| R2 | 0.948 |
The Langmuir model constants and the correlation coefficients are illustrated in Table 3. Comparing the correlation coefficient of the Langmuir and Temkin models with that of Freundlich, it is obvious that the equilibrium data of the DR-81 sorption process on to Zn L-Asp bio-MOF follows the latter model to a great extent.
3.5 Adsorption capacity comparison for the fabricated Zn L-Asp bio-MOF with other adsorbent materials
The multilayer adsorption capacities (qm) of Zn L-Asp bio-MOF towards DR-81 were compared with the adsorption capacities of the other similar adsorbent materials as listed in Table 4. It is evident from the table that Zn L-Asp bio-MOF has economic and promising results for the adsorption of anionic dyes like DR-81 compared with the literature on adsorbent nanomaterials.| Pollutant | Adsorbent material | Optimized conditions | Optimum pH | Adsorption capacity (mg g−1) | Estimated price | References |
|---|---|---|---|---|---|---|
| DR-81 | Zn L-Asp bio-MOF | Dose = 1 g L−1 | 7 | 29.15 | 79.27 $ per kg | Present study |
| Conc. = 10 mg L−1 | ||||||
| Time = 10 min | ||||||
| MIP-202 Zr-MOF | Dose = 1 g L−1 | 5 | 36.07 | 36 $/100 g | 5 | |
| Conc. = 10 mg L−1 | ||||||
| Time = 12 min | ||||||
| Kaolinite | Dose = 4 g L−1 | 2 | 26.55 | ND | 41 | |
| Conc. = 50 mg L−1 | ||||||
| Time = 120 min | ||||||
| Neem bark | Dose = 0.25 g L−1 | 2 | 8.40 | ND | 42 | |
| Conc. = 50 mg L−1 | ||||||
| Time = 50 min | ||||||
| Potato peel | Dose = 0.25 g L−1 | 2 | 10.40 | ND | 42 | |
| Conc. = 50 mg L−1 | ||||||
| Time = 50 min |
3.6 Adsorption mechanism of DR-81 onto Zn L-Asp bio-MOF
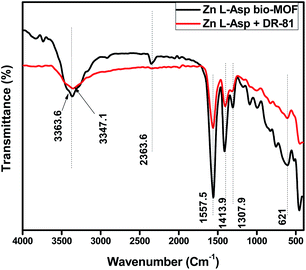
The resulted data of FTIR spectra before and after adsorption of DR-81 were compared as shown in Fig. 13. It was evident that there are no significant changes in the FTIR spectrum of the Zn L-Asp bio-MOF after and before DR-81 dye adsorption that confirm that there is no chemical interaction between the Zn L-Asp bio-MOF and the anionic dyes. These results evident that the removal of DR-81 dye onto the surface of Zn L-Asp bio-MOF is regarded to the electrostatic physical interactions between the anionic dye and the bio-MOF.43 Furthermore, the characteristic peaks at 3363 cm−1 of asymmetric and symmetric vibrations were shifted to 3347 cm−1, confirming the interaction between the –COOH carboxylic group and the negatively characteristic sulphate groups of dye pollutant at the neutral conditions.1,44 Comparing the FTIR spectrums of both Zn L-Asp bio-MOF after and before anionic dye adsorption at the neutral conditions, the characteristic bands from 528 to 412 cm−1 referring to the Zn–O stretching were presented at the two spectra. This may indicate the existence of Zn in the structure of the bio-MOF without leaching or interaction.45,46 These results demonstrate that the mechanism of DR-81 adsorption onto Zn L-Asp bio-MOF may be classified as physical interaction between the adsorbent material and the adsorbate. This expectation was proven through the equilibrium analysis of the adsorption data, as it was confirmed that the adsorption process follows the Freundlich isotherm and the multilayer adsorption mechanism is the predominant adsorption phenomena confirming the physical interaction between the dye molecules and the prepared bio-MOF. Moreover, at the acidic condition's solution pH < 7, the degree of positively charges improved onto the bio-MOF enhances the electrostatic interaction of negatively DR-81 dye molecules besides the neutralization of the negative dye molecules that may be occurred at the acidic conditions that improve the dye removal at the acidic conditions confirming the adsorption profile of the DR-81 dye molecules onto Zn L-Asp bio-MOF at various pH.3.7 Reusability study
The adsorption–desorption cycles were repeated ten times. According to the obtained results, the Zn L-Asp bio-MOF proved good ability to be reused eight times with an acceptable removal efficiency for DR-81, as shown in Fig. 14.3.8 Cost of the fabricated Zn L-Asp bio-MOF
Cost is one of the most important factors when it comes to evaluating the potential of an adsorbent for practical and large-scale use, especially since this bio-MOF is an eco-friendly and biocompatible material as compared to the majority of other MOFs which are not based on the bio-based ligand. Organic ligands mainly have the major cost of the prepared MOF. For instance, one of the MOFs which is used as a promising adsorbent such as Mg-MOF-74 costs (2836 $ per kg) despite, it is not an eco-friendly MOF.47 On the other hand, Zn L-Asp bio-MOF could barely cost (79.27 $ per kg) with an excellent adsorption performance which makes it a promising nanomaterial for practical and manufacturing applications. The estimated cost to produce 1 kg of the Zn L-Asp bio-MOF is calculated in Table 5. The price of reactants has been collected according to the quantities of the starting precursors. Most price data were provided from J&K Scientific Co., Ltd's official website.48| Reactant | Reactant weight per package | Reactant price per package ($) | Reactant required weight to be reacted | Estimated reactants price for reaction ($) |
|---|---|---|---|---|
| L-Aspartic acid | 2.5 kg | 67.45 | 434.78 g | 11.73 |
| Methanol | 5.0 L | 35.52 | 2.86 L | 20.31 |
| Sodium hydroxide | 2.5 kg | 18.89 | 173.91 g | 1.31 |
| Zinc carbonate basic | 1.0 kg | 99.39 | 369.56 g | 36.73 |
| Hydrochloric acid | 1.0 L | 104.92 | 40 mL | 4.19 |
| Energy and electricity consumption | 5 $ | |||
| Total estimated price to produce 1 kg of Zn L-Asp bio-MOF = 79.27 $ | ||||
4. Conclusions
In conclusion, we report herein for the first time an efficient adsorbent porous zinc aspartate MOF comprising non-toxic metal ions (Zn(II)) and a biocompatible, and cheap linker, aspartic acid. The synthesized Zn L-Asp bio-MOF was characterized using FT-IR, XRD, XPS, SEM, TEM, BET, and TGA. Zn L-Asp bio-MOF is non-toxic and environmentally benign. Furthermore, the adsorption behaviour of DR-81 was well fitted with the Freundlich model that demonstrated the multilayer adsorption onto Zn L-Asp bio-MOF. The best kinetic model for adsorption was a pseudo-second-order model. The maximum adsorption capacity of the prepared Zn L-Asp bio-MOF toward DR-81 was 29.1 mg g−1. In addition, it can be considered an effective and promising adsorbent in the adsorption of DR-81 from aqueous solutions with high stability and it can be recycled for eight cycles, as well as being easily regenerated form of the sorbent.Author contributions
All authors contributed to the design of experiments. Eslam Salama and Mohamed Ghanim performed the experimental work and the writing of the article. Hassan Shokry Hassan, Wael A. Amer, and Ahmed H. El-Shazly analysed the characterization data. El-Zeiny M. Ebeid, Mona Ossman, and Marwa F. Elkady reviewed and edited the manuscript.Conflicts of interest
There are no conflicts of interest to declare.Acknowledgements
This paper is based upon work supported by Science, Technology & Innovation Funding Authority (STDF) under a grant (STDF 43565).Notes and references
- K. E. Diab, E. Salama, H. S. Hassan, A. A. El-moneim and M. F. Elkady, Polymers, 2021, 13, 3869 CrossRef CAS PubMed.
- A. Priya, L. Gnanasekaran, S. Rajendran, J. Qin and Y. Vasseghian, Environ. Res., 2022, 204, 112298 CrossRef CAS PubMed.
- A. Elgarahy, K. Elwakeel, S. Mohammad and G. Elshoubaky, Cleaner Engineering and Technology, 2021, 4, 100209 CrossRef.
- M. S. Khan, M. Khalid and M. Shahid, Mater. Adv., 2020, 1, 1575–1601 RSC.
- K. E. Diab, E. Salama, H. S. Hassan, A. Abd El-moneim and M. F. Elkady, Sci. Rep., 2021, 11, 1–13 CrossRef PubMed.
- S. Khamparia and D. Jaspal, Sustainable Environ. Res., 2016, 26, 117–123 CrossRef CAS.
- T. Ngulube, J. R. Gumbo, V. Masindi and A. Maity, J. Environ. Manage., 2017, 191, 35–57 CrossRef CAS PubMed.
- R. S. Dassanayake, S. Acharya and N. Abidi, Molecules, 2021, 26, 4697 CrossRef CAS PubMed.
- X. Zhao, S. Liu, Z. Tang, H. Niu, Y. Cai, W. Meng, F. Wu and J. P. Giesy, Sci. Rep., 2015, 5, 1–10 CAS.
- I. Tibbetts and G. E. Kostakis, Molecules, 2020, 25, 1291 CrossRef CAS PubMed.
- H. M. Pérez-Cejuela, J. M. Herrero-Martínez and E. F. Simó-Alfonso, Molecules, 2020, 25, 4216 CrossRef PubMed.
- G. S. Jeong, A. C. Kathalikkattil, R. Babu, Y. G. Chung and D. W. Park, Chin. J. Catal., 2018, 39, 63–70 CrossRef CAS.
- M. Can, S. Demirci, A. K. Sunol and N. Sahiner, Microporous Mesoporous Mater., 2020, 309, 110533 CrossRef CAS.
- J. M. Schveigkardt, A. C. Rizzi, O. E. Piro, E. E. Castellano, R. C. d. Santana, R. Calvo and C. D. Brondino, Eur. J. Inorg. Chem., 2002, 2002, 2913–2919 CrossRef.
- F. Luo, Y.-t. Yang, Y.-x. Che and J.-m. Zheng, CrystEngComm, 2008, 10, 1613–1616 RSC.
- B. Zhou, N. J. Silva, F. N. Shi, F. Palacio, L. Mafra and J. Rocha, Eur. J. Inorg. Chem., 2012, 2012, 5259–5268 CrossRef CAS.
- Y.-X. Tan, Y.-P. He and J. Zhang, Inorg. Chem., 2011, 50, 11527–11531 CrossRef CAS PubMed.
- K. Stenzel and M. Fleck, Acta Crystallogr., Sect. E: Struct. Rep. Online, 2004, 60, m1470–m1472 CrossRef CAS.
- J. H. Zhang, R. Y. Nong, S. M. Xie, B. J. Wang, P. Ai and L. M. Yuan, Electrophoresis, 2017, 38, 2513–2520 CrossRef CAS PubMed.
- S. Wang, M. Wahiduzzaman, L. Davis, A. Tissot, W. Shepard, J. Marrot, C. Martineau-Corcos, D. Hamdane, G. Maurin and S. Devautour-Vinot, Nat. Commun., 2018, 9, 1–8 CrossRef PubMed.
- J. A. Gould, J. T. Jones, J. Bacsa, Y. Z. Khimyak and M. J. Rosseinsky, Chem. Commun., 2010, 46, 2793–2795 RSC.
- M. El Haddad, R. Mamouni, N. Saffaj and S. Lazar, J. Assoc. Arab Univ. Basic Appl. Sci., 2012, 12, 48–54 CAS.
- H. Shokry, M. Elkady and E. Salama, Sci. Rep., 2020, 10, 1–17 CrossRef PubMed.
- M. F. Elkady, H. S. Hassan, W. A. Amer, E. Salama, H. Algarni and E. R. Shaaban, Materials, 2017, 10, 1355 CrossRef PubMed.
- M. Elkady, E. Salama, W. A. Amer, E.-Z. M. Ebeid, M. M. Ayad and H. Shokry, Environ. Sci. Pollut. Res., 2020, 27, 43077–43092 CrossRef CAS PubMed.
- H. Freundlich, Zeitschrift für physikalische Chemie, 1907, 57, 385–470 CrossRef CAS.
- G. Gizer, M. Sahiner, Y. Yildirim, S. Demirci, M. Can and N. Sahiner, Curr. Res. Green Sustainable Chem., 2021, 4, 100110 CrossRef.
- D. Nipane, S. Thakare and N. Khati, J. Catal., 2013, 2013, 940345 Search PubMed.
- Y.-p. Wei, Y.-w. Zhang, J.-S. Chen, C.-j. Mao and B.-K. Jin, Microchim. Acta, 2020, 187, 1–9 CrossRef PubMed.
- M. Thommes, K. Kaneko, A. V. Neimark, J. P. Olivier, F. Rodriguez-Reinoso, J. Rouquerol and K. S. Sing, Pure Appl. Chem., 2015, 87, 1051–1069 CrossRef CAS.
- A. H. Valekar, K.-H. Cho, U.-H. Lee, J. S. Lee, J. W. Yoon, Y. K. Hwang, S. G. Lee, S. J. Cho and J.-S. Chang, RSC Adv., 2017, 7, 55767–55777 RSC.
- M. F. Elkady, H. Shokry Hassan and E. Salama, J. Eng., 2016, 2016, 2308560 Search PubMed.
- A. B. Botelho Junior, É. F. Pinheiro, D. C. R. Espinosa, J. A. S. Tenório and M. d. P. G. Baltazar, Sep. Sci. Technol., 2022, 57, 60–69 CrossRef CAS.
- M. Saghian, S. Dehghanpour and M. Sharbatdaran, RSC Adv., 2020, 10, 9369–9377 RSC.
- O. L. Uyanika, N. Bektasb and N. Uyanikb, Int. J. Appl. Eng. Res., 2018, 13, 11112–11122 Search PubMed.
- W. Huang, K. Diao, X. Tan, F. Lei, J. Jiang, B. A. Goodman, Y. Ma and S. Liu, Polymers, 2019, 11, 969 CrossRef CAS PubMed.
- T. Ngulube, J. R. Gumbo, V. Masindi and A. Maity, Clay Miner., 2019, 54, 197–207 CrossRef CAS.
- W. A. Amer, M. M. Omran, A. F. Rehab and M. M. Ayad, RSC Adv., 2018, 8, 22536–22545 RSC.
- S. Zaghlol, W. A. Amer, M. H. Shaaban, M. M. Ayad, P. Bober and J. Stejskal, Chem. Pap., 2020, 74, 3183–3193 CrossRef CAS.
- W. A. Amer, M. M. Omran and M. M. Ayad, Colloids Surf., A, 2019, 562, 203–212 CrossRef CAS.
- T. A. Khan, S. Dahiya and E. A. Khan, Environ. Prog. Sustainable Energy, 2017, 36, 45–58 CrossRef CAS.
- N. Sharma, D. Tiwari and S. Singh, Rasayan J. Chem., 2014, 7, 399–409 CAS.
- H. A. Ahsaine, Z. Anfar, M. Zbair, M. Ezahri and N. El Alem, J. Chem., 2018, 2018, 1–14 CrossRef.
- T. Hashem, A. H. Ibrahim, C. Wöll and M. H. Alkordi, ACS Appl. Nano Mater., 2019, 2, 5804–5808 CrossRef CAS.
- N. T. Nguyen, N. T. Nguyen and V. A. Nguyen, Adv. Polym. Technol., 2020, 2020, 2940 Search PubMed.
- K. Raja, P. Ramesh and D. Geetha, Spectrochim. Acta, Part A, 2014, 131, 183–188 CrossRef CAS PubMed.
- K. Vikrant, V. Kumar, K.-H. Kim and D. Kukkar, J. Mater. Chem. A, 2017, 5, 22877–22896 RSC.
- J&K Scientifc Co., L. ligand's price for some reported MOFs with excellent performance, 2022, http://www.jkchemical.com.
| This journal is © The Royal Society of Chemistry 2022 |

