 Open Access Article
Analysis of different self-propulsion types of oil droplets based on electrostatic interaction effects
Mika Noguchi *a,
Masato Yamada
 a and
Hideyuki Sawadab
aDepartment of Applied Physics, School of Advanced Science and Engineering, Waseda University, 3-4-1 Okubo, Shinjuku-ku, Tokyo 169-8555, Japan. E-mail: mika_noguchi@fuji.waseda.jp
bFaculty of Science and Engineering, Waseda University, 3-4-1 Okubo, Shinjuku-ku, Tokyo 169-8555, Japan
First published on 22nd June 2022
Abstract
This study aims to investigate electrical effects in self-propelled oil droplets and analyze the motion caused by electrical interactions between two droplets. We examine the motion of self-propelled oil droplets in terms of electrical effects; no similar analyses have been reported to date. When an oleic acid droplet is introduced into a surfactant solution, oleic acid is adsorbed at the droplet surface; as a result, the surface becomes negatively charged. However, the electrostatic interaction between oil droplets has not been studied so far. We focus on the chargeability of self-propelled oil droplets, and propose that their motion can be controlled by changing the charge state at the oil/water interface. This is realized by controlling the pH of the surfactant solution. We prepared several aqueous solutions with slightly different pH values, and introduced two oil droplets into each solution to investigate the relationship between the pH value and the correlated motion of the oil droplets. In an aqueous solution at pH 12.00, the two oil droplets showed two types of motion (follow-up and parallel motion), while in an aqueous solution at pH 12.10 they exhibited only one type of motion, i.e., repulsive motion. In order to analyze the three types of motion, we investigated electrical effects on the surface of the oil droplets. First, we measured the zeta potentials of aqueous solutions at pH 12.00 and 12.10, and analyzed the relationship between pH and charge. Furthermore, we calculated the amount of charge and the repulsive force generated on the surface of the oil droplets. For the pH 12.10 solution, the charge of one oil droplet and the repulsive force generated by the charge were found to be −30.79 pC and 282 nN, respectively. Taking into account the driving forces controlling the motion of oil droplets reported in previous studies, this repulsive force could be the driving force of the observed repulsive motion. Based on the experimental results, we inferred that the three types of self-propulsive motion were controlled by electrical effects at the oil/water interface. To further examine these motions, we analyzed the time dependences of the total distance traveled by a droplet and of the distance between oil droplets, as well as the droplet velocities and images of internal convection of oil droplets.
1. Introduction
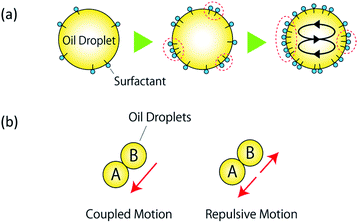
In recent years, a significant body of research has focused on “soft” robots. Owing to their very high biocompatibility, these robots are expected to be applicable in medical devices such as artificial arms and legs driven by artificial muscles and organs.1–6 Soft robotics use deformable polymeric materials7–9 and biological cells,10 generally denoted as soft matter. Because of their complex structures, structural flexibility, and internal degrees of freedom, these systems are often treated as active materials possessing dynamic properties along with chemical reactivity. Active materials exhibit internal mechanisms to convert chemical into kinetic energy, as for living cells,10 microorganisms,10 molecular motors,10–14 and non-living matter such as camphor boats15–17 and oil droplets.18–21 An oil droplet released in an aqueous solution generates a non-uniform surface tension at the interface; self-propelled motion is caused by the driving force induced by the surface tension difference between the front and the rear of the droplet.The self-propelled motion of an oil droplet can originate from the combination of a particular molecular structure and specific surfactant solution. When an anhydrous oleic acid droplet is introduced into a surfactant solution containing oleic acid, the anhydrous oleic acid is hydrolyzed to oleic acid molecules at the surface of the droplet, as shown in Fig. 1(a). Because oleic acid is a surfactant in a basic aqueous solution, this reduces the interfacial tension of the oil droplet and allows water to penetrate it. The local flow gradually merges into a Marangoni convective flow,18,22–24 which generates a constant flow on the oil droplet that causes the droplet to start self-propelling while pushing aside the surrounding water molecules.18 A single oil droplet is negatively charged25 and exhibits stochastic motions such as straight displacements, rotation, splitting, and fusion. The particle image velocimetry (PIV) method,26 which visualizes the internal Marangoni convection, has been used to analyze the stochastic behavior of oil droplets.
A pH gradient in the aqueous solution19,20,27 and an exoskeleton frame28 have been previously used to control the behavior of a single oil droplet. In the case of multiple oil droplets, Toyota et al. reported two different behaviors of a pair of 4-octylaniline droplets containing 5 mol% of amphiphilic catalyst. One behavior involved repulsive motion without fusion, whereas in the other case one oil drop showed a circular motion while the other droplet followed it.29 Caleb et al. also reported tracking and repulsive motions between droplets of 1-bromooctane and ethoxynonafluorobutane.30
The surface of anhydrous oleic acid droplets is negatively charged, owing to the adsorption of oleic acid during hydrolysis. However, the electrostatic interaction between oil droplets has not been studied so far. Moreover, the control method and experimental conditions for the correlated motion of multiple oil droplets have not yet been identified, and no previous studies have achieved control over the motion of two oil droplets, such as that illustrated in Fig. 1(b). Therefore, in this study we focus on the electrical charge of oil droplets; in particular, we attempt to control the correlated motion of two oil droplets via internal convection by altering the charge state of the oil/water interface. To the best of our knowledge, no other studies have achieved control of the behavior of oil droplets by exploiting electrostatic interaction effects. We anticipated that the charge state of the oil/water interface could be altered by changing the pH concentration of the surfactant solution. As a preliminary experiment, we prepared several surfactant solutions with different pH concentrations, and introduced two oil droplets adjacent to each other into each solution. In the aqueous solution of pH 12.00, we observed the self-propulsive motion of the two oil droplets in the same direction (Fig. 1(b)), whereas in the aqueous solution of pH 12.10 the two oil droplets exhibited self-propulsive motion in opposite directions (Fig. 1(b)). Furthermore, preliminary experiments confirmed that these two types of motions (as shown in Fig. 1) could be reproduced multiple times at a specific pH concentration. We found that the behavior of the oil droplets changed significantly as the pH of the aqueous solution changed by 0.1 units, and that their behavior could be controlled by adjusting the pH of the solution.
This study focuses on the electrical charge of oil droplets. We investigate the electrical interactions between self-propelled oil droplets, and analyze the motions induced by these effects. Moreover, we propose a method to control the behavior of oil droplets using electrostatic interactions. Furthermore, to quantitatively evaluate the influence of these interactions, we calculate the charge and repulsive force induced by oil droplets in the aqueous solution. Compared to the motion control achieved via a pH gradient and an exoskeleton frame, the advantages of the present method are that it requires no reagents and equipment other than oil droplets, it involves simple and rapid procedures, and there is no limit to the size of the area to be controlled. If such electrical control turns out to be feasible, it may enable to achieve immediate control through the on/off operation of power. On the other hand, the disadvantage of the proposed method is that it is currently impossible to control the motion of single oil droplet via electrical effects; in particular, we cannot control the direction of coupled or repulsive motions. In addition, it is necessary to set an upper limit for the solution pH, because if the pH is too high the oil droplets may separate. We believe that the present analysis of the behavior of oil droplets in terms of electrical effects will open up new avenues for the design of chemical robots and the development of new forms of energy use.
2. Proposed method and experiments
We focus on the chargeability of self-propelled oil droplets and propose to control the behavior of two oil droplets based on internal convection, by changing the charge state at the oil/water interface.First, we investigated the charge of the aqueous solutions, which affects the charge state at the oil/water interface. We measured the zeta potential of three aqueous solutions with different pH (12.00, 12.04, and 12.10). Then, we introduced two oil droplets into each of the three aqueous solutions, and analyzed the relationship between pH and droplet motion. To investigate the generated motion in detail, we conducted experiments to measure the distance traveled by each oil droplet and that between the two droplets, and we visualized the internal convection using the PIV method. The experimental methods and corresponding conditions are described below.
2.1 Zeta potential measurement
In order to test the assumption that electrostatic interactions at the oil/water interface are due to the pH concentration of the aqueous solution, we carried out zeta potential measurements to study the relationship between the pH of the solution and the electric charge. Then, based on this correlation, the charge of the oil/water interface could be adjusted by controlling the pH of the aqueous solution.The interfaces of solids, liquids, and gases in contact with aqueous solutions are often charged. The electric field due to this charge attracts ions of opposite charge from the solution side, forming a fixed ion layer, as shown in Fig. 2(a). An ion diffusion layer, in which the positive and negative ions are mixed, is formed outside the fixed layer, and the combination of these two layers is denoted as electric double layer. In addition, when a particle moves under an electric field, a shear force is applied to the surrounding ions. Then, a boundary surface (sliding surface) is generated between the ions separated from the particle in the diffusion layer and the ions accompanying the particle; the potential at this surface is called zeta potential. In this study, we used the electrophoresis method to measure the zeta potential of colloidal particles from their swimming direction and speed after applying an electric field. After injecting a surfactant solution into a sample cell in the instrument, we applied an electric field and focused a laser beam onto the electrophoresing colloidal particles. The scattered light is then shifted by the Doppler effect, by an extent proportional to the swimming speed of the particles. Therefore, the swimming speed of the colloidal particles can be determined by measuring the degree of shift of the scattered light, enabling the calculation of the zeta potential. In particular, for this calculation we used the Smoluchowski equation (eqn (1)), which can be applied when the particles are sufficiently larger than the thickness of the electric double layer. Because the mobility Up can be calculated from the electrophoresis velocity v and electric field E, the zeta potential ζ can be calculated from the dielectric constant ε and the viscosity η of the medium:
 | (1) |
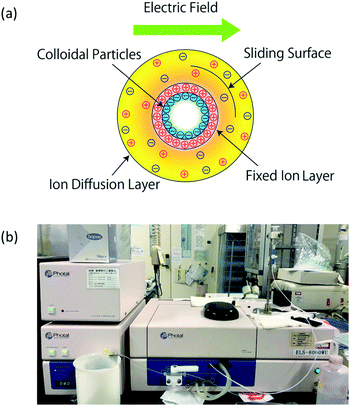 | ||
| Fig. 2 Zeta potential and measurement method. (a) Zeta potential model; (b) zeta potential measurement unit used in the experiment. | ||
Under the experimental conditions shown in Table 1, we prepared three different aqueous solutions of the surfactant, and measured the corresponding zeta potentials. We mixed 100.0 mL of pure water with 1000 μL (pH 12.00), 1175 μL (pH 12.07), and 1270 μL (pH 12.10) of 1.0 mol L−1 sodium hydroxide solution (Wako) and stirred each mixture (AS ONE, RS-6AN) for 10 min. Then, we added 0.317 mL of oleic acid (Wako) to each solution, followed by stirring (AS ONE, RS-6AN) for 10 min.
| Temperature [°C] | 25.0 |
| Humidity [%] | 60.0 |
To measure the zeta potentials, we injected these surfactant solutions into the sample cell of a flat-plate zeta potential measurement unit (OTSUKA ELECTRONICS, ELS-8000WU), as shown in Fig. 2(b). Three measurements were conducted for each of the three aqueous solutions, and the average potential and standard deviation of the three measurements were then calculated.
2.2 Experimental setup for observation of droplet behavior
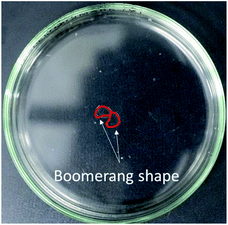
The results of the zeta potential measurements were used to analyze differences in the correlated motion of the oil droplets.We first describe the materials used in the experiments. Under the experimental conditions shown in Table 1, we prepared and mixed 0.141 mL of anhydrous oleic acid (Sigma-Aldrich) and 0.252 mL of nitrobenzene (Kanto Chemical), followed by shaking. The diameter of the oil droplet was ∼5 mm. The oil droplet was initially spherical, but slightly collapsed in the aqueous solution and was deformed into a flat shape, resembling a cylinder. When the oil droplet traveled in a straight line, it changed into a boomerang shape and moved into a convex region. The aqueous solution was the same as the one described in Section 2.1.
Under the experimental conditions shown in Table 1, this experiment was carried out in a system consisting of a Petri dish (AS ONE, 80 × 80 mm) and a single-lens reflex camera (CANON, EOS70D, 1920 × 1080 px, 30 fps), as shown in Fig. 3(a). The imaging distance was set at 25 cm. After filling 3.5 mL of surfactant solutions (pH 12.00, 12.04, and 12.10) in the Petri dish, two oil droplets of 8 μL volume were introduced into the solution using an automatic micropipette (INTEGRA, VOYAGER). As shown in Fig. 3(b), two oil droplets were dropped simultaneously at a fixed distance of 5.5 mm by using an automatic micropipette. Because the diameter of an oil droplet with a volume of 8 μL is ∼5 mm, the two oil droplets were adjacent to each other at the dropping time. In addition, the experiments confirmed that each correlated motion was generated even when the angle between the electric micropipette and the plane of the Petri dish changed. Ten measurements were conducted for each solution, and the observed movements were visually classified and recorded.
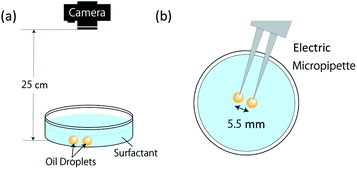 | ||
| Fig. 3 Illustration of experiment of observation. (a) Experimental system; (b) oil droplet release method. | ||
2.3 Analysis of time evolution of oil droplet locomotion
In preliminary experiments, we observed coupled motion of oil droplets in aqueous solutions with low pH, and repulsive motion in aqueous solutions with high pH. In order to investigate the two different motions in detail, we examined the temporal evolution of the total distance traveled by each oil droplet and of the distance between the two droplets until they stopped moving.The oil droplets were the same as those described in Section 2.2, and only aqueous solutions of pH 12.00 and 12.10 were used, among those discussed in Section 2.1.
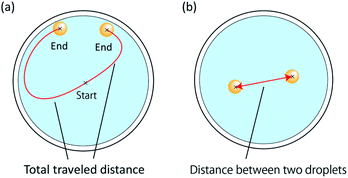
Under the experimental conditions shown in Table 1, the above measurements were performed in the system shown in Fig. 3(a). After a Petri dish (AS ONE, 80 × 80 mm) was filled with 3.5 mL of a surfactant solution (pH 12.00 and 12.10), two 8 μL oil droplets were introduced using an automatic micropipette (INTEGRA, VOYAGER). The distance between the droplets was fixed at 5.5 mm. As shown in Fig. 3(a), images of the two oil droplets undergoing coupled and repulsive motion were taken using a single-lens reflex camera (CANON, EOS70D, 1920 × 1080 px, 30 fps), and trajectory tracking was performed using an image analysis software (Kinovea). We measured the total distance traveled by the droplets and their mutual distance (Fig. 4).
2.4 PIV analysis
In order to investigate the conditions for the occurrence of the correlated motion, we quantitatively examined the effect of Marangoni convection inside an oil droplet using the PIV method. The internal convection was visualized by tracking the particles using an image analysis software.The oil droplet and aqueous solutions were the same as those described in Sections 2.2 and 2.1, respectively. First, acrylic particles (Lumisys marker, specific gravity 1.3) were mixed with the oil droplets. In order to observe the internal convection corresponding to the follow-up, parallel, and repulsive motion cases, the measurements were performed in the system shown in Fig. 3(a) under the experimental conditions listed in Table 1. After injecting 3.5 mL of surfactant solution (pH 12.00, 12.04, 12.10) in a Petri dish (AS ONE, 80 × 80 mm) with a micropipette, two 8 μL oil droplets mixed with acrylic particles were introduced using an automatic micropipette (INTEGRA, VOYAGER). The distance between the droplets was fixed at 5.5 mm. While illuminating the oil droplets with ultraviolet black light, three different self-propulsive motions were captured by a single-lens reflex camera (CANON, EOS70D, 1920 × 1080 px, 30 fps), as shown in Fig. 3(a). The images were analyzed using the Flow Expert software (Kato Optical Laboratory) to visualize the internal convection.
2.5 Analysis of oil droplet velocity
The oil droplet velocity was found to increase as the pH of the surfactant solution increased from 12.00 to 12.10. To clarify the relationship between the pH of the aqueous solution and the velocity of the oil droplet, we released a single droplet into aqueous solutions of different pH and measured the corresponding velocities.The oil droplets were the same as those described in Section 2.2, and five aqueous solutions were prepared in addition to those discussed in Section 2.1. One-hundred milliliters of pure water were mixed with 990 μL (pH 11.95), 1175 μL (pH 12.07), 1225 μL (pH 12.15), 1275 μL (pH 12.20), and 1310 μL (pH 12.30) of 1.0 mol L−1 sodium hydroxide solution (Wako) and stirred (AS ONE, RS-6AN) for 10 min. Then, we added 0.317 mL of oleic acid (Wako) to each solution and stirred (AS ONE, RS-6AN) for 10 min.
Under the conditions listed in Table 1, this experiment was performed in the system shown in Fig. 3(a). After placing 3.5 mL of surfactant solution (pH 11.95, 12.00, 12.04, 12.07, 12.10, 12.15, 12.20, and 12.30) in a Petri dish (AS ONE, 80 × 80 mm), a single oil droplet of 8 μL volume was added to the solution. As shown in Fig. 3(a), a single-lens reflex camera (CANON, EOS70D, 1920 × 1080 px, 30 fps) was used to capture the images of a self-propelled oil droplet. An image analysis software (Kinovea) was used to measure the droplet velocity. Three velocity measurements were made for each of the eight aqueous solutions, and the average and standard deviation of the three measurements were calculated.
3. Results and discussion
3.1 Zeta potential measurements
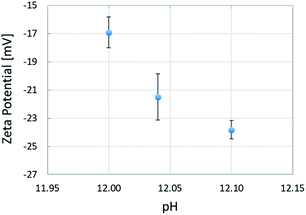
The mean zeta potentials and corresponding standard deviations are shown in Fig. 5. The mean zeta potentials obtained at pH 12.00, 12.04, and 12.10 were −16.93, −21.50, and −23.82 mV, respectively, indicating a negative correlation between the pH and the zeta potential of aqueous solutions. We found that a pH change of 0.1 units caused a change in potential of approximately 7 mV. This can be explained by Le Chatelier's principle for the acid dissociation equilibrium in eqn (2). As the pH increases, the equilibrium shifts toward the ionized products in order to increase the H+ concentration, which leads to an increase in the negative charge. Oil droplets adsorb surfactant molecules distributed in the aqueous solution on their surface. As the pH increases, the adsorption of negatively charged surfactant molecules increases, resulting in a larger negative charge induced on the oil droplet surface. The zeta potential measurements allowed us to investigate the electrical effects of the pH of the aqueous solution on the oil droplets. We found that the pH of the solution could have electrical effects on the oil droplets, because pH changes affected the charge state at the oil/water interface.| RCOOH ⇄ RCOO− + H+ | (2) |
3.2 Observation of droplet behavior
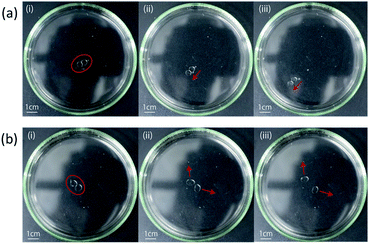
We observed two types of correlated motions in each aqueous solution: coupled and repulsive motion, as shown in Fig. 1(b). The numbers of times that each motion was observed are shown in Table 2. Images displaying coupled and repulsive motions are presented in Fig. 6.| pH | 12.00 | 12.04 | 12.10 |
|---|---|---|---|
| Coupled motion | 10 | 8 | 0 |
| Repulsive motion | 0 | 2 | 10 |
The absolute value of the zeta potential increased with increasing pH of the aqueous solution, reflecting an increase in the negative charge of oleic acid at the oil/water interface and in the aqueous solution. In addition, as the pH increased, the number of coupled motion observations decreased while that of repulsive motions increased; this suggests that the potential of the aqueous solution affected the motion of the oil droplets. Fig. 7 confirms that the droplets changed into a boomerang shape after being dropped into the solution of pH 12.10. These results suggest that the driving force for the repulsive motion may be the mutual repulsion force between droplets, due to electrostatic interactions.
When an oil droplet changes its shape due to external stimuli, it can generate internal convection to match its initial direction, as determined by its shape. Yamada et al. found that a single oil droplet changed into a boomerang shape when moving alone in a straight direction.28 They succeeded to induce only the straight motion of an oil droplet by attaching it to a frame to shape it as a boomerang. A similar argument can be applied to our study. The oil droplet was slightly distorted by electrical effects; as a result, its initial direction was determined by its shape, and internal convection was generated according to that direction. Oil droplets whose direction was determined in such a way exhibited a further increased convection; as a result, the flow on their surface increased, propelling the droplet in the opposite direction.
To quantitatively evaluate the electrostatic interaction between oil droplets, we calculated their charge Q using eqn (3), assuming that a uniform charge was induced by the zeta potential existing on the surface of the droplets. Because oil droplets showed a collapsed rather than spherical shape in aqueous solution, we performed the calculation assuming that the droplets were cylindrical conductors in these conditions; in eqn (3), ψ0 is the zeta potential, Q is the virtual charge induced by the zeta potential, ε0 denotes the dielectric constant of vacuum, εr is the relative permittivity of the solution, while L and r are the height and radius of the oil droplet, respectively. In addition, r0 indicates the point at which the potential is zero.
 | (3) |
The amount of charge induced by an oil droplet undergoing repulsive motion was calculated by eqn (3), and the results are shown in Table 3.
| Amount of charge [pC] | Repulsive force [nN] |
|---|---|
| –30.79 | 282 |
Next, assuming that the oil droplets were point charges, the Coulomb's law in eqn (4) was used to calculate the repulsive force between two droplets. In the equation, F denotes the repulsive force and r is the distance between the oil droplets (5.5 mm).
 | (4) |
Table 3 shows the repulsive force calculated by eqn (4) for an oil droplet undergoing repulsive motion. Because the driving force of oleic acid oil droplets is of the order of 100 nN,31 the value of the repulsive force quantitatively indicates that electrostatic interactions could be the driving force for the repulsive motion.
3.3 Temporal evolution of total locomotion distance and distance between oil droplets
The time dependences of the total traveled distance and the distance between oil droplets are shown in Fig. 8. The two oil droplets are denoted as A and B. Fig. 8(a) shows that both droplets moved at a constant speed, with A traveling 5 mm in 5 s and B covering 6 mm in 5 s after being dropped in the solution.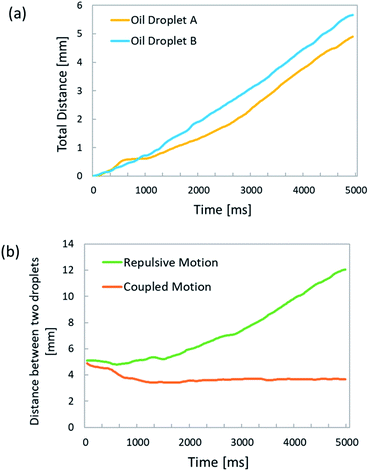 | ||
| Fig. 8 Time dependence of total locomotion distance and distance between oil droplets. (a) Total locomotion distance; (b) distance between oil droplets. | ||
The slope of the plot indicates that the oil droplets moved alone at approximately 1 mm s−1. The two droplets moved at almost the same speed. When the temperature and humidity of the laboratory, the droplet volume, the aqueous solution volume, and the pH of the aqueous solution were the same, the speed and traveled distance of the oil droplets did not differ significantly, as confirmed by the experiments. When the droplet motion was controlled using an exoskeleton frame, it was found that the speed of the oil droplet was not stable, depending on the attachment of the exoskeleton frame. On the other hand, the present method does not use an external device to control the oil droplets; hence, the droplet velocity was highly stable, as long as the experimental conditions remained the same.
As shown in Fig. 8(b), in the repulsive motion case, the distance between the two droplets increased with time, from 5.5 mm at the dropping time to 12 mm at ∼5 s afterward.
The slope of the plot shows that the two oil droplets moved away from each other with a relative velocity of approximately 2.4 mm s−1. Moreover, the distance between oil droplets undergoing repulsive motion increased proportionally to the time. On the other hand, in the case of coupled motion, the distance between the droplets was time-independent and almost constant. This is because the two droplets were constrained to move together, and their distance was the sum of the radii of the individual A and B droplets. By determining the time evolution of the total traveled distance and distance between oil droplets, we were able to analyze the velocity and locomotion distance of oil droplets interacting with each other.
3.4 Analysis of internal convection using PIV method
By examining the internal convection associated with the coupled motion, we identified two types of convection and related behaviors: follow-up and parallel motions, as shown in Fig. 9. In the follow-up motion, one oil drop follows the other. In the parallel motion, the two oil droplets travel side-by-side while remaining attached to each other. As illustrated in Fig. 9(b), when the convection on one oil droplet is larger than that on the other, the oil droplet with large convection chases the other one, which results in the follow-up motion. On the other hand, the parallel motion is observed when both oil droplets exhibit almost the same degree of convection. In the motion observation experiments, the follow-up and parallel motions were recorded together as a coupled motion, because they occurred stochastically in solutions at pH 12.00 and 12.04. After visualizing the internal convection by the PIV method, the difference between the follow-up and parallel motion was considered to originate from the way in which internal convection was generated. When oil droplets are introduced into the water layer and oleic acid begins to adsorb stochastically at the droplet surface, the magnitude of internal convection on each droplet is determined stochastically and results in either a follow-up or a parallel motion.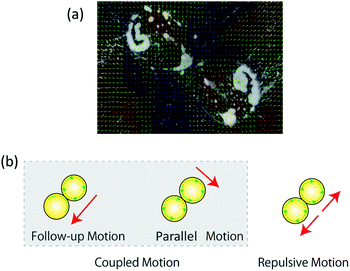 | ||
| Fig. 9 Visualization of internal convection using the PIV method. (a) Observed convection; (b) model of internal convection for each motion. | ||
When repulsive motion occurs, the internal convection flow moves in the opposite direction, such that the oil droplet moves away from its neighboring droplets. Because oil droplets undergo different motions when their shape is changed by external stimuli, Yamada et al. achieved motion control by applying external stimuli to oil droplets.28 In other words, when repulsive motion occurs, the charged oil droplet experiences a repulsive force from the neighboring oil droplet as a result of electrical effects, and their shapes are distorted in opposite directions. The visualization of internal convection by PIV also confirmed that such a change of shape causes each oil droplet to generate a convection flow that results in them moving in opposite directions.
3.5 Velocity analysis of single oil droplets
The average velocities of locomotion and corresponding standard deviations are shown in Fig. 10. The lowest velocity (0.2396 mm s−1) was measured for an oil droplet in a solution of pH 11.95, whereas that the highest (3.968 mm s−1) was obtained in a solution of pH 12.15. Up to pH 12.15, there was a positive correlation between the pH of the solution and the velocity of an oil droplet, but after the velocity reached its peak at pH 12.15, the pH value and the velocity became negatively correlated. In some cases, the oil droplets separated, as in the solutions of pH 12.20 and 12.30. Comparing the minimum and maximum velocities at pH 11.95 and 12.15, respectively, reveals that a pH change of 2.0 units resulted in the oil droplet velocity changing by approximately 17 times.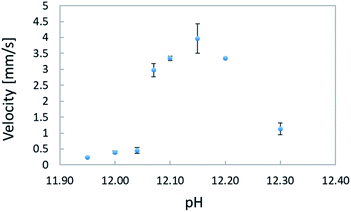 | ||
| Fig. 10 Relationship between pH concentration of aqueous solution and average velocity of locomotion. | ||
The experimental analysis of the correlated motion showed that coupled motions such as a follow-up and parallel motions occurred more frequently at pH 12.00 and pH 12.04, while only repulsive motion was observed at pH 12.10. The analysis of the relation between pH and velocity revealed an approximately 8-fold difference between the velocities at pH 12.00 and 12.10. This suggests that coupled motion occurred when the kinetic velocity was low, whereas a high kinetic velocity resulted in repulsive motion.
Based on the internal convection changes observed by PIV, we now discuss the origin of the increase in kinetic velocity of the oil droplet with increasing pH. First, the principle of self-propulsion of oil droplets reported by Martin et al.18 is summarized as follows: when an anhydrous oleic acid droplet is introduced into a basic surfactant solution in which oleic acid is dissolved, (i) anhydrous oleic acid is hydrolyzed to oleic acid, and oleic acid molecules are formed on the droplet surface. Owing to the surface activity of oleic acid in basic aqueous solutions, (ii) the interfacial tension of the oil droplet partially decreases in the region where oleic acid is formed, breaking the droplet symmetry, and (iii) water is incorporated into the oil droplet. Such localized flows (iv) gradually merge to form a Marangoni convection, which finally generates a constant flow on the oil droplet surface, and (v) the oil droplet starts to move by itself while wading through the surrounding water. Miura et al. reported that when the pH concentration of the surfactant solution was high, the oil droplets were almost fully hydrolyzed and the surface tension decreased.20 Therefore, as the pH concentration of the solution increases, the hydrolysis of anhydrous oleic acid to oleic acid in phase (i) becomes more efficient, thus increasing the difference in interfacial tension in phase (ii). Therefore, a greater uptake of water into the oil droplet takes place in phase (iii), with a higher internal convection in phase (iv), which increases the kinetic velocity of oil droplets in phase (v). The relationship between the velocity of an oil droplet and the driving force can be expressed by eqn (5), where F is the driving force of the oil droplet, CD is the drag force coefficient, ρ is the density of the aqueous solution, V is the kinetic velocity of the oil droplet, and S is the surface area.
In other words, the increase in the locomotion velocity of an oil droplet is associated with the increase in driving force, according to eqn (5). Although the increase in velocity is not directly related to the generation of repulsive motion, it is linked to the stability and persistence of this motion. Because this driving force is generated by the adsorption of the surfactant and the interfacial tension, it is natural to assume that the kinetic velocity of the oil droplet depends on the pH, which affects both the surfactant adsorption and interfacial tension.
 | (5) |
4. Conclusions
In this study, we focused on how the pH and electrostatic charge of a surfactant aqueous solution can control the behavior of oil droplets by altering the charge at the oil/water interface. Electrostatic interactions affected the direction of self-propelled oil droplets, which exhibited two specific motions: coupled and repulsive motion. The coupled motion could be further classified as follow-up or parallel motion, depending on the change in the internal convection. The amount of charge and the repulsive force induced in the oil droplet were calculated from the zeta potentials of three aqueous solutions at pH 12.00, 12.04, and 12.10. The repulsive force was of the same order of magnitude as the driving force, suggesting that electrostatic interactions influence the generation of repulsive motion. We confirmed that this behavior can be controlled by adjusting the pH of the aqueous solution and is reproducible. The results of this study indicate that electrical effects should be taken into account to control the behavior of self-propelled oil droplets. We also found that when oil droplets were introduced in solution, they did not exhibit independent motion, but interacted with each other. Therefore, methods to control the behavior of oil droplets should include the application of external electrical stimuli and exploiting the interactions with other oil droplets.Increasing the pH of the aqueous solution increased the velocity of the oil droplets, resulting in an increase in their driving force. The results also showed that the repulsive motion of oil droplets was more likely to occur at pH 12.10. The increase in driving force at high pH values could be attributed to the active hydrolysis of anhydrous oleic acid on the surface of oil droplets and the increased difference in interfacial tension.
In the future, we plan to control the behavior of single and multiple oil droplets using electrostatic interactions. We believe that clarifying and controlling the motion mechanism of self-propelled oil droplets will enable their application to drive actuators and manipulators operating in solution.
Author contributions
Mika Noguchi performed all experiments and wrote the manuscript. Masato Yamada analyzed the effect of the zeta potential on the electrostatic interactions between oil droplets and contributed to the calculation of the repulsive forces. Hideyuki Sawada directed and supervised the research project, and wrote the manuscript. All authors discussed the results.Conflicts of interest
There are no conflicts to declare.Acknowledgements
All authors thank the Japan Society for the Promotion of Science for its support under a Grant-in-Aid for Scientific Research on Innovative Areas (Research in a Proposed Research Area, 18H05473) and a Grant-in-Aid for Challenging Exploratory Research (19K21950).Notes and references
- A. A. A. Moghadam, A. Kouzani, K. Torabi, A. Kaynak and M. Shahinpoor, Development of a novel soft parallel robot equipped with polymeric artificial muscles, Smart Mater. Struct., 2015, 24, 035017 CrossRef.
- V. Cacucciolo, H. Nabae, K. Suzumori and H. Shea, Electrically-Driven Soft Fluidic Actuators Combining Stretchable Pumps with Thin McKibben Muscles, Front. Robot. AI, 2020, 6, 00146 CrossRef PubMed.
- W.-Y. Li, H. Nabae, G. Endo and K. Suzumori, New Soft Robot Hand Configuration with Combined Biotensegrity and Thin Artificial Muscle, IEEE Robot. Autom. Lett., 2020, 5, 4345–4351 Search PubMed.
- R. P. Rocha, P. A. Lopes, A. T. de Almeida, M. Tavakoli and C. Majidi, Fabrication and characterization of bending and pressure sensors for a soft prosthetic hand, J. Micromech. Microeng., 2018, 28, 034001 CrossRef.
- B. S. Homberg, R. K. Katzschmann, M. R. Dogar and D. Rus, Robust proprioceptive grasping with a soft robot hand, Aut. Robots, 2019, 43, 681–696 CrossRef.
- M. Cianchetti, C. Laschi, A. Menciassi and P. Dario, Biomedical applications of soft robotics, Nat. Rev. Mater., 2018, 3, 143–153 CrossRef.
- M. Rogóż, H. Zeng, X. Chen, D. Sybolt Wiersma and P. Wasylczyk, Light-Driven Soft Robot Mimics Caterpillar Locomotion in Natural Scale, Adv. Opt. Mater., 2016, 4, 1689–1694 CrossRef.
- M. P. da Cunha, A. Evelien, J. van Thoor, M. G. Debije, D. J. Broer and A. P. H. J. Schenning, Unravelling the photothermal and photomechanical contributions to actuation of azobenzene-doped liquid crystal polymers in air and water, J. Mater. Chem. C, 2019, 7, 13502–13509 RSC.
- M. Pilz da Cunha, M. G. Debije and A. P. H. J. Schenning, Bioinspired light-driven soft robots based on liquid crystal polymers, Chem. Soc. Rev., 2020, 49, 6568–6578 RSC.
- L. Ricotti, B. Trimmer, A. W. Feinberg, R. Raman, K. K. Parker, R. Bashir, S. Metin, S. Martel, P. Dario and A. Menciassi, Biohybrid actuators for robotics: a review of devices actuated by living cells, Sci. Robot. Rev., 2017, 2(12) DOI:10.1126/scirobotics.aaq0495.
- A. W. Feinberg, Biological Soft Robotics, Annu. Rev. Biomed. Eng., 2015, 17, 243–265 CrossRef CAS PubMed.
- J. Chen, F. K.-C. Leung, M. C. A. Stuart, T. Kajitani, T. Fukushima, E. van der Giessen and B. L. Feringa, Artificial muscle-like function from hierarchical supramolecular assembly of photoresponsive molecular motors, Nat. Chem., 2018, 10, 132–138 CrossRef CAS PubMed.
- M. Mauro, Gel-based soft actuators driven by light, J. Mater. Chem. B, 2019, 7, 4234–4242 RSC.
- R. Lan, J. Sun, C. Shen, R. Huang, Z. Zhang, C. Ma, J. Bao, L. Zhang, L. Wang, D. Yang and H. Yang, Light-Driven Liquid Crystalline Networks and Soft Actuators with Degree-of-Freedom-Controlled Molecular Motors, Adv. Funct. Mater., 2020, 30, 200252 CrossRef.
- S. Nakata, Y. Iguchi, S. Ose, M. Kuboyama, T. Ishii and K. Yoshikawa, Self-Rotation of a Camphor Scraping on Water: New Insight into the Old Problem, Langmuir, 1997, 13, 4454–4458 CrossRef CAS.
- R. Tenno, G. You, M. Yoshii, H. Kitahata, J. Gorecki, N. J. Suematsu and S. Nakata, Period of Oscillatory Motion of a Camphor Boat Determined by the Dissolution and Diffusion of Camphor Molecules, J. Phys. Chem. B, 2018, 122, 2610–2615 CrossRef CAS PubMed.
- Yu Xu, N. Takayama, H. Er and S. Nakata, Oscillatory Motion of a Camphor Object on a Surfactant Solution, J. Phys. Chem. B, 2021, 125, 1674–1679 CrossRef CAS PubMed.
- M. M. Hanczyc, T. Toyota, T. Ikegami, N. Packard and T. Sugawara, Fatty Acid Chemistry at the Oil-Water Interface: Self-Propelled Oil Droplets, J. Am. Chem. Soc., 2007, 129, 9386–9391 CrossRef CAS PubMed.
- T. Banno, R. Kuroha and T. Toyota, pH-Sensitive Self-Propelled Motion of Oil Droplets in the Presence of Cationic Surfactants Containing Hydrolyzable Ester Linkages, Langmuir, 2011, 28, 1190–1195 CrossRef PubMed.
- S. Miura, T. Banno, T. Tonooka, T. Osaki, S. Takeuchi and T. Toyota, pH-Induced Motion Control of Self-Propelled Oil Droplets Using a Hydrolyzable Gemini Cationic Surfactant, Langmuir, 2014, 30, 7977–7985 CrossRef CAS PubMed.
- S. Tanaka, S. Yoshimi and S. Nakata, Spontaneous change in trajectory patterns of a self-propelled oil droplet at the air-surfactant solution interface, Phys. Rev. E, 2018, 98, 049903 CrossRef.
- N. Yoshinaga, K. H. Nagai, Y. Sumino and H. Kitahata, Drift instability in the motion of a fluid droplet with a chemically reactive surface driven by Marangoni flow, Phys. Rev. E, 2012, 86, 016108 CrossRef PubMed.
- M. Schmitt and H. Stark, Marangoni flow at droplet interfaces: three-dimensional solution and applications, Phys. Fluids, 2016, 28, 016108 Search PubMed.
- X. Xu and J. Luo, Marangoni flow in an evaporating water droplet, Appl. Phys. Lett., 2007, 91, 124102 CrossRef.
- R. Vacha, S. W. Rick, P. Jungwirth, A. G. F. de Beer, H. B. de Aguiar, J.-S. Samson and S. Roke, The Orientation and Charge of Water at the Hydrophobic Oil Droplet–Water Interface, J. Am. Chem. Soc., 2011, 133, 10204–10210 CrossRef CAS PubMed.
- R. S. Volkov and P. A. Strizhak, Research of temperature fields and convection velocities in evaporating water droplets using Planar Laser-Induced Fluorescence and Particle Image Velocimetry, Exp. Therm. Fluid Sci., 2018, 97, 392–407 CrossRef.
- I. n. Lagzi, S. Soh, P. J. Wesson, K. P. Browne and B. A. Grzybowski, Maze Solving by Chemotactic Droplets, J. Am. Chem. Soc., 2010, 132, 1198–1199 CrossRef CAS PubMed.
- M. Yamada, H. Shigemune, S. Maeda and H. Sawada, Directional and velocity control of active droplets using a rigid-frame, RSC Adv., 2019, 9, 40523–40530 RSC.
- T. Toyota, N. Maru, M. M. Hanczyc, T. Ikegami and T. Sugawara, Self-Propelled Oil Droplets Consuming “Fuel” Surfactant, J. Am. Chem. Soc., 2009, 131, 5012–5013 CrossRef CAS PubMed.
- C. H. Meredith, P. G. Moerman, J. Groenewold, Yu-J. Chiu, W. K. Kegel, A. van Blaaderen and L. D. Zarzar, Predator–prey interactions between droplets driven by non-reciprocal oil exchange, Nat. Chem., 2020, 12, 1136–1142 CrossRef CAS PubMed.
- M. Yamada, H. Shigemune, S. Maeda and H. Sawada, Temperature and Humidity Dependence of Marangoni Convection and Its Effect on the Self-propulsion of an Oil Droplet, Chem. Lett., 2021, 50, 493–496 CrossRef CAS.
| This journal is © The Royal Society of Chemistry 2022 |

