 Open Access Article
DFT study of alkali and alkaline earth metal-doped benzocryptand with remarkable NLO properties†
Nimra Maqsooda,
Areeba Asifa,
Khurshid Ayub b,
Javed Iqbal
 *a,
Ashraf Y. Elnaggar
 c,
Gaber A. M. Mersald,
Mohamed M. Ibrahimd and
Salah M. El-Bahye
aDepartment of Chemistry, University of Agriculture, Faisalabad-38000, Pakistan. E-mail: Javedkhattak79@gmail.com; Javed.iqbal@uaf.edu.pk
bDepartment of Chemistry, COMSATS University, Islamabad, Abbottabad Campus, Abbottabad, 22060, Pakistan
cDepartment of Food Science and Nutrition, College of Science, Taif University, Taif 21944, P. O. Box 11099, Saudi Arabia
dDepartment of Chemistry, College of Science, Taif University, P. O. Box 11099, Taif 21944, Saudi Arabia
eDepartment of Chemistry, Turabah University College, Taif University, P. O. Box 11099, Taif 21944, Saudi Arabia
First published on 27th May 2022
Abstract
Strategies for designing remarkable nonlinear optical materials using excess electron compounds are well recognized in literature to enhance the applications of these compounds in nonlinear optics. In this study, density functional theory simulations are performed to study alkali and alkaline earth metal-doped benzocryptand using the B3LYP/6-31G+(d, p) level of theory. Vertical ionization energies (VIEs), reactivity parameters, interaction energies, and binding energies exposed the thermodynamic stability of these complexes. FMO analysis revealed that HOMO is located on alkali metals having polarized electrons, which are easy to excite. The doping strategy enhanced the charge transfer with low bandgap energy in the range of 0.68–2.23 eV, which is lower than that of the surface BC (5.50 eV). Also, the lower transition energies and higher oscillator strength indicate that these complexes exhibit excellent electronic and optical properties. Non-covalent interaction analysis suggested the presence of van der Waals interactions between dopants and surface. IR analysis provided information about the frequencies of stretching vibrations present in the complexes due to different bonds. UV-vis analysis revealed that all the newly designed excess electron complexes are transparent in the UV region and possessed maximum absorption in the visible and NIR region, ranging from 753.6 to 2150 nm, which is higher than the surface (244 nm). Thus, these complexes have a potential for high-performance NLO materials in the applications of optics. Natural bond orbital analysis (NBO), transition density matrix (TDM), electron density difference map (EDDM), and density of state (DOS) analyses were also performed to study the charge transfer properties. Moreover, these complexes possessed remarkable optoelectronic properties due to a significant increase in the isotropic linear polarizability (αiso) in the range of 629.59–1423.23 au. Further, these systems demonstrated an extraordinary large total first hyperpolarizability (βtl) in the range of 3695.55–910![[thin space (1/6-em)]](https://www.rsc.org/images/entities/char_2009.gif) 706.43 au. The rationalization of hyperpolarizability by the two-level model reflected a noteworthy increase in βtl because of low transition energies (ΔE) and high transition dipole moment (Δμ). Thus, our results showed that alkali and alkaline earth metal-doped BC might be a competitor for efficient nonlinear optical properties with practical applications in the area of optoelectronics.
706.43 au. The rationalization of hyperpolarizability by the two-level model reflected a noteworthy increase in βtl because of low transition energies (ΔE) and high transition dipole moment (Δμ). Thus, our results showed that alkali and alkaline earth metal-doped BC might be a competitor for efficient nonlinear optical properties with practical applications in the area of optoelectronics.
1. Introduction
Nonlinear optical (NLO) materials put an appearance in 1960 (ref. 1) and have been instigated by researchers due to their ultra-modern technological applications in optical computing, optical data storage,2 frequency conversion, photonic devices,3 and dynamic image processing.4 Organic compounds with the expanded framework of delocalized π-electrons5 have exhibited intermolecular charge transfer (ICT) from the donor to the acceptor6 with excellent electric polarization, which showed wonderful NLO properties.7 Moreover, non-centrosymmetric materials,8 for example, SrB5O7F3,9 BaAg2GeS4, and BaAg2SnS4 (ref. 10) also manifested NLO properties. Materials exhibiting low energy gap, high transition dipole moment,11 and π-conjugation bridge between the donor and the acceptor12 have demonstrated large values of molecular hyperpolarizabilities. To meet the demand for effective NLO materials,13 different recommended approaches are metal–ligand framework,14 π-conjugated system of highly delocalized electrons,15 twisted π-conjugated structures,16 metal doping, diradical character,17 and octupolar molecules.18 Compounds containing excess free electrons,19 for example, fullerenes and graphydiyne with an alkali-like atom doping, also possessed remarkable NLO properties.20Cryptands, accompanied with supramolecular chemistry,21 are advantageous in solvent extraction, phase transfer catalyst, and also in materials science.22 They were synthesized in 1987 by Lehn and their co-workers.23 They are three-dimensional macro-bicyclic compounds carrying interior cavity, and are homologous of crown ethers, in which two nitrogen atoms behave as the bridge.24 The cavity of the cryptands acts as a binding site25 and constructs stable complexes (cryptate effect)26 with alkali and alkaline earth metals, which are more strong.27 In the cryptand–metal complex, the cryptand is a host and the metal acts as a guest (host–guest chemistry).28 Benzocryptand [222B], containing benzene ring in its structure, has the chemical formula C22N2H36O6. The IUPAC name of benzocryptand (derivative of cryptand) is 5,6-benzo-4,7,13,16,21,24-hexaoxa-10,1-diazabicyclo[8.8.8]hexacosane. Cryptands are important in the formation of electron excess compounds, which are called as electrides and alkalides. Benzo-cryptand [222B], with alkali and alkaline earth metal cations, showed that it formed stable complexes by strong electrostatic interactions and exhibited NLO properties.29
The investigation of exohedral lanthanum-doped nanocages has shown thermodynamic stability and highly affected the NLO properties of the nanoclusters. Due to the reduced HOMO–LUMO energy gap, the enhanced first hyperpolarizability value of 4.43 × 10⁴ au was obtained from the La-doped nanocage Al12N12.30 Excellent NLO properties were shown by alkali and alkaline earth metal-doped Zintl (P7) super-atom clusters (group of atom that behaves as a single atom) with first a hyperpolarizability (βo) value of 282.18 × 10⁻³⁰ esu and second hyperpolarizability (βo) value of 3086.96 × 10−36 esu.31 Maria et al. revealed that the alkali metal-doped (by replacing boron, phosphorus, or aluminium with alkali) BP and AlP nanocages exhibited enhanced electronic and NLO properties with high first hyperpolarizability due to a sufficient decrease in the HOMO–LUMO band gap.32 Recent studies have discovered that alkaline earth metal doping has upgraded the first hyperpolarizability and also electride features of pyridazine, which in turn increased the NLO response.33 In boron nitride nanocone (BNNC), the dramatic effect of Li-doping was observed on first hyperpolarizability due to high charge transfer from BNNC to Li.34
This study aims to investigate the NLO response of benzo-cryptand (BC). The physical attachment of alkali and alkaline earth metals to BC was examined for the exploration of optoelectronic properties. For this purpose, BC was doped exohedral at the bridge side with alkali metals (Li, Na, K) and endohedral at the cavity side with alkaline earth metals (Be, Mg, Ca) at a particular distance. The following combinations are selected for the evaluation of different orientations: (1) BC doped with Li exohedral and Be is endohedral, termed as Li(BC)Be; (2) BC doped with Li exohedral and Mg endohedral, Li(BC)Mg; (3) BC doped with Li exohedral and Ca endohedral, Li(BC)Ca; (4) BC doped with Na exohedral and Be endohedral, Na(BC)Be; (5) BC doped with Na exohedral and Mg endohedral, Na(BC)Mg; (6) BC doped with Na exohedral and Ca endohedral, Na(BC)Ca; (7) BC doped with K exohedral and Be endohedral, K(BC)Be; (8) BC doped with K exohedral and Mg endohedral, K(BC)Mg; (9) BC doped with K exohedral and Ca endohedral, K(BC)Ca. The electronic structure and NLO response of BC doped with alkali and alkaline earth metals may assist the scientific community to utilize these materials in optics.
2. Computational procedure
In the emerging field of computational chemistry, DFT (density functional theory) is the most commonly used quantum mechanical approach for the calculation of spectroscopic and electronic properties.35 The visualization of structures of reference molecule BC and its complexes was done using GaussView 6.0.36 Then, quantum chemical calculations were performed by the DFT method, B3LYP functional due to less convergence dilemmas and 6-31G basis set because its reproducibility is much better than other lower basis sets.37 Moreover, the bandgap comparison of BC simulated by 6-31G and 6-31G′ generated the same results, i.e., 5.50 eV. Also, method validation was performed in which the value of the absorption maximum λmax of benzocryptand in water (as a solvent) was compared with a theoretical value. The computationally calculated λmax (253.53 nm) was very close to the experimental λmax, i.e., 272 nm.38The fully optimized structures of BC and its complexes with alkali and alkaline earth metals were calculated at the B3LYP/6-31G+(d, p) level of theory22,37 using Gaussian 09W suite of programs. Electronic transition calculations were performed using TD-DFT (time-dependent density functional theory) approach and UV-vis absorption spectra were analyzed. It is an extensively employed method that proclaimed close correlation between experimental and theoretical work and provides an understanding of reactivity and stability of molecules with accuracy.39 Natural bond orbital (NBO) analysis, transition density matrix (TDM), electronic properties such as density of states (DOS), frontier molecular orbitals (FMOs), charge transfer, molecular electrostatic potential (MEP), electron density difference map (EDDM), infrared (IR) analysis, non-covalent interaction (NCI) analysis, and nonlinear optical (NLO) properties were also determined by applying the same level of theory.
Different reactivity parameters such as hardness (η), softness (S), ionization potential (I), chemical potential (μ), and electrophilicity (ω) were also calculated. Other quantum chemical parameters such as dipole moment (μ), interaction energies (Eint), and energy gap (EG) between HOMO (highest occupied molecular orbitals) and LUMO (lowest unoccupied molecular orbitals) were also calculated using equations.
The energy gap between HOMO–LUMO is calculated by the equation.
| EG = EL − EH | (1) |
The dipole moment (μ) was calculated using the following equation.40
| μ = (μx2 + μy2 + μz2)1/2 | (2) |
Interaction energies (Eint) were calculated using eqn (3).
| Eint = Ecomplex − (EBC + Ealkali + Ealkaline) | (3) |
The isotropic polarizability (αiso), anisotropic polarizability (αaniso), and first total hyperpolarizability (βtl) calculations were performed at the same level of theory B3LYP/6-31G+(d, p) to evaluate the NLO response of BC and its complexes. These terms are represented by following equations.41
 | (4) |
| αaniso = [(αxx − αyy)2 + (αxx − αzz)2 + (αyy − αzz)2]1/2 | (5) |
| βtl = (βx2 + βy2 + βz2)1/2 | (6) |
| βx = βxxx + βxyy + βxzz |
| βy = βyyy + βyzz + βyxx |
| βz = βzzz + βzxx + βzyy |
3. Results and discussion
3.1. Structure and geometry of molecules
The geometries of the molecule has a great impact on the optoelectronic properties; therefore, the geometry optimization for the ground state configuration of reference molecule BC having C1 symmetry was computed using B3LYP/6-31G+(d,p) level of theory, as reported in the literature. Frequency calculations for all the molecules were also performed at the same computational level, which confirms that geometry optimization is on their exact minima.42 The surface BC was doped with alkali metals (Li, Na, and K) exohedral on the bridge side of BC and with alkaline earth metals (Be, Mg, and Ca) endohedral in the cavity side and optimized at the same level of theory as that for the reference.The optimized structures of pure and doped BC characterized as energy minima maintained their C1 symmetry. The labelled optimized structures of the reference and all the doped complexes are illustrated in Fig. 1. In all the doped complexes, the alkali metals present outside the BC (cage) interacting with the hydrogens of the cage are represented along with the bond lengths between them. Also, the alkaline earth metals present inside the cage have shown interactions with oxygen atoms of the bridge and the crown ring. These interactions along their distances are displayed. The change in the distance between N7 and N8 of BC after doping was observed.
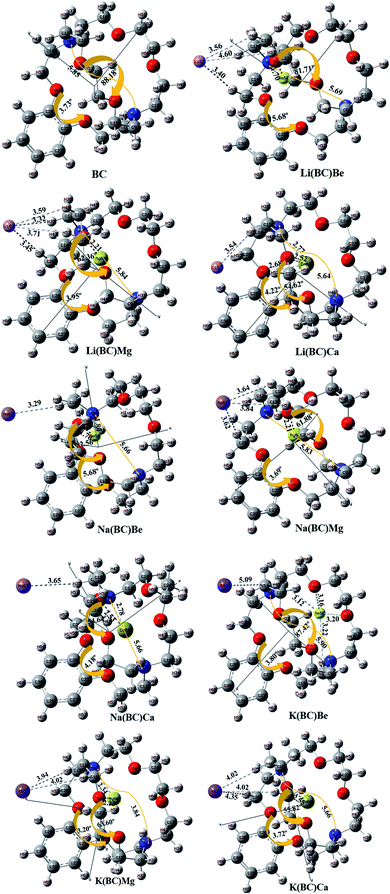 | ||
| Fig. 1 The optimized structural framework of BC and its complexes with alkali and alkaline earth metals calculated using the B3LYP/6-31+G level of theory (bond lengths in Å). | ||
The distance between alkali and alkaline earth metal dopants having opposite charges are given in Table 1. For Li series, when the alkaline earth metal is Be, the distance between the dopants, i.e., Li and Be is 5.45 Å. The distance increases to 6.11 Å for Mg atom and is maximum for Ca, i.e., 6.41 Å. For Na series, the distance varies in the same way, i.e., with the increase in the size of the alkaline earth metal, the distance between the dopants increases. This is due to the increase in the size down the group and the reduction of electronegative character (or increase in the electropositivity).43 The order of increasing distance for Na series is Na(BC)Be (5.61 Å) < Na(BC)Mg (6.26 Å) < Na(BC)Ca (6.58 Å). In case of K series, K(BC)Mg (6.90 Å) and K(BC)Ca (7.13 Å) follows the same trend but there is an exception for K(BC)Be, in which the distance between the dopants is very large among all the complexes of the series. Also, the optimized structure of K(BC)Be showed that the Be atom is not fitted in the cavity of BC and shows anomalous behavior.
| Molecules | dalkali–alkaline (Å) | dalkaline-O2 (Å) |
|---|---|---|
| BC | — | — |
| Li(BC)Be | 5.45 | 1.69 |
| Li(BC)Mg | 6.11 | 2.21 |
| Li(BC)Ca | 6.41 | 2.52 |
| Na(BC)Be | 5.61 | 1.70 |
| Na(BC)Mg | 6.26 | 2.21 |
| Na(BC)Ca | 6.58 | 2.53 |
| K(BC)Be | 11.79 | 5.94 |
| K(BC)Mg | 6.90 | 2.22 |
| K(BC)Ca | 7.13 | 2.55 |
Keeping the alkaline earth metal same and changing the alkali metal from Li to K also revealed the same trend in increasing the distance between the dopants. For Be series, the distance between the metal dopants increases in the order Li(BC)Be (5.45 Å) < Na(BC)Be (5.61 Å) < K(BC)Be (11.79 Å) and for Mg series, the order is Li(BC)Mg (6.11 Å) < Na(BC)Mg (6.26 Å) < K(BC)Mg (6.90 Å). Also, for the Ca series, the distance between the dopants increases with increasing size of the alkali metals (outside the cage) in the order Li(BC)Ca (6.41 Å) < Na(BC)Ca (6.58 Å) < K(BC)Ca (7.13 Å).
The distance between the endohedral alkaline earth metal dopant and O2 atom (dalkaline-O2) of BC was calculated and reported in Table 1. The distance (dalkaline-O2) also depends upon the size of inner metal dopant; the larger the size of the endohedral metal, the larger will be the interaction distance between the metal and O2. For Li series, the distance between Be and O2 is 5.45 Å, which distance increases to 2.21 Å for Mg atom and is the highest for Ca atom, i.e., 2.52 Å. The distance between the inner atom and O2 increases with the increase in the size of the inner dopant atom and follows the same trend for Na series; the order of increasing distance is Na(BC)Be (1.70 Å) < Na(BC)Mg (2.21 Å) < Na(BC)Ca (2.53 Å). In the same way, for the K series, the distance in K(BC)Mg is 2.22 Å and for K(BC)Ca, the distance becomes larger, i.e., 2.55 Å, due to the increasing size of the alkaline earth metal. However, in the case of K(BC)Be, the distance is found to be the largest among all the series because of the jumping of the Be atom from the cavity to outside the cage after optimization, thereby leading to a large distance from the atoms of the cage. The change in the dihedral angles between different atoms of the cage was also observed after doping. The change in the dihedral angles of O5–C25–C26–O6 and O1–C21–C22–O2 in BC after doping was also calculated and mentioned in Fig. 1.
3.2. NBO and FMO analysis
NBO analysis was accomplished for the exploration of the electronic properties and intermolecular charge transfer between the dopants and surface in all the newly designed complexes. NBO calculations were performed at the 6-31+G (d, p) level of theory and the results of NBO charges are reported in Table 2. The NBO results revealed that there is a negative charge on the alkali metal atoms (doped exohedral), which demonstrates the alkalide character of these newly designed complexes. Alkalides are compounds occupied by the anions of alkali metals having loosely bound excess electrons due to small electron affinities and possess dramatic enhancement in static hyperpolarizabilities due to higher oscillator strength and low transition energy.44| Molecules | Qalkali | Qalkaline | QN7 | QN8 | QO1 | QO2 |
|---|---|---|---|---|---|---|
| BC | — | — | −0.543 | −0.541 | −0.602 | −0.602 |
| Li(BC)Be | −0.788 | 0.628 | −0.546 | −0.697 | −0.587 | −0.702 |
| Li(BC)Mg | −0.842 | 0.671 | −0.537 | −0.647 | −0.598 | −0.697 |
| Li(BC)Ca | −0.826 | 0.674 | −0.600 | −0.618 | −0.651 | −0.672 |
| Na(BC)Be | −0.800 | 0.627 | −0.545 | −0.696 | −0.588 | −0.702 |
| Na(BC)Mg | −0.851 | 0.672 | −0.538 | −0.646 | −0.599 | −0.696 |
| Na(BC)Ca | −0.833 | 0.673 | −0.600 | −0.617 | −0.651 | −0.672 |
| K(BC)Be | −0.008 | −0.030 | −0.544 | −0.541 | −0.597 | −0.631 |
| K(BC)Mg | −0.881 | 0.668 | −0.503 | −0.617 | −0.589 | −0.677 |
| K(BC)Ca | −0.871 | 0.985 | −0.576 | −0.592 | −0.662 | −0.671 |
The negative NBO charges present on alkali metal atoms (Li, Na, K) demonstrate the presence of alkali anion and alkalide nature of all the complexes.43 In all the complexes, alkali metals have remarkable negative charges ranging from −0.008 Å to −0.881 Å (given in Table 2), which possess strong alkalide character and show excess electron nature of all the complexes.
The order of alkalide nature of the complexes for Be series is Na > Li > K, and for Mg and Ca series, the order is the same, i.e., K > Mg > Li. Furthermore, the computed NBO charges on alkaline earth metals (doped endohedral) are positive in magnitude except for K(BC)Be (an exception). The positive charge in alkaline earth metals increases with the increase in the size. In Li series, for Li(BC)Be, the charge on Be is 0.628 Å, which increases for Mg (0.671 Å) and is the highest for Ca, i.e., 0.674 Å. In the same way, for Na series, the charges on alkaline earth metals increase with an increase in the size in the order: Be (0.627 Å) < Mg (0.672 Å) < Ca (0.673 Å). In the K series, with negative charge on Be, the magnitude of charges increases in the same order, i.e., Be (−0.030 Å) < Mg (0.668 Å) < Ca (0.985 Å).
The positive charge on alkaline earth metal revealed that there is a possibility of charge transfer from alkaline earth metals to the electronegative atoms (O and N) of surface BC. To track the origin of this charge transfer, we also computed the NBO charges on N7, N8 and O1, O2. In all the complexes, the charges on N7 and N8 are negative, ranging from −0.503 Å to −0.697 Å. Also, the charges on O1 and O2 in all the complexes are negative in the range from −0.587 Å to −0.702 Å. The calculated positive charges on alkaline earth metals and negative charges on oxygen and nitrogen atoms revealed charge transfer from the alkaline earth metals to more electronegative oxygen and nitrogen atoms of surface BC. The excess electron nature of these compounds can also be justified by FMO analysis, which demonstrated that the HOMO–LUMO density is entirely dependent on alkali metals (that become anion), indicating the presence of excess loosely bound s-electrons responsible for alkalide nature.
The light absorbance and optoelectronic properties of the compounds was deliberated by the study of charge transfer from the highest occupied molecular orbitals (HOMO) to the lowest unoccupied molecular orbitals (LUMO) within the molecule. FMO analysis provides information about the energies of orbitals and charge transfer from HOMO having electron donating ability to LUMO, which exhibits electron accepting capability. In this study, FMO calculations were performed at the B3LYP/6-31G+(d, p) level of theory to determine the chemical reactivity, reaction mechanism, and dynamic stability of the compounds;45 their results are presented in Table 3.
| Chemical moieties | EL (eV) | EH (eV) | EG (eV) | VIE (eV) | Eint (kcal) | EB (eV) |
|---|---|---|---|---|---|---|
| BC | 0.04 | −5.46 | 5.50 | 5.46 | — | 0.66 |
| Li(BC)Be | −0.76 | −1.97 | 1.21 | 1.97 | −9.72 | 0.59 |
| Li(BC)Mg | −0.73 | −1.84 | 1.11 | 1.84 | 9.64 | 0.56 |
| Li(BC)Ca | −1.03 | −1.87 | 0.84 | 1.87 | −30.37 | 0.37 |
| Na(BC)Be | −0.82 | −1.96 | 1.14 | 1.96 | −9.73 | 0.56 |
| Na(BC)Mg | −0.74 | −1.82 | 1.08 | 1.82 | 8.19 | 0.52 |
| Na(BC)Ca | −1.05 | −1.85 | 0.80 | 1.85 | −30.73 | 0.35 |
| K(BC)Be | −0.72 | −2.95 | 2.23 | 2.95 | −0.43 | 0.60 |
| K(BC)Mg | −0.84 | −1.70 | 0.86 | 1.70 | 13.22 | 0.48 |
| K(BC)Ca | −1.06 | −1.75 | 0.68 | 1.75 | −25.64 | 0.36 |
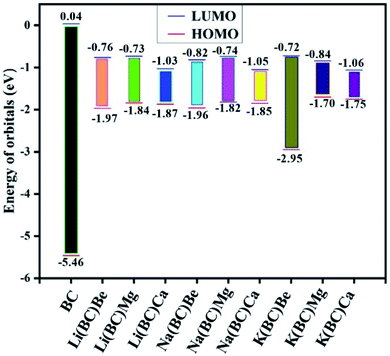
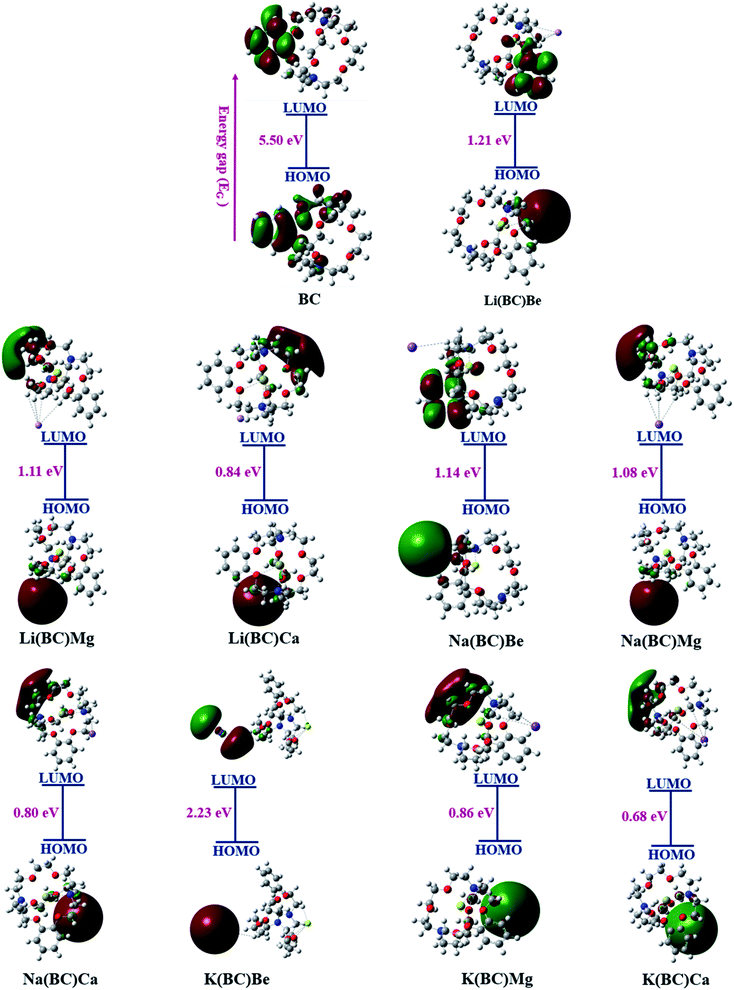
The energy gap, and HOMO and LUMO energies calculated for reference BC were 5.50 eV, −5.46 eV, and 0.04 eV, respectively. The band gap for reference and new architect molecules has been explored and it was observed that reference BC (5.50 eV) has the highest value. The series of Li complexes with BC and alkaline earth metals showed that there is a reduction in the band gap with an increase in the size of alkaline earth metal dopants: Li(BC)Be (1.21 eV) > Li(BC)Mg (1.11 eV) > Li(BC)Ca (0.84 eV). Also, the series of Na and K exhibited the same trend. For Na series, the order is Na(BC)Be (1.14 eV) > Na(BC)Mg (1.08 eV) > Na(BC)Ca (0.80 eV) and for K series the order is: K(BC)Be (2.23 eV) > K(BC)Mg (0.86 eV) > K(BC)Ca (0.68 eV). These results showed that the band gap values for all the new designed molecules are lower than the reference molecule, as shown in Fig. 2. Also, the lowest value of the band gap has been found between orbitals of newly designed molecule K(BC)Ca (0.68 eV), where the HOMO charge density is located on alkali metal K that acts as a donor of electron. The LUMO charge density is located on the carbon atoms of the cavity side of the BC and acts as an electron acceptor. The decrease in the band gap with an increase in the size is due to the increasing distance between the valence shell and nucleus, which results in weak nuclear interactions and loosely bound valence electrons of the donor metal atoms. Thus, the distance between the HOMO of the donor and the LUMO of the acceptor shrinkages and the band gap also decreases. The chemical stability of the molecules is also accompanied with the HOMO–LUMO energy gap, i.e., the large values of the energy gap makes the molecules resist the chemical change and provides greater chemical stability. Moreover, the low value of the energy gap represents low chemical stability due to a high degree of softness,46 due to which the molecule exhibits large values of polarizability and improved NLO response.47,48
The FMO representation of the reference molecule BC and newly formed moieties are shown in Fig. 3, where green and red color represent the negative and positive phases of the orbitals, respectively.49 As shown in the FMO illustration, in BC, the electron density of HOMO was centered on the benzene ring and other carbon, hydrogen, and nitrogen atoms of the crown ring, while LUMO was located largely on the benzene ring and a small portion on other atoms of the crown ring. In all the formulated moieties, the HOMO charge density was found on alkali metals, which acts as the donor, and for LUMO, the charge density was located on the benzene ring in case of Li(BC)Be and Na(BC)Be, on the alkali atom K in K(BC)Be, and in all other compounds on the atoms of the crown ring other than benzene, which act as acceptors.
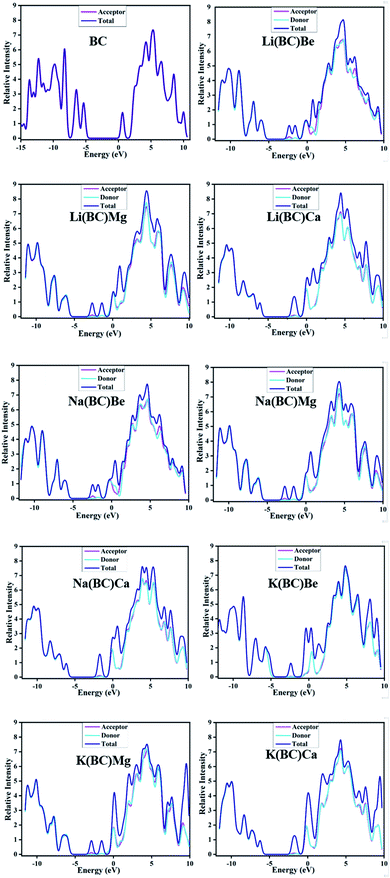
Another representation of the HOMO–LUMO energy gap is the DOS plot shown in Fig. 4, which demonstrates the change in the energy gap after doping. The purpose of doping was to investigate the optical properties of doped BC; the results revealed that the doped complexes may prove to be productive materials to enhance the conductive and optoelectronic properties with their low band gap. Different colors show the donor and acceptor density of states, i.e., PDOS and total density of states, i.e., the TDOS of molecules and the middle part of the graphs show band gaps. Alkali metal dopants acts as donors and the reference BC acts as an acceptor of electrons; thus, there is significant charge transfer from HOMO to LUMO due to the less band gap values than that of the reference.
The small values represent loosely bound excess electrons in these systems, which are easy to excite. The stability viewpoint of these molecules can also be compared by VIEs. Among the Li and Na series, Li(BC)Be and Na(BC)Be have larger values (1.97 and 1.96 eV) of VIE and band gap; thus, these complexes have reasonable thermal stability. Among K series, K(BC)Be also showed the largest values (2.95 eV) of VIEs and the band gap is the most thermally stable compared to the others.
The interaction energies (Eint) of all the metal doped systems giving information about surface–dopant interactions and stability of the molecules are reported in Table 3. The large and negative values of Eint refer to the better interactions between the surface and the dopant, and also the higher stability of the system. Among the Eint values for the Li series, the highest negative value is possessed by Li(BC)Ca (−30.37 kcal), which is highly stable and has greater surface–dopant interactions. In the Na series, the complex Na(BC)Ca (−30.73 kcal) shows the highest negative value and stability.
Also, in the K series, K(BC)Ca (−25.65 kcal) possesses the highest value of Eint, greater stability, and better surface–dopant interactions. It is noted that all the complexes containing Ca have shown higher stability and surface–dopant interactions. This is due to the influence of large-sized alkaline earth metal with Ca doped endohedral to the BC. For NLO materials, thermodynamically stable molecules are suitable for experimental synthesis and provide better practical applications.
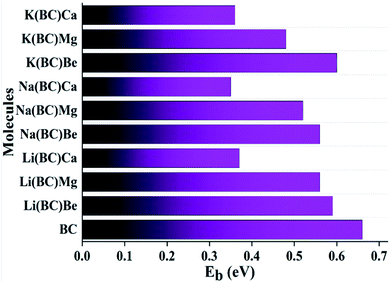
Another key factor to study optoelectronic properties and understand the stability of molecules is binding energy (EB). For surface molecule BC and all the newly designed complexes, the theoretically computed binding energies are given in Table 3.
The EB values for all the studied compounds to investigate their stabilities were calculated using the formula50
| EB = EG − EEX | (7) |
| μ = −(I + A)/2 | (8) |
| Molecules | A (eV) | η (eV) | S (eV−1) | μ (eV) | ω (eV) | I (eV) |
|---|---|---|---|---|---|---|
| BC | −0.04 | 2.75 | 0.18 | −2.71 | 1.33 | 5.46 |
| Li(BC)Be | 0.76 | 0.61 | 0.82 | −1.36 | 1.52 | 1.97 |
| Li(BC)Mg | 0.73 | 0.56 | 0.28 | −1.28 | 1.47 | 1.84 |
| Li(BC)Ca | 1.03 | 0.42 | 0.21 | −1.45 | 2.50 | 1.87 |
| Na(BC)Be | 0.82 | 0.57 | 0.28 | −1.39 | 1.69 | 1.96 |
| Na(BC)Mg | 0.74 | 0.54 | 0.27 | −1.28 | 1.52 | 1.82 |
| Na(BC)Ca | 1.05 | 0.40 | 0.20 | −1.45 | 2.63 | 1.85 |
| K(BC)Be | 0.72 | 1.12 | 0.58 | −1.84 | 1.52 | 2.95 |
| K(BC)Mg | 0.84 | 0.43 | 0.22 | −1.27 | 1.88 | 1.70 |
| K(BC)Ca | 1.06 | 0.34 | 0.17 | −1.41 | 2.92 | 1.75 |
Also, the hardness (η) was calculated using Koopmans' theorem, i.e.,
| η = (I − A)/2 | (9) |
The softness (S) and electrophilicity index (ω) was computed using following equations.52
| S = 1/2η | (10) |
| ω = μ2/2η | (11) |
The ionization potential of a molecule is the energy required to remove electrons from the HOMO orbitals and provides information about the donating and accepting capability of the atoms. The electron affinity is the amount of energy released by the addition of electrons.
The chemical potential provides information about the stability and reactivity of the system. Electrophilicity is the property of being an electron acceptor. The hardness and softness of the molecule us related to the band gap and gives information about the reactivity. The hardness of the molecule is inversely related to the reactivity and directly related to the band gap. The greater the hardness, the larger will be the band gap, which causes low charge transfer and less reactivity. Lower the band gap, higher will be the softness and polarizability of the molecules, which results in higher reactivity of the molecules. The highest value of softness was observed for Li(BC)Be. From all this information about the reactivity parameters, it is expected that the newly designed molecules might be active for NLO response.
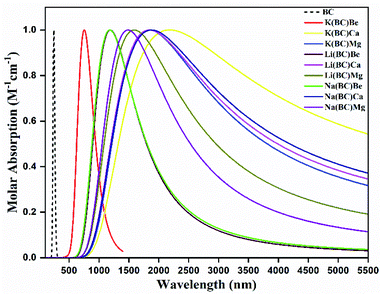
3.3. UV-vis-NIR absorption analysis
Highly efficient NLO materials are valuable to double the frequency in second harmonic generation; thus, the investigation of transparency concerning laser light is crucial. For this intent, the transparency of newly designed moieties was studied using UV-vis-NIR analysis computed via the TD-DFT method at the B3LYP/6-31G+(d, p) level of theory to comprehend the absorption statistics shown in Fig. 6. The maximum absorption (λmax) values of the reference BC and all other complexes are shown in Table 5. The absorption region for reference and complexes is the vis-NIR region and all the compounds are transparent to the ultraviolet region. The reference BC has the least value of λmax but doping with electron-rich atoms causes an increase in the λmax and a shift in the NIR region.| Molecules | Symmetry | λmax (nm) | ΔE (eV) | fo | Molecular transitions | C.I% |
|---|---|---|---|---|---|---|
| a H = HOMO, L = LUMO, L−1 = LUMO−1, L+2 = LUMO+2, etc. | ||||||
| BC | C1 | 244 | 4.84 | 0.0140 | H → L+3 | 41 |
| Li(BC)Be | C1 | 1194 | 0.61 | 0.0584 | H → L+1 | 65 |
| Li(BC)Mg | C1 | 1592 | 0.54 | 0.0401 | H → L+1 | 70 |
| Li(BC)Ca | C1 | 1840 | 0.46 | 0.0138 | H → L+1 | 62 |
| Na(BC)Be | C1 | 1170 | 0.57 | 0.0380 | H → L+2 | 47 |
| Na(BC)Mg | C1 | 1496 | 0.56 | 0.0220 | H → L+3 | 51 |
| Na(BC)Ca | C1 | 1872 | 0.45 | 0.0202 | H → L+1 | 73 |
| K(BC)Be | C1 | 753.6 | 1.63 | 0.2934 | H → L+1 | 91 |
| K(BC)Mg | C1 | 1840 | 0.38 | 0.0328 | H → L+1 | 43 |
| K(BC)Ca | C1 | 2150 | 0.32 | 0.0176 | H → L−1 | 98 |
For Li complexes with BC and alkaline earth metals, the increase in size results in increasing λmax, and the highest value (1840 nm) is observed for Li(BC)Ca, accompanied by the lowest energy gap (0.84 eV). For Na and K complexes, the same trend is followed; the highest value (1872 nm) of λmax for Na series is observed for Na(BC)Ca with the lowest band gap (0.80 eV) of this series. For K complexes, series K(BC)Ca has shown the largest λmax value (2150 nm) with the lowest band gap (0.68 eV). Among all the studied compounds, K(BC)Ca doped with large sized alkali and alkaline earth metal atoms have been found to be high performance NLO material due to the highest value of λmax in the NIR region and the lowest band gap. The reason is that the increase in size causes the electrons to be loosely bound, leading to easy transitions using less amount of energy due to low energy gap and hence highest absorption.
3.4. Ground state and transition dipole moment
Dipole moment plays a crucial role in studying the magnitude of polarization, molecular packing, asymmetric charge distribution, and crystallinity. The ground state dipole moment (μg) and transition dipole moment (Δμ) was computed using the B3LYP/6-31+G(d, p) level of theory and has been reported in Table 6. The dipole moment of the surface BC exhibiting C1 symmetry is 1.98 Deb. The transition dipole moment (Δμ) between the ground state and the excited state for the surface BC is 0.30 au and for all the newly designed systems, it lies in the range of 0.72–2.68 au. The values of band gap and transition dipole moment decrease with the increase in the size of the dopants.| Molecules | μg (debye) | Δμ (au) |
|---|---|---|
| BC | 1.98 | 0.30 |
| Li(BC)Be | 12.99 | 1.06 |
| Li(BC)Mg | 16.28 | 0.93 |
| Li(BC)Ca | 14.34 | 0.72 |
| Na(BC)Be | 13.48 | 0.94 |
| Na(BC)Mg | 15.66 | 0.86 |
| Na(BC)Ca | 14.96 | 0.80 |
| K(BC)Be | 3.46 | 2.68 |
| K(BC)Mg | 16.26 | 1.16 |
| K(BC)Ca | 14.66 | 1.08 |
In the Li series, the value of Δμ decreases as the size of alkaline earth metal dopant increases in the order Li(BC)Be > Li(BC)Mg > Li(BC)Ca. In the Na series, the decreasing order of Δμ is Na(BC)Be > Na(BC)Mg > Na(BC)Ca, and for K, the order is K(BC)Be > K(BC)Mg > K(BC)Ca. But all the doped complexes have higher values of Δμ than the surface and the largest value is observed for K(BC)Be (2.68). The trend of increasing ground state dipole moment and transition dipole moment is shown in Fig. 7, which might be expected to boost the optical and nonlinear optical properties of the materials.
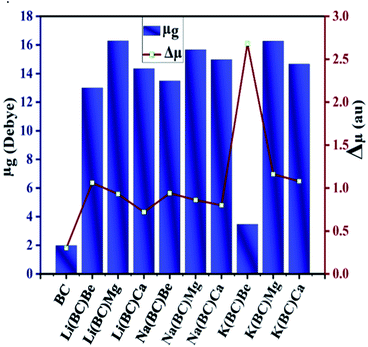 | ||
| Fig. 7 Graphical representation of ground state and transition dipole moment of all the studied compounds. | ||
3.5. TDM analysis
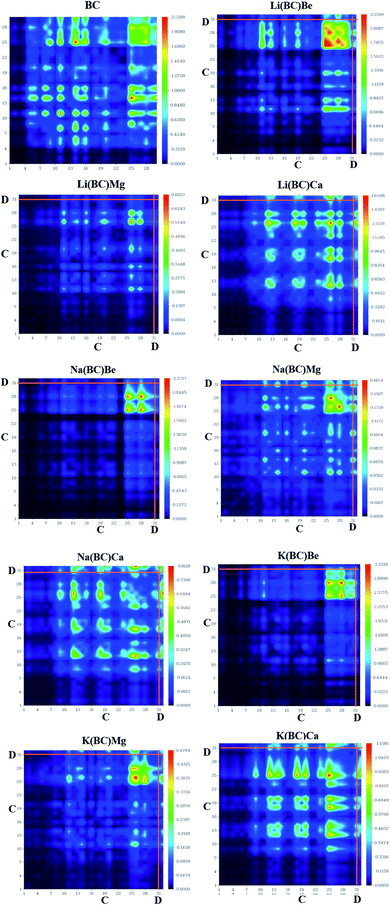
Transition density matrix (TDM) suggests information about the delocalization of electrons from the donor to the acceptor, charge transition locations, and quantum geometry of molecules.53 Also, it provides information about the position of electrons, holes, electron–hole overlap, and excitation of electrons when light falls on the molecule. It gives information about intermolecular charge transfer (ICT) and their hidden potentials.54 TDM analysis was computed using B3LYP/6-31G+(d, p) level of theory and its colorful 3-D illustration was attained using Multiwfn software. The TDM graphs of the cage BC and all other doped complexes are shown in Fig. 8, in which the right y-axis represents the coefficient of transition and electron density after light interactions with atoms, while the bottom x-axis and left y-axis represent the number of atoms. On the colored y-axis scale, blue and red colors represent the lowest and highest charge transition density, respectively, and the other three colors symbolize intermediate charge transition density, donor (D), and cage (C) acting as an acceptor. Hydrogen atoms are overlooked due to negligible contribution to charge transitions. The colored TDM maps of BC and all the newly designed molecules have shown competent diagonal and off-diagonal charge transfer and distribution coherency. The bright spots on the graphs represent the electronic cloud and transition residents directing the number of atoms as charge transition locations. In cage BC, the charge is uniformly distributed all over the molecule, exhibiting localized and delocalized (on benzene ring) electron density, and high transition density is present on the benzene ring. In all the newly designed molecules, the charge is more concentrated on the donor, i.e., alkali and alkaline earth metal dopants, and there is notable intermolecular charge transfer from the donor to the acceptor. Also, the high transition density is localized on atoms 25th to 32nd, which indicates the benzene ring and dopants. This high transition density and intermolecular charge transfer is necessary for effective NLO response.3.6. Molecular electrostatic potential (MEP) analysis
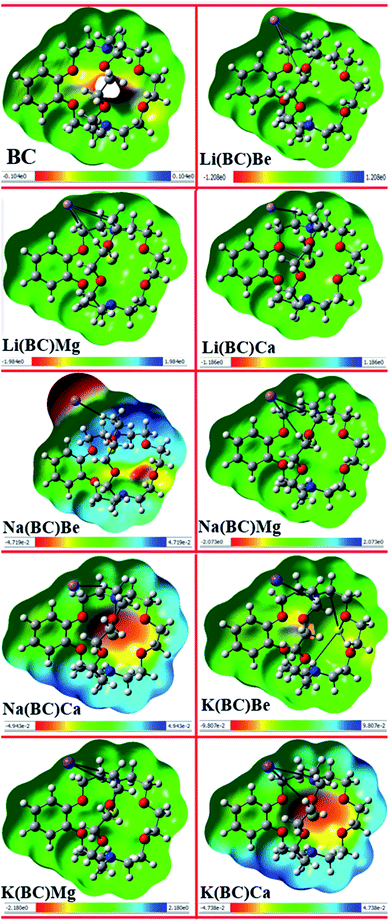
Electrostatic potential map provides information about the reactivity of the chemical compounds and sensitive positions for electrophilic and nucleophilic attack on the basis of charge distribution and photophysical properties. The electrophilic and nucleophilic sites of the reference molecule BC and all other newly designed molecules were simulated using the B3LYP/6-31+G(d, p) level of theory. The MEP maps of all the studied complexes along with their scales are shown in Fig. 9, wherein different color bands represent the electron density and charge distribution all over the molecules.The red color in the MEP map represents the negative or electron rich site, which is sensitive to electrophilic attack, and the blue areas demonstrate the positive or electron deficient region, which are available for nucleophilic attack. Also, the green color symbolizes the neutral sites of the molecules. In all the designed complexes, negative potential or electron rich sites are alkali and alkaline earth metal dopants available for electrophilic attack, and the positive potential or electron deficient sites are the atoms on the ring of the cavity side of BC.
3.7. Non-covalent interaction (NCI) analysis
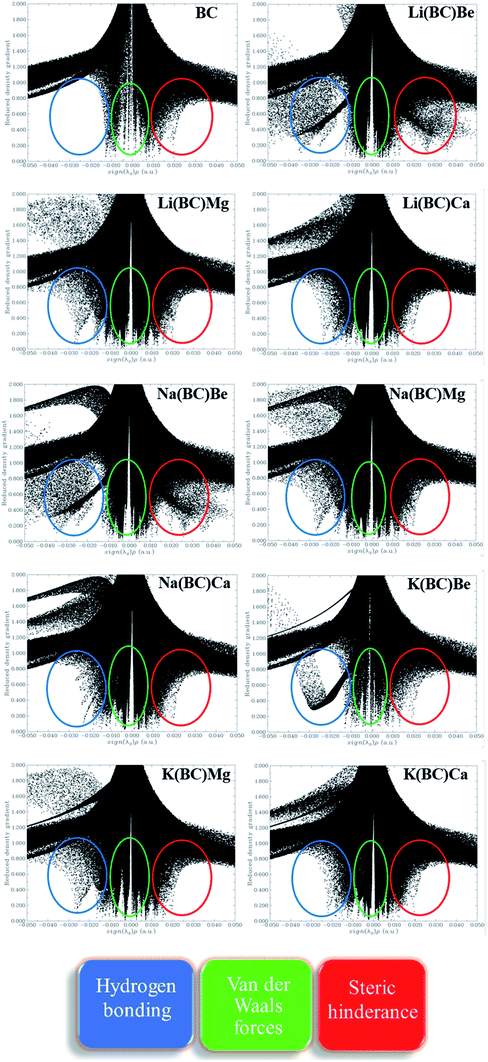
The strength of intermolecular interactions between the dopant and the surface was studied by NCI plots using Multiwfn software. It gives valuable information about non-covalent interactions present among atoms in the complex system, i.e., weak forces of interactions. The different areas of the graph represent different types of interactions such as steric hindrance, van der Waals forces, and hydrogen bonding present in a system. Thus, the stability of the system was also predicted by NCI analysis.The scatter graph of NCI is plotted between two functions, namely, reduced density gradient (RDG) on the y-axis and electron density sign λ2 (ρ) on the x-axis, which visualizes the section and the type of physical forces of interactions. The region sign λ2 (ρ) < 0 denotes strong forces of attractions, and the repulsive forces of interactions are represented by λ2 (ρ) > 0 area of the graph. Also, the points in the region sign λ2 (ρ) ≈ 0 characterize the van der Waals forces of interactions. Thus, RDG and electron density functions provide a good depiction of non-covalent interactions between the dopants and the surface.
The NCI graphs of surface BC and all the doped complexes have been shown in the Fig. 10, where the blue color ring demonstrates attractive forces, i.e., hydrogen-bonding, the green shade loop displays weak interactions, i.e., van der Waals forces, and the red hue circle shows repulsive forces, i.e., steric hindrance. In surface BC, a few points are present in the region sign λ2 (ρ) < 0; thus, there is no H-bonding but a few van der Waals interaction and steric hindrance. Moreover, in all the other doped systems, there are high concentrations of points in the sign λ2 (ρ) < 0 and sign λ2 (ρ) ≈ 0, which shows that strong attractive forces and van der Waals interaction are present, which is beneficial for promising NLO response.
3.8. IR analysis
The infrared (IR) analysis of the pure surface BC and all the doped complexes were computed to investigate the change in the characteristics of molecules after doping. IR analysis gives information about the types of the functional groups and the vibrational modes of the molecules by the absorption of light. The spectral illustration of the IR results is given in the ESI,† and the comprehensive detail of the vibrational frequencies of all the studied compounds is given in the Table 7. In all the studied compounds, the strong peaks of C–H stretching vibrations are observed in the range of 3000–2840 cm−1. The heteroatomic organic compounds structurally related to the benzene ring also exhibit weak bands of stretching vibrations in the range of 3100–3000 cm−1. The weak C–O bond stretching vibrations are observed in the range of 1275–1085 cm−1. The C–N bond stretching vibrations are generally active in the range of 1250–1020 cm−1 and their strong peaks are also observed.| Molecules | Frequency (cm−1) | Group | Vibrations |
|---|---|---|---|
| BC | 2968 | C–H | Stretching |
| 3094 | C–H | Stretching | |
| 1085 | C–O | Stretching | |
| 1162 | C–O | Stretching | |
| Li(BC)Be | 2989 | C–H | Stretching |
30![[thin space (1/6-em)]](https://www.rsc.org/images/entities/char_2009.gif) 094 094 |
C–H | Stretching | |
| 1078 | C–O | Stretching | |
| 1134 | C–O | Stretching | |
| Li(BC)Mg | 2919 | C–H | Stretching |
| 3010 | C–H | Stretching | |
| 1225 | C–O | Stretching | |
| 1148 | C–O | Stretching | |
| Li(BC)Ca | 2947 | C–H | Stretching |
| 3010 | C–H | Stretching | |
| 1218 | C–O | Stretching | |
| 1120 | C–O | Stretching | |
| Na(BC)Be | 2972 | C–H | Stretching |
30![[thin space (1/6-em)]](https://www.rsc.org/images/entities/char_2009.gif) 052 052 |
C–H | Stretching | |
| 1083 | C–O | Stretching | |
| 1156 | C–O | Stretching | |
| Na(BC)Mg | 2892 | C–H | Stretching |
| 3004 | C–H | Stretching | |
| 1220 | C–O | Stretching | |
| 1076 | C–O | Stretching | |
| Na(BC)Ca | 2954 | C–H | Stretching |
| 3024 | C–H | Stretching | |
| 1218 | C–O | Stretching | |
| 1120 | C–O | Stretching | |
| K(BC)Be | 2972 | C–H | Stretching |
| 3028 | C–H | Stretching | |
| 1252 | C–O | Stretching | |
| 1156 | C–O | Stretching | |
| K(BC)Mg | 2988 | C–H | Stretching |
| 3060 | C–H | Stretching | |
| 1220 | C–O | Stretching | |
| 1156 | C–O | Stretching | |
| K(BC)Ca | 2956 | C–H | Stretching |
| 3012 | C–H | Stretching | |
| 1276 | C–O | Stretching | |
| 1116 | C–O | Stretching |
IR analysis has shown that all the C–H, C–O, and C–N vibrational frequencies for BC and all the newly designed complexes found in the abovementioned ranges show slight variations before and after the doping of alkali and alkaline earth metals; also, all the vibrations are stretching vibrations. The precise values of all the frequencies at which stretching vibrations are observed are displayed in Table 7.
3.9. EDDM analysis
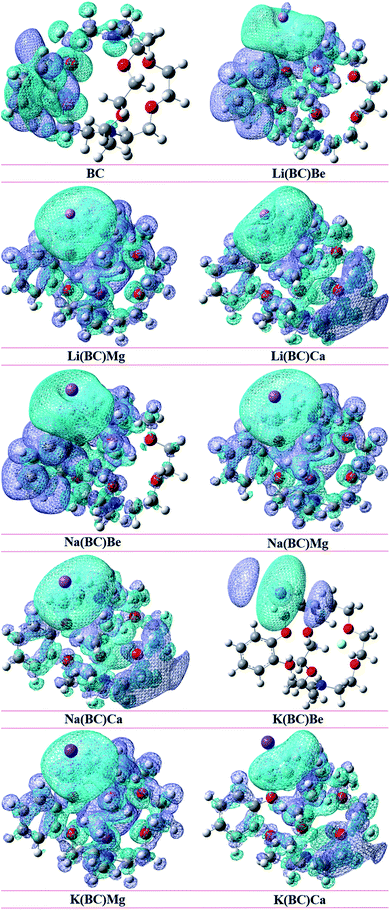
To understand the reorganization of electrons and also the charge transfer capacity, electron density difference method (EDDM) analysis was performed. It gives sound information and visualization about the electron density difference, in which the molecular orbitals of the excited states are subtracted from the molecular orbitals of the ground states55 (ρexcited − ρground). The EDDM of the reference and all the doped complexes was computationally envisioned at the B3LYP/6-31G+(d, p) level of theory. The net charge density of the subtracted molecular orbitals is represented by EDDM, which is illustrates by sea-green and blue color in Fig. 11.The sea-green color in EDDM represents the accumulated positive charge density, in which electrons reorganize for transition, and the blue color shows the negative charge density, which is the reduction of the electron density after excitation. The EDDM diagrams exposed that the charge density in the reference BC is distributed on the ring of cavity side, mainly on benzene. In the charge distribution illustration of the complexes, K(BC)Be shows charge density concentrated on K (dopant), but in all the other complexes, the charge is distributed all over the molecule. Thus, EDDM analysis gives improved representations of electron distribution after excitation from the ground to the excited state by subtracting the high energy orbitals from lower energy orbitals.
3.10. Electrical conductivity (σ)
The electrical conductivity is also a significant aspect to probe the NLO properties of the doped complexes. The electrical conductivity is the function of energy gap (EG); thus, narrowing the HOMO–LUMO energy gap will boosts it. In this study, after doping the largely delocalized π-conjugated surface of BC with alkali and alkaline earth metals, the energy gap was reduced; hence, all these newly designed moieties become more semiconducting than the reference BC. The relation between the electrical conductivity and energy gap is given by the following equation.56σα![[thin space (1/6-em)]](https://www.rsc.org/images/entities/char_2009.gif) exp(−EG/2kT) exp(−EG/2kT) |
In this equation, σ, EG, k, and T represents the electrical conductivity, energy gap, Boltzmann constant, and temperature, respectively. According to this equation, the decrease in the energy gap will enhance the electrical conductivity at a given temperature because there is an exponential relation between them. In this study, all the newly devised molecules have shown lower band gap in the range (0.68–2.23 eV), which is less than that of the reference BC (5.50 eV), resulting in high sensitivity of the electronic properties. Therefore, after doping all the molecules exposed to improve the electrical conductivity, the molecules lie in the order K(BC)Ca > Na(BC)Ca > Li(BC)Ca > K(BC)Mg > Na(BC)Mg > Li(BC)Mg > Li(BC)Be > Na(BC)Be > K(BC)Be. The lower bandgap is due to the dopant–surface interactions, which results in high charge transfer and hence excellent electric conductivity. Thus, the newly designed molecules may prove to be efficient sensing materials.
3.11. Nonlinear optical properties
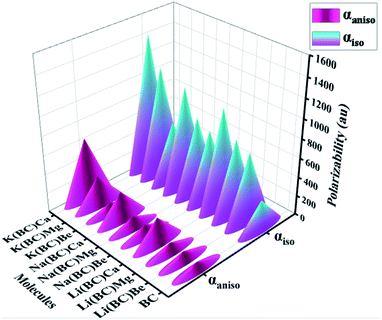
The most considerable parameters to investigate the NLO behavior of the pure and doped molecules are linear polarizability (α0) and first hyperpolarizability (βtl). To calculate these parameters computationally, B3LYP/631-G+(d, p) level of theory was applied, and the results are reported. The nonlinear optical behavior of the BC can be improved by the doping of excess electron atoms. In this study, alkali and alkaline earth metals were doped, and their polarizabilities and first hyperpolarizability values were computed.| Molecules | αiso (au) | αaniso (au) |
|---|---|---|
| BC | 308.67 | 81.36 |
| Li(BC)Be | 725.39 | 100.09 |
| Li(BC)Mg | 791.08 | 101.19 |
| Li(BC)Ca | 1038.85 | 278.55 |
| Na(BC)Be | 740.10 | 116.30 |
| Na(BC)Mg | 804.83 | 120.86 |
| Na(BC)Ca | 1059.55 | 305.83 |
| K(BC)Be | 629.59 | 102.40 |
| K(BC)Mg | 1142.51 | 313.83 |
| K(BC)Ca | 1423.23 | 650.53 |
The boosting of polarizabilities in all the designed molecules is due to the polarized electrons of alkali and alkaline earth metal dopants. These excess electrons are easy to excite, reduce the transition energies, and cause enhanced electronic properties. The excess electrons of alkali metals are more predisposed due to their lower ionization energies than that of alkaline earth metals and have more contribution in charge transfer. Also, the polarizabilities of the complexes of Li, Na, and K series increases with the increase in the size of the alkaline earth metal dopants. The increasing trend of isotropic and anisotropic polarizabilities of all the three series have been shown in Fig. 12. All these newly designed molecules exhibiting high values of polarizability are expected to show excellent NLO response.
| Molecules | βx (au) | βy (au) | βz (au) | βtl (au) |
|---|---|---|---|---|
| BC | −341.25 | 77.73 | −198.431 | 402.33 |
| Li(BC)Be | −20![[thin space (1/6-em)]](https://www.rsc.org/images/entities/char_2009.gif) 698.74 698.74 |
−12![[thin space (1/6-em)]](https://www.rsc.org/images/entities/char_2009.gif) 242.77 242.77 |
14![[thin space (1/6-em)]](https://www.rsc.org/images/entities/char_2009.gif) 609.76 609.76 |
38![[thin space (1/6-em)]](https://www.rsc.org/images/entities/char_2009.gif) 138.38 138.38 |
| Li(BC)Mg | 80![[thin space (1/6-em)]](https://www.rsc.org/images/entities/char_2009.gif) 076.12 076.12 |
−29![[thin space (1/6-em)]](https://www.rsc.org/images/entities/char_2009.gif) 803.30 803.30 |
15![[thin space (1/6-em)]](https://www.rsc.org/images/entities/char_2009.gif) 624.62 624.62 |
86![[thin space (1/6-em)]](https://www.rsc.org/images/entities/char_2009.gif) 859.37 859.37 |
| Li(BC)Ca | 228![[thin space (1/6-em)]](https://www.rsc.org/images/entities/char_2009.gif) 786.55 786.55 |
−338![[thin space (1/6-em)]](https://www.rsc.org/images/entities/char_2009.gif) 800.80 800.80 |
70![[thin space (1/6-em)]](https://www.rsc.org/images/entities/char_2009.gif) 156.79 156.79 |
414![[thin space (1/6-em)]](https://www.rsc.org/images/entities/char_2009.gif) 790.60 790.60 |
| Na(BC)Be | 23![[thin space (1/6-em)]](https://www.rsc.org/images/entities/char_2009.gif) 887.65 887.65 |
13![[thin space (1/6-em)]](https://www.rsc.org/images/entities/char_2009.gif) 839.86 839.86 |
23![[thin space (1/6-em)]](https://www.rsc.org/images/entities/char_2009.gif) 365.23 365.23 |
36![[thin space (1/6-em)]](https://www.rsc.org/images/entities/char_2009.gif) 167.60 167.60 |
| Na(BC)Mg | −103![[thin space (1/6-em)]](https://www.rsc.org/images/entities/char_2009.gif) 229.52 229.52 |
20![[thin space (1/6-em)]](https://www.rsc.org/images/entities/char_2009.gif) 414.25 414.25 |
21![[thin space (1/6-em)]](https://www.rsc.org/images/entities/char_2009.gif) 605.84 605.84 |
107![[thin space (1/6-em)]](https://www.rsc.org/images/entities/char_2009.gif) 423.87 423.87 |
| Na(BC)Ca | −343![[thin space (1/6-em)]](https://www.rsc.org/images/entities/char_2009.gif) 467.30 467.30 |
330![[thin space (1/6-em)]](https://www.rsc.org/images/entities/char_2009.gif) 902.70 902.70 |
36![[thin space (1/6-em)]](https://www.rsc.org/images/entities/char_2009.gif) 585.88 585.88 |
478![[thin space (1/6-em)]](https://www.rsc.org/images/entities/char_2009.gif) 335.50 335.50 |
| K(BC)Be | 3395.48 | −1395.14 | 425.86 | 3695.55 |
| K(BC)Mg | 317![[thin space (1/6-em)]](https://www.rsc.org/images/entities/char_2009.gif) 437.80 437.80 |
116![[thin space (1/6-em)]](https://www.rsc.org/images/entities/char_2009.gif) 986.40 986.40 |
66![[thin space (1/6-em)]](https://www.rsc.org/images/entities/char_2009.gif) 260.52 260.52 |
344![[thin space (1/6-em)]](https://www.rsc.org/images/entities/char_2009.gif) 736.18 736.18 |
| K(BC)Ca | 875![[thin space (1/6-em)]](https://www.rsc.org/images/entities/char_2009.gif) 507.30 507.30 |
−244![[thin space (1/6-em)]](https://www.rsc.org/images/entities/char_2009.gif) 895.79 895.79 |
−53![[thin space (1/6-em)]](https://www.rsc.org/images/entities/char_2009.gif) 844.38 844.38 |
910![[thin space (1/6-em)]](https://www.rsc.org/images/entities/char_2009.gif) 706.43 706.43 |
| βtlαΔμfo/ΔE3 |
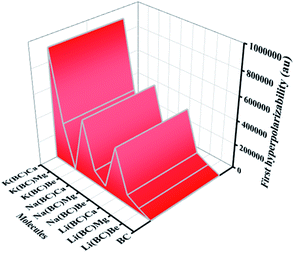
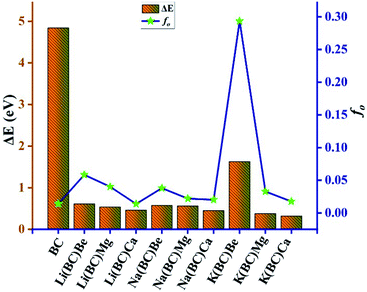
In this equation, Δμ is the difference in the dipole moment between the ground state and the critical excited state, i.e., the excited state (with the lowest transition energy and the highest oscillator strength), fo is the oscillator strength, and ΔE is the transition energy. The two-level model demonstrates that the value of hyperpolarizability is directly related to the Δμ and fo. Also, there is an inverse relation between βtl and third power of excitation energy (ΔE3). The excited states of all the molecules were calculated by the TD-DFT method, which involve excitation from the HOMO to the higher states, i.e., LUMO+n. The transition energy of the reference BC is 4.84 eV but for all the doped complexes, ΔE decreases surprisingly and causes a remarkable rise in the hyperpolarizability because βtl increases with the decrease in one third of ΔE.
The lowest value of transition energy is observed for K(BC)Ca (0.32 eV), and the decreasing trend of all the doped complexes is shown in Fig. 14. The transition dipole moment of the surface is 0.30 au, but after doping, there is a considerable increase in it. Thus, the boosting of Δμ also enhances the βtl because of a direct relation between these two terms. Also, the oscillator strength is a key factor that enhances the βtl. For surface BC, the value of fo is 0.014, but after doping, there is a remarkable increase in the fo, which causes the enhancement of βtl. The highest value of fo is observed for K(BC)Be (0.2934) and the increasing trend of fo for all other newly designed complexes is shown in Fig. 14.
4. Conclusion
In this research, density functional theory was performed to investigate the geometry, stability, and nonlinear optical properties of alkali and alkaline earth metal-doped benzocryptand (BC). Alkali metal-doped exohedral and alkaline earth metal-doped endohedral have a noteworthy effect on the electronic and optical properties of BC. Geometrical analysis unveiled that there are slight changes in the bond length and dihedral angles between different atoms, but the overall symmetry (C1) remains the same. The higher vertical ionization energies and negative interaction energies suggested the thermodynamic stability of these complexes. The HOMO–LUMO energy gap was also reduced after doping due to the loosely bound electrons of alkali atoms. A significant increase in the NLO properties occurred due to reduced band gap, higher oscillator strength, and lower transition energies. All the complexes possessed high isotropic polarizability (αiso) than the anisotropic polarizability (αaniso), which showed that these materials are isotropic with a uniform behavior in all the directions. The enhanced transition dipole moment (Δμ) also boosted the first hyperpolarizability (βtl) of all the complexes. The highest value of (βtl) is given by K(BC)Ca, i.e., 910![[thin space (1/6-em)]](https://www.rsc.org/images/entities/char_2009.gif) 706.43 au, which is much higher than that of the surface. NCI analysis shows weak van der Waals interactions between the dopant and the surface, and IR analysis provided information about the vibrational frequencies associated with atoms. High electrical conductivity was observed due to high charge transfer and low band gap. UV-vis analysis revealed the maximum absorption of all the complexes in the visible and NIR region, and was transparent in the UV region. These complexes will overlay the path for the further exploration of UV-transparent NLO materials. Finally, we expect that alkali and alkaline earth metal-doped excess electron compounds provide excellent NLO response for high performance NLO materials.
706.43 au, which is much higher than that of the surface. NCI analysis shows weak van der Waals interactions between the dopant and the surface, and IR analysis provided information about the vibrational frequencies associated with atoms. High electrical conductivity was observed due to high charge transfer and low band gap. UV-vis analysis revealed the maximum absorption of all the complexes in the visible and NIR region, and was transparent in the UV region. These complexes will overlay the path for the further exploration of UV-transparent NLO materials. Finally, we expect that alkali and alkaline earth metal-doped excess electron compounds provide excellent NLO response for high performance NLO materials.
Conflicts of interest
No declaration of conflicts.Acknowledgements
The authors acknowledge the financial and technical support from the Punjab Bio-energy Institute (PBI) and the University of Agriculture Faisalabad (UAF), Pakistan. The authors acknowledge the financial support of Taif University Researchers Supporting Project number (TURSP-2020/32), Taif University, Taif, Saudi Arabia.References
- T. H. Maiman, Nature, 1960, 187, 493–494 CrossRef.
- A. Ahsin and K. Ayub, Mater. Sci. Semicond. Process., 2022, 138, 106254 CrossRef CAS.
- M. Anis, S. M. Azher, M. D. Shirsat, M. Imran Anees, M. Mukhtar, M. I. Baig and H. H. Somaily, Inorg. Chem. Commun., 2021, 134, 109019 CrossRef CAS.
- D. R. Kanis, M. A. Ratner and T. J. Marks, Chem. Rev., 1994, 94, 195–242 CrossRef CAS.
- A. Datta and S. Pal, J. Mol. Struct.: THEOCHEM, 2005, 715, 59–64 CrossRef CAS.
- M. Khalid, A. Ali, R. Jawaria, M. A. Asghar, S. Asim, M. U. Khan, R. Hussain, M. Fayyaz ur Rehman, C. J. Ennis and M. S. Akram, RSC Adv., 2020, 10, 22273–22283 RSC.
- M. U. Khan, M. Khalid, S. Asim, K. Mahmood, J. Iqbal, M. N. Akhtar, A. Hussain, M. Imran and A. Irfan, Front. Mater., 2021, 8, 719971 CrossRef.
- A. Ahsan and K. Ayub, J. Mol. Liq., 2019, 297, 111899 CrossRef.
- M. Mutailipu, M. Zhang, B. Zhang, L. Wang, Z. Yang, X. Zhou and S. Pan, Angew. Chem., 2018, 130, 6203–6207 CrossRef.
- H. Chen, P.-F. Liu, B.-X. Li, H. Lin, L.-M. Wu and X.-T. Wu, Dalton Trans., 2018, 47, 429–437 RSC.
- J. C. Calabrese, L. T. Cheng, J. C. Green, S. R. Marder and W. Tam, J. Am. Chem. Soc., 1991, 113, 7227–7232 CrossRef CAS.
- J. Abe, Y. Shirai, N. Nemoto and Y. Nagase, J. Phys. Chem. A, 1997, 101, 1–4 CrossRef CAS.
- M. S. Al-Buriahi, V. P. Singh, H. Arslan, V. V. Awasarmol and B. T. Tonguc, Radiat. Environ. Biophys., 2020, 59, 145–150 CrossRef CAS PubMed.
- R. Medishetty, J. K. Zaręba, D. Mayer, M. Samoć and R. A. Fischer, Chem. Soc. Rev., 2017, 46, 4976–5004 RSC.
- A. Ahsan and K. Ayub, J. Mol. Liq., 2020, 297, 111899 CrossRef CAS.
- G. S. He, J. Zhu, A. Baev, M. Samoć, D. L. Frattarelli, N. Watanabe, A. Facchetti, H. Ågren, T. J. Marks and P. N. Prasad, J. Am. Chem. Soc., 2011, 133, 6675–6680 CrossRef CAS.
- K. Fukuda, N. Matsushita, Y. Minamida, H. Matsui, T. Nagami, S. Takamuku, Y. Kitagawa and M. Nakano, ChemistrySelect, 2017, 2, 2084–2087 CrossRef CAS.
- Y. Liu, X. Xu, F. Zheng and Y. Cui, Angew. Chem., 2008, 120, 4614–4617 CrossRef.
- A. Ahsan and K. Ayub, Opt. Laser Technol., 2020, 129, 106298 CrossRef CAS.
- A. Ahsin and K. Ayub, J. Mol. Graphics Modell., 2021, 109, 108031 CrossRef CAS PubMed.
- I. S. Taschner, T. L. Walker, B. R. Schrage, C. J. Ziegler, X. Gao and S. E. Wheeler, Org. Chem. Front., 2020, 7, 1164–1176 RSC.
- R. Behjatmanesh-Ardakani, M. D. Arab, A. Saleem, Z. M. Kotena and S. B. Mohamad, Int. J. Pharm. Sci. Rev. Res., 2016, 10, 45–53 Search PubMed.
- B. Dietrich, J. Lehn and J. Sauvage, Tetrahedron Lett., 1969, 10, 2885–2888 CrossRef.
- J. Lehn, in Chemistry for the Welfare of Mankind, Elsevier, 1979, pp. 871–892 Search PubMed.
- R. M. Izatt, K. Pawlak, J. S. Bradshaw and R. L. Bruening, Chem. Rev., 1991, 91, 1721–2085 CrossRef CAS.
- J. Lehn and J. Sauvage, J. Am. Chem. Soc., 1975, 97, 6700–6707 CrossRef CAS.
- C. Pedersen, J. Lehn and D. Cram, Resonance, 2001, 6, 71–79 Search PubMed.
- W. H. Watson, J. Galloy, D. A. Grossie, F. Voegtle and W. Mueller, J. Org. Chem., 1984, 49, 347–353 CrossRef CAS.
- R. Behjatmanesh-Ardakani, M. Arab, A. Khazaal, Z. Mosapour Kotena and S. Bin Mohamad, International Journal of Pharmaceutical Sciences Review and Research, 2016, 39, 45–53 CAS.
- F. Khaliq, K. Ayub, T. Mahmood, S. Muhammad, S. Tabassum and M. A. Gilani, Mater. Sci. Semicond. Process., 2021, 135, 106122 CrossRef CAS.
- A. Ahsin and K. Ayub, Mater. Sci. Semicond. Process., 2021, 134, 105986 CrossRef CAS.
- Maria, J. Iqbal, R. Ludwig and K. Ayub, Mater. Res. Bull., 2017, 92, 113–122 CrossRef CAS.
- Y.-F. Wang, J. Huang, L. Jia and G. Zhou, J. Mol. Graphics Modell., 2014, 47, 77–82 CrossRef PubMed.
- W.-Y. Wang, N.-N. Ma, C.-H. Wang, M.-Y. Zhang, S.-L. Sun and Y.-Q. Qiu, J. Mol. Graphics Modell., 2014, 48, 28–35 CrossRef CAS PubMed.
- R. G. Parr, in Horizons of Quantum Chemistry, Springer, 1980, pp. 5–15 Search PubMed.
- A. Fazilath Basha, F. Liakath Ali Khan, S. Muthu and M. Raja, Comput. Theor. Chem., 2021, 1198, 113169 CrossRef.
- X. Wang, H. Wang and Y. Tan, J. Comput. Chem., 2008, 29, 1423–1428 CrossRef CAS PubMed.
- O. A. Gansow and A. R. Kausar, Inorg. Chim. Acta, 1985, 109, 1–6 CrossRef CAS.
- N. Pandey, M. S. Mehata, S. Pant and N. Tewari, J. Fluoresc., 2021, 31, 1719–1729 CrossRef CAS PubMed.
- C. Valverde, S. A. d. L. e Castro, G. R. Vaz, J. L. de Almeida Ferreira, B. Baseia and F. A. Osório, Acta Chim. Slov., 2018, 65, 739–749 CrossRef CAS PubMed.
- R. A. Shehzad, J. Iqbal, K. Ayub, F. Nawaz, S. Muhammad, A. R. Ayub and S. Iqbal, Optik, 2021, 226, 165923 CrossRef CAS.
- A. Raza Ayub, R. Aqil Shehzad, S. S. Alarfaji and J. Iqbal, J. Nonlinear Opt. Phys. Mater., 2020, 29, 2050004 CrossRef CAS.
- A. Ahsin, T. Jadoon and K. Ayub, Phys. E, 2022, 140, 115170 CrossRef CAS.
- Y. Q. Jing, Z. R. Li, D. Wu, Y. Li, B. Q. Wang, F. L. Gu and Y. Aoki, ChemPhysChem, 2006, 7, 1759–1763 CrossRef CAS PubMed.
- A. Rasool, S. Zahid, R. A. Shehzad, M. S. Akhter and J. Iqbal, Comput. Theor. Chem., 2021, 1203, 113359 CrossRef CAS.
- N. A. Wazzan, O. S. Al-Qurashi and H. M. Faidallah, J. Mol. Liq., 2016, 223, 29–47 CrossRef CAS.
- M. Khalid, H. M. Lodhi, M. U. Khan and M. Imran, RSC Adv., 2021, 11, 14237–14250 RSC.
- D. Pegu, Int. J. Sci. Res., 2014, 3, 469–474 Search PubMed.
- M. U. Khan, R. Hussain, M. Yasir Mehboob, M. Khalid, Z. Shafiq, M. Aslam, A. A. Al-Saadi, S. Jamil and M. R. S. A. Janjua, ACS Omega, 2020, 5, 24125–24137 CrossRef CAS PubMed.
- S. Zahid, A. Rasool, M. Ans, M. S. Akhter, J. Iqbal, M. Al-Buriahi, S. Alomairy and Z. Alrowaili, Sol. Energy, 2022, 231, 793–808 CrossRef CAS.
- M. N. Arshad, M. Khalid, M. Asad, A. M. Asiri, M. M. Alotaibi, A. A. Braga and A. Khan, RSC Adv., 2022, 12, 4209–4223 RSC.
- A. S. Rad and K. Ayub, J. Alloys Compd., 2016, 678, 317–324 CrossRef CAS.
- M. Salim, M. Rafiq, Y. A. El-Badry, R. A. Khera, M. Khalid and J. Iqbal, J. Mol. Model., 2021, 27, 1–14 CrossRef PubMed.
- A. Bibi, S. Muhammad, S. UrRehman, S. Bibi, S. Bashir, K. Ayub, M. Adnan and M. Khalid, ACS Omega, 2021, 6, 24602 CrossRef CAS PubMed.
- R. Kiran, R. A. Khera, A. U. Khan, A. Ayoub, N. Iqbal, K. Ayub and J. Iqbal, J. Mol. Struct., 2021, 1236, 130348 CrossRef CAS.
- S. Zahid, A. Rasool, A. R. Ayub, K. Ayub, J. Iqbal, M. Al-Buriahi, N. Alwadai and H. Somaily, RSC Adv., 2022, 12, 5466–5482 RSC.
- J.-L. Oudar and D. Chemla, J. Chem. Phys., 1977, 66, 2664–2668 CrossRef CAS.
Footnote |
| † Electronic supplementary information (ESI) available: In ESI file, optimized Cartesian coordinates of all the studied compounds are presented. See https://doi.org/10.1039/d2ra02209e |
| This journal is © The Royal Society of Chemistry 2022 |

