 Open Access Article
Lignin-based composites for high-performance supercapacitor electrode materials
Peng-Hui Li ab,
Yu-Meng Weib,
Cai-Wen Wu
 ab,
Chi Yangb,
Bo Jiangab and
Wen-Juan Wu*ab
aJiangsu Co-Innovation Center of Efficient Processing and Utilization of Forest Resources, Nanjing Forestry University, Nanjing, 210037, P. R. China. E-mail: wenjuanwu@njfu.edu.cn
bCollege of Light Industry and Food Engineering, Nanjing Forestry University, Nanjing, 210037, P. R. China
First published on 6th July 2022
Abstract
With the rapid development of the global economy, the depletion of fossil fuels and the intensification of environmental pollution, there is an increasingly urgent need for new and green electrochemical energy storage technologies in society. In this thesis, ligninsulfonate/polyaniline nanocomposites were synthesized by in situ chemical oxidation using aniline as the monomer, lignin as the template and dopant, and ammonium persulfate as the oxidant. The results showed that the average diameter of the ligninsulfonate/polyaniline nanocomposite was 85 nm, and the composite electrode exhibited good electron conduction ability and excellent capacitive performance by ligninsulfonate doping. The electrode material showed the best electrochemical performance when the ligninsulfonate addition was 0.1 g. The specific capacitance can reach 553.7 F g−1 under the current density of charge/discharge 1 A g−1, which is higher than that of the pure PANI electrode. The composite electrode material has good multiplicative performance and cycling stability, and the capacitance retention rate can be maintained at 68.01% after 5000 cycles at a charge/discharge current density of 10 A g−1 (three-electrode system), and the capacitance retention rate can be maintained at 54.84% after 5000 cycles at a charge/discharge current density of 5 A g−1 (two-electrode system).
1 Introduction
With the rapid development of modern society and economy, the demands for and consumption of petroleum-based fossil fuel resources are increasing. The environmental pollution problem caused by fossil fuels is also becoming more and more serious, and the development of green, sustainable and efficient electrode materials for energy conversion and storage is becoming urgent.1 Supercapacitors, lithium-ion batteries and fuel cells are widely used energy storage devices.2 Among them, supercapacitors have become a popular research topic in recent years because of their high energy storage density, fast charging and discharging, and stable cyclic charging and discharging.3 As an essential component of supercapacitors, electrode materials have advantages such as low cost, easy preparation, and good electrical conductivity. Among many electrode materials, conductive polyaniline (PANI) has attracted much attention because of its simple preparation method, good ionic conductivity, high theoretical capacitance, wide operating potential window, flexible modification, and high-cost effectiveness.4–6 Its electrochemical properties are complex, with unique doping mechanisms and diverse structures, including fully reduced colorless emerald green imine, intermediate state green emerald green imine, fully oxidized aniline black and other forms, which can be prepared in practice according to the production needs of different forms of polyaniline products,7 including carbon,8–10 metal oxides,11–13 metal sulfides,14 metal–organic skeletons,15 etc., and the improved electrochemical properties may be related to their unique morphology and the synergistic effect among these components. However, at the same time, the low solubility of PANI makes the processing of the material challenging, and the disadvantages such as slight heat transfer mass loss, low practical capacitance, and low stability of charge/discharge cycles have become a challenge to be solved in recent years.16Lignin is the most abundant renewable aromatic compound on earth, with the advantages of low cost, high carbon content, renewable and broad source, which can produce a variety of biomass products such as adhesives and dispersants.17,18 Currently, industrial lignin is mainly derived from the chemical pulping process in the pulp and paper industry, where ligninsulfonate (LS) is the main byproduct of the acid pulping process. Its molecular structure is rich in phenolic hydroxyl and sulfonic acid groups and other reactive groups, which are incorporated into the conductive material matrix to form well-connected conductive pathways that can store and release electron protons for charge transfer through surface redox reactions. This confers good electrical conductivity to the conducting polymers.19–21 In addition, the catechol/quinone groups on ligninsulfonate can be converted to each other by redox, and the introduction of polyaniline conducting polymers can promote the electron transfer in the redox process, which can further form a self-redox system.22
In this thesis, ligninsulfonate/polyaniline nanocomposites were prepared from ligninsulfonate by in situ polymerization embedded in the conducting polymer polyaniline, and their structure, morphology and capacitive properties were characterized.
2 Materials and methods
2.1 Raw materials and reagents
Ligninsulfonate (LS, Mw = 10![[thin space (1/6-em)]](https://www.rsc.org/images/entities/char_2009.gif) 000) was purchased from Aladdin Reagent Co. Conductive carbon black, polyvinylidene fluoride (PVDF), aniline (twice distilled under reduced pressure when used), ammonium persulfate were purchased from Nanjing Maclean's Reagent Company, concentrated hydrochloric acid was all domestic analytical purity, and the laboratory water was ultrapure water.
000) was purchased from Aladdin Reagent Co. Conductive carbon black, polyvinylidene fluoride (PVDF), aniline (twice distilled under reduced pressure when used), ammonium persulfate were purchased from Nanjing Maclean's Reagent Company, concentrated hydrochloric acid was all domestic analytical purity, and the laboratory water was ultrapure water.
2.2 Preparation of ligninsulfonate/polyaniline (LS/PANI) composites
The ligninsulfonate/polyaniline composites were prepared by chemical oxidative polymerization according to the literature.23,24 0.1 g of LS was weighed and dispersed in 50 mL of 1.0 M hydrochloric acid solution, and 0.9 mL of aniline was added to the above suspension and stirred magnetically at 0 °C for 2 h. Another 2.3 g of ammonium persulfate (APS) was weighed and dissolved in 50 mL of 1.0 M HCl solution as an oxidant. The above solutions were mixed in the molar ratio of aniline to APS of 1![[thin space (1/6-em)]](https://www.rsc.org/images/entities/char_2009.gif) :
:![[thin space (1/6-em)]](https://www.rsc.org/images/entities/char_2009.gif) 1 and polymerized by in situ chemical oxidation at 0 °C for 24 h. The reaction products were filtered and the filter residue was washed repeatedly with distilled water to pH = 7, freeze-dried for 48 h and vacuum dried until the mass remained unchanged to obtain LS0.1/PANI composites (LS
1 and polymerized by in situ chemical oxidation at 0 °C for 24 h. The reaction products were filtered and the filter residue was washed repeatedly with distilled water to pH = 7, freeze-dried for 48 h and vacuum dried until the mass remained unchanged to obtain LS0.1/PANI composites (LS![[thin space (1/6-em)]](https://www.rsc.org/images/entities/char_2009.gif) :
:![[thin space (1/6-em)]](https://www.rsc.org/images/entities/char_2009.gif) aniline mass ratio = 1
aniline mass ratio = 1![[thin space (1/6-em)]](https://www.rsc.org/images/entities/char_2009.gif) :
:![[thin space (1/6-em)]](https://www.rsc.org/images/entities/char_2009.gif) 9), and the polymerization mechanism is shown in Fig. 1. PANI, LS0.5/PANI and LS1/PANI were prepared by adding 0 g, 0.5 g and 1 g LS respectively, using the above method.
9), and the polymerization mechanism is shown in Fig. 1. PANI, LS0.5/PANI and LS1/PANI were prepared by adding 0 g, 0.5 g and 1 g LS respectively, using the above method.
2.3 Preparation of working electrodes
The electrode material, conductive carbon black and polytetrafluoroethylene (PVDF) were ground and mixed according to the mass ratio of 8![[thin space (1/6-em)]](https://www.rsc.org/images/entities/char_2009.gif) :
:![[thin space (1/6-em)]](https://www.rsc.org/images/entities/char_2009.gif) 1
1![[thin space (1/6-em)]](https://www.rsc.org/images/entities/char_2009.gif) :
:![[thin space (1/6-em)]](https://www.rsc.org/images/entities/char_2009.gif) 1, 12–15 drops of N-methylpyrrolidone (NMP) were added, and the slurry was ultrasonically shaken for about 15 min to obtain a homogeneous mixture. The slurry was coated on conductive carbon paper, and then the coated carbon paper was put into a vacuum oven and dried at a temperature of 80 °C for 12 h to complete the preparation of the working electrode.
1, 12–15 drops of N-methylpyrrolidone (NMP) were added, and the slurry was ultrasonically shaken for about 15 min to obtain a homogeneous mixture. The slurry was coated on conductive carbon paper, and then the coated carbon paper was put into a vacuum oven and dried at a temperature of 80 °C for 12 h to complete the preparation of the working electrode.
The electrode plates are assembled into a symmetrical supercapacitor, the electrode shell is CR2032 type, and the positive and negative electrode materials are the same material, both of which are composite materials prepared in this experiment. Two carbon papers with similar active materials are selected at a pressure of 10 MPa respectively. Tablets were pressed, using 1 mol L−1 H2SO4 aqueous solution as an electrolyte, encapsulated in a 2032 electrode shell by a packaging machine, and electrochemical tests were carried out after standing for 12 h.
2.4 Analysis method
The samples were measured by the KBr compression method on a German VERTEX 80V infrared spectrometer in the wavelength range of 4000–400 cm−1. Environmental scanning electron microscopy (SEM, Quanta 20) with transmission electron microscopy (TEM, JEM-1400) was used to observe the microscopic morphological characteristics of the polyaniline composites before and after ligninsulfonate doping. The samples were gold sprayed to eliminate static electricity before the SEM test; samples were prepared by ethanol suspension method before TEM test, dripped on copper mesh, dried and used for observation. An AXIS Ultra DLD X-ray photoelectron spectrometer (XPS) from Shimadzu, Japan was used to determine the surface chemical composition of the samples, including details of the surface elemental composition and peaks of C (C1s), O (O1s), N (N1s), and S (S2p). The sample detection concentration is greater than 0.1%, the detection depth is less than 10 nm, at least two samples are prepared for each raw material, and at least three different positions are measured for each sample. Include the relative content of elements and the type and relative content of chemical functional groups. The TGA209 F1 thermogravimetric analyzer (NETZSCH, Germany) was used to analyze the thermal stability performance of the samples, protected by high purity nitrogen, with an experimental temperature of 30–900 °C and a heating rate of 10 °C min−1. The crystal structure analysis of the polymers was carried out on a multifunctional horizontal X-ray diffractometer of the Japonic Ultima IV combination type, using the powder method. Test conditions: X-ray tube with CuKα target (λ = 0.15406 nm), graphite monochromator to eliminate CuKα radiation, tube voltage 40 kV, tube current 200 mA, scanning range 2θ = 5–60°, scanning step 0.02°, scanning rate 15° min−1, recording “diffraction intensity-2θ” curve. PerkinElmer EA 2400 II elemental analyzer was used to detect C, H, N and S content in the samples. The N2 adsorption and desorption isotherm data of samples were acquired using a Quantachrome Nova 2000e Surface and aperture analyzer (America) at low temperature and relative pressure P/P0 = 0.001–1. The Brunauer–Emmett–Teller (BET) method and Barrett–Joyner–Halenda (BJH) theory were utilized to calculate the specific surface area and pore size distributions of samples, respectively.The electronic conductivity of the PANI/LS composite was measured by the conventional four probe technique. Under a pressure of 20 MPa, the sample was pressed into a disk of 2 mm thickness. The electrochemical performance of LS/PANI composites was tested by using CH-instruments CHI660E electrochemical workstation in a three-electrode system and 1 mol L−1 H2SO4 electrolyte solution. The platinum sheet electrode was used as the counter electrode, and the Ag/AgCl electrode was used as the reference electrode. The cyclic voltammetric curves (CV) of the working electrodes were tested in the voltage range of −0.5 V to 1 V, and different sweep rates (10, 20, 30, 50, 100 mV s−1) were used to investigate the multiplicative properties. Constant current charge–discharge curves (GCD) were tested in the voltage range of −0.2 V to 0.8 V. The specific capacitance of the electrode material was calculated according to eqn (1) and obtained by testing conditions at different current densities (1, 3, 5, 10, 20, and 30 A g−1). AC impedance tests were performed on the carbon electrode in the frequency range of 10−2 to 105 Hz with an amplitude of 5 mV and an initial voltage of the open circuit. The cycle life of the composite electrode was investigated by conducting 5000 cycles of constant current charge/discharge tests at a current density of 10 A g−1 (three-electrode system). The cycle life of the composite electrode was investigated by conducting 5000 cycles of constant current charge/discharge tests at a current density of 5 A g−1 (two-electrode system).
The linear charge/discharge curve equation is shown in eqn (1):
| Cm = C/m = IΔt/(mΔv) | (1) |
The nonlinear charge/discharge curve equation is shown in eqn (2).
 | (2) |
The energy density and power density are expressed by the following eqn (3) and (4):
 | (3) |
 | (4) |
3 Results and discussion
3.1 Morphological analysis
The prepared samples were morphologically analyzed using SEM and TEM, as shown in Fig. 2. From the electron microscope scans of Fig. 2(a) and (b), it can be seen that the pure polyaniline without LS doping is a tightly interwoven stack, showing an irregular fibrous structure and exhibiting an extensive range of agglomeration. Due to the alternating benzene ring structure on the main chain of polyaniline, π–π conjugation is easily formed, and the intermolecular forces are significant. In LS/PANI composites, LS acts as a structural guide and a polyanion dopant, providing many active sites for the interaction of aniline monomers, through which polyaniline can grow along the LS chain, as seen in Fig. 2(e). LS/PANI presents an entirely different morphology from pure polyaniline, revealing a nanosphere structure with a significant specific surface area, which is favorable for electrolyte ion transport, and can ensure a high ion transport rate as an electrode material. From Fig. 2(f), it can be seen that the boundary between the nanofibers of LS/PANI composites becomes blurred, and the morphology is mostly spherical with a diameter of 85 nm for the clusters which is consistent with the spherical shape seen by SEM. In summary, it shows that the morphology and structure of PANI are susceptible to the influence of ligninsulfonate doping.25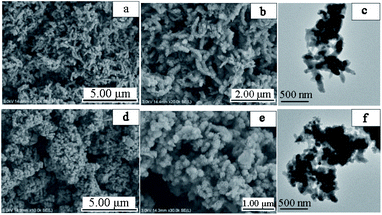 | ||
Fig. 2 SEM images of PANI (a) and (b) (magnification 10![[thin space (1/6-em)]](https://www.rsc.org/images/entities/char_2009.gif) 000, 20 000, 20![[thin space (1/6-em)]](https://www.rsc.org/images/entities/char_2009.gif) 000 times), SEM images of LS/PANI (d) and (e) (magnification 10 000 times), SEM images of LS/PANI (d) and (e) (magnification 10![[thin space (1/6-em)]](https://www.rsc.org/images/entities/char_2009.gif) 000, 30 000, 30![[thin space (1/6-em)]](https://www.rsc.org/images/entities/char_2009.gif) 000 times), TEM images of PANI and LS/PANI (c) and (f). 000 times), TEM images of PANI and LS/PANI (c) and (f). | ||
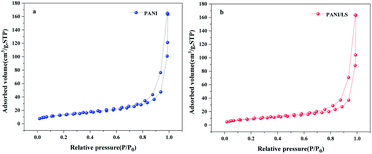
The specific surface area and pore size distribution of PANI and LS/PANI were characterised using N2 adsorption and desorption analysis. The adsorption–desorption isotherms of the two materials in the figure show a typical IUPAC Type IV with a distinct hysteresis return line characteristic.25 The specific surface area of LS/PANI was 32.1025 m2 g−1 (Fig. 3). The formation of porous, high specific surface area nanocomposites may be attributed to the fact that lignosulfonate acts as an anionic dispersant and hinders the growth of crystalline polyaniline, resulting in more porous nanocomposites and thus an increased specific surface area. In addition, the average pore size of LS/PANI increased from 3.22581 nm to 23.8821 nm due to the introduction of sodium lignosulfonate, indicating that LS can cross-link with polyaniline and form a network structure, which is consistent with the SEM results.
| Vibrating groups | Wavenumber (cm−1) | ||
|---|---|---|---|
| PANI | LS/PANI | LS | |
| O–H telescopic vibration | — | — | 3432 |
| N–H out-of-plane bending vibration | 3421 | 3421 | — |
| C–H telescopic vibration | 2931 | 2931 | 2931 |
C![[double bond, length as m-dash]](https://www.rsc.org/images/entities/char_e001.gif) C quinone ring skeleton vibration C quinone ring skeleton vibration |
1563 | 1565 | 1600 |
C![[double bond, length as m-dash]](https://www.rsc.org/images/entities/char_e001.gif) C benzene ring skeleton vibration C benzene ring skeleton vibration |
1481 | 1486 | 1506 |
| C–N benzene type structure stretching | 1301 | 1301 | — |
| C–N quinone-type structure stretching | 1249 | 1245 | — |
| N-(B)–N telescopic vibration | 1128 | 1133 | — |
S![[double bond, length as m-dash]](https://www.rsc.org/images/entities/char_e001.gif) O symmetric expansion and contraction vibration O symmetric expansion and contraction vibration |
— | 1041 | 1039 |
| C–H bending vibration of aromatic rings outside the surface | 802 | 808 | — |
3.2 FTIR analysis
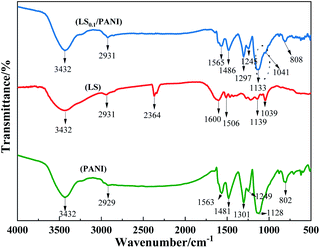
Fig. 4 shows the FTIR spectra of LS, PANI, and LS/PANI. The N–H stretching vibration peaks in PANI are located near 3432 cm−1. The two absorption peaks near 1563 and 1481 cm−1 are the C![[double bond, length as m-dash]](https://www.rsc.org/images/entities/char_e001.gif) N characteristic absorption peaks of the quinone ring and benzene ring C
N characteristic absorption peaks of the quinone ring and benzene ring C![[double bond, length as m-dash]](https://www.rsc.org/images/entities/char_e001.gif) C characteristic absorption peaks of PANI, respectively. 1301 cm−1 characteristic peak is the stretching vibration of secondary amine C–N connected with the benzene ring, 1249 cm−1 absorption peak belongs to the carbon–carbon double bond of the quinone ring. The absorption peak around 1128 cm−1 in the main chain of PANI is the stretching vibration peak of C–H in the protonated B–N+, Q
C characteristic absorption peaks of PANI, respectively. 1301 cm−1 characteristic peak is the stretching vibration of secondary amine C–N connected with the benzene ring, 1249 cm−1 absorption peak belongs to the carbon–carbon double bond of the quinone ring. The absorption peak around 1128 cm−1 in the main chain of PANI is the stretching vibration peak of C–H in the protonated B–N+, Q![[double bond, length as m-dash]](https://www.rsc.org/images/entities/char_e001.gif) N+ and N
N+ and N![[double bond, length as m-dash]](https://www.rsc.org/images/entities/char_e001.gif) Q
Q![[double bond, length as m-dash]](https://www.rsc.org/images/entities/char_e001.gif) N structures of the quinone ring. 802 cm−1 is the absorption peak of the 1,4-substituted benzene ring of polyaniline. The presence of para-substitution in the structure indicates that the aniline is polymerized in the form of first- and last-substitution during the polymerization process. In addition, since the position of the characteristic peak of the quinone ring of PANI is obviously much more variable than that of the benzene ring, this indicates that when doping PANI, the proton is first bound to the N atom on the quinone structure rather than to the N atom in the benzene structure.
N structures of the quinone ring. 802 cm−1 is the absorption peak of the 1,4-substituted benzene ring of polyaniline. The presence of para-substitution in the structure indicates that the aniline is polymerized in the form of first- and last-substitution during the polymerization process. In addition, since the position of the characteristic peak of the quinone ring of PANI is obviously much more variable than that of the benzene ring, this indicates that when doping PANI, the proton is first bound to the N atom on the quinone structure rather than to the N atom in the benzene structure.
The IR spectra of the LS/PANI composite products possess the main absorption characteristic peaks of both PANI and ligninsulfonate (Table 1). The symmetric and asymmetric vibrational absorption peaks of the ligninsulfonate group are at 1039 cm−1 and 1139 cm−1, where 1039 cm−1 is a mixed vibrational peak of the sulfonic acid group and alkyl ether bond. The introduction of ligninsulfonate into PANI attracts electrons through the sulfonic acid group –SO3− introduced on the benzene ring, resulting in the polymer LS/PANI molecular chain, the electron cloud density decreases, the force constants of the atomic groups decrease, and the individual absorption peaks move in the low-frequency direction. The characteristic absorption peaks of –SO3− in the side chains of LS/PANI are located at 1134, 1039 cm−1 and between 800-500 cm−1 for C–S, C–O group stretching vibrations. These indicate the presence of the –SO3− group.26 In addition, the magnitude of the absorption peak shift can reflect the magnitude of polyaniline doping, and the red shift of these structurally characteristic peaks indicates the protonated state of polyaniline.
3.3 Thermogravimetric analysis
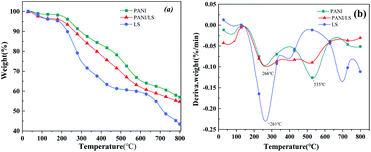
The LS, PANI, LS/PANI thermogravimetric and differential thermogravimetric (TG, DTG) curves are shown in Fig. 5(a) and (b), respectively. As seen from the thermal weight loss curves in Fig. 5, the three samples showed different thermal cracking characteristics. With the increase in temperature, the most obvious degradation weight loss was ligninsulfonate, followed by LS/PANI composite, and less degradation was polyaniline. The weight loss below 200 °C is mainly due to the removal of water from the material.27 LS weight loss occurs mainly at 261 °C, while the weight loss between 200 °C and 400 °C is caused by the detachment of dopants and the departure of oligomers or by-products (p-diphenol and quinone).28,29 In comparison, PANI has two significant weight losses at 266 °C, 535 °C, and LS/PANI composites, on the other hand, were nearly flat in the 266 °C to 535 °C intervals, showing different degradation characteristics from PANI, and the ligninsulfonate-doped composites had higher crosslinking and better thermal stability than the original ligninsulfonate. The weight loss above 500 °C is due to the rapid decomposition of the PANI backbone.30,31 The lower decomposition temperature of LS/PANI than PANI materials is due to the fact that LS acts as a larger dopant and helps to weaken the interaction between PANI chains, making them more susceptible to decomposition.3.4 XRD analysis
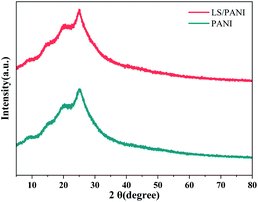
Fig. 6 shows the XRD patterns of PANI and LS/PANI. It can be seen from the figure that the peak shapes and spectral lines of the diffraction peaks of the two materials are basically similar, both have a certain degree of crystallization, and the crystal form of PANI does not change before and after compounding. The diffraction peaks 2θ are mainly between 10°–30°, specifically the two diffraction peaks at 20.4° and 25.1°, which represent the characteristic peaks of polyaniline periodically parallel to the crystal plane of the main chain group (100) and perpendicular to the crystal plane of the main chain group (110), respectively.32 From the Fig. 6, it can be found that the intensity of the characteristic peak of LS/PANI increases, and the area of the diffraction peak becomes wider. This indicates that the doping effect of LS between the PANI frameworks improves the order of the PANI molecular chain and increases the structural defects. No new diffraction peaks appeared, indicating that the overall structure of ligninsulfonate and polyaniline did not change significantly or generate new phases, but the surface morphology had an impact on the performance.3.5 Elemental analysis
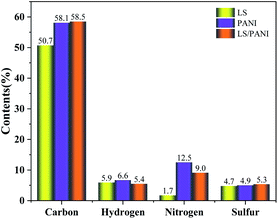
Fig. 7 shows the results of C, H, N, and S elemental analysis of LS, PANI, and LS/PANI. It is found that the contents of C, H, N and S in PANI and LS/PANI are basically consistent with the theoretical calculation values. It is worth mentioning that, according to the results of elemental analysis, the sum of carbon, hydrogen, nitrogen and sulfur content is less than 100%, except for the presence of oxygen, of which the product may be adulterated with chlorine in the process of hydrochloric acid treatment. From the Fig. 7, it can be seen that under the same polymerization conditions, PANI has the highest elemental nitrogen content, accounting for about 12.5%, while the trend of increasing elemental S content (5.3%) and decreasing elemental N content in ligninsulfonate composite electrode materials. The reason may be that after APS oxidation, the aniline cations adhered to the surface of the reticulated LS with sulfonic acid groups are oxidized to aniline cation radicals, and the radicals undergo polymerization through π–π stacking and electrostatic interaction, and the presence of sulfate or sulfonate covalently bound to polyaniline chains groups, leading to an increase in the S element.33 The C/N molar ratios of PANI and LS/PANI were calculated to be 4.7 and 6.5, respectively, while the optimal C/N molar ratio for all polyaniline-based samples was around 6.0, which shows that LS/PANI reached the expected value and the samples performed better.343.6 XPS analysis
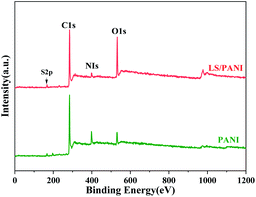
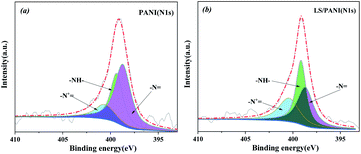
In order to know the doping type and content of the elements of the composite electrode material, the surface chemical composition of the sample was measured by X-ray photoelectron spectroscopy, and the results are shown in Fig. 8. C, N, S, and O elements were detected in PANI, LS/PANI (see Fig. 8). The obtained N 1s and S 2p spectra of PANI and LS/PANI were subjected to peak separation processing. The peak separation results are shown in Fig. 9 and 10.It can be seen from Fig. 9(a) that in the main chain of PANI, N 1s has three bonding methods: –N![[double bond, length as m-dash]](https://www.rsc.org/images/entities/char_e001.gif) , –NH– and –N+
, –NH– and –N+![[double bond, length as m-dash]](https://www.rsc.org/images/entities/char_e001.gif) , and the corresponding binding energies are about 401.9 eV, 399.6 eV, and 400.9 eV, respectively. The fitting results of the N 1s peaks of LS/PANI in Fig. 9(b) can also be seen that there are three sub-peaks, and the binding energies of 398.7 eV and 399.1 eV are attributed to the di-imine nitrogen (–N
, and the corresponding binding energies are about 401.9 eV, 399.6 eV, and 400.9 eV, respectively. The fitting results of the N 1s peaks of LS/PANI in Fig. 9(b) can also be seen that there are three sub-peaks, and the binding energies of 398.7 eV and 399.1 eV are attributed to the di-imine nitrogen (–N![[double bond, length as m-dash]](https://www.rsc.org/images/entities/char_e001.gif) ) and benzenoid diamine nitrogen (–NH–), respectively. While the peak with a binding energy of 400.4 eV corresponds to the nitrogen cationic radicals (N+). The strengths of N 1s groups and N elements of LS/PANI composites are shown in Table 2. Since the protonated doping occurs preferentially on the nitrogen atom of the quinone diimine, defining the ratio of the intensity of –N+
) and benzenoid diamine nitrogen (–NH–), respectively. While the peak with a binding energy of 400.4 eV corresponds to the nitrogen cationic radicals (N+). The strengths of N 1s groups and N elements of LS/PANI composites are shown in Table 2. Since the protonated doping occurs preferentially on the nitrogen atom of the quinone diimine, defining the ratio of the intensity of –N+![[double bond, length as m-dash]](https://www.rsc.org/images/entities/char_e001.gif) to the sum of the intensities of –N+
to the sum of the intensities of –N+![[double bond, length as m-dash]](https://www.rsc.org/images/entities/char_e001.gif) and –N
and –N![[double bond, length as m-dash]](https://www.rsc.org/images/entities/char_e001.gif) to characterize the degree of N protonation can determine the conductivity.35
to characterize the degree of N protonation can determine the conductivity.35
| Samples | N content (at%) | S content (at%) | Content (at%) | ||||||
|---|---|---|---|---|---|---|---|---|---|
–N![[double bond, length as m-dash]](https://www.rsc.org/images/entities/char_e001.gif) |
–NH– | –N+![[double bond, length as m-dash]](https://www.rsc.org/images/entities/char_e001.gif) |
2p1/2 | 2p2/3 | C | N | O | S | |
| PANI | 47.6 | 31.0 | 21.3 | 33.6 | 66.4 | 78.4 | 11.5 | 7.4 | 1.4 |
| LS/PANI | 31.7 | 37.8 | 30.5 | 47.3 | 52.7 | 72.9 | 10.8 | 13.7 | 2.5 |
As can be seen from Table 2, the protonation of nitrogen atoms in LS/PANI composites is significantly higher than that of nitrogen atoms in polyaniline, which indicates that the doping level of PANI by hydrochloric acid is further improved in the presence of ligninsulfonate. At the same time, due to the uniform dispersion of appropriate amount of ligninsulfonate in PANI molecular chain, it can play the role of making PANI molecular chain a regular arrangement, forming a uniform cladding structure, which is conducive to the electron transfer in molecular. The ligninsulfonate in the PANI molecular chains can play a role in making the PANI molecular chains arranged, forming a homogeneous coating structure, which is conducive to the transfer of electrons in the molecular chains and between chains, thus improving the electrical conductivity.
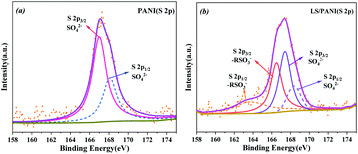
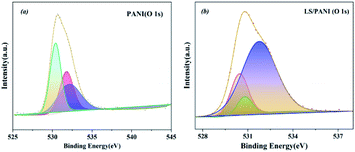
As can be seen in Fig. 10(a) and (b), the high-resolution spectrum of PANI at binding energy 165.5 eV, 167.4 eV corresponds to peaks mainly in the sulfate state of S 2p, with an area ratio of 2:1 between S 2p3/2 and S 2p1/2 and an energy level difference of 1.3 eV. The two pairs of peaks corresponding to the S 2p spectrum of LS/PANI are attributed to SO42−, –RSO3− states, respectively. The presence of –RSO3− can act as a dopant and proton reservoir to ensure a high local H+ concentration near the polymer backbone and promote redox reactions.1 The surface S-element ratios of PANI and LS/PANI were measured by XPS to be 2.2% and 2.5%, respectively, which are consistent with the results of elemental analysis. The negatively charged sulfonic acid group in LS, which also acts as an anion/dopant balances the positively charged PANI backbone in the oxidation state, and the hydrogen on the group dissociates to form intramolecular ionic bonds, resulting in the formation of a conductive semi-quinone doped state of PANI, and the above analysis proves the successful doping of LS.36 And the presence of S elements in PANI may be due to the remaining APS oxidant and SO42− not being washed off and becoming a free state remaining in PANI. Meanwhile, the spectrum of O 1s can be divided into three peaks corresponding to C![[double bond, length as m-dash]](https://www.rsc.org/images/entities/char_e001.gif) O (531.8 eV), –CO (532.8 eV) and –OH (533.4 eV) (Fig. 11). Due to the addition of LS, the hydroxyl and ether bonds of the composite are substantially increased.
O (531.8 eV), –CO (532.8 eV) and –OH (533.4 eV) (Fig. 11). Due to the addition of LS, the hydroxyl and ether bonds of the composite are substantially increased.
3.7 Electrochemical performance analysis
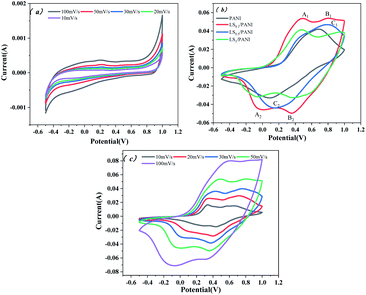
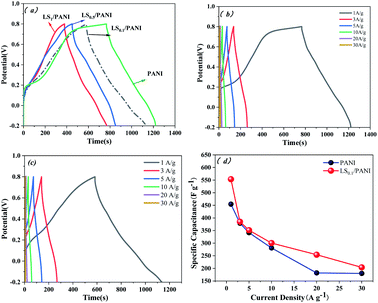
It is well known that the larger the integral area of the CV curve, the higher the specific capacitance.37 Fig. 12(a) shows the CV curves of pure carbon paper at scan rates of 10–100 mV s−1. It can be seen from the figure that the cyclic voltammograms of pure carbon paper at different scan rates are approximately rectangular and without a large integration area, which does not cause background interference to the cyclic voltammetry test of PANI. The cyclic voltammetry curves of LS/PANI composites with different ligninsulfonate additions at 50 mV s−1 scan rate are shown in Fig. 12(b), which shows two pairs of redox peaks. Polyaniline exists in three forms, the conductive protonate-doped state, the nonconductive fully reduced state and the oxidatively doped state. The PANI without ligninsulfonate addition showed a pair of redox peaks (C1/C2) in the CV curve, and the cyclic voltammetric curve of the LS/PANI composite had two pairs of redox peaks (A1/A2 and B1/B2) with good symmetry. The pair of redox peaks located around −0.1 V is due to the conversion between the reduced state aniline and the intermediate state aniline green, while the other pair of redox peaks located around 0.7 V corresponds to the conversion between the intermediate state aniline green and the oxidized state poly (p-phenyleneimine).23 Compared to PANI, LS/PANI has the highest response current and redox peaks, indicating a higher specific capacitance, suggesting that the addition of LS is effectively adsorbed or interspersed between PANI chains, improves the electrical conductivity of the material. The composites mainly exhibit pseudocapacitive properties.38,39 By further study, it was found that increasing the scan rate from 10 mV s−1 to 100 mV s−1, the CV curves of LS/PANI electrodes all had redox peaks, indicating an excellent capacitive response. The redox peaks of the samples were more pronounced at lower scan rates, while they showed a single redox peak at higher scan rates. This is because, at low scan rates, the electrolyte ions move slower and have enough time to infiltrate the porous structure and make contact with more electrode active material, increasing the utilization of the active material, making the charge and discharge more complete and showing a better electrochemical behavior.40To further investigate the electrochemical properties of LS/PANI, GCD measurements were performed on the sample at a voltage range of −0.2 V to 0.8 V. The results of the study are shown in Fig. 13. There is almost no voltage drop during the initial charge and discharge, which stems from its more minor resistance, while the capacitance of the sample shows a trend of first decreasing and then stabilizing as the current density increases from 1 A g−1 to 30 A g−1, in agreement with the results of Dai et al.41 Fig. 13(b) and (c) shows the constant current charge/discharge curves of PANI and LS/PANI products at different current densities. All samples exhibit asymmetric triangles unlike carbon materials, indicating the pseudocapacitance characteristics of PANI and LS/PANI, in agreement with the conclusions obtained by cyclic voltammetry. As can be seen in Fig. 13(a), the specific capacitance of LS/PANI reaches 553.7 F g−1 at 1 A g−1, which is higher than that of PANI (454.6 F g−1). By analyzing the specific capacitance of the composites versus current density curves, it can be seen that the specific capacitance of the electrode material gradually decreases with the increase of current density, because LS/PANI works at higher current density, the charging and discharging process occurs in a very short time, and the electrode material has more microporous structure, so that the ions or protons are too late to diffuse or transfer in a short time, which hinders the high surface utilization of the material at current density, resulting in its inability to complete electrochemical deposition and dissociation, which leads to an inevitable decrease in capacitance.42 Meanwhile, even at a high current density of 20 A g−1, the specific capacitance of LS/PANI can still reach 254.0 F g−1 with a small loss rate of capacitance. Theoretically, the catechol/quinone groups in LS can be interconverted by redox reactions, and LS can utilize the conductivity of conducting polymers to achieve electrochemical energy storage.43,44 In fact, when the addition amount of LS is low, LS will be covered by polyaniline in the composite. At this time, the redox process of catechol/quinone groups cannot be well synchronized with the charging and discharging process of PANI, so the contribution of LS to the capacity is not apparent, and the composite mainly presents the polyaniline capacitive properties.45 When too much ligninsulfonate is added, LS acts as an insulator and can greatly affect the capacitive properties of polyaniline. As shown in Fig. 13(a), the composite electrode material exhibited the best electrochemical performance when the addition amount was 0.1 g.
Electrochemical impedance analysis was performed at the open-circuit voltage in the range of 10 mHz to 100 kHz to study the electrochemical properties of PANI, LS/PANI. The results are shown in Fig. 14(a) as a half-circle in the high-frequency region, showing charge transfer control characteristics, and a straight line in the low-frequency region, indicating that it is controlled by the charge diffusion within the polymer film, and this diffusion behavior is controlled by the diffusion coefficient and film thickness.46 As can be seen in Fig. 14(a), both in the high-frequency region part and in the low-frequency region, the LS/PANI electrode material has a smaller semicircular diameter and the impedance spectrum phase angle is closer to 90°. This is attributed to the effective doping of the sulfonic acid group in LS, which improves the wettability and surface activity of the material, resulting in a faster ion diffusion rate and producing a more negligible Warburg impedance.47 The fitted equivalent circuit diagrams of PANI, LS/PANI are given in Fig. 14(a), and Table 3 shows the fitted parameters of LS its equivalent circuit, where R1 denotes the equivalent series resistance (including the sum of the liquid connection resistance and the resistance generated by the external circuit), and the equivalent transfer resistances of PANI and LS/PANI are 1.4 Ω and 1.1 Ω, respectively. R2 denotes the charge transfer resistance in H2SO4 solution, and the charge transfer internal resistance was 3.7 Ω and 0.2 Ω, respectively, and the LS/PANI charge transfer was faster. Meanwhile, it is observed that the straight line of PANI diffusion impedance deviates from 45° and the electrode surface is rough such that the diffusion process is partially equivalent to spherical diffusion. From Fig. 14(b), it can be seen that after 5000 cycles, the electrode material has a significant difference in specific capacitance, and after adding 0.1 g LS, the composite electrode material can still maintain 68.01% capacitance after repeated charging and discharging for 5000 times at 10 A g−1 current density.
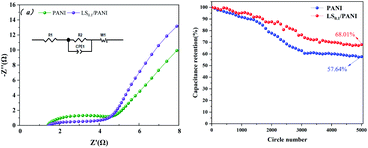 | ||
| Fig. 14 Electrochemical impedance spectra of PANI and LS/PANI at open circuit voltage (a); graph of cyclic stability at 10 A g−1 current density (b). | ||
| Sample | R1 (Ω) | CPE1-T (F) | CPE1-P (F) | R2 (Ω) | W1-R (Ω) | W1-T (Ω) | W1-P (Ω) |
|---|---|---|---|---|---|---|---|
| PANI | 1.4 | 5.3 × 10⁻⁵ | 0.8 | 3.7 | 5.2 | 2.2 × 10⁻³ | 0.4 |
| LS/PANI | 1.1 | 5.9 × 10⁻⁴ | 1.1 | 0.2 | 244.5 | 0.5 | 0.7 |
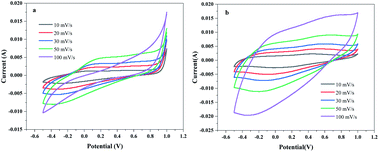
Due to the excellent specific capacitance value of LS/PANI, the pseudocapacitance effect of N/O groups in acidic electrolyte is stronger than that in alkaline electrolyte,48 so its electrochemical performance in 1 mol L−1 H2SO4 aqueous electrolyte was investigated (Fig. 15). Fig. 15 shows the CV curves of PANI and LS/PANI at different scan rates. It can be seen that at scan rates from 10 to 100 mV s−1, the CV curves are roughly rectangular, indicating that the samples have excellent double-layer capacitance properties at different scan rates. Notably, even at a high scan rate of 50 mV s−1, the material retains a roughly rectangular appearance, likely due to the fast movement of ions/charges.49
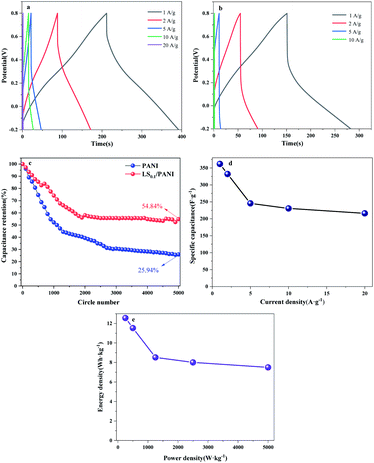
To explore the capacitive performance in more depth, the galvanostatic charge–discharge curves of LS/PANI and PANI electrodes were tested at current densities ranging from 1 to 20 A g−1. In Fig. 16, all the curves show a general isosceles triangle, indicating that the supercapacitor material has excellent reversibility. It can be seen from Fig. 16(c) that the cycling performance of LS/PANI at 5 A g−1 is good, and the capacitance retention rate can still reach 54.84% after 5000 cycles, which is much higher than that of polyaniline (25.94%). Fig. 16(d) depicts the specific capacitance at different current densities obtained by constant current charge–discharge tests. As the current density increases, the capacitance gradually decreases. This may be due to insufficient time for the electrolyte ions to diffuse to the entire pore surface at higher charging current densities.50 It was found that the specific capacitance can reach a high level as high as 361.8 F g−1 at a current density of 1 A g−1. Even when the current density is increased to 20 A g−1, the LS/PANI still has a capacitance as high as 216.0 F g−1. Fig. 16(e) shows the Ragone plot of LS/PANI electrodes assembled into a symmetric supercapacitor. In Fig. 16(e), the energy density decreases as the power density increases. When the power density was increased from 250 to 5000 W kg−1, the energy density decreased from 12.56 to 7.50 W h kg−1, indicating that the as-prepared LS/PANI could deliver high power without much energy loss. Applying it to electrode materials for supercapacitors has good prospects for development.51
The phenol/quinone groups in LS can be interconverted by redox. Therefore, LS doping in the polyaniline backbone allows for electrochemical energy storage and improved conductivity through the conductivity of the conducting polymer. After testing, the electrical conductivity of LS/PANI was obtained as 0.4478 S cm−1, while the electrical conductivity of PANI was 0.1221 S cm−1, a result that is relatively low compared to other literature polyaniline conductivity.45,52 This may be due to the fact that the amount of LS added as an insulator during the doping process influenced the conductivity of polyaniline, which was mainly covered by PANI when the amount of LS added was low (0.1 g or 0.2 g). In this case, the redox process phenol/quinone groups are not well synchronised with the charging/discharging process of the PANI and therefore the contribution of LS to the capacity is not significant.45
4 Conclusions
In summary, LS/PANI nanocomposite electrode materials were synthesized by in situ chemical oxidation using ligninsulfonate as a dopant and structural guide. Ligninsulfonate can be used as a structural guide in the process of compounding with aniline. The prepared LS/PANI composite was characterized by SEM and TEM, and morphologically presented as nanoscale spherical particles with a diameter of about 85 nm, which is obviously different from the fibrous strips of PANI. Polyaniline was doped with sulfonated lignin, the sulfonic acid group in lignin was successfully grafted into the polyaniline polymer matrix, and the sulfonic acid functional group in the structure helped to weaken the interaction force between the main chains of polyaniline, so that the S doping degree of LS/PANI composites was improved compared with that of polyaniline, which could improve the dispersion and redox properties of the electrode material. The high content of protonated imine (–N+![[double bond, length as m-dash]](https://www.rsc.org/images/entities/char_e001.gif) ) facilitates the transport of electrons on and between molecular chains, which helps to improve the electrical conductivity of the material. After LS doping, the LS/PANI nanocomposites showed improved orderliness compared to polyaniline, but the overall structure did not change significantly and no new phases were generated. At a charge/discharge current density of 1 A g−1, the corresponding specific capacitance of LS/PANI composites reached 553.70 F g−1 and 454.60 F g−1 for PANI. At a high current density of 20 A g−1, LS/PANI could still reach 254.00 F g−1 with a small loss of capacitance. After 5000 cycles of charge and discharge, the LS/PANI capacitance retention rate was 68.01% compared to 57.64% for PANI (three-electrode system), and after 5000 cycles of charge and discharge, the LS/PANI capacitance retention rate was 54.84% compared to 25.94% for PANI (two-electrode system). This study provides a direction for the design of nanocomposite carbon materials for energy storage electrodes. Nevertheless, there is still a need to further improve the durability of the electrode to utilize the maximum effect of the lignin-based carbon material and make it more suitable for practical energy storage.
) facilitates the transport of electrons on and between molecular chains, which helps to improve the electrical conductivity of the material. After LS doping, the LS/PANI nanocomposites showed improved orderliness compared to polyaniline, but the overall structure did not change significantly and no new phases were generated. At a charge/discharge current density of 1 A g−1, the corresponding specific capacitance of LS/PANI composites reached 553.70 F g−1 and 454.60 F g−1 for PANI. At a high current density of 20 A g−1, LS/PANI could still reach 254.00 F g−1 with a small loss of capacitance. After 5000 cycles of charge and discharge, the LS/PANI capacitance retention rate was 68.01% compared to 57.64% for PANI (three-electrode system), and after 5000 cycles of charge and discharge, the LS/PANI capacitance retention rate was 54.84% compared to 25.94% for PANI (two-electrode system). This study provides a direction for the design of nanocomposite carbon materials for energy storage electrodes. Nevertheless, there is still a need to further improve the durability of the electrode to utilize the maximum effect of the lignin-based carbon material and make it more suitable for practical energy storage.
Conflicts of interest
The authors declare no conflict of interest.Acknowledgements
The authors appreciate the financial support for this work from the National Natural Science Foundation of China (No. 31730106).Notes and references
- N. Dianat, M. S. Rahmanifar, A. Noori, M. F. El-Kady, X. Chang, R. B. Kaner and M. F. Mousavi, Nano Lett., 2021, 21, 9485–9493 CrossRef CAS PubMed.
- Y. F. Wang, L. Zhang, H. Q. Hou, W. H. Xu, G. G. Duan, S. J. He, K. M. Liu and S. H. Jiang, J. Mater. Sci., 2021, 56, 173–200 CrossRef CAS.
- A. Ehsani, M. K. Moftakhar and F. Karimi, J. Energy Storage, 2021, 35, 102291 CrossRef.
- S. Bhadra, D. Khastgir, N. K. Singha and J. H. Lee, Prog. Polym. Sci., 2009, 34, 783–810 CrossRef CAS.
- G. Li, Y. Li, H. Peng and Y. Qin, Synth. Met., 2013, 184, 10–15 CrossRef CAS.
- L. Wang, L. Chen, B. Yan, C. Wang, F. Zhu, X. Jiang, Y. Chao and G. Yang, J. Mater. Chem. A., 2014, 2, 8334–8341 RSC.
- Z. Li and L. Gong, Materials, 2020, 13, 548 CrossRef CAS PubMed.
- M. A. Moussa, M. H. Abdel Rehim and G. M. Turky, J. Phys. Chem. Solids, 2021, 158, 110243 CrossRef CAS.
- T. Zhang, H. Yue, X. Gao, F. Yao, H. Chen, X. Lu, Y. Wang and X. Guo, Ionics, 2020, 26, 2063–2070 CrossRef CAS.
- F. Fu, H. Wang, D. Yang, X. Qiu, Z. Li and Y. Qin, J. Colloid Interface Sci., 2022, 617, 694–703 CrossRef CAS PubMed.
- C. Yang, Z. Chen, I. Shakir, Y. Xu and H. Lu, Nano Res., 2016, 9, 951–962 CrossRef CAS.
- K. Y. Yasoda, M. S. Kumar and S. K. Batabyal, Ionics, 2019, 26, 2493–2500 CrossRef.
- Z. Y. Hai, L. B. Gao, Q. Zhang, H. Y. Xu, D. F. Cui, Z. X. Zhang, D. Tsoukalas, J. Tang, S. B. Yan and C. Y. Xue, Appl. Surf. Sci., 2016, 361, 57–62 CrossRef CAS.
- J. Wang, Z. Wu, K. Hu, X. Chen and H. Yin, J. Alloys Compd., 2015, 619, 38–43 CrossRef CAS.
- M. Yao, X. Zhao, Q. Zhang, Y. Zhang and Y. Wang, Electrochim. Acta, 2021, 390, 138804 CrossRef CAS.
- Y. Zhang, J. M. Zhang, Q. Hua, Y. Zhao, H. Yin, J. Yuan, Z. Dai, L. Zheng and J. Tang, Mater. Lett., 2019, 244, 62–65 CrossRef CAS.
- D. Kai, M. J. Tan, P. L. Chee, Y. K. Chua, Y. L. Yap and X. J. Loh, Green Chem., 2016, 18, 1175–1200 RSC.
- F. Liu, Z. Wang, H. Zhang, L. Jin, X. Chu, B. Gu, H. Huang and W. Yang, Carbon, 2019, 149, 105–116 CrossRef CAS.
- D. Y. Hopa and P. Fatehi, Polymers, 2020, 12, 2046 CrossRef CAS PubMed.
- F. N. Ajjan, N. Casado, T. Rębiś, A. Elfwing, N. Solin, D. Mecerreyes and O. Inganäs, J. Mater. Chem. A., 2016, 4, 1838–1847 RSC.
- L. Shao, J. H. Qiu, H. X. Feng, M. Z. Liu, G. H. Zhang, J. B. An, C. M. Gao and H. L. Liu, Synth. Met., 2009, 159, 1761–1766 CrossRef CAS.
- D. Gan, W. Xing, L. Jiang, J. Fang, C. Zhao, F. Ren, L. Fang, K. Wang and X. Lu, Nat. Commun., 2019, 10, 1487 CrossRef PubMed.
- K. K. Taylor, C. V. Cole, R. Soora, J. C. Dilday, A. M. Hill, B. Berry and T. Viswanathan, J. Appl. Polym. Sci., 2008, 108, 1496–1500 CrossRef CAS.
- Q. Lü, Z. He, J. Zhang and Q. Lin, J. Anal. Appl. Pyrol., 2011, 92, 152–157 CrossRef.
- H. Xu, H. Jiang, X. Li and G. Wang, RSC Adv., 2015, 5, 76116–76121 RSC.
- X. Liu, P. Song, B. Wang, Y. Wu, Y. Jiang, F. Xu and X. Zhang, ACS Sustain. Chem. Eng., 2018, 6, 16315–16322 CrossRef CAS.
- R. Mohammadkhani, A. Shojaei, P. Rahmani, N. Pirhady Tavandashti and M. Amouzegar, Diam. Relat. Mater., 2021, 120, 108672 CrossRef CAS.
- O. Sadak, M. U. A. Prathap and S. Gunasekaran, Carbon, 2019, 144, 756–763 CrossRef CAS.
- D. Xu, M. Liu, Q. Zhang, Q. Huang, H. Huang, J. Tian, R. Jiang, Y. Wen, X. Zhang and Y. Wei, Mater. Sci. Eng. C, 2018, 91, 496–501 CrossRef CAS PubMed.
- Y. Hayatgheib, B. Ramezanzadeh, P. Kardar and M. Mahdavian, Corros. Sci., 2018, 133, 358–373 CrossRef CAS.
- S. Bilal, M. Fahim, I. Firdous and A. A. Shah, Appl. Surf. Sci., 2018, 435, 91–101 CrossRef CAS.
- R. Taş, M. Can and S. Sönmezoğlu, Turk. J. Chem., 2015, 39, 589–599 CrossRef.
- A. Rakić, D. Bajuk-Bogdanović, M. Mojović, G. irić-Marjanović, M. Milojević-Rakić, S. Mentus, B. Marjanović, M. Trchová and J. Stejskal, Mater. Chem. Phys., 2011, 127, 501–510 CrossRef.
- R. Ullah, G. A. Bowmaker, J. T. Sejdic, K. Ali and A. U. H. A. Shah, Macromol. Symp., 2014, 339, 84–90 CrossRef CAS.
- J. Liu, X. Xu, W. Lu, X. Xiong, X. Ouyang, C. Zhao, F. Wang, S. Qin, J. Hong, J. Tang and D. Chen, Electrochim. Acta, 2018, 283, 366–373 CrossRef CAS.
- M. Kumar, Mater. Express, 2017, 7, 223–229 CrossRef CAS.
- B. P. Relekar, A. V. Fulari, G. M. Lohar and V. J. Fulari, J. Electron. Mater., 2019, 48, 2449–2455 CrossRef CAS.
- S. Mei, J. Zheng and W. Chu, J. Energy Storage, 2021, 40, 102698 CrossRef.
- D. B. Kong, C. Y. Qin, L. Cao, Z. M. Fang, F. M. Lai, Z. D. Lin, P. Zhang, W. Li and H. J. Lin, Int. J. Electrochem. Sci., 2020, 15, 265–279 CrossRef CAS.
- T. Liu, C. J. Jiang, W. You and J. G. Yu, J. Mater. Chem. A., 2017, 5, 8635–8643 RSC.
- J. Dai, Y. Ma, S. Ren and G. Fang, J. Mater. Res., 2018, 33, 1211–1218 CrossRef CAS.
- Y. M. Wang, A. P. Liu, T. X. Li, Y. Q. Han, Y. Ma, Q. Zhang and J. Zhang, J. Electron. Mater., 2020, 49, 3751–3760 CrossRef CAS.
- Y. D. Li, T. F. Liu, X. Q. Qiu, Y. H. Zhou and Y. Li, ACS Sustain. Chem. Eng., 2019, 7, 961–968 CrossRef CAS.
- C. Y. Che, M. Vagin, U. Ail, V. Gueskine, J. Phopase, R. Brooke, R. Gabrielsson, M. P. Jonsson, W. C. Mak, M. Berggren and X. Crispin, Adv. Sustain. Syst., 2019, 3, 1900039 CrossRef CAS.
- L. Wang, X. Li, H. Xu and G. Wang, Synth. Met., 2019, 249, 40–46 CrossRef CAS.
- D. Wu, C. Chen, J. Li, X. Jian, A. Wang, K. Sun and J. Jiang, New J. Chem., 2020, 44, 21271–21278 RSC.
- J. J. Wang, R. H. Zheng, Y. X. Chen, H. Bai and T. Y. Zhang, Soft Matter, 2020, 16, 7305–7311 RSC.
- M. Mansuer, L. Miao, Y. Qin, Z. Song, D. Zhu, H. Duan, Y. Lv, L. Li, M. Liu and L. Gan, Chin. Chem. Lett., 2022, 33 DOI:10.1016/j.cclet.2022.03.027 , in press.
- H. Duan, Z. Song, L. Miao, L. Li, D. Zhu, L. Gan and M. Liu, J. Mater. Chem. A., 2022, 10(18), 9837–9847 RSC.
- Z. Song, L. Miao, L. Ruhlmann, Y. Lv, D. Zhu, L. Li, L. Gan and M. Liu, Adv. Mater., 2021, 33, 2104148 CrossRef CAS PubMed.
- W. Qi, Y. Lei, W. Xu, J. Sha, S. Zhao, Y. Tian and X. Wang, Wood Sci. Technol., 2022, 56, 367–387 CrossRef CAS.
- Y. G. Kim, H. L. Nguyen and P. Kinlen, Polymers, 2021, 13, 2904 CrossRef CAS PubMed.
| This journal is © The Royal Society of Chemistry 2022 |


