 Open Access Article
Molecular dynamics simulations of phase change materials for thermal energy storage: a review
Hossein Tafrishia,
Sadegh Sadeghzadeh *b and
Rouhollah Ahmadi
 c
c
aMSc Student of Energy Systems Engineering, School of Advanced Technologies, Iran University of Science and technology, Tehran, Iran
bAssociate Professor of Nanotechnology Engineering, School of Advanced Technologies, Iran University of Science and Technology, Tehran, Iran. E-mail: sadeghzadeh@iust.ac.ir
cAssociate Professor of Energy Systems Engineering, School of Advanced Technologies, Iran University of Science and Technology, Tehran, Iran
First published on 17th May 2022
Abstract
Phase change materials (PCM) have had a significant role as thermal energy transfer fluids and nanofluids and as media for thermal energy storage. Molecular dynamics (MD) simulations, can play a significant role in addressing several thermo-physical problems of PCMs at the atomic scale by providing profound insights and new information. In this paper, the reviewed research is classified into five groups: pure PCM, mixed PCM, PCM containing nanofillers, nano encapsulated PCM, and PCM in nanoporous media. A summary of the equilibrium and non-equilibrium MD simulations of PCMs and their results is presented as well. The primary results of the simulated systems are demonstrated to be efficient in manufacturing phase change materials with better thermal energy storage features. The goals of these studies are to achieve higher thermal conductivity, higher thermal capacity, and lower density change, determine the melting point, and understand the molecular behaviors of PCM composites. A molecular dynamics-based grouping (PCM simulation table) was presented that is very useful for the future roadmap of PCM simulation. In the end, the PCFF force field is presented in detail and a case problem is studied for more clarity. The results show that simulating the PCMs with a similar strategy could be performed systematically. Results of investigations of thermal conductivity enhancement showed that this characteristic can be increased at the nano-scale by the orientation of PCM molecules.
1 Introduction
One of the most significant problems at the moment is meeting rising energy needs. The estimated global energy demand is about 15 TW per annum.1 In several types of buildings that have major heating needs, heat storage may be used.2 Thermal energy storage is achieved through a variety of techniques: sensible heat storage method, latent heat storage method, and thermochemical heat storage method, or a mixture of these methods.3,4 In the reverse cycle, thermal energy storage (TES) may be obtained by cooling, melting, heating, freezing, or evaporating a substance in which case energy is obtained as heat.5,6 Latent heat storage using PCMs provides a high energy storage capacity and enables the storage of thermal energy at a constant temperature corresponding to the storage material's phase transition temperature.7,8 For PCMs, phase transition can be solid–liquid, liquid–gas, or solid–solid. Polymorphic transfer from one crystalline state to another can be observed in the solid–solid thermal energy storage or PCMs that are shape stabilized. Solids–solids a good feature they have is that they change very little in volume and have good design flexibility, but usually have less latent heat than solid–liquid and liquid–gas. The use of solid–solid PCMs can prevent problems such as permeation at temperatures above the phase changing temperature. This is a very important and good property of the large leakage problem in solid–liquid PCMs. The general grading of PCMs is shown in Fig. 1.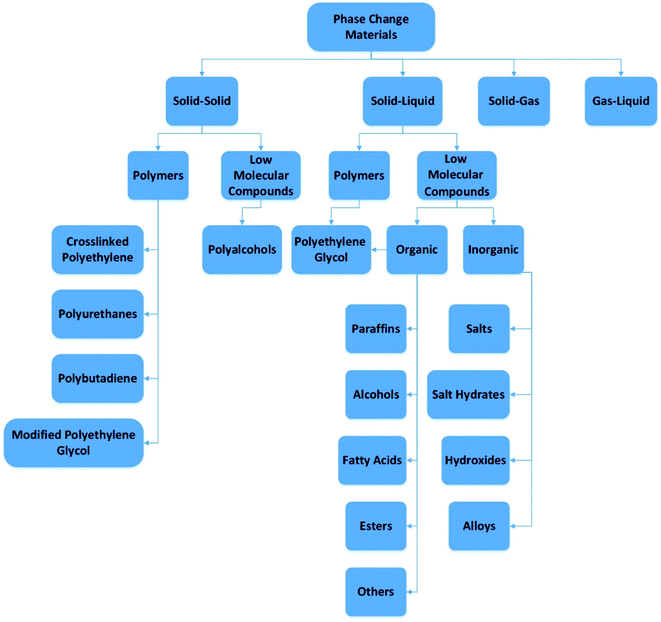 | ||
| Fig. 1 Phase change materials division (this figure has been adapted from ref. 5 with permission from Elsevier, copyright 2014). | ||
Methods have been considered in the last years for enhancing the physical and thermal features of PCMs. Combining PCMs with nanomaterials will lead to better properties of thermal storage than the bulk PCMs (i.e., their pure state). That can result in the following benefits:9
• Increased thermal conductivity of PCMs.
• Enhance thermal consistency of PCMs.
• Better performance and increased storage of heat in some cases.
The heat transfer properties of magnesium nitrate hexahydrate PCM (Mg(NO3)2·6H2O) include nano graphite (NG) and multiwalled carbon nanotube (MWCNT) composites were investigated by Kardam et al.10 Their work found that nano-PCM melting and freezing levels increased by 48% and 77% respectively. Nevertheless, these percentages were 24 percent and 15 percent respectively for PCM composites containing nano graphite (0.6 percent by weight). Graphene nanoplatelets (GNPs) were supplemented to improve Eicosan's thermal conductivity.11 The thermal conductivity of PCM increased by 400 percent in the largest volume of graphene, 10 percent by weight of graphene at 10 °C. Harish et al.12 have focused on the design and manufacture of lauric acid PCM nano-composites including graphene sheets (nanoplatelets). The result was that the presence of graphene nanoplatelets by 1% volume enhanced the thermal conductivity by about 230%. The findings of the DSC showed that the phase shift and melting temperature enthalpy remained the same as for the pure material. Nitrogen-doped graphene as a nano-additive was used by Mehrali et al. for palmitic acid.13 The consequence of this analysis was that the thermal conductivity was enhanced by about 500% at 35 °C (for the maximum amount of doped graphene 5% by weight). In another investigation, Ji et al. demonstrated that the use of ultrathin-graphite foams (0.8 to 1.2% by volume) in a PCM can enhance the thermal conductivity of the PCM by about 18 times.14 Nevertheless, this did not have a major impact on the temperature of the PCM melting point. Qi et al.15 developed a composite made of polyethylene glycol, graphene oxide, and graphene nanoplatelets containing 2 wt% graphene oxide and 4 wt% graphene nanoplatelets. The thermal conductivity of this mixture was 1.72 W mK−1, which is 490% more than the thermal conductivity of pure polyethylene glycol. Wu et al. worked on the melting and glaciating properties of paraffin-containing copper nanoparticles.16 Empirical outcomes showed that the addition of 2 wt% copper nanoparticles to paraffin increased thermal conductivity by 14.2% for the solid state and 18.1% for the liquid state. The organic ester PCM analyzed by Parameshwaran et al. comprises a mixture of silver–titania with a mass percentage of 0.1 to 1.5.17 This hybrid nano-PCM exhibited higher thermal conductivity, rising from 0.286 to 0.538 W mK−1.18
Computer use to investigate material properties dates back to the 1950s. Metropolis et al.,19 and Alder and Wainwright20 respectively performed the first simulations of the Monte Carlo (MC) and molecular dynamics (MD) fluid models. Since that time, continuous advances in hardware and software have led to rapid growth in this area and current MD simulations. Molecular dynamics simulation can be a useful method for investigating the inter-molecular behavior of PCMs or designing new PCMs with better characteristics. This method can be used for simulating nano-enhanced PCMs (NEPCM) that contain nanostructures or are nano-encapsulated. However pure PCM materials with no nano-enhancing also can be investigated and help to understand the material's behavior at the nano-scale. This paper studies the molecular dynamics simulations of phase change materials, the research had done before and the future needs of this kind of study. Some research works used other methods such as the density functional theory (DFT) to study phase change materials and related structures. For example, M. Micciarelli et al. have presented a detailed study of the excited state properties of 5-benzyluracil (5BU) in the gas phase and in implicit solvent using different electronic structure approaches ranging from time-dependent density functional theory in the linear response regime (LR-TDDFT) to a set of different wave-function-based methods for excited states, namely perturbed coupled cluster (CC2), algebraic diagrammatic construction method to second-order (ADC(2)), and perturbed configuration interaction (CIS(D)).21 Valadan et al.22 have combined fluorescence up-conversion and time-correlated single-photon counting experiments to investigate the 5-benzyl uracil excited state dynamics in methanol from 100 fs up to several ns. Micciarelli et al. have investigated the photophysical and photochemical properties of 5-benzyluracil and 5,6-benzyluracil, both experimentally and theoretically.23 However, here the molecular dynamics approach is focused, and DFT works were not included.
2 Molecular dynamics approach
A simulation on a molecular scale consists of three main steps: first, model building, second, calculating the molecular path, and third, analyzing the atoms' paths and calculating the thermodynamic properties. The second stage forms the basis for the simulation, and at this stage, the method of measuring the molecular positions is to differentiate various methods of simulation. In molecular dynamics, situations are derived from the resolvent of differential motion equations and are thus associated temporally. This method neglects electronic reactions. Although this method in many cases simulates system behavior with high accuracy, it is not able to calculate properties that are dependent on the electronic interaction. Quantum mechanics methods explicitly take into account the electronic structure of atoms and, if applied at any stage of the simulation, to obtain energy, very good results are obtained. This approach is used to solve problems that cannot be solved by classical methods of molecular dynamics, such as chemical reactions where chemical bonds are broken or formed, but these quantum methods are computationally time-consuming and are typically used for systems with a maximum of several tens of atoms. The Schrödinger equation is replaced, in classical molecular mechanics, by the Newton equation. Assuming that the thermal de Broglie wavelength is smaller than the smallest atomic distance is assuming this condition. This situation is especially valid for atoms that are heavier than hydrogen, at high temperatures. So a molecular dynamics simulation is an explicit technique for generating a dynamic trajectory for an N particles system using Newton's motion equations.24 We need a set of initial conditions (the positions and velocities of each atom), a good model (force field) to demonstrate the forces of the interparticles' interactions, and the boundary conditions to be used. Then we need to solve the classic equation of movement:
 | (1) |
The molecular dynamics method can help to design, devise, and invent newer and better thermal energy storage materials like NEPCMs (nano-enhanced phase change materials) or NFPCMs (nano-fluid phase change materials). This method also helps to solve the prevailing problems (like low thermal conductivity and capacity) or better understand the unknown molecular behavior of energy storage materials.
3 Background overview
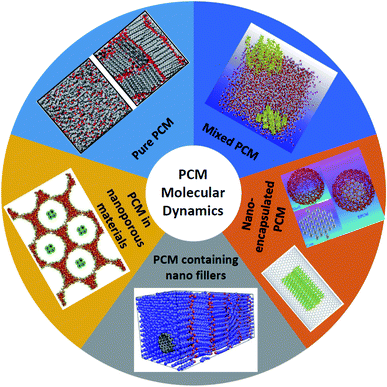
The works on the molecular dynamics simulation of phase change materials will be discussed in this section. Table 1 summarizes those studies. These researches are categorized into 5 groups (as shown in Fig. 2): nano-enhanced phase change materials with nanofillers (one type nanofiller or hybrid nanofillers), pure phase change materials, mixtures of different PCMs, nano-encapsulated PCM (or PCM in micro/nanocapsules), and porous media for PCMs (micro/nanoporous materials containing PCM). The research performed in all those studies will be briefly clarified in the following. It should be noted that the first 19 papers in Table 1 deal with MD simulations of pure PCMs, 20 to 24 PCM mixtures, 25 to 51 the use of nanoparticles in phase change materials, 52 to 57 refer to simulated micro/nano-encapsulated PCMs with MD, and the last two articles (numbers 58 and 59) are related to porous media incorporating a PCM.| No. | Authors | Date | Simulated materials | Simulation software | Force fields | The main result |
|---|---|---|---|---|---|---|
| a Lennard-Jones.b Polymer consistent force field.c Condensed-phase optimized molecular potentials for atomistic simulation studies.d Paul, Yoon, and Smith.e Large-scale atomic/molecular massively parallel simulator.f Adaptive intermolecular reactive empirical bond order.g Nath, Escobedo and de Pablo-revised.h Transferable potentials for phase equilibria.i Consistent valence force field. | ||||||
| 1 | Zerbi et al.28 | 1981 | n-Nonadecane (C19H40) | Not mentioned | Snyder force field27 | A model for the mechanism of phase transition is proposed |
| 2 | Esselink et al.31 | 1994 | n-Alkanes (butane to dodecane) | Not mentioned | Ryckaert and Bellemans Potential,29 LJa30 | A new method to identify crystalline regions and compute the crystallization rate |
| 3 | Shimizu and Yamamoto32 | 2000 | n-Decane (C10H22) | Not mentioned | Various potentials | The film is more stable when the surface chains are lying perpendicular to the surface |
| 4 | Tsuchiya et al.37 | 2001 | C8H18, C10H22, C12H26, C14H30, C16H34 | Not mentioned | PCFF,b33–36 LJ | The melting point of normal alkanes, using the NPT ensemble |
| 5 | Zhen Li and Yamamoto40 | 2001 | n-Nonadecane (C19H40) | Not mentioned | A special force field from ref. 38, LJ from ref. 39 | Surface freezing was described in n-alkanes |
| 6 | Mavrantza et al.41 | 2001 | Polyethylene (some different chain alkanes) | CERIUS-2 | COMPASSc33 | The wave number shift of the CH2 stretching bands is related to temperature with a slope of −0.033 cm−1 K−1 |
| 7 | Waheed et al.43 | 2001 | n-Eicosane (C20H42) | Not mentioned | PYSd force field,42 LJ | The temperature dependence of crystallization is analyzed in terms of Ziabicki's rate model |
| 8 | Marbeuf and Brown45 | 2006 | n-Alkanes C18H38, C19H40, and C20H42 | DL-POLY44 | COMPASS | Transient analogs of the RI and RII phases of the odd alkanes are found on melting C18H38 and C20H42 |
| 9 | Diama et al.47 | 2009 | Tetracosane (n-C24H50), dotriacontane (n-C32H66) | Not mentioned | Weber,46 LJ | The introduction of gauche defects into the alkane chains drives a melting transition to a monolayer fluid phase |
| 10 | Jayaraman et al.49 | 2009 | Molten salts (LiNO3, NaNO3, KNO3) | LAMMPSe48 | Buckingham | Very small free-energy differences between the crystal and liquid phases can result in large differences in computed melting point |
| 11 | Yi and Rutledge50 | 2011 | n-Eicosane (C20H42) | LAMMPS | PYS | Fitting the free energy curve to the cylindrical nucleus model, the solid–liquid interfacial free energies are calculated |
| 12 | Rao et al.51 | 2012 | Paraffin (nonadecane) | Materials Studio | COMPASS | The simulated phase transition temperature of n-nonadecane under high pressure is higher than that under atmospheric pressure |
| 13 | Rastgarkafshgarkolaei et al.53 | 2016 | Paraffin (C20H42, C24H50, C26H54, and C30H62) | LAMMPS | NERD,52 LJ | A very slight rise in thermal conductivity values as the number of carbon atoms of the chain increases |
| 14 | Ni et al.54 | 2019 | Molten salts (LiNO3, NaNO3, KNO3) | LAMMPS | Buckingham | All details work well in predicting the properties of both single nitrate salts and their mixtures |
| 15 | Cui et al.55 | 2019 | Molten salts (NaCl, KCl, and their mixture) | LAMMPS | EIM | Binary NaCl/KCl systems have also been investigated |
| 16 | B. Feng et al.57 | 2019 | Solid–solid polyol PCM (pentaerythritol) | LAMMPS | GROMOS56 | The thermal conductivity of PE is reduced by half after the α-to-γ phase change |
| 17 | Y. Feng et al.59 | 2019 | Fatty acid (octadecanoic acid) | LAMMPS | CHARMM58 | The nanochain forms exhibit more phonon scattering by high-level phonon mismatch |
| 18 | B. Feng et al.60 | 2020 | Monohydric alcohols (C12H26O, C14H30O, and C16H34O) | LAMMPS | GROMOS, LJ | The stronger interfacial energy was found to lead to better thermal conductivity |
| 19 | B. Feng et al.61 | 2020 | Monohydric alcohols: 1-dodecanol (C12H26O), 1-tetradecanol (C14H30O), 1-hexadecanol (C16H34O) | LAMMPS | GROMOS, LJ | The high interfacial heat transfer rate is related to the stronger intermolecular interactions |
| 20 | Wentzel and Milner64 | 2010 | C23 and mixed C21–C23 normal alkanes | GROMACS | OPLSAA,62 flexible Williams63 | Slower temperature scans may be necessary to properly investigate weakly first-order transitions |
| 21 | Rao et al.65 | 2012 | Paraffin (nonadecane) and water slurry | Materials Studio | COMPASS | Mixing the n-nonadecane into water decreased mobility but increased the energy storage capacity |
| 22 | Rao et al.66 | 2013 | Nonadecane, tetracosane, and their mixtures | Materials Studio | COMPASS | The phase transition could be determined by the variation of self-diffusion coefficient and isobaric heat capacity |
| 23 | Yan Wang et al.67 | 2016 | Water-paraffin (octadecane) mixtures | Not mentioned | COMPASS | Octadecane–water slurry simulations were performed to study the melting mechanism |
| 24 | Zeng and Khodadadi68 | 2018 | n-Eicosane (C20H42) and n-triacontane (C30H62) | LAMMPS | NERD, LJ | The solid ratio plays a significant role in the thermal conductivity for low orientation factor systems |
| 25 | Luo and Lloyd70 | 2012 | Paraffin (C30H62) containing graphene/graphite | Not mentioned | COMPASSc, Airebo,f69 LJ | Approaches to improve interfacial thermal transport are proposed |
| 26 | Babaei et al.71 | 2013 | Paraffin (octadecane) containing graphene/CNT | LAMMPS | NERDg, Tersoff, LJ | Introducing carbon nanotubes and graphene into long-chain paraffin leads to a considerable enhancement in thermal conductivity |
| 27 | Babaei et al.72 | 2013 | Paraffin (octadecane) containing graphene/CNT | LAMMPS | NERD, Tersoff, LJ | The enhancement is higher for solid-phase mixtures |
| 28 | Babaei et al.73 | 2013 | Paraffin (octadecane) containing graphite | LAMMPS | NERD, Tersoff, LJ | Solid interfaces have higher conductance concerning the liquid phase systems |
| 29 | Huang et al.75 | 2015 | Paraffin (nonadecane) containing graphene/graphene oxide | Materials Studio | Universal force field (UFF)74 | Non-covalently-functionalized graphene surfaces would indirectly affect thermal conductance |
| 30 | Yu Wang et al.76 | 2015 | Paraffin (C30H62) containing doped graphene | LAMMPS | PCFFb, Airebo, Tersoff, LJ | The hydrogenation of graphene exerts opposite effects on the properties of graphene–paraffin nanocomposites |
| 31 | Lin and Rao77 | 2016 | Paraffin (eicosane) containing BNNS/BNNT | LAMMPS | TraPPEh, Tersoff, LJ | The thermal conductivity of paraffin could be improved by boron nitride |
| 32 | Li et al.78 | 2017 | Paraffin (octadecane) containing Cu nanoparticles | Materials Studio | COMPASS | Cu nanoparticles can improve the thermal properties of n-octadecane |
| 33 | Liu and Rao79 | 2017 | Paraffin (octadecane) containing CNT on the copper surface | Materials Studio | COMPASS | Thermal diffusion and phase transition of C18H38 were investigated in detail |
| 34 | Yuan et al.80 | 2018 | Paraffin (octadecane) containing pristine and functionalized graphene (by hydroxyl, carboxyl, and ethyl) | Materials Studio | COMPASS | The system functionalized by ethyl obtained a 10 K increase in phase change temperature |
| 35 | Yu et al.81 | 2019 | Molten salt (NaCl) containing SiO2 nanoparticles | Materials Studio, LAMMPS | COMPASS | The structural deformation during the phase transition of CPCM was observed |
| 36 | Zhang et al.82 | 2019 | Paraffin (pentacosane)/ethylene-vinyl acetate (EVA)/graphene | Materials Studio | Universal force field (UFF)74 | Excessive graphene in paraffin/EVA could lead to crystalline disorder |
| 37 | Zhao et al.83 | 2020 | Paraffin (octadecane) containing CuO nanoparticle | LAMMPS | CHARMM, LJ | Significant melting enthalpy reduction was found in NPCMs |
| 38 | Tafrishi et al.84 | 2020 | Paraffin (tetracosane) containing graphene/CNT | LAMMPS | PCFF, Tersoff, LJ | Graphene and CNT increase the thermal conductivity of the tetracosane |
| 39 | Tafrishi et al.85 | 2020 | Paraffin (octadecane) containing graphene and BNNS | LAMMPS | PCFF, Airebo, Tersoff, LJ | The nanocomposite had a lower density change, more heat capacity, more thermal conductivity, and a lower diffusion coefficient |
| 40 | Tong et al.86 | 2020 | n-Eicosane confined in graphene | LAMMPS | NERD for alkanes | The contact layers are harder to melt and easier to solidify compared with the main part of the systems |
| 41 | Wang et al.87 | 2020 | Eicosane containing Ag, Cu, Al, and Fe | Not mentioned | COMPASS | The presence of nanoparticles leads to more eicosane molecular conformations tending from a linear state to a bent state |
| 42 | Liu and Rao89 | 2020 | n-Octadecane with boron nitride layers | Not mentioned | Dreiding,88 LJ | The effect of defects of BN modified with functional groups on ITC was studied |
| 43 | Zhao et al.90 | 2021 | Paraffin (octadecane) containing CuO nanoparticle | LAMMPS | CHARMM, LJ | The existence of a nanolayer reduces phonon scattering and promotes heat transfer |
| 44 | Yu et al.93 | 2021 | NaCl containing CNT | LAMMPS | Born–Mayer–Huggins (BMH) potential,91,92 Airebo, LJ | The NaCl-SWCNT-based CPCM was proposed and designed by materials design strategy |
| 45 | Jamshideasli et al.94 | 2021 | n-Octadecane containing graphene sheets | LAMMPS | NERD, Tersoff, LJ | The solid phase paraffin mixture exhibits higher ITC than the liquid phase |
| 46 | Gu et al.95 | 2021 | Capric acid/ethylene-vinyl/graphene | Not mentioned | Universal force field (UFF), COMPASS | CA/EVA/GR keeps high latent heat at a low dosage of GR, but GR up to 14.4 wt% results in a large reduction |
| 47 | Li et al.96 | 2021 | n-Eicosane containing functionalized graphene (with epoxide and hydroxyl groups) | Materials Studio | COMPASS | Interfacial thermal resistance is reduced by functionalized graphene |
| 48 | Wu et al.97 | 2021 | Paraffin (C22H46) containing boron nitride nano sheets | LAMMPS | NERD, LJ | TC of composites is controlled by TC of h-BN and ITR at n ≤ 15 and by the aspect ratio of h-BN n > 15 |
| 49 | Glova et al.101 | 2021 | n-Eicosane containing asphaltene | LAMMPS, GROMACS | GAFF98 and CHARMM36 (ref. 99 and 100) | Chemically modified asphaltenes can be used as thermal conductivity enhancers |
| 50 | Tiantian et al.102 | 2021 | n-Octadecane near graphite layers | Not mentioned | COMPASS, LJ | The thermal conductivity of amorphous n-octadecane is about 2.5 times lower than that of crystal n-octadecane |
| 51 | Gao et al.103 | 2022 | Palmitic acid-containing graphene | Materials Studio | COMPASS | Adding graphene to palmitic acid reduces the radius of gyration and increases thermal conductivity and capacity |
| 52 | Rao et al.104 | 2012 | Paraffin (octadecane) with SiO2 shell | Materials Studio | COMPASS | The nano-encapsulated phase change materials with free shells will increase the fluidity of core material |
| 53 | Rao et al.105 | 2013 | Paraffin (octadecane) with SiO2 shell in the water | Materials Studio | COMPASS | The mobility of the nanoparticle-enhanced PCM decreased with the increase of the diameter of nanoparticles |
| Paraffin containing Al nanoparticle | ||||||
| 54 | Nie et al.106 | 2015 | Paraffin (hexacosane) in the CNT | Materials Studio | COMPASS | Paraffin molecules exhibited an orderly structural distribution near the inner wall of the CNTs |
| 55 | Liu et al.107 | 2017 | Octacosanoic, docosane, polystyrene | Materials Studio | COMPASS | The polystyrene weakened the diffusion and the thermal response of the system |
| 56 | Liu and Rao108 | 2019 | Hypercrosslinked polyurethanes with water | Not mentioned | COMPASS, LJ | The effect of crosslinkers on heat and mass transfer properties was discussed |
| 57 | Abbaspour et al.109 | 2021 | Octadecane and eicosane encapsulated in different CNTs | DL_POLY | OPLSAA, LJ | A longer CNT has a lower melting point than the normal CNT system |
| 58 | D. Feng et al.110 | 2019 | Polyethylene glycol in the mesoporous silica MCM-41 | LAMMPS | CVFFi, PCFF, LJ | The PEG/MCM-41-NH2 showed superior phase-change performance than PEG/MCM-41-OH. |
| 59 | Li et al.111 | 2021 | Stearic acid, octadecanol, octadecylamine, and octadecane in CNT | Materials Studio | Universal force field (UFF) | The molecular interactions between C18-PCM molecules with different functional groups were studied systematically |
In molecular dynamics, the size of the simulation box is limited and can affect the measured heat transfer attributes.25,26 However, because running MD simulations are time-consuming even with high-speed clusters, a good and enough box size choice should be acceptable for accepting and publishing the MD studies. Because the needed investigations are much more than those have been done so far and the size dependency of PCM materials was not very obvious in the literature. In other words, usually with increasing the simulation box dimensions and number of atoms, the results will not very change after an optimized value of box length and atom numbers.
3.1 Pure PCM simulations
Pure PCM materials MD simulations will discuss in this section. Zerbi et al.28 investigated n-nonadecane (C19H40) experimentally and numerically using the Snyder force field.27 They investigated some structural properties such as trans and gauche conformations of nonadecane. Esselink et al.31 studied the nucleation and melting behavior of n-alkanes (normal alkanes); butane to dodecane. The n-alkane model consists of a linear chain of segments –CH2–, with the terminal segments –CH3.38 They used Ryckaert and Bellemans potential29 for alkanes (butane to dodecane) and Lennard-Jones potential (12–6) for interactions between the segments (chains). Berendsen coupling technique112 was used to bring desired temperature and pressure. At first, they increased the temperature to reach the melted and amorphous phase of alkane and then decreased the temperature to crystalize that. Results showed that using too low temperatures for crystalizing the alkane (by fast quenching rate), would undercool the system and not reach a crystalized one. Also, when the lower temperature was too high, crystallization did not occur. Fig. 3 shows crystalized undecane (C11H24). The investigations showed that with increasing the alkane chain, the crystallization growth rate increases too, however, the researchers declared that the growth rate pertain to the nucleus size and therefore the simulated system size. For lower chain alkanes like butane, no crystallization was observed.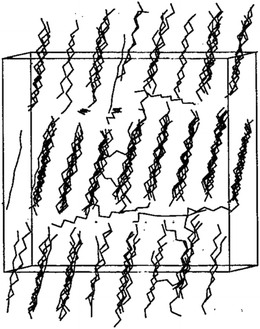 | ||
| Fig. 3 127 undecane chains in crystalline form (this figure has been reproduced from ref. 31 with permission from AIP Publishing, copyright 1981). | ||
They calculated the melting and crystalizing temperatures of alkanes. The melting temperature was greater than the crystallizing temperature. The experimental melting temperature of alkanes was a value between the melting and crystallizing temperature. They also declared that since the boundaries were periodic, the heat needed for melting is more than a finite boundary, so leading to overheating.113 Shimizu and Yamamoto32 declared that the melting of n-decane (C10H22) is significantly affected by its state on the surface. They observed that the beginning of liquefying is in the inside of the film (Fig. 4).
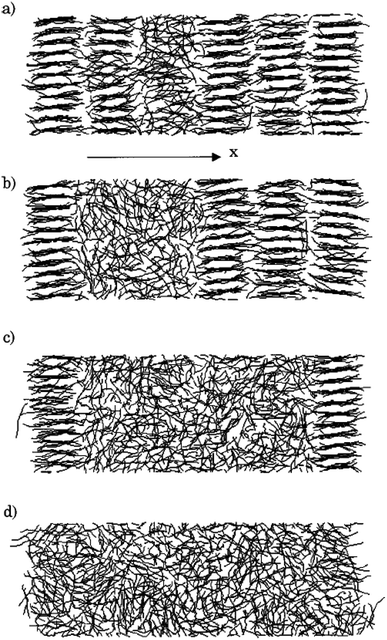 | ||
| Fig. 4 Molecular trajectory during liquefying at 324 K (this figure has been reproduced from ref. 32 with permission from AIP Publishing, copyright 2000). | ||
Tsuchiya et al.37 calculated the melting temperature of some n-alkanes using the resulted RDF (radial distribution function) curves. They used the PCFF force field and 6–9 Lennard-Jones for the van der Waals forces with the NPT ensemble.114,115 Table 2 shows their calculated results of melting points and densities.
| Name | Molecular formula | Calculated melting range (K) | Calculated density (g cm−3) in 240, 260, and 280 K respectively |
|---|---|---|---|
| a Not mentioned. | |||
| n-Octane | n-C8H18 | 200–210 | 0.7555, 0.7266, 0.6140 |
| n-Decane | n-C10H22 | 210–220 | 0.7720, 0.7401, 0.6657 |
| n-Dodecane | n-C12H26 | 240–250 | NMa, 0.7767, 0.7602 |
| n-Tetradecane | n-C14H30 | 260–270 | NM, nm, 0.7804 |
| n-Hexadecane | n-C16H34 | 250–260 | NM, nm, NM |
Zhen Li and Yamamoto40 simulated the melting of n-nonadecane (C19H40) by the MD approach. They observed that in a temperature range of 385 K to 410 K, the center layer inclines to be in the liquid state with both surface layers staying crystalline. The surface monolayer particles showed huge translational vacillations along the chain axes. Mavrantza et al.41 simulated some different chain numbers of polyethylene: C14H28, C16H32, C23H48, C24H48, C48H96, and C96H192. The study aimed to calculate the IR vibrational spectra of the orthorhombic phase of crystalline PE and studied trans–gauche defects. Bulk n-eicosane was simulated by Waheed et al.43 using the PYS force field42 and LJ. At first, the n-eicosane was warmed from 200 K to 500 K and then quenched to 285 K. Fig. 5 shows the quenching of n-eicosane. Crystallization fronts started at the two surfaces and advanced to the cell's focal point.
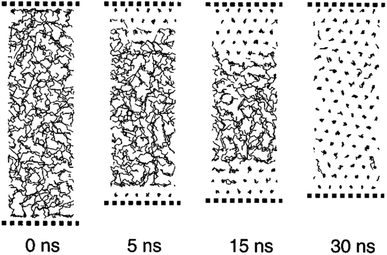 | ||
| Fig. 5 Quenching of n-eicosane from melt phase to solid phase (this figure has been reproduced from ref. 43 with permission from AIP Publishing, copyright 2002). | ||
Marbeuf and Brown45 simulated n-alkanes: C18H38, C19H40, and C20H42. Using DL-POLY software,44 600 molecules were simulated. Diama et al.47 simulated tetracosane (n-C24H50) and dotriacontane (n-C32H66) adsorption on a graphite surface. They used Weber46 and LJ potentials. Fig. 6 shows snapshots of the simulation of the C24H50 monolayer. At lower densities, most of the molecules are arranged parallel to the surface of the graphite. However, at the highest densities, some molecules are moved around.
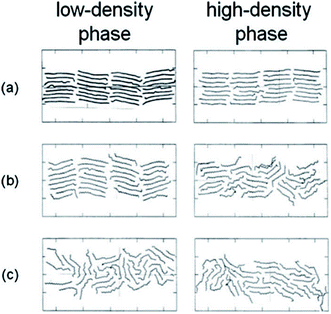 | ||
| Fig. 6 Snapshots showing top views of the MD simulated cells of lower-density (left) and higher-density (right) C24H50 at different temperatures: (a) 300 K, (b) 325 K, and (c) 350 K (this figure has been reproduced from ref. 47 with permission from AIP Publishing, copyright 2009). | ||
Jayaraman et al.49 used nonequilibrium MD simulation to calculate viscosities, thermal conductivities, thermal capacities, and melting points of nitrate salts (LiNO3, NaNO3, KNO3) with LAMMPS software.48 The used potential and time step were Buckingham and 1 fs respectively. The ab initio calculations for heat capacity calculation were carried out using Gaussian. Fig. 7 shows the simulated LiNO3 structure. It turned out that the exact melting point was a very sensitive test of the force field accuracy. Table 3 represents some results of this research.
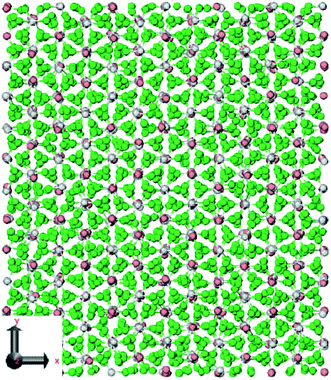 | ||
| Fig. 7 Crystal structures of LiNO3. The green atoms depict oxygen, the gray atoms depict nitrogen, and the pink atoms depict lithium (this figure has been reproduced from ref. 49 with permission from ACS, copyright 2009). | ||
| Nitrate salt | Calculated melting point (K) | Calculated thermal conductivity (W mK−1) | Calculated viscosity (centipoise) | Calculated density (g cm−3) |
|---|---|---|---|---|
| LiNO3 | 459 ± 10 | 0.69 | 1.5 | 1.691 |
| NaNO3 | 591 ± 18 | 0.58 | 1.75 | 1.7397 |
| KNO3 | 513 ± 17 | 0.51 | 1.62 | 1.688 |
The nucleation of n-eicosane crystals was studied by Yi and Rutledge.50 The molecular dynamics system was composed of 336 n-eicosane molecules. The force field was PYS42 parameterized using reference.116 They fitted the curve of free energy to the model of the cylindrical nucleus. Interfacial free energies were determined to be 10 mJ m−2 and 4 mJ m−2 for the side surface and the end surface, respectively.
Rao et al.51 investigated n-nonadecane PCM (C19H40) phase transition under high pressure. By using the Materials Studio 5.5 software117 the simulations were carried out. Fig. 8 shows the simulation system of n-nonadecane PCM. As a result, it was found that the melting temperature of n-nonadecane at high pressure was greater than the melting temperature at atmospheric pressure, and the n-nonadecane order parameter decreased as the temperature increased.
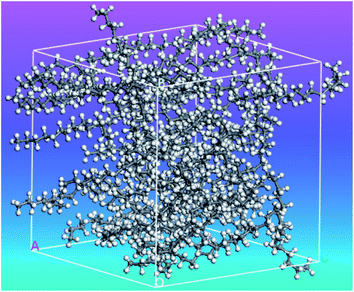 | ||
| Fig. 8 The simulated amorphous structure of n-nonadecane (this figure has been reproduced from ref. 51 with permission from Taylor & Francis, copyright 2012). | ||
Andersen's method115 was used for temperature control and Berendsen method112 for pressure control. The Verlet velocity algorithm118,119 was used to integrate the motion equation. The melting and solidification temperatures of n-nonadecane were about 323 K. The simulated melting temperature was greater than that of atmospheric pressure because it suppressed the high-pressure chain turning and molecular motion. As the temperature raised, the peak of the radial distribution function (RDF) weakened, indicating that the nonadecane order parameter decreased.
Rastgarkafshgarkolaei et al.53 simulated paraffin: C20H42, C24H50, C26H54, and C30H62 molecules. Using NEMD (non-equilibrium molecular dynamics) and EMD (equilibrium molecular dynamics), researchers calculated the thermal boundary conduction between the ideal crystals of paraffin layers. No significant change was observed in thermal conductance in molecular length. The thermal conductivity of three phases of paraffin (solid, liquid, and ideal crystal) was calculated using the NEMD method. The force field was NERD (Nath, Escobedo, and de Pablo revised52). Fig. 9 a displays C20H42 molecules in the ideal crystal form. For creating liquid structures, the systems were equilibrated at 360 K. Subsequently, by cooling the system to 230 K, solid structures were built. The liquid and the solid structures of n-eicosane can be seen in Fig. 9b and c.
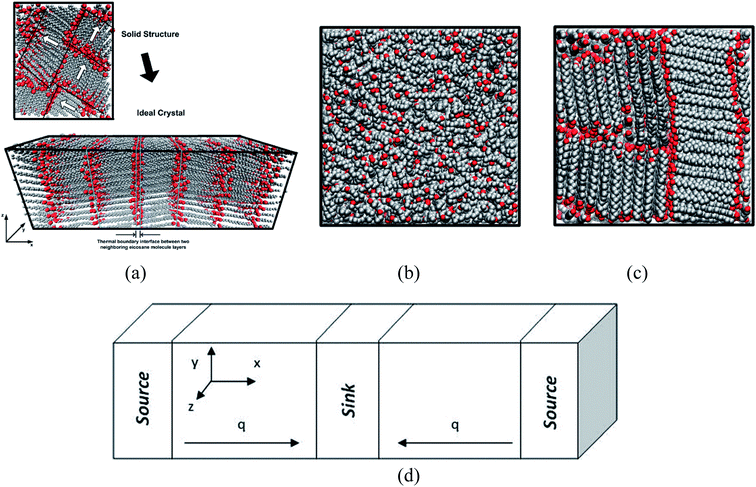 | ||
| Fig. 9 (a) Ideal crystal of C20H42 molecules (grey and red spheres display –CH2– and –CH3, respectively). n-Eicosane molecules in (b) the liquid phase and (c) the solid phase. (d) The simulation box and the configuration of thermal energy sources and sink (This figure has been adapted from ref. 53 with permission from AIP Publishing, copyright 2016). | ||
NEMD method was used in the thermal conductivity calculation simulations. Heat flux was imposed over the structure by interchanging thermal energy between the cold and hot regions (Fig. 9d). Temperatures of each region (of the length of imposed heat) were recorded, after reaching the steady-state. Then, using Fourier's law, the thermal conductivity was calculated. The related Fourier's law formula is as follows:
 | (2) |
 is the temperature gradient in the x-direction (the direction of thermal energy was imposed). Results showed that as the number of carbon atoms increases, the thermal conductivity increases slightly. On the other hand, with increasing the alignment of the molecules, the thermal conductivity increases significantly. The ideal crystal showed the highest thermal conductivity, because of the highest ordered structure.
Ni et al.54 studied molten nitrate salts LiNO3, NaNO3, and KNO3. They calculated the density, thermal conductivity, heat capacity, and viscosity of the salts. Simulations were carried out using the Buckingham force field. Researchers expressed that the molten salt maintains some crystal structure at high temperatures. The LiNO3 coordination was a pentacoordinate structure. While the NaNO3 and KNO3 showed a hex coordinate structure. Fig. 10 shows the calculated viscosities with EMD and NEMD methods.
 | ||
| Fig. 10 The calculated viscosities of nitrate salts (a) LiNO3; (b) NaNO3; (c) KNO3 (this figure has been adapted from ref. 54 with permission from Elsevier, copyright 2019). | ||
Two methods were utilized for calculating the heat capacity, the energy fluctuation method and the enthalpy method (Table 4). Researchers also simulated a mixture of KNO3 and NaNO3. They proposed that the used force field and methods of simulations can be advanced. In the future, there is a need of simulating more complex molten salts and their mixtures.
| Method | LiNO3 | NaNO3 | KNO3 |
|---|---|---|---|
| Energy fluctuation | 2200.8 | 1636.7 | 1605.6 |
| Enthalpy | 2183.6 | 1770.6 | 1486.2 |
Cui et al.55 simulated NaCl and KCl as salt PCMs, using EIM potential. Two methods of heat flux and the Muller–Plathe method were utilized to calculate the thermal conductivity. They have also investigated binary NaCl–KCl systems. Melting transition was indicated by density drop (at higher temperatures). Researchers concluded that the EIM potential could not be appropriate to calculate NaCl and KCl melting points precisely. The thermal expansion coefficients for NaCl and KCl, calculated from the slope of the ln(volume)–temperature line, were 3.561 × 10⁻⁵ K−1 and 3.462 × 10⁻⁵ K−1, respectively. According to Fourier's law, the calculated thermal conductivity using the heat flux method (NEMD) for NaCl was 3.317 W mK−1 and for KCl was 1.776 W mK−1. Also, the calculated thermal conductivities using the Muller–Plathe method (EMD) for NaCl and KCl were 2.713 and 1.396 W mK−1, respectively.
B. Feng et al.57 simulated pentaerythritol (a solid–solid PCM) to calculate its thermal conductivity. Pentaerythritol has a latent heat of ∼280 kJ kg−1 and the temperature of its solid–solid phase transition is ∼459 K.120,121 Pentaerythritol crystals absorb heat and transform from BCT† structure (the α phase) to FCC‡ structure (the γ phase) accompanied by a large amount of thermal energy storage (Fig. 11). During the process of releasing thermal energy, γ phase pentaerythritol can transform back to the α phase.122 Researchers used non-equilibrium MD simulations using the GROMOS56 force field to clarify the relationship between thermal conductivity and crystalline structures of pentaerythritol.
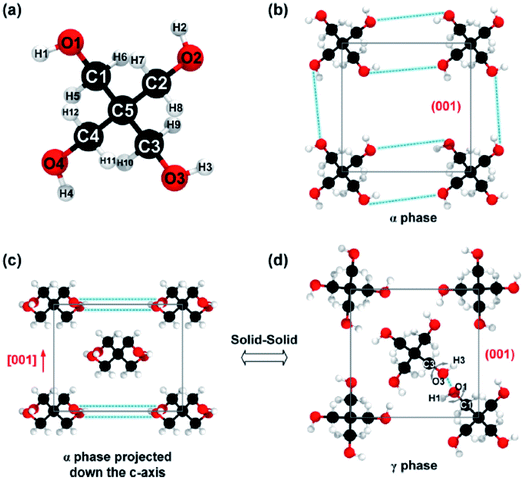 | ||
| Fig. 11 (a) Arrangement of atoms of a single pentaerythritol molecule, (b) pentaerythritol BCT structure, (c) FCC crystalline structure of pentaerythritol, and (d) FCC crystalline structure of pentaerythritol with intermolecular bond rotation (this figure has been reproduced from ref. 57 with permission from Elsevier, copyright 2019). | ||
Results showed that by increasing the temperature from 303 K to 453 K, the thermal conductivity diminished from 0.66 W mK−1 to 0.53 W mK−1. When the temperature of pentaerythritol was higher than Tαγ, the thermal conductivity diminished remarkably to 0.23 W mK−1. By further increasing of temperature, the thermal conductivity decreased to 0.20 W mK−1. The degradation and weakening of hydrogen bonds after the transition from α to γ phase could be the most important change in crystal structures, leading to the halving of the thermal conductivity of pentaerythritol.
Octadecanoic acid is an excellent PCM due to its narrow phase change temperature and high energy density. Y. Feng et al.59 studied octadecanoic acid with EMD simulations for investigating the thermal conductivity size-dependency of bulk, nanowire, and nanochain forms of octadecanoic acid. The time step was set to 0.1 fs because of the high-frequency vibrations of hydrogen atoms. The simulations were implemented using the CHARMM force field in the LAMMPS package. At first, the octadecanoic acid relaxed at the temperature of 300 K under the NVT ensemble for 0.1 ns. Then under the NVE ensemble (for 1 ns), the heat flux was simulated. Switching the NVT to the NVE ensemble was for obtaining a more stable heat flux. Bulk, nanowire, and nanochain forms of octadecanoic acid had thermal conductivities of 0.45, 0.20, and 0.001 W mK−1, respectively. For investigating the size effect of thermal conductivity, the VDOS (vibrational density of states) and phonon overlap energy were compared. The nanowire form had lower thermal conductivity compared to the bulk form because the limited size of the nanowire geometry reduces the vibrations of the atoms and weakens the phonon matching level. The nanochain form of the octadecanoic acid has a curled structure, so it shows higher molecular distances and more phonon scattering probabilities under weak van der Waals forces that lead to the reduction of thermal transportation.
Feng et al.60 studied the monohydric alcohols C12H26O, C14H30O, and C16H34O. By imposing tensile strains on ideal crystals of monohydric alcohols, the intrinsic thermal conductivity was enhanced. GROMOS and LJ potential were utilized in the simulations. The ideal crystal models of monohydric alcohols showed a higher thermal conductivity than their original ones. When the applied tensile strain was 0.1, the thermal conductivities increased by 170%. So, the main result of this research was that by imposing certain tensile strains (on nano-materials with highly ordered structures), their heat transfer performance enhances. In another similar research, Feng et al.61 calculated the thermal conductivity of C12H26O, C14H30O, and C16H34O. The ideal crystals had twice the amount of thermal conductivity compared to the solid samples. The predicted thermal conductivity of the ideal crystal of C16H34O reached up to about 0.449 W mK−1, while that of the solid C16H34O was only about 0.218 W mK−1. Also, when the interfaces of these monohydric alcohols are surrounded by –OH groups, the interfacial thermal transfer coefficient will be fourfold larger than those surrounded by –CH3 groups.
3.2 Simulations of mixed PCMs with each other (slurry PCMs)
Molecular dynamics studies of mixtures and slurry PCMs will discuss in this section. Wentzel and Milner64 studied the simulation of pure C23H48 alkane and the mixture of C21H44 and C23H48. They used OPLSAA62 and flexible Williams63 force fields. But only the flexible Williams force field gave good agreement with the experimental results. Rao et al.65 investigated the molecular dynamics simulating water and n-nonadecane paraffin (C19H40) mixtures. They constructed the mixtures with different paraffin mass fractions (0%, 10%, 20%, and 30%). Simulations were carried out using the COMPASS force field, a cutoff distance of 9.5 Å, and a time step of 1 fs. The Berendsen52 and Andersen115 methods were utilized to control the pressure and the temperature, respectively. Materials Studio software (Accelrys)117 was used for the MD simulations. The mixtures' self-diffusion coefficient was enhanced with temperature increasing but diminished with increasing the nonadecane mass fraction. Despite decreasing mobility because of mixing paraffin into the water, the thermal energy storage capacity increased. In another study, nonadecane (C19H40), tetracosane (C24H50), and their mixtures were simulated by Rao et al.66 As shown in Fig. 12, they constructed four PCM mixtures with different proportions of different kinds of paraffin (pure nonadecane, pure tetracosane, equal molar fraction of nonadecane, and tetracosane, nonadecane triple of tetracosane).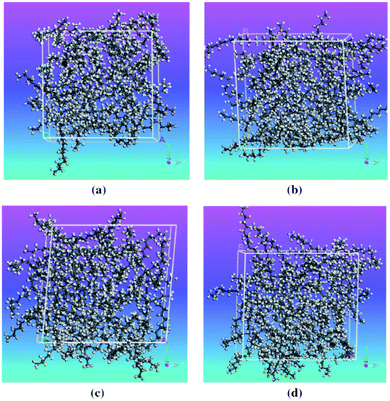 | ||
| Fig. 12 Construction of PCM mixtures: (a) pure nonadecane; (b) pure tetracosane; (c) mixture of nonadecane and tetracosane, 1/1; (d) mixture of nonadecane and tetracosane, 3/1 (this figure has been reproduced from ref. 66 with permission from Elsevier, copyright 2013). | ||
The mean square displacement (MSD), which means measuring the mean range of all particles over time, is commonly used to define the system conduct in phase changes. Eqn (2) was used to compute the MSD:
 | (3) |
Based on the Einstein equation,123 the self-diffusion coefficient (D) was computed as follows:
 | (4) |
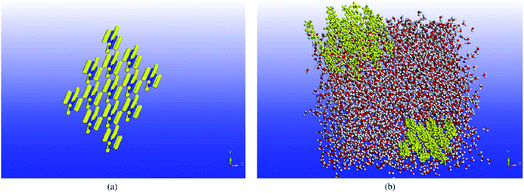 | ||
| Fig. 13 The constructions of (a) pure octadecane and (b) octadecane–water mixture (this figure has been reproduced from ref. 67 with permission from Elsevier, copyright 2016). | ||
The potential energy versus temperature curve showed that the melting range of octadecane is between 295 K and 305 K. This result is close to the experimental results. Also, they demonstrated that by enhancing the octadecane mass fraction in the mixtures, the heat capacity of the mixture diminished. Maybe this was due to the higher heat capacity of water, that with increasing the paraffin mass fraction, the mass fraction of water decreases and so decreases the heat capacity of the mixture.
The mechanism of paraffin mixtures crystallization was studied by Zeng and Khodadadi.68 They simulated the n-eicosane (C20H42) and n-triacontane (C30H62) with different mass fractions. Results showed a great influence of the orientation factor of paraffin molecules on the thermal transport properties of the mixtures. The mass fraction of n-triacontane had a negligible impact on the thermal transport properties of the mixtures. Moreover, results showed that the solid ratio plays a significant role in the mixtures' thermal conductivity with low orientation factors.
3.3 Nano-enhanced PCM simulations
Molecular dynamics studies of nanocomposite PCMs which mean PCM incorporating nano-additives will discuss in this section. Luo and Lloyd70 investigated the interfacial thermal conductance of graphene/graphite–paraffin. They used Airebo potential69 for graphene and graphite, COMPASS for C30H62, and LJ (Lennard-Jones) for interactions between them. The cutoff radius of LJ was 10 Å and the time step was 0.25 fs. They heated and cooled the structures several times to release internal uneven stresses. Then by using the NPT ensemble, the structures reached their optimized size (equilibration step). Then they used non-equilibrium molecular dynamics (NEMD) by allocating two 5 Å thick regions for the heat source and sink. They fixed a thin region in each turn of the long box and then defined the heat slabs (source and sink) near them. The thermal conductance (G) was calculated by using G = J/ΔT formula. In this formula, J is the heat flux and ΔT is the temperature difference of interface material (temperature discontinuity of two sides of graphene/graphite). Thermal conductance was calculated over 2![[thin space (1/6-em)]](https://www.rsc.org/images/entities/char_2009.gif) 000
000![[thin space (1/6-em)]](https://www.rsc.org/images/entities/char_2009.gif) 000 time steps (0.5 ns). The thermal conductivity of pure paraffin was obtained at 0.327 W mK−1 (the related temperature of this calculation is not mentioned in the paper, but it was probably at 300 K). Firstly, they studied the effect of simulation box size on the thermal conductance of paraffin and resulted in no obvious size dependency. This was concluded that in paraffin because of short bond lengths, major phonons (heat carriers) have very short propagation lengths. But for graphene–paraffin mixtures size dependency, the research showed that phonons with a wave length larger than about 20 Å contribute 15% to thermal conductance. Besides phonons with a wave length larger than about 40 Å contribute only 7% to the thermal conductance results. They declared that graphene–paraffin thermal conductance (61–71 MW m−2 K−1) is more than that of CNT–paraffin. But they referenced a study for CNT–argon thermal conductance124 that was 1–3 MW m−2 K−1. Also, researchers had found that by changing the van der Waals interactions between paraffin and graphite to covalent bonds, the interfacial thermal conductance will increase to about 536 MW m−2 K−1 (Fig. 14). This is because of the higher energy of covalent bonds rather than van der Waals ones.
000 time steps (0.5 ns). The thermal conductivity of pure paraffin was obtained at 0.327 W mK−1 (the related temperature of this calculation is not mentioned in the paper, but it was probably at 300 K). Firstly, they studied the effect of simulation box size on the thermal conductance of paraffin and resulted in no obvious size dependency. This was concluded that in paraffin because of short bond lengths, major phonons (heat carriers) have very short propagation lengths. But for graphene–paraffin mixtures size dependency, the research showed that phonons with a wave length larger than about 20 Å contribute 15% to thermal conductance. Besides phonons with a wave length larger than about 40 Å contribute only 7% to the thermal conductance results. They declared that graphene–paraffin thermal conductance (61–71 MW m−2 K−1) is more than that of CNT–paraffin. But they referenced a study for CNT–argon thermal conductance124 that was 1–3 MW m−2 K−1. Also, researchers had found that by changing the van der Waals interactions between paraffin and graphite to covalent bonds, the interfacial thermal conductance will increase to about 536 MW m−2 K−1 (Fig. 14). This is because of the higher energy of covalent bonds rather than van der Waals ones.
 | ||
| Fig. 14 (a) Paraffin–graphite structure with van der Waals interaction. (b) Paraffin–graphite thermal conductance using the NEMD method. (c) Paraffin–graphite structure with covalent bonds between edge atoms of graphite and paraffin molecules that result in higher thermal conductance. (d) Graphite exfoliation by paraffin molecules in the condition of high energy van der Waals interactions (this figure has been adapted/reproduced from ref. 70 with permission from Wiley Publications, copyright 2012). | ||
They also found that graphene–paraffin thermal conductance is higher than that of graphite–paraffin, because of higher carbon atoms per unit area of graphene (0.38 atom per Å2) rather than graphite (0.12 atom per Å2). Furthermore, they found that when van der Waals interactions between paraffin and graphite become more than three times, the paraffin molecules will penetrate between graphite flakes and will exfoliate it into single graphene sheets (Fig. 14d). The authors also investigated the impact of density on graphene–paraffin thermal conductance. They increased the density of paraffin (by increasing the pressure) from 0.7 to 0.89 g cm−3 and saw that thermal conductance increases monotonically. This was because of the interactions of more paraffin atoms with graphene. Because the RDF§ diagram of the graphene–paraffin mixture showed higher peaks with increasing density and so this can confirm the previous sentence. Furthermore, with density rising, the peaks of vibration power spectra shifted from lower frequencies to higher ones.
Babaei et al.71 utilized nonequilibrium MD simulations to study the relationship between the octadecane paraffin structure and its thermal conductivity. Using NERD force field and a time step of 1 fs, they simulated octadecane, octadecane–graphene, and octadecane–CNT nanocomposites. CNT and graphene were kept fixed after the equilibration of the systems. Researchers declared that this method allows the simulations to calculate just the paraffin's thermal conductivity. LAMMPS package was used for doing the simulations. Results showed that with the crystallization of pure paraffin, the thermal conductivity raised, and in the composites, the ordering of paraffin molecules increased, which resulted in a higher thermal conductivity in liquid structures in comparison with liquid pure paraffin. Researchers concluded that this increase in thermal conductivity is due to both the higher thermal conductivity of the fillers and the filler-induced alignment of paraffin molecules. Fig. 15 shows the octadecane–CNT and octadecane–graphene nanocomposites in the solid and liquid phases (crystallized and amorph shapes).
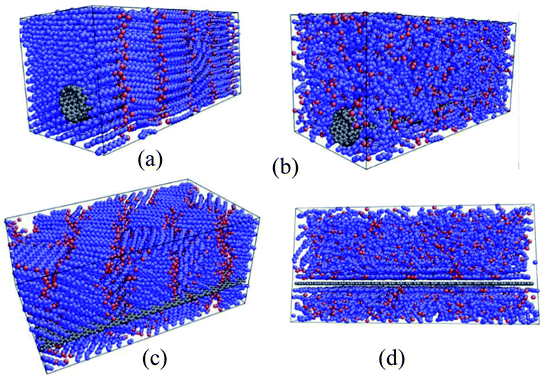 | ||
| Fig. 15 (a) Solid and (b) liquid octadecane–CNT mixtures. Octadecane–graphene mixtures in (c) solid state and (d) liquid state (this figure has been adapted from ref. 71 with permission from Elsevier, copyright 2013). | ||
The parameter of molecular alignment, s, is calculated as follows:125
 | (5) |
| Material | Phase | Temperature | Thermal conductivity | Alignment parameter |
|---|---|---|---|---|
| Pure octadecane paraffin | Liquid | 300 K | 0.164 W mK−1 | 0.02 |
| Pure octadecane paraffin | Solid | 270 K | 0.30 W mK−1 | 0.15 |
| Pure octadecane paraffin | Perfect crystal along with the molecules | 270 K | 1.126 W mK−1 | 0.987 |
| Pure octadecane paraffin | Perfect crystal perpendicular | 270 K | 0.347 W mK−1 | Not mentioned |
| Octadecane–CNT nanocomposite | Liquid | 300 K | 0.243 W mK−1 | 0.11 |
| Octadecane–CNT nanocomposite | Solid | 270 K | 0.499 W mK−1 | 0.908 |
| Octadecane–graphene nanocomposite | Liquid | 320 K | 0.249 W mK−1 | 0.20 |
| Octadecane–graphene nanocomposite | Solid | 270 K | 0.560 W mK−1 | 0.28 |
Babaei et al.72 studied again the effect of adding graphene and CNT to octadecane paraffin. The average value of thermal conductivity of octadecane–graphene and octadecane–CNT liquid mixtures was about 0.21 W mK−1. While the solid octadecane–CNT nanocomposite was about 0.5 W mK−1. So, the results of octadecane–CNT nanocomposite showed an improvement of 68% in comparison with pure paraffin. Researchers concluded that the more-ordered paraffin molecules exhibited enhanced thermal conductivity. In another investigation, Babaei et al.73 studied graphene and paraffin interfacial thermal conductance. They constructed graphene with different layer numbers. Solid paraffin showed higher interfacial thermal conductance in comparison with the liquid one. Also, by increasing the graphene layer number, the interfacial thermal conductance diminished in both liquid and solid states.
Huang et al.75 simulated pure paraffin, paraffin–graphene mixture, and paraffin–graphene oxide mixture. The selected paraffin was n-nonadecane with a molecular formula of C19H40. The graphene was a square shape with about 2.5 nm side with H-terminated edges while graphene oxide contained 14 hydroxyl and 14 epoxy groups. Fig. 16 shows the structure of constructed graphene oxide. The paraffin–graphene system possessed 3 graphene sheets and the paraffin–graphene oxide system contained 3 graphene oxides. Simulations were carried out using the UNIVERSAL force field,74 under the NVT ensemble.
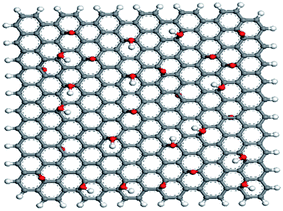 | ||
| Fig. 16 Structure of graphene oxide. The white and red colors are for H and O atoms, respectively (this figure has been adapted from ref. 75 with permission from Elsevier, copyright 2015). | ||
To ascertain the thermal conductivity of the systems, they used non-equilibrium molecular dynamics by imposing a heat flux in the system. Utilizing Fourier's law, the thermal conductivities were determined. Table 6 shows the results of thermal conductivities, diffusion coefficients, and heat capacities, of three simulated systems.
| Paraffin | Paraffin–graphene | Paraffin–graphene oxide | |
|---|---|---|---|
| Thermal conductivity (W mK−1) | 0.373 | 0.488 | 0.506 |
| Diffusion coefficient | 0.076 | 0.012 | 0.008 |
| Heat capacity in constant volume (kcal mol−1) | 3.45 × 10³ | 3.81 × 10³ | 4.24 × 10³ |
Researchers concluded that both graphene and graphene oxide nano additives can enhance the thermal conductivity and heat capacity of paraffin, but graphene oxide performed more efficiently than graphene.
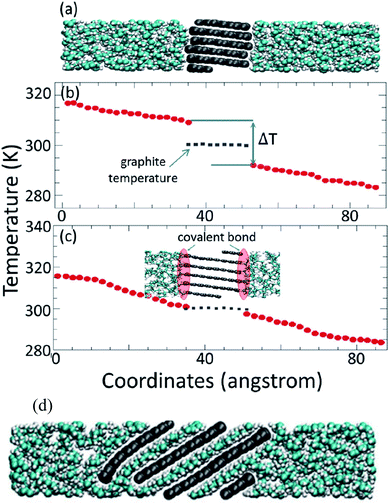
Yu Wang et al.76 concentrated on the mechanical and thermal properties of paraffin (C30H62) containing doped graphene. They focused on the change of paraffin–graphene interfacial thermal transport by utilizing different treatment strategies. They studied the effectiveness of hydrogenation, defecting, and doping in decreasing the paraffin–graphene interfacial thermal resistance. From the consequences of the simulations of the paraffin–graphene mixtures under tensile loading, lower Young's modulus and smaller tensile strength were considered for the paraffin filled with hydrogenated graphene. Paraffin was simulated using the PCFF force field. For modeling the pristine and hydrogenated graphene, AIREBO potential was utilized.126 For modeling the dopant atoms (boron and nitrogen), the Tersoff potential was used.127,128 The Muller–Plathe method was adopted to investigate thermal transport behaviors. The time step was set to 0.25 fs. As displayed in Fig. 17a, the heat sink and source were situated at both ends and in the center of the composite model, respectively. The temperature gradient was set up between the heat sink and source (Fig. 17b). Between the heat source and sink regions, a heat flux (J) was applied under the NVE ensemble. A temperature jump ΔT at the interface of paraffin–graphene was observed. Interfacial thermal resistance RK of the paraffin–graphene nanocomposite was calculated by:
 | (6) |
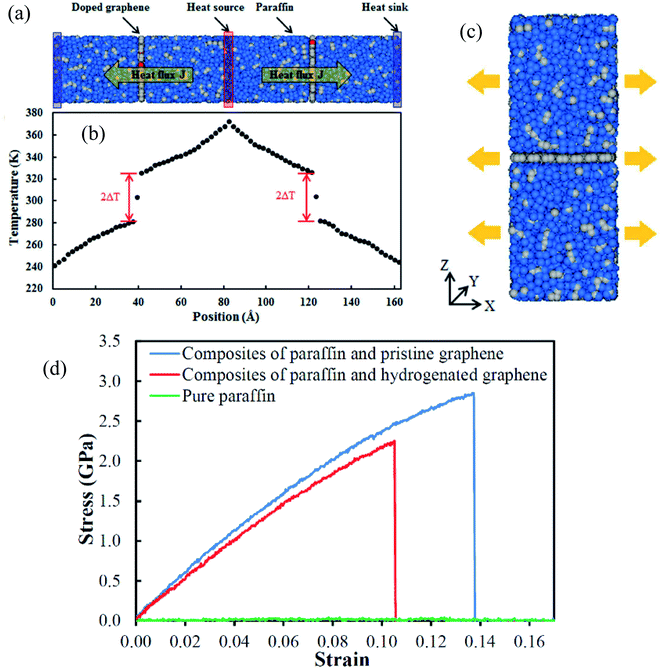 | ||
| Fig. 17 (a) Paraffin-doped graphene nanocomposite structure (blue balls are hydrogen atoms, grey balls are carbon atoms, and red balls are dopant atoms); and (b) the temperature gradient result along the length of the nanocomposite. (c) Paraffin–graphene nanocomposite under tension (blue balls are hydrogen atoms and grey balls are carbon atoms). (d) Paraffin–graphene nano composites' stress–strain curves (this figure has been reproduced from ref. 76 with permission from Royal Society of Chemistry, copyright 2015). | ||
The thermal conductivity of pure paraffin was 0.309 W mK−1. Based on eqn (6), the paraffin–graphene interfacial thermal resistance was RK0 = 0.669 × 10⁻⁸ m2 K−1 W−1. With a 4.17% H-coverage, the interfacial thermal resistance between paraffin and graphene was reduced significantly by 11.6%. As shown in Fig. 20c, a tensile loading was applied with a strain rate of 0.0005 ps−1, in the armchair direction. Stress–strain curves of the nanocomposites are plotted in Fig. 17d. Young's modulus and ultimate tensile strength of paraffin–graphene nanocomposite were 26.7 GPa and 2.85 GPa, respectively. The 4.17% hydrogenated graphene. A 4.17% hydrogenated graphene caused ∼21% and ∼9% deteriorations in the tensile strength and Young's modulus of the graphene–paraffin nanocomposites, respectively. Researchers expressed that: “hydrogenation of graphene triggers the transition of strong sp2 bonds to weaker sp3 bonds”. Analysts concluded that with hydrogenating the paraffin–graphene nanocomposite, interfacial thermal conductance improves. But, this should be utilized wisely to minimize the reduction of its mechanical strength.
Lin and Rao77 studied the effects of adding boron nitride nanosheet (BNNS) and also boron nitride nanotube (BNNT) to n-eicosane on its thermal properties. The structure of BNNS is analogous to graphene (hexagonal honeycomblike lattice) and has significant thermal conductivity. BNNT is similar to CNT and has high thermal conductivity either. They used LAMMPS for simulations and the used force fields were TraPPE (for alkane molecules), Tersoff (for BNNS and BNNT), and LJ (for interactions between n-eicosane molecules and boron nitride nanostructures). They constructed two types of n-eicosane system, amorphous structure and perfect crystalline structure (Fig. 18a and b). Fig. 18c and d show the structures of BNNS and BNNT respectively. Pure n-eicosane systems were minimized (energy minimization) using the conjugate-gradient algorithm.129
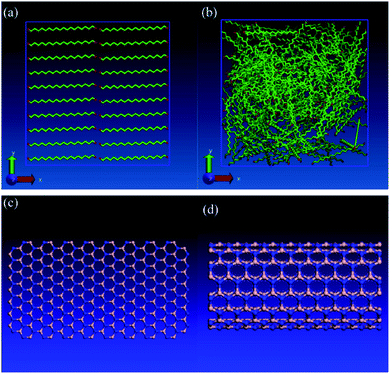 | ||
| Fig. 18 (a) Perfect crystalline structure of pure n-eicosane system, (b) amorphous phase of pure n-eicosane, (c) boron nitride nanosheet (BNNS), (d) boron nitride nanotube (BNNT). The red atoms represent the methyl (–CH2–) group and the green atoms represent the methylene (–CH3) group. The color of nitrogen atoms is blue and the color of boron atoms is silver (this figure has been reproduced from ref. 77 with permission from Elsevier, copyright 2016). | ||
By adding BNNS and BNNT into n-eicosane paraffin, the thermal conductivity was fundamentally improved however latent heat was decreased. By increasing the temperature, the thermal conductivity of mixtures increased too, but for the perfect crystal decreased. The thermal conductivity of the amorph phase of the paraffin was independent of temperature change. This increase was greater before the melting point. Calculated thermal conductivities (in T = 270 K) were 0.33 W mK−1 for pure n-eicosane with a perfect crystalline structure, 0.14 W mK−1 for amorphous structure, 4.77 W mK−1 for the mixture of paraffin–BNNS, and 5.18 W mK−1 for the paraffin–BNNT mixture.
Li et al.78 researched an n-octadecane–Cu nanocomposite system for studying its thermal properties. The diffusion coefficient at different temperatures showed that the n-octadecane–Cu nanofluid melting point increases with the increase of the Cu nanoparticle mass ratio. A similar trend for heat capacity and thermal conductivity was also found. Liu and Rao79 investigated the interaction of n-octadecane with a surface of copper. Also, they studied the addition of a single-wall carbon nanotube in paraffin on the copper surface. They observed that paraffin molecules next to the copper surface were shaped in an orderly manner. So, the thermal conductivity increased. Also, after the addition of CNT, the orderly arrangement of paraffin molecules enhanced significantly and the phase transition temperature increased too. Yuan et al.80 investigated n-octadecane paraffin containing pristine and functionalized graphene in different groups (hydroxyl, carboxyl, and ethyl groups). All constructed materials are shown in Fig. 19.
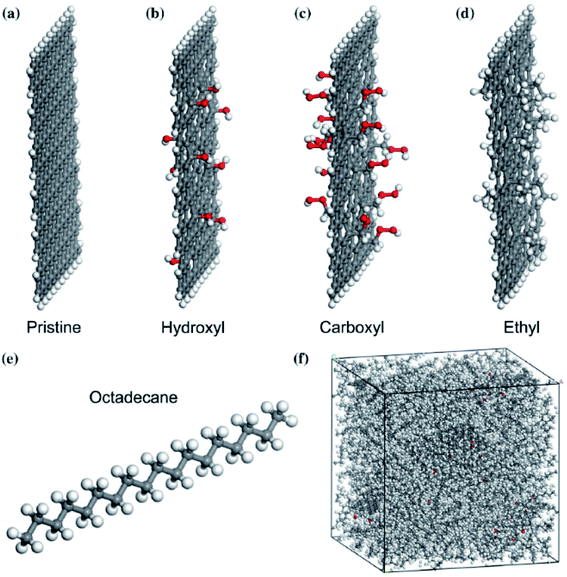 | ||
| Fig. 19 The model of (a) pristine graphene and graphene functionalized with (b) hydroxyl, (c) carboxyl, (d) ethyl, (e) octadecane molecule, (f) configured composite system (gray balls are carbon atoms, white balls are hydrogen atoms, and red balls are oxygen atoms) (this figure has been reproduced from ref. 80 with permission from Springer Nature, copyright 2018). | ||
Simulations had done by Materials Studio software, using the COMPASS force field. The authors used non-equilibrium molecular dynamics (NEMD) simulation based on Muller–Plathe's method for thermal conductivity calculations. The thermal conductivity of the paraffin–pristine graphene system was 0.251 W mK−1 at 320 K. The thermal conductivity increased by functionalizing the graphene. With 10% functionalization coverage of graphene by hydroxyl, carboxyl and ethyl groups, the thermal conductivity of nanocomposites reached 0.33, 0.343, and 0.401 W mK−1 respectively. Moreover, with increasing coverage percent of graphene, the thermal conductivity was enhanced. The system functionalized by ethyl resulted in a 10 K increment in melting temperature, a 12% increment in the thermal capacity at 300 K, and a 59.8% increment in thermal conductivity at 320 K and these values were larger than that of the systems functionalized by ethyl and carboxyl. The molten salt phase change material, NaCl–SiO2 composite, was simulated by Yu et al.81 using a COMPASS force field. The configurations of simulation systems are shown in Fig. 20.
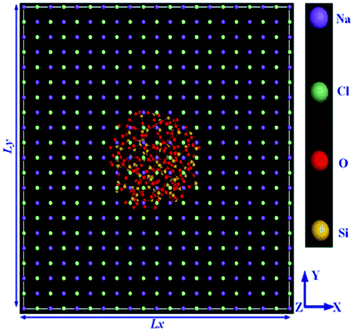 | ||
| Fig. 20 The configuration of the simulation system (this figure has been reproduced from ref. 81 with permission from Elsevier, copyright 2019). | ||
The outcomes demonstrated that NaCl thermal conductivity upgraded surprisingly. By adding a 2.4% volume fraction of SiO2 nanoparticles, the thermal conductivity was enhanced 44.2%. The shear viscosity increased with the increment of the volume fraction of the nanoparticle, with a greatest mean increment of 23.6% with a 2.4% volume fraction of the SiO2 nanoparticle. The melting point of NaCl–SiO2 nanocomposite, increased by increasing the SiO2 volume fraction. Zhang et al.82 conducted MD simulations to study the effect of graphene on n-pentacosane (C25H52) with ethylene-vinyl acetate (EVA) nanocomposites. The addition of 0.7 wt%, 1.5 wt%, 3.6 wt%, and 7.0 wt% of graphene to paraffin–EVA nanocomposite was simulated using Accelrys Materials Studio software. The UNIVERSAL force field (UFF) was utilized in the simulations.74 Fig. 21a–c depict constructed materials for use in the simulations. The Muller–Plathe method was used for thermal conductivity calculations (Fig. 21d).
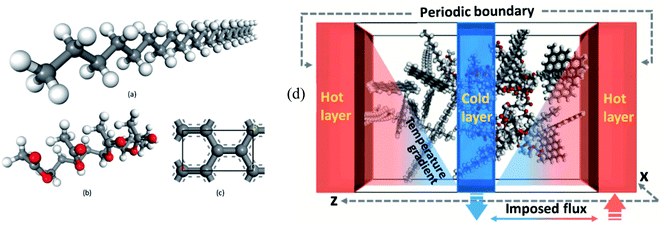 | ||
| Fig. 21 The structures of (a) n-pentacosane paraffin, (b) ethylene-vinyl acetate (EVA) and (c) graphene lattice cell. (d) Schematic of thermal conductivity simulation using imposed flux method (this figure has been adapted from ref. 82 with permission from Elsevier, copyright 2019). | ||
The calculated thermal conductivities of nanocomposite of 7% graphene and paraffin, were 0.4331 W mK−1, 0.4117 W mK−1, 0.4036 W mK−1, 0.4503 W mK−1, and 0.4086 W mK−1 at 313 K, 323 K, 333 K, 343 K, and 353 K, respectively. The addition of graphene to paraffin/EVA firstly enhanced the composite's thermal conductivity but then the thermal conductivity decreased in higher amounts of graphene. Authors declared that this is because of the presence of graphene on the vibration of molecules.
Paraffin (n-octadecane) containing CuO nanoparticles was studied by Zhao et al.83 The CHARMM potential58 was used in the LAMMPS package. First of all, the system was equilibrated at 373 K in a liquid state (Fig. 22a). Then to reach the solid state, the system was cooled down to 253 K (Fig. 22b).
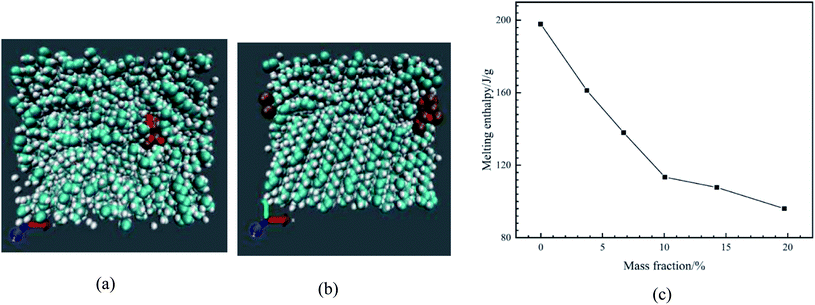 | ||
| Fig. 22 Simulated nanocomposite system in solid (a) and liquid state (b) (cyan atoms are carbon, white atoms are hydrogen, ochre atoms are copper, and red atoms are oxygen). (c) Enthalpy of melting of nano-enhanced PCMs (this figure has been adapted from ref. 83 with permission from Elsevier, copyright 2020). | ||
The phase transition enthalpy change was calculated to obtain the enthalpy of melting. Fig. 22c shows the enthalpy of melting of different molar fractions of nanoparticles in nanocomposites.
The outcomes showed that the enthalpy of melting immediately diminished with the nanoparticle mass fraction increasing. For the nano-enhanced PCM with 19.72 wt% nanoparticles, the enthalpy of melting diminished by about 51.5%. When the system was in the liquid state, a dense phase was found around the nanoparticle. Molecules around the nanoparticles were in order and density. Authors expressed that the reason for NPCM melting enthalpy reduction is due to the reduction of paraffin molecules' number under the melting process.
Tafrishi et al.84 investigated the influence of adding graphene and CNT to tetracosane paraffin (C24H50). The PCFF force field for paraffin, Tersoff potential (1989) for graphene and CNT,127 and Lenard-Jones potential for van der Waals's interaction between nanoparticles and alkanoic material were used. PACKMOL package130 was utilized to make the structures and the LAMMPS package for the simulations. Adding nanoparticles increased the density of the PCM. However, with enhancing the temperature, density decreased. The slope of density reduction for nanocomposites was less than that for pure paraffin. This was a positive point for adding nanofillers to phase change materials. Increasing the temperature influenced the arrangement of pure paraffin and the paraffin molecules became more irregular and amorphous. While the nanocomposite structures remained crystalline and regular. Furthermore, the thermal conductivity increased with adding graphene and CNT. However, the thermal capacity decreased. CNT was more effective than graphene for enhancing the thermal conductivity of paraffin. Also, thermal conductivity in the longitudinal direction of graphene and CNT was more enhanced than in the perpendicular direction.
In another research, Tafrishi et al.85 investigated the addition effects of hybrid nanoparticles to PCM. They added graphene and boron nitride nanosheets to octadecane paraffin. The utilized force fields were PCFF for paraffin, AIREBO for graphene, Tersoff for the boron nitride nanosheet, and Lennard-Jones for interactions between the nanoparticles and paraffin molecules. The structures of pure paraffin and nanocomposite PCM are shown in Fig. 23a and b, respectively.
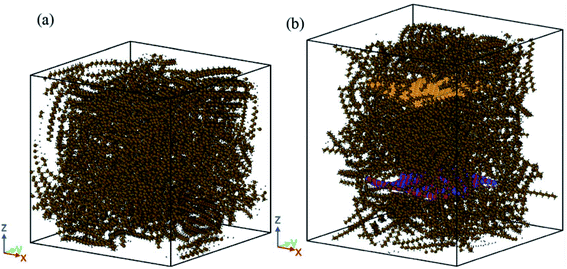 | ||
| Fig. 23 Structures of: (a) the pure n-octadecane and (b) nanocomposite PCM utilized in the simulations (this figure has been reproduced from ref. 85 with permission from Royal Society of Chemistry, copyright 2020). | ||
The addition of nanofillers increased the density of PCM. Furthermore, enhancing the temperature decreased the density. This density change (reduction) for nanocomposite was less than that for pure PCM. MSD (mean square displacement) curves of pure and nanocomposite PCM showed that the nanocomposite's melting point was 10 K higher. The diffusion coefficient increased with temperature increasing, however, this value for nanocomposite was lower than that for pure PCM. So nanofillers reduce the atoms' movements and speeds. The thermal conductivity increased by the addition of nanofillers to paraffin by about 23.0 to 27.7% near the melting point. Besides, the thermal capacity of nanocomposite with hybrid nanoparticles was higher than that for pure PCM. The addition of hybrid nanoparticles to phase change materials needs more research to obtain more results about the different thermal and mechanical properties of these nano-enhanced PCMs. Paraffin confined in slit-shaped pores of graphene sheets was investigated by Tong et al.86 The melting point of n-eicosane paraffin was increased due to the graphene interface. Paraffin molecules were arranged orderly in both solid and liquid phases. Molecules were almost parallel to graphene sheets. So, the melting was harder than solidification for this orderly arrangement of molecules.
Wang et al.87 studied n-eicosane containing four different nanoparticles: nano-silver particles, nano-copper particles, nano-aluminum particles, and nano-iron particles. Self-diffusion coefficient increased by increasing the temperature. The radial distribution function showed that adding nanoparticles increase the number of molecules around them. Also, the addition of nanoparticles resulted in a more compact system of PCM molecules. Interfacial thermal conductance between paraffin (n-octadecane) molecules and layers of boron nitride was calculated by Liu and Rao89 with the nonequilibrium MD method. Size effect, BN layer number, arrangement of paraffin molecules, and the modified defects with various functional groups were investigated. Fig. 24 shows the simulated systems.
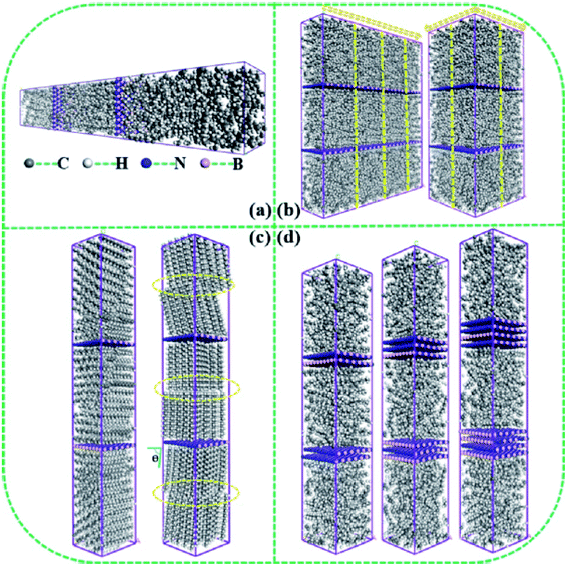 | ||
| Fig. 24 Structures of n-octadecane paraffin with boron-nitride layers used in the simulations (this figure has been reproduced from ref. 89 with permission from Elsevier, copyright 2020). | ||
Rising the temperature enhanced the interfacial thermal conductance, however, the effect of size was inconspicuous. The largest interfacial thermal conductance occurred when paraffin molecules were parallel to the boron nitride surface. Furthermore, by increasing the number of boron nitride layers, the interfacial thermal conductance was reduced. Also, modified defects with functional groups (like hydrogen atoms) enhanced the interfacial thermal conductance. Zhao et al.90 studied the effect of CuO addition to paraffin on its thermal behaviors. Fig. 25 shows a paraffin (n-octadecane) molecule and the simulated CuO nanoparticle.
 | ||
| Fig. 25 Paraffin molecule structure (left) and CuO nanoparticle structure (right) (this figure has been reproduced from ref. 90 with permission from Elsevier, copyright 2021). | ||
The addition of CuO nanoparticles enhanced the thermal conductivity of PCM, and this addition was intensified with increasing the temperature and CuO mass fraction. This enhancement was weaker at lower temperatures and high CuO loadings. PDOS calculations showed that the thermal conductivity of nanocomposite PCM diminished along the direction departed from the CuO nanoparticle. Paraffin nanolayer was observed around the CuO nanoparticle and with increasing the size of CuO, the thickness of the nanolayer enhanced. The phonon scattering decreased due to the existence of a nanolayer around the CuO. This was the internal mechanism for the thermal conductivity of nanocomposite PCM.
Yu et al.93 studied NaCl molten salt containing a CNT. The used potentials were Born–Mayer–Huggins (BMH) potential91,92 for NaCl, Airebo for CNT, and LJ potential for the interactions between the salt and CNT. The melting temperature of NaCl–CNT nanocomposite decreased in comparison with pure NaCl. The addition of CNT reduced the self-diffusion coefficient of molten salt and with enhancing CNT mass fraction, this reduction intensified. The thermal conductivity of nanocomposite was higher than that of pure molten salt. For example, 6.7 wt% CNT, increased the thermal conductivity by about 38.6%. But the melting enthalpy of nanocomposite was lower. For example, 6.7 wt% CNT, decreased the melting enthalpy by about 36.4%. Albeit the specific heat capacity was enhanced by about 5.9% by adding 6.7 wt% CNT. Jamshideasli et al.94 investigated the interfacial thermal conductance of paraffin–graphene interfaces using NEMD simulations. Investigations were carried out by imposing a heat flux in both parallel and perpendicular configurations. Solid-phase nanocomposite showed higher interfacial thermal conductance in comparison with liquid nanocomposite. By increasing the graphene layer numbers, the interfacial thermal conductance diminished.
Gu et al.95 simulated capric acid–ethylene vinyl–graphene nanocomposite. By adding graphene up to 1.8 wt% the thermal conductivity increased, but after that, for higher graphene mass fractions decreased. MSD behavior was similar to that of thermal conductivity. Li et al.96 studied the molecular dynamics simulation of n-eicosane paraffin containing functionalized graphene. Two kinds of oxygen functional groups were used on graphene surfaces with different ratios of epoxide and hydroxyl groups. With increasing the content of epoxide groups, the interfacial thermal resistance of nanocomposite PCM decreased firstly and then increased. Also, with increasing the epoxide groups content, the diffusion coefficient diminished. The melting point of nanocomposite containing functionalized graphene was lower than that for nanocomposite containing pristine graphene.
Wu et al.97 studied the effect of size and layer number of boron nitride nanosheet (BNNS) on the thermal conductivity of paraffin. C22H46 paraffin was adopted as the matrix material. The studied sizes of boron nitride nanosheets were 9, 18, and 30 nm in length with 7 nm in width. By increasing the boron nitride layer number, the thermal conductivity increased and the interfacial thermal resistance between paraffin and the BNNS was reduced. By using 5 volume percent of BNNS, containing 15 layers, the thermal conductivity increased by 6 times compared to pure PCM. It reached 1.5 W mK−1. The authors concluded that for enhancing the thermal conductivity of paraffin–BNNS nanocomposites, both the size and layer numbers of BNNS should be increased. n-Eicosane paraffin containing asphaltenes (natural aromatic polycyclic hydrocarbons) nanocomposites were studied by Glova et al.101 Asphaltenes could not improve the thermal conductivity of PCM. About this problem, the authors declared that the reason for this problem was due to the steric constraints imposed by the peripheral alkane groups, which prevented the formation of the extended ordered asphaltene aggregates. They proposed thermal cracking (dealkylation) of the asphaltene molecules by removing the lateral alkane groups from their aromatic cores. The modification method resulted in increasing the thermal conductivity by about 50–250%.
Tiantian et al.102 simulated n-octadecane near graphite layers. Paraffin molecules arrangement was more regular near the graphene layers. By raising the temperature, the self-diffusion coefficient of paraffin molecules increased. Moreover, the self-diffusion coefficient of paraffin molecules staying far away from the graphite layers was higher than that of the molecules near the graphite layers. The thermal conductivity improvement was about 2.5 times higher because of the presence of graphite layers. Gao et al.103 simulated palmitic acid (a fatty acid) containing graphene. The addition of 5 weight percent of graphene increased the thermal conductivity of palmitic acid by about 36.4 and 40.4% in solid and liquid phases respectively. Moreover, the heat capacity of composite PCM increased in comparison with pure palmitic acid.
3.4 Nano/micro-encapsulated PCM simulations
Nano/micro-encapsulated PCM MD simulations will discuss in this section. Generally, traditional phase change materials, especially organic materials have some disadvantages such as low thermal conductivity, high change in density (and so volume) in melting range, flammability, sub-cooling, etc.131 Macro, micro, and nano encapsulations of PCMs with polymer or inorganic shells are the technologies to overcome these problems.132 Rao et al.104 studied n-octadecane paraffin that was nano-encapsulated with a SiO2 shell. They studied the melting behavior of PCM with constrained and free shells. The diameter of the nano-capsule core was 4 nm while the shell's outer diameter was 5 nm. Fig. 26 shows the structures of simulated materials.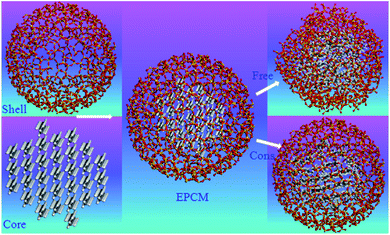 | ||
| Fig. 26 The structures of nano-encapsulated phase change material (this figure has been reproduced from ref. 104 with permission from Elsevier, copyright 2012). | ||
The used force field was COMPASS and the time step was 1 fs. The simulations were done using Materials Studio software. The constrained SiO2 shell restricted the paraffin molecules, decreased their mobility and so resulted in a lower diffusion coefficient. However, the free and soft shell resulted in better thermal properties for energy storage. In another similar investigation, Rao et al.105 studied the effect of shell thickness on the thermal properties of nano-encapsulated PCM. The capsule material was SiO2 with a core of n-octadecane paraffin. Also, a nanocomposite PCM that was n-nonadecane paraffin containing Al nanoparticles was studied. Fig. 27 displays the constructed materials. The studied thicknesses of the shell of capsules were 0.8 nm, 0.6 nm, and 0.4 nm with a core of 4.2 nm. After the nano-encapsulation process, the nanocapsules were dispersed into water. Also, they studied the Al nanoparticle diameter effect that was 1 nm, 2 nm, 3 nm, and 4 nm.
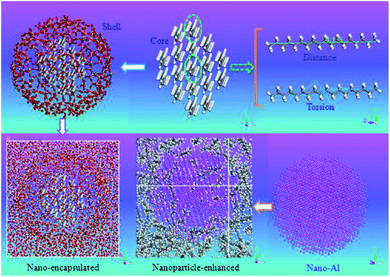 | ||
| Fig. 27 Structures of constructed nano-encapsulated and nanocomposite PCM (this figure has been reproduced from ref. 105 with permission from Elsevier, copyright 2013). | ||
Results showed that the change in shell thickness influences the radial distribution function and the diffusion coefficient. Reduced shell thickness caused a higher diffusion coefficient and higher stored thermal energy. However, the diffusion coefficient of the nanocomposite decreased by increasing the diameter of the Al nanoparticle. Nie et al.106 studied n-hexacosane paraffin encapsulation inside a (25, 25) CNT. Fig. 28 displays the simulated structure.
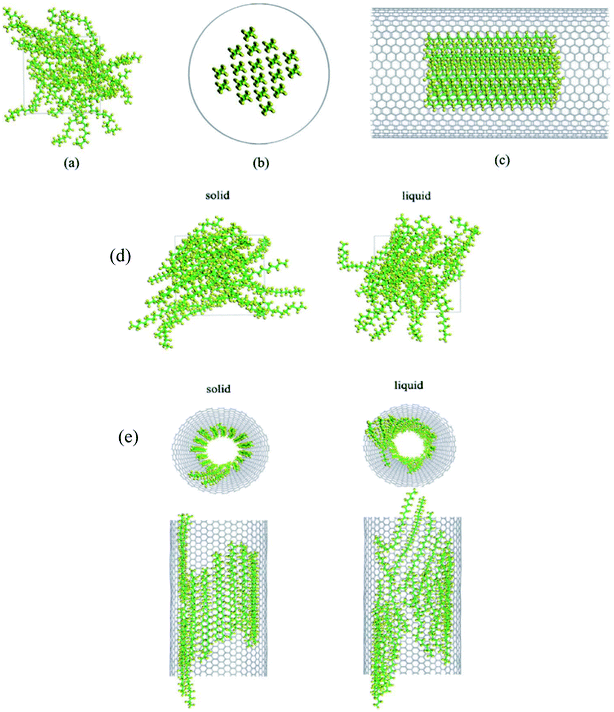 | ||
| Fig. 28 The structures of (a) paraffin (n-hexacosane), (b) the cross-sectional view of paraffin encapsulated in a CNT, and (c) the side view of nano-encapsulated PCM. The structures of (d) pure paraffin and (e) nano-encapsulated paraffin with a CNT shell (this figure has been adapted from ref. 106 with permission from Royal Society of Chemistry, copyright 2015). | ||
Fig. 28d and e shows the simulated systems after running 1000 ps at 298 K and 358 K. Pure paraffin molecules were arranged in an irregular form, while the encapsulated ones were regular in an ordered manner. Besides, the arrangement of both systems in the solid phase was more regular than that of the liquid phase. Paraffin molecules in the CNT were spaced one by one and orientated regularly along the CNT inner wall. The degree of order diminished by raising the temperature. The self-diffusion coefficient of pure paraffin was lower than that for encapsulated paraffin. So the authors concluded that by encapsulating the paraffin, its molecular mobility and so the rate of heat transfer increases.133
The microencapsulated phase change materials (MEPCM) that constitute paraffin and polystyrene were considered by Liu et al.107 n-Octacosanoic (C28H58), n-docosane (C22H46), and polystyrene were modeled for use in the simulations (Fig. 29).
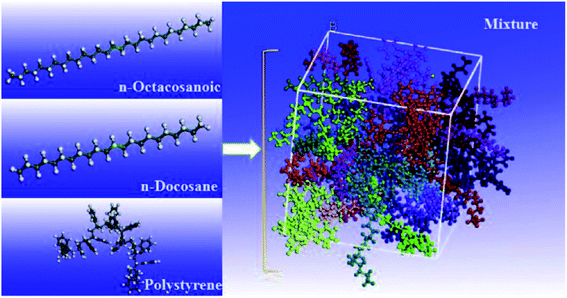 | ||
| Fig. 29 The structures of n-octacosanoic, n-docosane, polystyrene, and their mixture (this figure has been reproduced from ref. 107 with permission from Elsevier, copyright 2017). | ||
Results showed that as temperature increased, the diffusion coefficient enhanced. In the melting range, the mobility and movement of molecules are enhanced intensely. However, the presence of polystyrene restricted the weak movement and vibration of PCM molecules. NEMD method was utilized for calculating the thermal conductivity of the system. The thermal conductivity of the composite PCM was lower than that of pure paraffin. Although, by increasing the temperature, the thermal conductivity was enhanced. One of the most common shell materials for use in nano and microcapsules is polyurethane.134 Crosslinked polyurethane utilizes for its thermo-mechanical stabilized properties. Liu and Rao108 constructed four kinds of polyurethane crosslinkers for molecular dynamics studying. The trihydroxy crosslinkers were based on diphenylmethane diisocyanate including glycerol, 1,2,6-hexanetriol, triethanolamine, and trimethylolpropane. The positions of hydroxyl groups, the type of crosslinkers, and the chain geometry had a direct impact on the structural properties. Hypercrosslinked polyurethanes had higher thermal conductivity and Young's and shear modulus compared to the low-crosslinked polyurethanes.
Abbaspour et al.109 investigated the encapsulation of n-eicosane and n-octadecane paraffin in different CNTs. The effect of adding various metal nanoclusters (such as Cu, Ag, and Al) to encapsulated n-octadecane was studied. DL_POLY software was used for simulations.135 The cutoff distance was 12 Å. The CNTs were kept fixed in the simulations. OPLSAA force field was utilized for simulating paraffin molecules. The Lennard-Jones potential with the Lorentz–Berthelot combination rules136,137 was adopted to describe the interactions between paraffin and the CNT. Also, LJ potential was employed for the interactions between metal nanoclusters and paraffin. Strong metal interactions caused lower (more negative) energy in the systems which contained metal nanoclusters. Also, results indicated that a longer CNT has a lower melting point in comparison with the normal CNT system. Besides increasing the length and diameter of CNT enhanced the diffusion coefficient, while the addition of metal nanoparticles decreased the diffusion values. RDF curves exhibited significant changes in the melting point of paraffin–CNT in comparison with pure paraffin. Also, PCM nanocomposites containing metal nanoclusters had lower melting points in comparison with other systems. Al cluster system had the lowest melting point among all the simulated systems. Furthermore, melting caused decreasing in the order parameter of phase change nanocomposites.
3.5 PCM in porous media simulations
Nanoporous supporting materials have some benefits in the thermal energy storage field such as preventing liquid leakage, restricting the flow of liquid PCMs, and keeping PCMs in a macroscopic solid state during the phase change process. Also using nanoporous materials can significantly affect the PCM thermal properties such as solidification and melting enthalpy and melting and solidification point.138,139 Therefore, understanding the molecular behaviors of PCM in the nanoporous supporting materials is necessary for creating high-performance nanoporous material-based PCMs. Nano/microporous media containing PCM will be discussed in this section. A new nanocomposite PCM was introduced by D. Feng et al.110 PEG was the core and mesoporous silica MCM-41 was the matrix of this nanoporous media PCM. The inner channel surface of mesoporous silica was replaced with amino groups (–NH2) instead of hydroxyl groups (–OH). Fig. 30a exhibits the mesoporous silica MCM-41 structure. The modified MCM-41-NH2 is shown in Fig. 30b. The PEG/MCM-41 final structural composite model is displayed in Fig. 30c.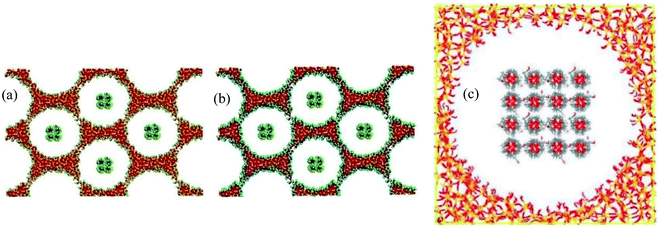 | ||
| Fig. 30 Structures of porous (a) MCM-41-OH and (b) MCM-41-NH2 (yellow atoms are silicon, red atoms are oxygen, blue atoms are nitrogen, and green atoms are hydrogen). (c) The unit cell of the PEG/MCM-41 structure (this figure has been adapted from ref. 110 with permission from Elsevier, copyright 2019). | ||
The employed force fields were CVFF, PCFF, and LJ for the interactions of MCM-41, PEG, and between MCM-41 and PEG, respectively. Materials Studio and the LAMMPS package were employed for creating the models and molecular dynamics simulations, respectively. The time step was set as 0.1 fs. Researchers declared that for controlling the loading and crystallization behavior of PEG in MCM-41, the host–guest interactions could be adjusted by surface-modifying. Li et al.111 studied the interactions between various C18 PCMs (stearic acid, octadecanol, octadecylamine, and octadecane) and methyl-modified CNTs. Fig. 31 displays the simulated structures of C18-PCM@CNT nanocomposites.
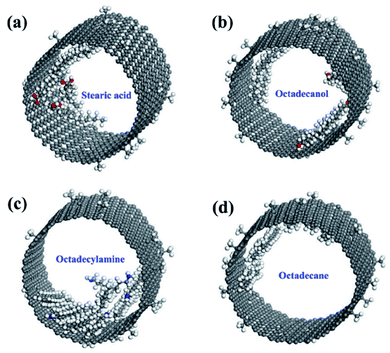 | ||
| Fig. 31 The simulated structures of C18-PCMs@CNTs nanocomposite PCMs (this figure has been reproduced from ref. 111 with permission from Elsevier, copyright 2021). | ||
The interaction energy between the CNT and stearic acid molecules was the highest, followed by octadecanol molecules, octadecylamine molecules, and octadecane molecules. The gyration radius of molecules of stearic acid and CNTs was the highest, while octadecane molecules were the lowest. Stearic acid and octadecanol diffusion coefficients were small. This was because of the weak interaction between CNTs and octadecane molecules.
4 A molecular dynamics based grouping (PCM simulation table)
Table 7 provides a complete list of existing phase change materials with the melting point as well as the heat of fusion. With a not-so-catchy look, the human comfort temperature could be defined between 18 and 24 °C. The background color of this table is related to the operating temperatures related to the melting point of these materials.As can be seen, materials such as glycerin, NaCl·Na2SO4·10H2O, Mn(NO3)2·6H2O/MnCl2·4H2O(4%), polyethylene glycol, and paraffin 17-carbons could be listed as materials that used in building energy management. The temperature of these materials is highlighted in yellow. Therefore, in terms of application, these materials will have more applications in the future. Of course, materials with much lower or higher temperatures are also used for the human environment. But these materials are more important. These materials have simple structures and can be simulated using the hybrid potentials of PCFF and Leonard-Jones using the molecular dynamics method as one of the best force fields. Albeit, as listed in Table 1, several force fields were utilized for PCMs such as Snyder force field,28 Ryckaert and Bellemans,29,31 COMPASS,41,45,51,65–67,70,78–81,87,96,102–108 PYS,43,50 Weber,47 Buckingham,49,54 NERD,53,68,71–73,86,94,97 EIM,55 GROMOS,57,60,61 CHARMM,59,83,90 OPLSAA,64,109 Universal force field (UFF),75,82,95,111 PCFF,37,76,84,85 TraPPE,77 Dreiding,89 Born–Mayer–Huggins (BMH),93 GAFF,98,101 CVFF.110 Some of the utilized force fields were placed in the simulated material box of Table 8 in {} signs.
| System | RAM | CPU | Thermal conductivity (non-equilibrium) | Thermal conductivity (equilibrium) | Phase change simulation (melt and solidifying) |
|---|---|---|---|---|---|
| System 1: PC 1 | 8 GB | Intel-8 cores with 2.3 GHz | Pure: 80–123 | Pure: 85 | Pure: — |
| Composite: 82 | Composite: 100 | Composite: 241 | |||
| System 2: cluster | 192 GB | Intel Haswell V3 28 core | Pure: — | Pure: — | Pure:— |
| Composite: 13.5 | Composite: 7.5 | Composite: — |
Therefore, they are mostly easy to study. These materials are suggested as the first suggestion for future works. In this table, structures with relatively longer chains are shown with a white background. These arrangements can also be simulated using the proposed potentials (PCFF + LJ). However, in terms of the number of particles involved in the simulation and the resulting high computational cost, they can create some challenges. Also, torsion and agglomeration of structures in these arrangements are very probable and precautions should be taken in this regard.
Since we need to take a closer look at the mentioned potentials (PCFF + LJ), here we simulate tetracosane paraffin, a relatively long-chain alkane with the chemical formula C24H50. The molar mass of this alkane is 338.66 g mol−1. As shown in Table 8, the melting point of tetracosane (PF 24 carbon) is about 50.6 °C. For a more detailed study, we have also studied the effect of adding nanomaterials to this phase change material to show that these systems can be studied with the same relatively available potential in any software. The type of nanoparticles studied in this research are graphene and carbon nanotubes.
VMD, msi2lmp, and packmol programs have been used to generate data files. The initial configuration of pure tetracosane containing 188 molecules of C24H50, containing 13![[thin space (1/6-em)]](https://www.rsc.org/images/entities/char_2009.gif) 912 atoms, was made in a box with approximately 120 × 10 × 120 (Å3) according to Fig. 32. Then we made the data file of this structure (pure tetracosane) under the PCFF force field with the msi2lmp tool which contained 13
912 atoms, was made in a box with approximately 120 × 10 × 120 (Å3) according to Fig. 32. Then we made the data file of this structure (pure tetracosane) under the PCFF force field with the msi2lmp tool which contained 13![[thin space (1/6-em)]](https://www.rsc.org/images/entities/char_2009.gif) 912 atoms, 13
912 atoms, 13![[thin space (1/6-em)]](https://www.rsc.org/images/entities/char_2009.gif) 724 atomic bonds (bands), 27
724 atomic bonds (bands), 27![[thin space (1/6-em)]](https://www.rsc.org/images/entities/char_2009.gif) 072 angles, and 38
072 angles, and 38![[thin space (1/6-em)]](https://www.rsc.org/images/entities/char_2009.gif) 916 dihedral and 18
916 dihedral and 18![[thin space (1/6-em)]](https://www.rsc.org/images/entities/char_2009.gif) 048 improper. Data files of graphene-containing tetracosane nanocomposites, as well as carbon nanotubes, were made in the same way. Each of these composite structures also had 14
048 improper. Data files of graphene-containing tetracosane nanocomposites, as well as carbon nanotubes, were made in the same way. Each of these composite structures also had 14![[thin space (1/6-em)]](https://www.rsc.org/images/entities/char_2009.gif) 500 atoms. The percentage of nano-additives in the resulting composites was 10% by weight.
500 atoms. The percentage of nano-additives in the resulting composites was 10% by weight.
 | ||
| Fig. 32 Initial configuration of a box containing 188 molecules of tetracosane (left), tetracosane + graphene (middle), and tetracosane + carbon nanotubes (right). | ||
4.1 PCFF force field
The PCFF force field was used for interactions of alkane (paraffin tetracosane).33–36 The Tersoff potential was used to describe the interaction of carbon atoms with each other in graphene and carbon nanotubes.127 To calculate the forces between nanoparticles and alkane, the Lenard-Jones potential was used and its coefficients were extracted from the ref. 140. The Lorentz–Bertolet mix law141 was used to determine the Leonard-Jones parameters between tetracosane and carbon atoms of nanomaterials. The PCFF force field is described in more detail here.The functional form of the PCFF force field used is as follows (similar to the CFF force field):
| Etotal = ∑Eb + ∑Ea + ∑Et +∑Eo + ∑Ebb′ + ∑Eba + ∑Ebt + ∑Eaa′ + ∑Eat + ∑Eaa′t + ∑Evdw + ∑Eelec | (7) |
 | (8) |
 | (9) |
 | (10) |
 | (11) |
 | (12) |
 | (13) |
 | (14) |
 | (15) |
 | (16) |
 | (17) |
 | (18) |
 | (19) |
These functions can be divided into two main parts: valence and cross-coupling terms. Valence terms represent internal coordinates that include a bond (b), angle (θ), torsion angle (Ø), and off-plane angle (χ), and cross-coupling terms include combinations of two or three internal coordinates. Cross-coupling terms are important because they are used to predict system vibrational frequencies and structural changes. Fig. 33 shows paraffin–graphene and paraffin–carbon nanotube composite structures after melting and freezing cycles. Specifically, in both cases of adding graphene and nanotubes, the model was stable after the melting–freezing process.
 | ||
| Fig. 33 Paraffin–graphene (left) and paraffin–carbon nanotube (right) composite structures after melting and freezing cycles. | ||
4.2 Results obtained from the model used
As a small portion of the exciting results, the thermal capacity diagram in terms of temperature, diffusion coefficient, and radial distribution function for pure paraffin, paraffin–graphene, and paraffin–carbon nanotubes composites were plotted and compared in Fig. 34.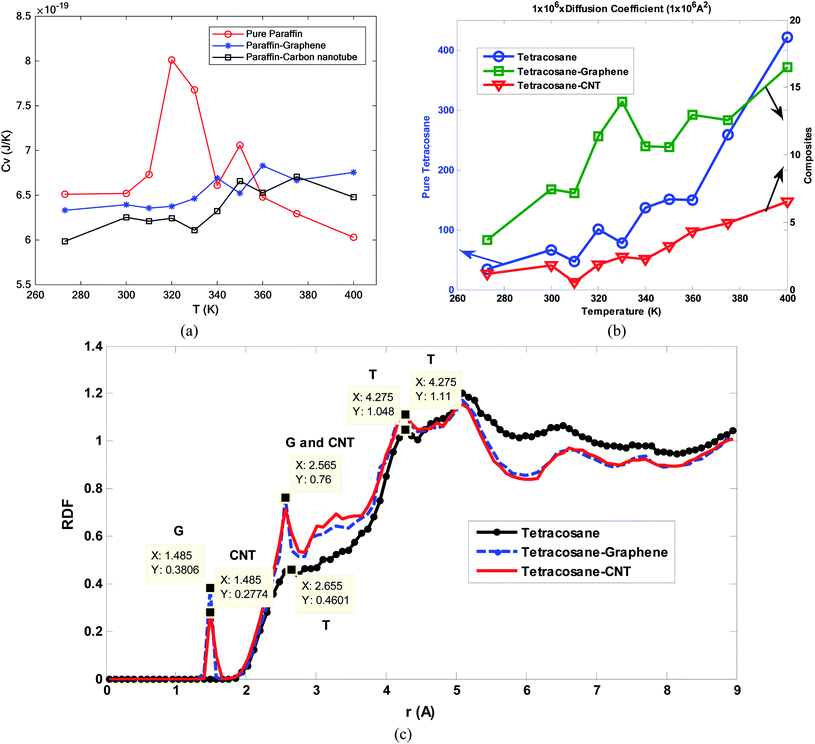 | ||
| Fig. 34 The thermal capacity diagram in terms of temperature, diffusion coefficient, and radial distribution function for pure paraffin, paraffin–graphene, and paraffin–carbon nanotubes composites. | ||
To evaluate the computational cost of the potential introduced, the specifications of the systems are used and the time spent are listed in Table 8. As distinguished, according to the ability of the systems used, the time spent on simulating the problem is low, and this is an acceptable cost range PCFF potential.
5 Research gaps
The number of publications on molecular dynamics of phase change materials is shown in Fig. 35. Although the number of published research was increasing in recent years, the researches number in this area is still very low. Most of these researches were about molecular dynamics simulation of paraffin (Fig. 36). Molecular dynamics study of other phase change materials is still a research gap.Some other research gaps are as follows: addition of hybrid nanofillers to PCMs, porous media, new superconductive materials, new force fields, mass fraction influence, the combination of different types of PCMs together, research on the water as a good PCM with high latent heat, the influence of spacing of nanofillers in PCMs (like their shapes or their distance from each other), nano-encapsulated PCMs, nanoporous fillers and matrices, the effect of other atoms doped or adhesive to nanofillers, effects of the geometry of nanofillers and nanoporous matrices, effects of the distance of nanofillers (such as multilayer graphene with or without distance between layers or multiwalled CNTs, etc.), designing new nano-additives and new porous media or using new ones for PCMs or mixture of PCMs to acquire better thermo-physical properties, etc.
6 Conclusion
Phase change materials are used for thermal energy storage. Molecular dynamics simulations can reveal the thermal transport mechanisms of PCMs and this can be useful for producing better PCMs. In this paper, molecular dynamics studies of PCMs are described and thermal transport mechanisms are focused to understand the behaviors of the materials on the nanoscale. MD simulations of pure PCMs, mixed PCMs, PCMs containing nanofillers, nano-encapsulated PCMs, and PCMs in nano/microporous materials were investigated and the results are discussed. The thermal conductivity of nano-enhanced PCMs was one of the most important studied features. This can be increased on a nano-scale by the orientation of molecules (in molecular PCM systems). Thermal capacity, especially in the phase change temperature range, is another important characteristic that should be investigated in more investigations. Some of the used methods for enhancing thermal conductivity resulted in reduced thermal capacity. More investigations are required for better understanding and designing new nano-enhanced phase change materials with better thermal energy storage characteristics. A molecular dynamics-based grouping (PCM simulation table) was presented that is very useful for the future roadmap of PCM's simulation. In the end, the PCFF force field was presented in detail and a case problem was studied for more clarity.Data availability
The data that support the findings of this study are available on request from the corresponding author.Conflicts of interest
There are no conflicts to declare.References
- K. Kalyanasundaram and M. Grätzel, J. Mater. Chem., 2012, 22, 24190–24194 RSC.
- S. M. Hasnain, Energy Convers. Manage., 1998, 39, 1127–1138 CrossRef CAS.
- A. Sharma, V. V. Tyagi, C. R. Chen and D. Buddhi, Renewable Sustainable Energy Rev., 2009, 13, 318–345 CrossRef CAS.
- L. M. Bal, S. Satya and S. N. Naik, Renewable Sustainable Energy Rev., 2010, 14, 2298–2314 CrossRef.
- K. Pielichowska and K. Pielichowski, Prog. Mater. Sci., 2014, 65, 67–123 CrossRef CAS.
- M. M. Farid, A. M. Khudhair, S. A. K. Razack and S. Al-Hallaj, Energy Convers. Manage., 2004, 45, 1597–1615 CrossRef CAS.
- H. Akeiber, P. Nejat, M. Z. A. Majid, M. A. Wahid, F. Jomehzadeh, I. Zeynali Famileh, J. K. Calautit, B. R. Hughes and S. A. Zaki, Renewable Sustainable Energy Rev., 2016, 60, 1470–1497 CrossRef.
- B. Zalba, J. M. Marín, L. F. Cabeza and H. Mehling, Appl. Therm. Eng., 2003, 23, 251–283 CrossRef CAS.
- R. Parameshwaran and S. Kalaiselvam, in Eco-Efficient Materials for Mitigating Building Cooling Needs, ed. F. Pacheco-Torgal, J. A. Labrincha, L. F. Cabeza and C. G. Granqvist, Woodhead Publishing, Oxford, 2015, pp. 401–439, DOI:10.1016/B978-1-78242-380-5.00015-7.
- A. Kardam, S. S. Narayanan, N. Bhardwaj, D. Madhwal, P. Shukla, A. Verma and V. K. Jain, RSC Adv., 2015, 5, 56541–56548 RSC.
- X. Fang, L.-W. Fan, Q. Ding, X. Wang, X.-L. Yao, J.-F. Hou, Z.-T. Yu, G.-H. Cheng, Y.-C. Hu and K.-F. Cen, Energy Fuels, 2013, 27, 4041–4047 CrossRef CAS.
- S. Harish, D. Orejon, Y. Takata and M. Kohno, Appl. Therm. Eng., 2015, 80, 205–211 CrossRef CAS.
- M. Mehrali, S. Tahan Latibari, M. Mehrali, T. M. I. Mahlia, E. Sadeghinezhad and H. S. C. Metselaar, Appl. Energy, 2014, 135, 339–349 CrossRef CAS.
- H. Ji, D. P. Sellan, M. T. Pettes, X. Kong, J. Ji, L. Shi and R. S. Ruoff, Energy Environ. Sci., 2014, 7, 1185–1192 RSC.
- G.-Q. Qi, C.-L. Liang, R.-Y. Bao, Z.-Y. Liu, W. Yang, B.-H. Xie and M.-B. Yang, Sol. Energy Mater. Sol. Cells, 2014, 123, 171–177 CrossRef CAS.
- S. Wu, H. Wang, S. Xiao and D. Zhu, J. Therm. Anal. Calorim., 2011, 110, 1127–1131 CrossRef.
- R. Parameshwaran, K. Deepak, R. Saravanan and S. Kalaiselvam, Appl. Energy, 2014, 115, 320–330 CrossRef CAS.
- R. Parameshwaran, P. Dhamodharan and S. Kalaiselvam, Thermochim. Acta, 2013, 573, 106–120 CrossRef CAS.
- N. Metropolis, A. W. Rosenbluth, M. N. Rosenbluth, A. H. Teller and E. Teller, J. Chem. Phys., 1953, 21, 1087–1092 CrossRef CAS.
- B. J. Alder and T. E. Wainwright, J. Chem. Phys., 1957, 27, 1208–1209 CrossRef CAS.
- M. Micciarelli, B. F. E. Curchod, S. Bonella, C. Altucci, M. Valadan, U. Rothlisberger and I. Tavernelli, J. Phys. Chem. A, 2017, 121, 3909–3917 CrossRef CAS PubMed.
- M. Valadan, E. Pomarico, B. Della Ventura, F. Gesuele, R. Velotta, A. Amoresano, G. Pinto, M. Chergui, R. Improta and C. Altucci, Phys. Chem. Chem. Phys., 2019, 21, 26301–26310 RSC.
- M. Micciarelli, M. Valadan, B. Della Ventura, G. Di Fabio, L. De Napoli, S. Bonella, U. Röthlisberger, I. Tavernelli, C. Altucci and R. Velotta, J. Phys. Chem. B, 2014, 118, 4983–4992 CrossRef CAS PubMed.
- M. A. González, JDN, 2011, 12, 169–200 CrossRef.
- P. K. Schelling, S. R. Phillpot and P. Keblinski, Phys. Rev. B: Condens. Matter Mater. Phys., 2002, 65, 144306 CrossRef.
- D. P. Sellan, E. S. Landry, J. E. Turney, A. J. H. McGaughey and C. H. Amon, Phys. Rev. B: Condens. Matter Mater. Phys., 2010, 81, 214305 CrossRef.
- R. G. Snyder, J. Chem. Phys., 1967, 47, 1316–1360 CrossRef CAS.
- G. Zerbi, R. Magni, M. Gussoni, K. H. Moritz, A. Bigotto and S. Dirlikov, J. Chem. Phys., 1981, 75, 3175–3194 CrossRef CAS.
- J. P. Ryckaert and A. Bellemans, Chem. Phys. Lett., 1975, 30, 123–125 CrossRef CAS.
- L. S. Tee, S. Gotoh and W. E. Stewart, Ind. Eng. Chem. Fundam., 1966, 5, 356–363 CrossRef.
- K. Esselink, P. A. J. Hilbers and B. W. H. v. Beest, J. Chem. Phys., 1994, 101, 9033–9041 CrossRef CAS.
- T. Shimizu and T. Yamamoto, J. Chem. Phys., 2000, 113, 3351–3359 CrossRef CAS.
- H. Sun, J. Phys. Chem. B, 1998, 102, 7338–7364 CrossRef CAS.
- H. Sun, Macromolecules, 1995, 28, 701–712 CrossRef CAS.
- H. Sun, S. J. Mumby, J. R. Maple and A. T. Hagler, J. Am. Chem. Soc., 1994, 116, 2978–2987 CrossRef CAS.
- H. Sun, P. Ren and J. R. Fried, Comput. Theor. Polym. Sci., 1998, 8, 229–246 CrossRef CAS.
- Y. Tsuchiya, H. Hasegawa and T. Iwatsubo, J. Chem. Phys., 2001, 114, 2484–2488 CrossRef CAS.
- D. Rigby and R. J. Roe, J. Chem. Phys., 1987, 87, 7285–7292 CrossRef CAS.
- J. G. Harris, J. Phys. Chem., 1992, 96, 5077–5086 CrossRef CAS.
- H. Z. Li and T. Yamamoto, J. Chem. Phys., 2001, 114, 5774–5780 CrossRef.
- I.-E. Mavrantza, D. Prentzas, V. G. Mavrantzas and C. Galiotis, J. Chem. Phys., 2001, 115, 3937–3950 CrossRef CAS.
- W. Paul, D. Y. Yoon and G. D. Smith, J. Chem. Phys., 1995, 103, 1702–1709 CrossRef CAS.
- N. Waheed, M. S. Lavine and G. C. Rutledge, J. Chem. Phys., 2002, 116, 2301–2309 CrossRef CAS.
- W. Smith and T. Forester, DL_POLY_2.0: a general-purpose parallel molecular dynamics simulation package, Warrington WA4 4AD, UK, 1996 Search PubMed.
- A. Marbeuf and R. Brown, J. Chem. Phys., 2006, 124, 054901 CrossRef PubMed.
- T. A. Weber, J. Chem. Phys., 1978, 69, 2347–2354 CrossRef CAS.
- A. Diama, B. Matthies, K. W. Herwig, F. Y. Hansen, L. Criswell, H. Mo, M. Bai and H. Taub, J. Chem. Phys., 2009, 131, 084707 CrossRef CAS PubMed.
- S. Plimpton, J. Comput. Phys., 1995, 117, 1–19 CrossRef CAS.
- S. Jayaraman, A. P. Thompson, O. A. von Lilienfeld and E. J. Maginn, Ind. Eng. Chem. Res., 2010, 49, 559–571 CrossRef CAS.
- P. Yi and G. C. Rutledge, J. Chem. Phys., 2011, 135, 024903 CrossRef PubMed.
- Z. Rao, S. Wang and Y. Zhang, Phase Transitions, 2012, 85, 400–408 CrossRef CAS.
- S. K. Nath, F. A. Escobedo and J. J. de Pablo, J. Chem. Phys., 1998, 108, 9905–9911 CrossRef CAS.
- R. Rastgarkafshgarkolaei, Y. Zeng and J. M. Khodadadi, J. Appl. Phys., 2016, 119, 205107 CrossRef.
- H. Ni, J. Wu, Z. Sun, G. Lu and J. Yu, Renewable Energy, 2019, 136, 955–967 CrossRef CAS.
- X. Cui, J. Zhu, H. Xu, X. Cheng and W. Zhou, Int. J. Mod. Phys. B, 2019, 33, 1950088 CrossRef CAS.
- C. Oostenbrink, A. Villa, A. E. Mark and W. F. Van Gunsteren, J. Comput. Chem., 2004, 25, 1656–1676 CrossRef CAS PubMed.
- B. Feng, J. Tu, J.-W. Sun, L.-W. Fan and Y. Zeng, Int. J. Heat Mass Transfer, 2019, 141, 789–798 CrossRef CAS.
- A. D. MacKerell, D. Bashford, M. Bellott, R. L. Dunbrack, J. D. Evanseck, M. J. Field, S. Fischer, J. Gao, H. Guo, S. Ha, D. Joseph-McCarthy, L. Kuchnir, K. Kuczera, F. T. K. Lau, C. Mattos, S. Michnick, T. Ngo, D. T. Nguyen, B. Prodhom, W. E. Reiher, B. Roux, M. Schlenkrich, J. C. Smith, R. Stote, J. Straub, M. Watanabe, J. Wiórkiewicz-Kuczera, D. Yin and M. Karplus, J. Phys. Chem. B, 1998, 102, 3586–3616 CrossRef CAS PubMed.
- Y. Feng, H. Zou, L. Qiu and X. Zhang, Comput. Mater. Sci., 2019, 158, 14–19 CrossRef CAS.
- B. Feng, L.-W. Fan and Y. Zeng, Mater. Today Commun., 2020, 25, 101335 CrossRef CAS.
- B. Feng, L.-W. Fan and Y. Zeng, J. Heat Transfer, 2020, 142, 031401 CrossRef CAS.
- W. L. Jorgensen, D. S. Maxwell and J. Tirado-Rives, J. Am. Chem. Soc., 1996, 118, 11225–11236 CrossRef CAS.
- D. Tobias, K. Tu and M. Klein, J. Chim. Phys., 1997, 94, 1482–1502 CrossRef CAS.
- N. Wentzel and S. T. Milner, J. Chem. Phys., 2010, 132, 044901 CrossRef PubMed.
- Z. Rao, S. Wang, M. Wu, Y. Zhang and F. Li, Energy Convers. Manage., 2012, 64, 152–156 CrossRef CAS.
- Z. Rao, S. Wang and F. Peng, Int. J. Heat Mass Transfer, 2013, 64, 581–589 CrossRef CAS.
- Y. Wang, Z. Chen and X. Ling, Appl. Therm. Eng., 2016, 98, 835–840 CrossRef CAS.
- Y. Zeng and J. M. Khodadadi, Energy Fuels, 2018, 32, 11253–11260 CrossRef CAS.
- S. J. Stuart, A. B. Tutein and J. A. Harrison, J. Chem. Phys., 2000, 112, 6472–6486 CrossRef CAS.
- T. Luo and J. R. Lloyd, Adv. Funct. Mater., 2012, 22, 2495–2502 CrossRef CAS.
- H. Babaei, P. Keblinski and J. M. Khodadadi, Int. J. Heat Mass Transfer, 2013, 58, 209–216 CrossRef CAS.
- H. Babaei, P. Keblinski and J. M. Khodadadi, Phys. Lett. A, 2013, 377, 1358–1361 CrossRef CAS.
- H. Babaei, P. Keblinski and J. Khodadadi, J. Appl. Phys., 2013, 113, 084302 CrossRef.
- A. K. Rappe, C. J. Casewit, K. S. Colwell, W. A. Goddard and W. M. Skiff, J. Am. Chem. Soc., 1992, 114, 10024–10035 CrossRef CAS.
- Y.-R. Huang, P.-H. Chuang and C.-L. Chen, Int. J. Heat Mass Transfer, 2015, 91, 45–51 CrossRef CAS.
- Y. Wang, C. Yang, Y. Cheng and Y. Zhang, RSC Adv., 2015, 5, 82638–82644 RSC.
- C. Lin and Z. Rao, Appl. Therm. Eng., 2017, 110, 1411–1419 CrossRef CAS.
- Q. Li, Y. Yu, Y. Liu, C. Liu and L. Lin, Materials, 2017, 10, 38 CrossRef PubMed.
- X. Liu and Z. Rao, J. Energy Inst., 2019, 92(1), 161–176 CrossRef CAS.
- P. Yuan, P. Zhang, T. Liang, S. Zhai and D. Yang, J. Mater. Sci., 2019, 54, 1488–1501 CrossRef CAS.
- Y. Yu, Y. Tao and Y.-L. He, Appl. Therm. Eng., 2020, 166, 114628 CrossRef CAS.
- M. Zhang, C. Wang, A. Luo, Z. Liu and X. Zhang, Appl. Therm. Eng., 2020, 166, 114639 CrossRef CAS.
- C. Y. Zhao, Y. B. Tao and Y. S. Yu, Int. J. Heat Mass Transfer, 2020, 150, 119382 CrossRef CAS.
- H. Tafrishi, S. Sadeghzadeh, R. Ahmadi, F. Molaei, F. Yousefi and H. Hassanloo, J. Energy Storage, 2020, 29, 101321 CrossRef.
- H. Tafrishi, S. Sadeghzadeh, F. Molaei and H. Siavoshi, RSC Adv., 2020, 10, 14785–14793 RSC.
- X. Tong, P. Yang, M. Zeng and Q. Wang, Langmuir, 2020, 36, 8422–8434 CrossRef CAS PubMed.
- X. Wang, L. Sun, X. Zhang, S. Zhang, J. Wang and Y. Zhang, J. Mol. Liq., 2020, 309, 113162 CrossRef CAS.
- S. L. Mayo, B. D. Olafson and W. A. Goddard, J. Phys. Chem., 1990, 94, 8897–8909 CrossRef CAS.
- X. Liu and Z. Rao, J. Energy Storage, 2020, 32, 101860 CrossRef.
- C. Y. Zhao, Y. B. Tao and Y. S. Yu, J. Mol. Liq., 2021, 329, 115448 CrossRef CAS.
- F. G. Fumi and M. P. Tosi, J. Phys. Chem. Solids, 1964, 25, 31–43 CrossRef CAS.
- M. P. Tosi and F. G. Fumi, J. Phys. Chem. Solids, 1964, 25, 45–52 CrossRef CAS.
- Y. Yu, C. Zhao, Y. Tao, X. Chen and Y.-L. He, Appl. Energy, 2021, 290, 116799 CrossRef CAS.
- D. Jamshideasli, H. Babaei, P. Keblinski and J. M. Khodadadi, J. Energy Storage, 2021, 37, 102469 CrossRef.
- Y. Gu, L. Jiang, W. Jin, Z. Wei, X. Liu, M. Guo, K. Xia and L. Chen, J. Ind. Eng. Chem., 2021, 99, 256–263 CrossRef CAS.
- Y. Li, G. Yue, W. C. Tie, Q. Z. Zhu and T. Yan, Int. J. Heat Mass Transfer, 2021, 177, 121533 CrossRef CAS.
- S. Wu, Q. Chen, D. Chen, D. Peng and Y. Ma, J. Energy Storage, 2021, 41, 102931 CrossRef.
- J. Wang, R. M. Wolf, J. W. Caldwell, P. A. Kollman and D. A. Case, J. Comput. Chem., 2014, 25, 1157–1174 CrossRef PubMed.
- J. B. Klauda, R. M. Venable, J. A. Freites, J. W. O'Connor, D. J. Tobias, C. Mondragon-Ramirez, I. Vorobyov, A. D. MacKerell and R. W. Pastor, J. Phys. Chem. B, 2010, 114, 7830–7843 CrossRef CAS PubMed.
- J. B. Klauda, B. R. Brooks, A. D. MacKerell, R. M. Venable and R. W. Pastor, J. Phys. Chem. B, 2005, 109, 5300–5311 CrossRef CAS PubMed.
- A. D. Glova, V. M. Nazarychev, S. V. Larin, A. V. Lyulin, S. V. Lyulin and A. A. Gurtovenko, J. Mol. Liq., 2021, 117112, DOI:10.1016/j.molliq.2021.117112.
- T. Zhang, B. Xu and Z. Chen, J. Therm. Sci., 2021, 30, 1789–1802 CrossRef CAS.
- L. Gao, X. Fan, S. Zhang, D. Che and B. Sun, Thermochim. Acta, 2022, 707, 179095 CrossRef CAS.
- Z. Rao, S. Wang and F. Peng, Appl. Energy, 2012, 100, 303–308 CrossRef CAS.
- Z. Rao, S. Wang and F. Peng, Int. J. Heat Mass Transfer, 2013, 66, 575–584 CrossRef CAS.
- C. Nie, X. Tong, S. Wu, S. Gong and D. Peng, RSC Adv., 2015, 5, 92812–92817 RSC.
- X. Liu, C. Lin and Z. Rao, J. Energy Inst., 2017, 90, 534–543 CrossRef CAS.
- X. Liu and Z. Rao, Int. J. Heat Mass Transfer, 2019, 132, 362–374 CrossRef CAS.
- M. Abbaspour, M. N. Jorabchi, H. Akbarzadeh and A. Ebrahimnejad, RSC Adv., 2021, 11, 24594–24606 RSC.
- D. Feng, Y. Feng, P. Li, Y. Zang, C. Wang and X. Zhang, Microporous Mesoporous Mater., 2020, 292, 109756 CrossRef CAS.
- A. Li, G. Hai, P. Cheng, X. Chen, X. Zhang, Y. Jiang, Y. Gao, M. Huang and Y. Wan, Ceram. Int., 2021, 47, 23564–23570 CrossRef CAS.
- H. J. C. Berendsen, J. P. M. Postma, W. F. van Gunsteren, A. DiNola and J. R. Haak, J. Chem. Phys., 1984, 81, 3684–3690 CrossRef CAS.
- R. M. Lynden-Bell, J. S. Van Duijneveldt and D. Frenkel, Mol. Phys., 1993, 80, 801–814 CrossRef CAS.
- W. G. Hoover, Phys. Rev. A: At., Mol., Opt. Phys., 1985, 31, 1695–1697 CrossRef PubMed.
- H. C. Andersen, J. Chem. Phys., 1980, 72, 2384–2393 CrossRef CAS.
- V. A. Harmandaris, V. G. Mavrantzas and D. N. Theodorou, Macromolecules, 1998, 31, 7934–7943 CrossRef CAS.
- Accelrys Software Inc., Discovery Studio Modeling Environment, San Diego, CA, 2009 Search PubMed.
- L. Verlet, Phys. Rev., 1967, 159, 98–103 CrossRef CAS.
- M. Tuckerman, B. J. Berne and G. J. Martyna, J. Chem. Phys., 1992, 97, 1990–2001 CrossRef CAS.
- D. K. Benson, R. W. Burrows and J. D. Webb, Sol. Energy Mater., 1986, 13, 133–152 CrossRef CAS.
- J. Font, J. Muntasell, J. Navarro, J. L. Tamarit and J. Lloveras, Sol. Energy Mater., 1987, 15, 299–310 CrossRef CAS.
- G. Diarce, I. Gandarias, Á. Campos-Celador, A. García-Romero and U. J. Griesser, Sol. Energy Mater. Sol. Cells, 2015, 134, 215–226 CrossRef CAS.
- C.-G. Tao, H.-J. Feng, J. Zhou, L.-H. Lv and X.-H. Lu, Acta Phys.-Chim. Sin., 2009, 25, 1373–1378 CAS.
- C. F. Carlborg, J. Shiomi and S. Maruyama, Phys. Rev. B: Condens. Matter Mater. Phys., 2008, 78, 205406 CrossRef.
- D. Rigby and R. J. Roe, J. Chem. Phys., 1988, 89, 5280–5290 CrossRef CAS.
- D. W. Brenner, O. A. Shenderova, J. A. Harrison, S. J. Stuart, B. Ni and S. B. Sinnott, J. Phys.: Condens. Matter, 2002, 14, 783–802 CrossRef CAS.
- J. Tersoff, Phys. Rev. B: Condens. Matter Mater. Phys., 1989, 39, 5566–5568 CrossRef PubMed.
- K. Matsunaga, C. Fisher and H. Matsubara, Jpn. J. Appl. Phys., 2000, 39, L48–L51 CrossRef CAS.
- M. C. Payne, M. P. Teter, D. C. Allan, T. A. Arias and J. D. Joannopoulos, Rev. Mod. Phys., 1992, 64, 1045–1097 CrossRef CAS.
- L. Martínez, R. Andrade, E. G. Birgin and J. M. Martínez, J. Comput. Chem., 2009, 30, 2157–2164 CrossRef PubMed.
- C. Y. Zhao and G. H. Zhang, Renewable Sustainable Energy Rev., 2011, 15, 3813–3832 CrossRef CAS.
- V. V. Tyagi, S. C. Kaushik, S. K. Tyagi and T. Akiyama, Renewable Sustainable Energy Rev., 2011, 15, 1373–1391 CrossRef CAS.
- K. S. Hwang, S. P. Jang and S. U. S. Choi, Int. J. Heat Mass Transfer, 2009, 52, 193–199 CrossRef CAS.
- A. Schoth, K. Landfester and R. Muñoz-Espí, Langmuir, 2015, 31, 3784–3788 CrossRef CAS PubMed.
- I. T. Todorov, W. Smith, K. Trachenko and M. T. Dove, J. Mater. Chem., 2006, 16, 1911–1918 RSC.
- M. Neek-Amal, R. Asgari and M. R. Rahimi Tabar, Nanotechnology, 2009, 20, 135602 CrossRef CAS PubMed.
- K. Malek and M. Sahimi, J. Chem. Phys., 2010, 132, 014310 CrossRef PubMed.
- H. Gao, J. Wang, X. Chen, G. Wang, X. Huang, A. Li and W. Dong, Nano Energy, 2018, 53, 769–797 CrossRef CAS.
- D. Feng, Y. Feng, L. Qiu, P. Li, Y. Zang, H. Zou, Z. Yu and X. Zhang, Renewable Sustainable Energy Rev., 2019, 109, 578–605 CrossRef CAS.
- J. C. Grossman, N. Ferralis, D. Cohen-Tanugi and S. H. Dave, Materials and methods including nanoporous materials for water filtration, US Pat., 15/634,767, 2014 Search PubMed.
- M. P. Allen and D. J. Tildesley, Computer simulation of liquids, Oxford University Press, 2017 Search PubMed.
Footnotes |
| † Body-centered tetragonal. |
| ‡ Face-centered cubic. |
| § Radial distribution function. |
| This journal is © The Royal Society of Chemistry 2022 |

