 Open Access Article
Hierarchical hollow-tubular porous carbon microtubes prepared via a mild method for supercapacitor electrode materials with high volumetric capacitance
Xuan Xiaoa,
Lei Songa,
Qianli Wanga,
Zhicheng Wanga,
Hongyan Wanga,
Juncai Chua,
Jianmin Liua,
Xinru Liua,
Zhentao Bian *ab and
Xuanxuan Zhaoc
aAnhui Key Laboratory of Spin Electron and Nanomaterials (Cultivating Base), Bio-based Functional Materials and Composite Technology Research Center, School of Chemistry and Chemical Engineering, Suzhou University, Suzhou 234000, PR China. E-mail: zhentaobian@ahszu.edu.cn
bChemical Technology, Institute of Chemical Technology, China University of Mining &Technology, XuZhou, Jiangsu 221116, PR China
cSuzhou Yifan Pharmaceutical Co., Ltd., Suzhou 234000, PR China
First published on 31st May 2022
Abstract
In this paper, hollow-tubular porous carbons were synthesized from abundant biomass Cycas fluff (CF) through simple carbonization followed by an NaHCO3 mild activation process. After activation, the tubular structure of the CF was retained, and a hierarchical structure of micropores, mesopores and macropores was formed. When the optimal mass ratio of NaHCO3/CF is 2, the obtained porous carbon CF-HPC-2 sample has a large specific surface area (SSA) of 516.70 m2 g−1 in Brunauer–Emmett–Teller (BET) tests and a total pore volume of 0.33 cm3 g−1. The C, O, N and S contents of CF-HPC-2 were tested as 91.77 at%, 4.09 at%, 3.54 at%, and 0.6 at%, respectively, by elemental analysis. Remarkably, CF-HPC-2 exhibits a high volume capacitance (349.1 F cm−3 at 1 A g−1) as well as a higher rate capability than other biomass carbon materials (289.1 F cm−3 at 10 A g−1). Additionally, the energy density of the CF-HPC-2 based symmetric supercapacitor in 2 M Na2SO4 electrolyte at 20 kW kg−1 is 27.72 W h kg−1. The particular hollow tubular morphology and activated porous structure determine the excellent electrochemical performance of the material. Hence, this synthetic method provides a new way of storing energy for porous carbon as high volumetric capacitance supercapacitor materials.
1 Introduction
For the past few years, the risks associated with global warming and the continued increase in CO2 emissions caused by the massive emission of greenhouse gases from the burning of fossil fuels have attracted worldwide attention.1–3 A large number of new energy sources are being developed, resulting in a growing demand for eco-friendly, efficient, and low-cost energy storage technologies.4–8 However, compared with traditional capacitors, supercapacitors are a type of electrochemical energy storage equipment associated with low cost, high power density, stable cycling life, and good operational stability.9,10 However, supercapacitors have the problems of high cost and poor electrical conductivity in commercial applications. In order to solve this problem, the development of high-efficiency carbon electrode materials that exhibit high energy has been researched.11,12Currently, the commonly used electrode materials for supercapacitors mainly include porous carbon, carbon nanotubes, graphene, and other carbon-based materials.13,14 Among them, porous carbon has the advantages of a hierarchical porous structure, a high surface area and good cycling stability.15,16 As far as we know, constructing a hierarchical porous structure significantly improves the electrochemical performance of porous carbon.17,18 The well-defined hierarchical porous structure not only provides efficient and stable channels for rapid diffusion/transfer, but also offers a higher specific surface area (SSA).19,20 Besides this, introducing heteroatoms (such as N, S) to the framework and surface of porous carbon can produce additional pseudo-capacitance,21–23 as well as facilitate conductivity and surface wettability.24–26 Research has shown that porous carbon that has been co-doped exhibits better electrochemical properties due to the synergistic effect of the self-doped heteroatoms.27,28 Various methods have been used for preparing porous carbon materials, including the catalytic activation of biowaste, chemical vapor deposition, etc.29,30 Nevertheless, the cumbersome multi-step procedures, complex process conditions and expensive precursor consumption hinder the large-scale production of porous carbon.31
The raw materials for the production of porous carbon are coal32 and asphalt,33 but considering the excessive consumption of fossil fuels and some environmental problems, biomass as a raw material has entered the field of vision of researchers. Because of its advantages of low cost, being a complete source, environmental friendliness and many self-doped heteroatoms, the preparation of porous carbon using biomass as a precursor is becoming increasingly more popular.34 Jiang et al.16 used natural cotton fiber as a raw material and coated it with NaH2PO4 to successfully prepare a hollow tubular porous material via simple carbonization and KOH–KNO3 activation. Zhou et al. prepared a hollow tubular structure with corn silk as a raw material via a one-step carbonization method. After KOH activation, a hierarchical porous structure with a high surface area and heteroatom doped content was obtained.
Chemical reagents promote dehydration and the structural reorganization of the pores of carbonaceous materials. Various chemical reagents can be used as activators, namely salts of alkali metals (AlCl3, ZnCl2),35 acids (H3PO4,36 H2SO4), or bases (KOH, NaOH, K2CO3, Na2CO3).37–39 Zinc chloride is the main chemical activator used on a large scale. It has now been abandoned due to environmental problems linked to the toxicity of residual zinc-derived compounds. Magnesium chloride produces toxic gases that are harmful to the human body and the environment during experiments. Phosphoric acid (H3PO4) easily generates various forms of phosphate and phosphite at high temperature, so that the ash content of activated carbon increases. Compared with H3PO4, KOH is highly corrosive to instruments. Therefore, KOH is rarely used to synthesize porous carbon in industrial production. NaHCO3 is weakly alkaline and is milder, more environmentally friendly and safer than other chemical activators, therefore making NaHCO3 a beneficial activator for the preparation of gradient porous carbon.40 As an activator, NaHCO3 produce more micropores and mesopores, which is beneficial to increasing the SSA. Therefore, NaHCO3 is one of the most suitable activators.
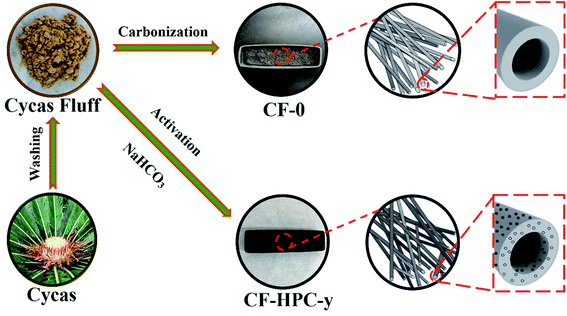
Hence, we use Cycas fluff (CF) as a carbon material and NaHCO3 as an activator to synthesize hollow-tubular porous carbon via a simple approach. The results show that the prepared porous carbon not only retains the hollow tubular structure of the original fibers, but also forms a hierarchical porous structure. CF-HPC-2 sample has a relatively high SSA of 516.70 m2 g−1 and a total volume of 0.33 cm3 g−1. Remarkably, the obtained porous carbon exhibits a high volume capacitance of 349.1 F cm−3 at 1 A g−1 and 289.1 F cm−3 at 10 A g−1, and high-performance carbon with rich energy groups was produced. The regulation and development of high-performance, low-cost and green porous carbon electrode materials from biomass materials not only alleviates the increasingly severe energy crisis, but also solves the problems of environmental pollution and energy storage.
2 Experimental
2.1 Materials
Cycas fluff was collected Suzhou University, Anhui Province, China. Sodium bicarbonate (NaHCO3), hydrogen chloride (HCl), and ethanol were purchased from Aladdin Chemistry (China) Co., Ltd. None of the chemicals underwent any purification. Deionized water was used during the whole process.2.2 Preparation of CF-0 and CF-HPC-y
The preparation steps of CF-0 and CF-HPC-y are illustrated in Fig. 1. CF-HPC-y was prepared using CF as a precursor and NaHCO3 as an activator. The CF was cleaned with distilled water and dried and then completely immersed in an aqueous NaHCO3 solution for 24 h in a weight ratio of NaHCO3: CF = 0![[thin space (1/6-em)]](https://www.rsc.org/images/entities/char_2009.gif) :
:![[thin space (1/6-em)]](https://www.rsc.org/images/entities/char_2009.gif) 1, 1
1, 1![[thin space (1/6-em)]](https://www.rsc.org/images/entities/char_2009.gif) :
:![[thin space (1/6-em)]](https://www.rsc.org/images/entities/char_2009.gif) 1, 2
1, 2![[thin space (1/6-em)]](https://www.rsc.org/images/entities/char_2009.gif) :
:![[thin space (1/6-em)]](https://www.rsc.org/images/entities/char_2009.gif) 1, and 3
1, and 3![[thin space (1/6-em)]](https://www.rsc.org/images/entities/char_2009.gif) :
:![[thin space (1/6-em)]](https://www.rsc.org/images/entities/char_2009.gif) 1, before being further dried at 100 °C for 24 h. Then, the CF was activated at 700 °C under an Ar atmosphere for 2 h at a heating rate of 5 °C min−1. The samples were finally washed using 1 M HCl and then washed (with deionized water) to eliminate the NaHCO3, until the pH value of the solution reached about 7. The resulting samples were dried at 100 °C for 24 h. According to the weight ratio of NaHCO3: CF, the products obtained were named CF-0, CF-HPC-1, CF-HPC-2, and CF-HPC-3.
1, before being further dried at 100 °C for 24 h. Then, the CF was activated at 700 °C under an Ar atmosphere for 2 h at a heating rate of 5 °C min−1. The samples were finally washed using 1 M HCl and then washed (with deionized water) to eliminate the NaHCO3, until the pH value of the solution reached about 7. The resulting samples were dried at 100 °C for 24 h. According to the weight ratio of NaHCO3: CF, the products obtained were named CF-0, CF-HPC-1, CF-HPC-2, and CF-HPC-3.
2.3 Characterization
Scanning electron microscopy (SEM, Hitachi S-2600N) and transmission electron microscopy (TEM, JEOL JE-2100F) were used to study the structural properties and morphology of the composite. The crystal structure was tested using an X-ray diffraction analyzer (XRD, Smartlab 9 kW, Japan). The XRD results were further verified by Raman spectroscopy (Thermo Fisher). The nitrogen adsorption/desorption isotherms were tested on a Micromeritics ASAP 2020 analyzer. The BET surface area was assessed and the T-plot method was used to calculate pore size distribution. Surface elements were analyzed by XPS measurements (XPS, 250Xi, Thermo Fisher Escalab, USA).2.4 Electrochemical measurements
Firstly, the as-prepared carbon samples, acetylene black and PTFE with a mass ratio of 48![[thin space (1/6-em)]](https://www.rsc.org/images/entities/char_2009.gif) :
:![[thin space (1/6-em)]](https://www.rsc.org/images/entities/char_2009.gif) 9:3 were mixed with ethanol. The above mixture in ethanol solvent was coated onto 1 × 1 cm2 nickel foam and dried at 85 °C for 24 h (the loading density of the electrode was controlled to be ca. 2.5 mg cm−2). The electrochemical performance of CF was then measured in 6 M KOH electrolyte using a three-electrode cell system on an electrochemical workstation (CHI760D). The electrochemical performances of the samples were measured using a carbon rod and Hg/HgO as counter and reference electrodes, respectively. Cyclic voltammetry (CV), galvanostatic charge–discharge (GCD) and electrochemical impedance spectroscopy (EIS) were measured on an electrochemical workstation at room temperature. CV performance was tested in the potential range of −1 to 0 V, EIS measurements of the supercapacitor were conducted within a frequency domain of 100 kHz to 0.01 Hz. The gravimetric capacitance (C, F g−1) and volumetric capacitance (Cv, F cm−1) were measured according to:
9:3 were mixed with ethanol. The above mixture in ethanol solvent was coated onto 1 × 1 cm2 nickel foam and dried at 85 °C for 24 h (the loading density of the electrode was controlled to be ca. 2.5 mg cm−2). The electrochemical performance of CF was then measured in 6 M KOH electrolyte using a three-electrode cell system on an electrochemical workstation (CHI760D). The electrochemical performances of the samples were measured using a carbon rod and Hg/HgO as counter and reference electrodes, respectively. Cyclic voltammetry (CV), galvanostatic charge–discharge (GCD) and electrochemical impedance spectroscopy (EIS) were measured on an electrochemical workstation at room temperature. CV performance was tested in the potential range of −1 to 0 V, EIS measurements of the supercapacitor were conducted within a frequency domain of 100 kHz to 0.01 Hz. The gravimetric capacitance (C, F g−1) and volumetric capacitance (Cv, F cm−1) were measured according to:| C = (I × Δt)/(m × ΔV) | (1) |
| Cv = C × ρ | (2) |
| ρ = 1/[Vt + (1/ρt)] | (3) |
In these formulas, I (A), Δt (s), m (g), and ΔV (V) are the discharge current, discharge time, mass of the active materials, and working potential range, respectively. ρt is the true density of carbon (2 g cm−3),41 ρ (g cm−3) is the density of CF and Vt is the total pore volume (cm3 g−1).
The electrochemical performance of the CF-HPC-2//CF-HPC-2 device was realized in a two-electrode electrochemical test system. The working electrodes were prepared using the same method as that for the working electrode in three-electrode system. Symmetric two-electrode cells were assembled using two electrodes with exactly the same mass and were conducted in the voltage range of 0–2.0 V. The specific capacitances (Cs, F g−1), energy density (E, Wh kg−1) and power density (P, W kg−1) were determined separately according to:
| Cs = (4I × Δt)/(m × ΔV) | (4) |
| E = (Cs × ΔV2)/(2 × 3.6) | (5) |
| P = 3600 × E/Δt | (6) |
3 Results and discussion
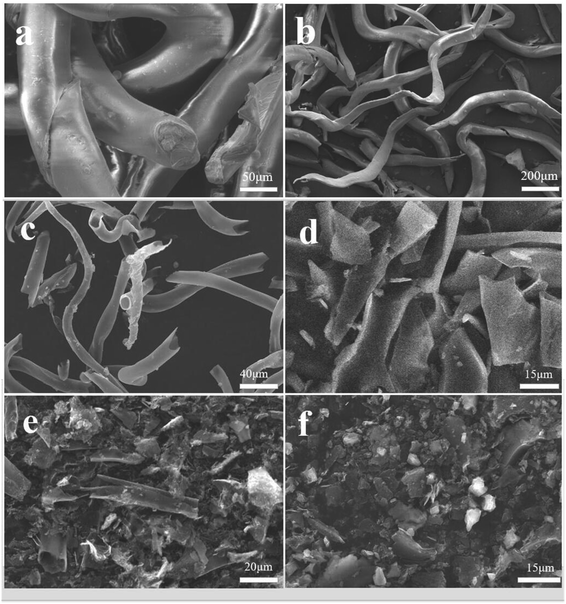
The surface morphology of the dried CF was investigated by SEM, as shown in Fig. 2a and b. A long tubular structure with slight folds was observed. The effect of different NaHCO3 content on the morphology and structure of the CF was studied. As can be seen, CF-0 exhibits a slender, smooth and hollow tubular structure without obvious holes or damage (Fig. 2c). The CF-HPC-1 sample is tubular with an abundant hierarchical porous structure and presents coarse surface particles, as shown in Fig. 2d. Owing to NaHCO3 activation and carbonization, the tubular structure of CF was destroyed and formed an apparent porous structure. After activation by NaHCO3, more intense damage occurs on the tubular structure, leaving a rough surface on CF-HPC-2 (Fig. 2e). Retaining the hollow elongated framework is essential for ion diffusion/transport, meanwhile the abundant pores can facilitate electrolyte penetration and offer more electrochemically active sites. Interestingly, CF-HPC-3 presents a large collection of irregular broken block particles with a coarse surface (Fig. 2f), probably due to the destruction of etched pores induced by the high NaHCO3 dosage.The microstructure of CF-HPC-2 was further studied by transmission electron microscopy, as shown in Fig. 3. Fig. 3a and b show the relatively sharp edges of the thin carbon sheet interconnected with porous structures that resemble wormholes. The surface of CF-HPC-2 shows a highly stratified micropore arrangement, with micropores (<2.0 nm), mesopores (2.0–50.0 nm) and macropores (>50.0 nm) (Fig. 3c and d). The porosity of the carbon material is critical to the rapid migration and infiltration of electrolyte ions. Obviously, a material with a hierarchical pore structure like CF-HPC-2 can be expected to have good electrochemical performance. Additionally, elemental mapping was carried out to examine elements present in CF-HPC-2, and also to confirm the uniformity of the C, N, O and S atom distribution on the surface of CF-HPC-2 (Fig. 3f–i). From elemental mapping, it was shown that the C, N, O and S atoms are homogeneously distributed on the surface of carbon matrix.
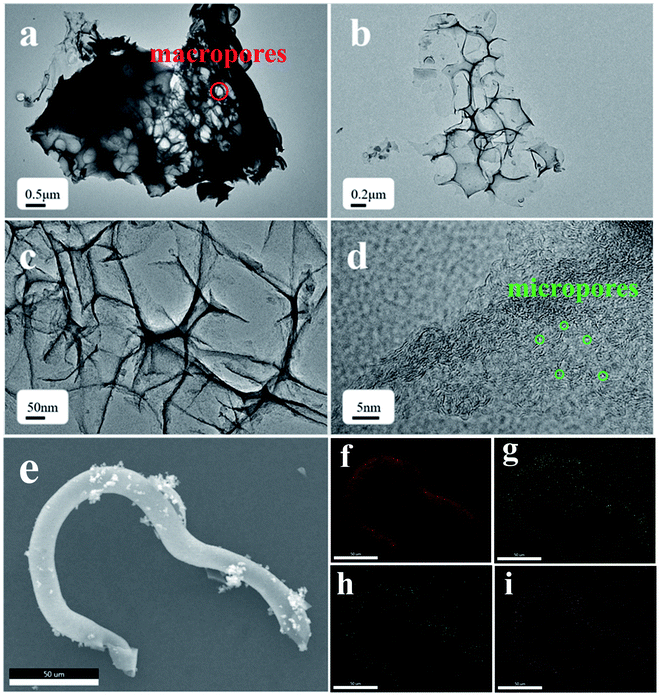 | ||
| Fig. 3 TEM images at different magnifications of the (a–d) CF-HPC-2 samples, (e) SEM image and elemental mapping images of (f) C, (g) O, (h) N and (i) S for CF-HPC-2. | ||
The chemical components of the CF samples were measured by X-ray photoelectron spectroscopy (XPS) (Fig. 4 and Table 1). As shown in Fig. 4a, the full scan spectra show four peaks at around 284, 532, 400 and 168 eV, indicating the existence of C, O, N and S respectively, in CF-0 and CF-HPC-y. Three individual peaks in the high-resolution C 1s spectrum in Fig. 4b at 284.7, 284.8, 286.3 eV can be attributed to C![[double bond, length as m-dash]](https://www.rsc.org/images/entities/char_e001.gif) C, C–C and C–O,42,43 respectively. The deconvoluted O 1s spectrum (Fig. 4c) of CF-HPC-2 indicate the presence of three types of bonding at 531.9, 532.8 and 532.8 eV, corresponding to C
C, C–C and C–O,42,43 respectively. The deconvoluted O 1s spectrum (Fig. 4c) of CF-HPC-2 indicate the presence of three types of bonding at 531.9, 532.8 and 532.8 eV, corresponding to C![[double bond, length as m-dash]](https://www.rsc.org/images/entities/char_e001.gif) O, C–OH and C–O–C, respectively. These carbonyl (C
O, C–OH and C–O–C, respectively. These carbonyl (C![[double bond, length as m-dash]](https://www.rsc.org/images/entities/char_e001.gif) O) and hydroxyl (C–OH) functional groups participate in electrochemical redox reactions which enhance the pseudo-capacitance:
O) and hydroxyl (C–OH) functional groups participate in electrochemical redox reactions which enhance the pseudo-capacitance: ![[double bond splayed left]](https://www.rsc.org/images/entities/char_e009.gif) C–OH ⇌
C–OH ⇌ ![[double bond splayed left]](https://www.rsc.org/images/entities/char_e009.gif) C
C![[double bond, length as m-dash]](https://www.rsc.org/images/entities/char_e001.gif) O + H+ + e−,
O + H+ + e−, ![[double bond splayed left]](https://www.rsc.org/images/entities/char_e009.gif) C
C![[double bond, length as m-dash]](https://www.rsc.org/images/entities/char_e001.gif) O + e− ⇌
O + e− ⇌ ![[double bond splayed left]](https://www.rsc.org/images/entities/char_e009.gif) C–O– 44,45 The N 1s XPS region spectrum is shown in Fig. 4d, with three component peaks at 397.5, 400.3, and 402.5 eV, attributed to N-5, N-Q and N-X,46 respectively. The presence of functional groups like N-5, N-Q and N-X enhances the energy storage performance of the material by providing pseudo-capacitive reactive sites. In addition, three distinguishable peaks in the spectrum of S 2p (Fig. 4e) at 163.6 eV, 164.7 eV and 168.5 eV correspond to –C–S–C–, –C
C–O– 44,45 The N 1s XPS region spectrum is shown in Fig. 4d, with three component peaks at 397.5, 400.3, and 402.5 eV, attributed to N-5, N-Q and N-X,46 respectively. The presence of functional groups like N-5, N-Q and N-X enhances the energy storage performance of the material by providing pseudo-capacitive reactive sites. In addition, three distinguishable peaks in the spectrum of S 2p (Fig. 4e) at 163.6 eV, 164.7 eV and 168.5 eV correspond to –C–S–C–, –C![[double bond, length as m-dash]](https://www.rsc.org/images/entities/char_e001.gif) S– and –C–SOx–C–, respectively.44 Altogether, the O, N and S self-doped heteroatoms can availably enhance the electrochemical capacitance by improving the reversibility of the redox reactions and improving surface wettability and compatibility, thus exhibiting promising high-capacity storage performance.
S– and –C–SOx–C–, respectively.44 Altogether, the O, N and S self-doped heteroatoms can availably enhance the electrochemical capacitance by improving the reversibility of the redox reactions and improving surface wettability and compatibility, thus exhibiting promising high-capacity storage performance.
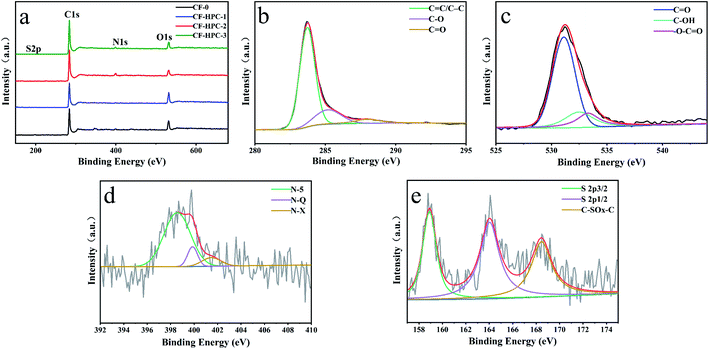 | ||
| Fig. 4 Full scan spectra of (a) CF-0 and CF-HPC-y and (b–e) high-resolution C 1s, O 1s, N 1s and S 2p XPS spectra of CF-HPC-2. | ||
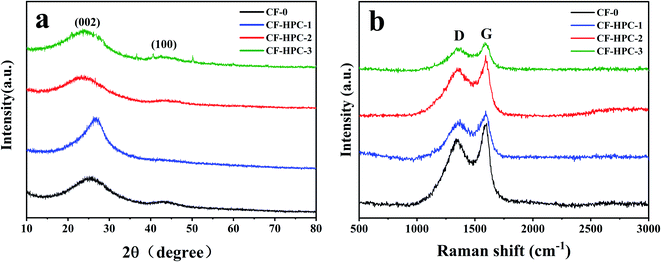
XRD and Raman spectroscopy were employed to investigate the structures of CF-0 and CF-HPC-y. The XRD patterns show two diffraction peaks at around 24° and 44°, which are attributed to the reflections from the (002) and (100) planes of graphitic carbon (Fig. 5a).47 Meanwhile, with an increase in NaHCO3 content, the intensity of the (002) peak weakens, suggesting a low degree of graphitic structure.48
Fig. 5b displays the Raman spectra of the carbon samples. Two obvious characteristic Raman peaks can be observed distinctly at around 1333 cm−1 and 1594 cm−1, respectively belonging to the D- and G-bands of disordered carbon and graphitic phase carbon.49 Generally, the peak intensity ratio ID/IG is used as an indicator of structural defects in carbon-based samples. The ID/IG values of CF-0, CF-HPC-1, CF-HPC-2 and CF-HPC-3 were calculated to be 0.82, 0.91, 0.91 and 0.97, respectively. Clearly, the ID/IG value of CF-HPC-y samples is slightly higher than that of CF-0, suggesting that more structural defects were introduced into the CF-HPC-y samples as a result of NaHCO3 activation, in agreement with the SEM results.
| Sample | XPS (at%) | |||
|---|---|---|---|---|
| C | N | O | S | |
| CF | 89.09 | 8.51 | 1.47 | 0.93 |
| CF-HPC-1 | 85.85 | 11.64 | 1.58 | 0.93 |
| CF-HPC-2 | 91.77 | 4.09 | 3.54 | 0.60 |
| CF-HPC-3 | 92.92 | 4.83 | 1.78 | 0.47 |
The pore structure properties of CF-0 and CF-HPC-y were studied by conducting N2 adsorption/desorption measurements on the CF-HPC-y samples, which show representative type-I isotherms combined with typical IV type isotherms with a hysteresis of H4 type (Fig. 6).50–52 It is clear that the sharp steep curves in the low P/P0 (below 0.1) region indicate the characteristics of the monolayer adsorption of micropores. The hysteresis loop at P/P0 in the range of 0.45–0.9 indicates the existence of a large amount of mesopores in the structure. Obviously, CF-HPC-y possesses a hierarchical porous structure with a mixture of micropores and mes/macropores. After activation, the pore size distribution of the CF-HPC-y broadens, and the SSA and pore volume of the CF-HPC-1 slightly increase, which can be attributed to the increase in NaHCO3 content. According to Table 2, when the proportion of NaHCO3 increases to 1![[thin space (1/6-em)]](https://www.rsc.org/images/entities/char_2009.gif) :
:![[thin space (1/6-em)]](https://www.rsc.org/images/entities/char_2009.gif) 3, the SSA and pore volume of CF-HPC-3 reduce drastically due to the destruction of the structure caused by excessive NaHCO3. The BET surface areas of the CF-0, CF-HPC-1, CF-HPC-2, and CF-HPC-3 samples are 71.69, 377.94, 516.70 and 397.92 m2 g−1, respectively.
3, the SSA and pore volume of CF-HPC-3 reduce drastically due to the destruction of the structure caused by excessive NaHCO3. The BET surface areas of the CF-0, CF-HPC-1, CF-HPC-2, and CF-HPC-3 samples are 71.69, 377.94, 516.70 and 397.92 m2 g−1, respectively.
| Sample | SBET (m2 g−1) | Smicro (m2 g−1) | Smicro/SBET (%) | Vt (cm3 g−1) | Vmicro (cm3 g−1) | Vmicro/Vt (%) | ρ (g cm−3) |
|---|---|---|---|---|---|---|---|
| CF-0 | 71.69 | — | — | 0.03 | — | — | — |
| CF-HPC-1 | 377.94 | 273.54 | 72.38 | 0.21 | 0.15 | 71.43 | 1.41 |
| CF-HPC-2 | 516.70 | 268.31 | 51.93 | 0.33 | 0.14 | 42.42 | 1.20 |
| CF-HPC-3 | 397.92 | 310.56 | 78.05 | 0.23 | 0.17 | 73.91 | 1.37 |
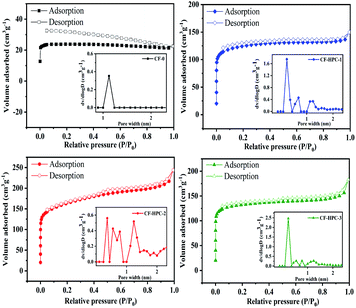 | ||
| Fig. 6 N2 adsorption–desorption isotherms obtained using the BET method and the pore-size distribution curves (inset) of CF-0 and the CF-HPC-y samples. | ||
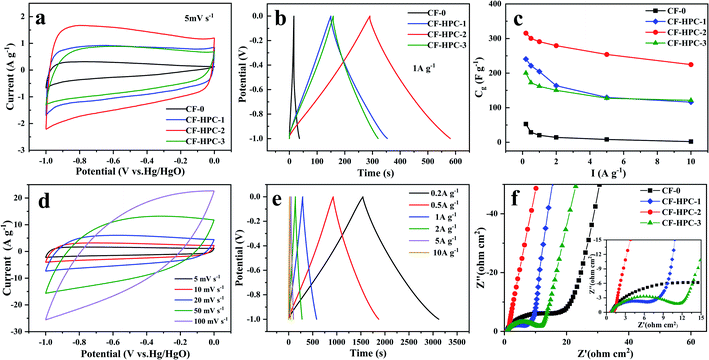
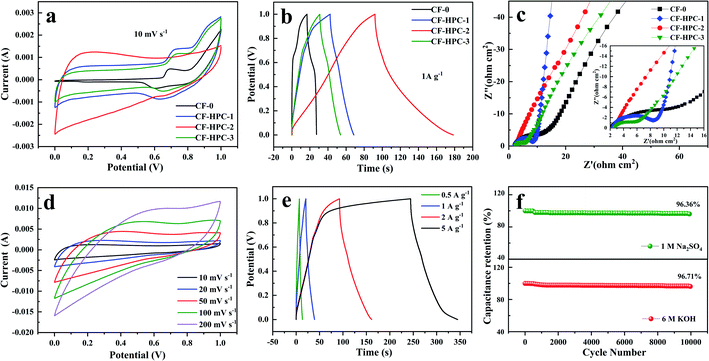
To compare the electrochemical performance of the CF-0 and CF-HPC-y samples, the electrochemical properties of CF-0 and CF-HPC-y in three-electrode systems in 6 M KOH aqueous solution were studied using CV, GCD and EIS methods. Fig. 7a and b depicts the CVs and GCD tests of CF-0 and CF-HPC-y. The CV curves of CF-0 and CF-HPC-y show the main capacitance characteristics of a double layer capacitor (EDLC), and the pseudo-capacitance characteristics according to the approximate rectangular shape data with a few peaks. Nevertheless, CF-HPC-2 has a higher area than the other samples, indicating that its maximum capacitance supports it having the highest SSA and pore volume among the samples. The GCD testing of CF-0 and CF-HPC-y was also carried out, and the discharge time of CF-HPC-2 was significantly greater than those of the other samples, which is consistent with the CV results. To further explore the rate capability, the capacitance and discharge current density data of CF-0 and CF-HPC-y are shown in Fig. 7c. Obviously, CF-HPC-y has a higher capacitance (from 0.5 A g−1 to 10 A g−1) compared to CF-0, indicating that CF-HPC-2 has superior rate capability (Table 3). CV of CF-HPC-2 under different scan rates and GCD under different current densities were studied. Fig. 7d displays CV curves of CF-HPC-2 in the scan rate range of between 5 and 100 mV s−1. The quasirectangular CV curves were well maintained, even at 100 mV s−1, implying the capacitive superiority of CF-HPC-2. Even at 10 A g−1, the GCD data (Fig. 7e) exhibit an approximate triangular shape, further demonstrating the highest rate capability and excellent capacitive behavior of CF-HPC-2.
Afterward, the charge transport and accessibility of ions within the hierarchical architectures were verified by EIS testing. As shown in Fig. 7f, compared with CF-0, the Nyquist plot of CF-HPC-2 exhibits a nearly vertical plot in the low-frequency region (<0.1 Hz), revealing its ideal capacitive behavior, and it having the smallest semicircle at high frequency manifests that it exhibits the lowest charge transfer resistance, further demonstrating that CF-HPC-2 has the fastest ion spread and charge transfer ability in the electrolyte. The excellent electrochemical performance of CF-HPC-2 can be attributed to the following reasons. First of all, the large number of micropores generated during the activation process is the key to the EDLC properties. In addition, micropores shorten the length of the ion diffusion path. Secondly, mesopores provide ion transport channels, while macropores act as ion buffers. Lastly, the high specific surface area provides a large number of active sites for electrochemical reactions where charges are stored.
The electrochemical performance of CF-0 and CF-HPC-y in 1 M Na2SO4 aqueous solution in three-electrode system was also studied by the same method. It was observed that the CV curves of the CF-0 and CF-HPC-y electrodes exhibit a quasi-rectangular shape (Fig. 8a). The corresponding GCD curves of CF-0 and CF-HPC-y illustrated in Fig. 8b exhibit almost symmetrical triangular shapes, indicating reversible and typical electric double layer capacitor behavior. According to the Nyquist diagram of the sample (Fig. 8c), the curve of the CF-HPC-2 sample is more vertical at low frequency, showing a lower charge transfer resistance. The intercept on the Z′ axis in the high frequency region is the lowest, indicating that the conductivity of CF-HPC-2 is better than those of the other samples. The CV plots of the CF-HPC-2 electrode at different scan rates were also measured, as shown in Fig. 8d, from which it can be seen that all the curves present a similar rectangular shape. All of the curves of CF-HPC-2 at various current densities (0.5 to 5 A g−1) are almost symmetrical and linear, as shown in Fig. 8e. In addition, after 10![[thin space (1/6-em)]](https://www.rsc.org/images/entities/char_2009.gif) 000 cycles, 96.36% and 96.71% of the initial specific capacitance were retained, respectively in Na2SO4 and KOH electrolyte, indicating that the electrode material has good cycling stability (Fig. 8f).
000 cycles, 96.36% and 96.71% of the initial specific capacitance were retained, respectively in Na2SO4 and KOH electrolyte, indicating that the electrode material has good cycling stability (Fig. 8f).
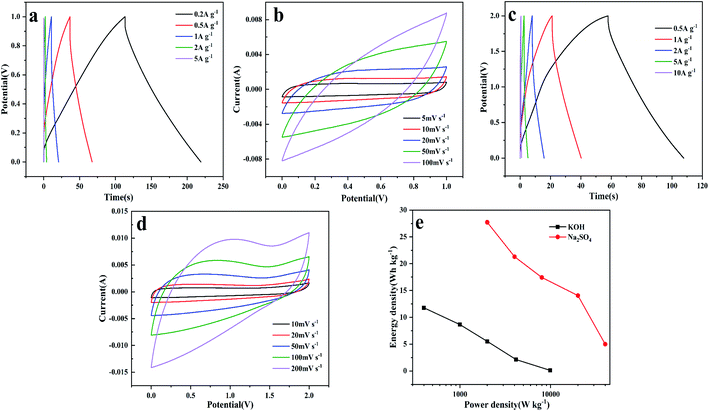
CF-HPC-2 was assembled into symmetric supercapacitors in 2 M Na2SO4 and 6 M KOH electrolyte solutions for further verification. As shown in the constant-current discharge curves of the CF-HPC-2 based symmetric supercapacitor at various specific current values (0.2–5 A g−1) in Fig. 9a, all the curves are nearly symmetrical triangles, indicating the good rate capability of the fabricated device. Fig. 9b shows the CV curves of a symmetric supercapacitor based on CF-HPC-2 at different scan rates from 5 to 100 mV s−1. At different scan rates, a symmetrical rectangular shape was observed in the CV curves.
As shown in Fig. 9c, nearly symmetric triangular shapes can be observed in the GCD curves of CF-HPC-2 conducted under different current densities from 0.5 to 10 A g−1, implying its excellent capacitive behavior. The CV curves exhibit quasi-rectangular shapes from 10 to 200 mV s−1, suggesting that the capacitor exhibits good EDLC behavior and excellent capacitance in 2 M Na2SO4 electrolyte (Fig. 9d). The excellent energy density and power density were ascribed to the ordered lamellar structure promoting the sufficient storage of ions. The Ragone plot (Fig. 9e) illustrates the energy densities of the CF-HPC-2 based symmetric supercapacitor in 6 M KOH and 2 M Na2SO4 electrolytes. The plot shows that the CF-HPC-2 supercapacitor assembly exhibits excellent energy and power densities in Na2SO4 compared to in KOH electrolyte. Benefiting from the higher voltage of Na2SO4 (2 V), the CF-HPC-2 based symmetric supercapacitor exhibits an energy density of 27.72 W h kg−1 at a power density of 20 kW kg−1. Moreover, the energy density remained at 21.31 W h kg−1 even as the power density increased to 40 kW kg−1.
| Precursors | Activator | Cg | Cv | Test conditions | Ref. |
|---|---|---|---|---|---|
| Water chestnut | KOH | 346 | 115 | 6 M KOH, 0.5 A g−1 | 53 |
| Pomelo peel | NH4H2PO4/KHCO3 | 207 | 92.82 | 0.5 M NaCl, 1 mV s−1 | 54 |
| Sugar cane bagasse | ZnCl2 | 300 | 134 | 1 M KOH, 0.25 A g−1 | 55 |
| Kelp | None | 440 | 360 | 6 M KOH, 0.5 A g−1 | 56 |
| Flour | LiCl/KCl | 261 | 327 | 1 M H2SO4, 1 A g−1 | 57 |
| Coconut shell | ZnCl2 | 248 | 145.03 | 6 M KOH, 0.5 A g−1 | 58 |
| Wheat bran | KOH | 294 | 184 | 6 M KOH, 0.5 A g−1 | 59 |
| Acacia gum | KOH | 272 | 177 | 6 M KOH, 1 A g−1 | 60 |
| Corn straw | KOH | 222 | — | 6 M KOH, 1 A g−1 | 61 |
| Shrimp shells | None | 322 | — | 6 M KOH, 0.5 A g−1 | 62 |
| Fungus | KOH | 374 | — | 6 M KOH, 0.5 A g−1 | 63 |
| Cycas fluff | NaHCO3 | 291 | 349 | 6 M KOH, 1 A g−1 | This work |
4 Conclusion
To sum up, this paper proposes an effective, green and economical strategy by which to prepare layered CF-HPC-y via the carbonization and activation of low-cost CF, using mild NaHCO3 as the activator. The optimal activation conditions were investigated by studying the mass ratio of NaHCO3 to CF. The prepared CF-HPC-2 has a high SSA of 516.70 m2 g−1 and a total volume of 0.33 cm3 g−1. The porous carbon displays a high-volume capacitance of 349.1 F cm−3 at 1 A g−1 and 289.1 F cm−3 at 10 A g−1. Besides this, the energy density of the CF-HPC-2-based symmetric supercapacitor displays a maximum energy density of 27.72 W h kg−1 at 20 kW kg−1. Thus, this study proposes a mild and environmentally-friendly method by which to fabricate bulk capacitors, providing a new idea for energy storage systems.Conflicts of interest
The authors declare that they have no conflicts of interest regarding the publication of this article.Acknowledgements
The support of the Anhui University Natural Science Research Project (KJ2020A0730), the Anhui Quality Engineering Project (2019jxtd111), The demonstration and leading base for first-class undergraduate talents in materials majors (2020rcsfjd42), the Key project of Natural Science research of Anhui Provincial Department of Education (KJ2019A0675, KJ2021A114, 2021jyxm1507), the National innovation and entrepreneurship program for college Students (202110379034, 202110379038), the Key teaching and scientific research project of Suzhou University (2021yzd07, szxy2021ccjy05, 2020szsfkc1018, 2020ykf07, 2022ykf05), and the Provincial College student innovation and entrepreneurship project (S202110379080, S202110379083, S202110379085, S202110379091, S202110379086) is gratefully acknowledged.References
- B. Bayatsarmadi, Y. Zheng, A. Vasileff and S. Z. Qiao, Small, 2017, 13, 1700191 CrossRef PubMed.
- J. W. Nai and X. W. Lou, Adv. Mater., 2019, 31, 1706825 CrossRef PubMed.
- R. A. Senthil, S. Osman, J. Q. Pan, A. Khan, V. Yang, T. R. Kumar, Y. Z. Sun, Y. J. Lin, X. G. Liu and A. Manikandan, Colloids Surf., A, 2020, 586, 124079 CrossRef CAS.
- N. S. Wu, J. X. Low, T. Liu, J. G. Yu and S. W. Cao, Appl. Surf. Sci., 2017, 413, 35–40 CrossRef CAS.
- X. J. Yang, J. Q. Pan, Y. J. Nie, Y. Z. Sun and P. Y. Wan, Int. J. Hydrogen Energ., 2017, 42, 26575–26585 CrossRef CAS.
- Y. Lu, L. Yu and X. W. Lou, Chem, 2018, 4, 972–996 CAS.
- X. Y. Yu and X. W. Lou, Adv. Energy Mater., 2018, 8, 1701592 CrossRef.
- L. Y. Zhang, D. W. Shi, T. Liu, M. Jaroniec and J. G. Yu, Mater. Today, 2019, 25, 35–65 CrossRef CAS.
- G. P. Wang, L. Zhang and J. J. Zhang, Chem. Soc. Rev., 2012, 41, 797–828 RSC.
- X. X. Liu, C. D. Shi, C. W Zhai, M. L. Cheng, Q. Liu and G. X. Wang, ACS Appl. Mater. Interfaces, 2016, 8, 4585–4591 CrossRef CAS PubMed.
- D. Z. Zhu, J. X. Jiang, D. M. Sun, X. Y. Qian, Y. W. Wang, L. C. Li, Z. W. Wang, X. L. Chai, L. H. Gan and M. X. Liu, J. Mater. Chem. A, 2018, 6, 12334–12343 RSC.
- W. X. Liu, R. L. Yin, X. L. Xu, L. Zhang, W. H. Shi and X. H. Cao, Adv. Sci., 2019, 6, 1802373 CrossRef PubMed.
- Y. Zhang, Q. Sun, K. S. Xia, B. Han, C. G. Zhou, Q. Gao, H. Q. Wang, S. Pu and J. P. Wu, ACS Sustainable Chem. Eng., 2019, 7, 5717–5726 CrossRef CAS.
- G. L. Zhang, T. T. Guan, N. Wang, J. C. Wu, J. L. Wang, J. L. Qiao and K. X. Li, Chem. Eng. J., 2020, 399, 125818 CrossRef CAS.
- Z. C. Yang, C. H. Tang, Y. Zhang, H. Gong, X. Li and J. Wang, Sci. Rep., 2013, 3, 2925 CrossRef PubMed.
- W. C. Jiang, L. Y. Li, J. Q. Pan, R. A. Senthil, X. Jin, J. Q. Cai, J. Wang and X. G. Liu, J. Power Sources, 2019, 438, 226936 CrossRef CAS.
- G. T. Sun, L. Qiu, M. Q. Zhu, K. Kang and X. H. Guo, Ind. Crops Prod., 2018, 125, 41–49 CrossRef CAS.
- S. Witomska, Z. Y. Liu, W. Czepa, A. Aliprandi, D. Pakulski, P. Pawluć, A. Ciesielski and P. Samorì, J. Am. Chem. Soc., 2019, 141, 482–487 CrossRef CAS PubMed.
- C. Wang, X. F. Wang, H. Lu, H. L. Li and X. S. Zhao, Carbon, 2018, 140, 139–147 CrossRef CAS.
- Y. Lu, J. N. Liang, S. F. Deng, Q. M. He, S. Y. Deng, Y. Z. Hu and D. L. Wang, Nano Energy, 2019, 65, 103993 CrossRef CAS.
- E. Raymundo-Piñero, M. Cadek and F. Béguin, Adv. Funct. Mater., 2009, 19, 1032–1039 CrossRef.
- F. Y. Liu, Z. X. Wang, H. T. Zhang, L. Jin, X. Chu, B. N. Gu, H. C. Huang and W. Q. Yang, Carbon, 2019, 149, 105–116 CrossRef CAS.
- G. Z. Zhao, Y. J. Li, G. Zhu, J. Y. Shi, T. Lu and L. K. Pan, ACS Sustainable Chem. Eng., 2019, 7, 12052–12060 CAS.
- J. Chen, H. M. Wei, H. J. Chen, W. H. Yao, H. L. Lin and S. Han, Electrochim. Acta, 2018, 271, 49–57 CrossRef CAS.
- J. Guo, D. L. Wu, T. Wang and Y. Ma, Appl. Surf. Sci., 2019, 475, 56–66 CrossRef CAS.
- C. X. Cui, Y. Gao, J. Li, C. Yang, M. Liu, H. L. Jin, Z. H. Xia, L. M. Dai, Y. Lei, J. C. Wang and S. Wang, Angew. Chem., Int. Ed., 2020, 59, 7928–7933 CrossRef CAS PubMed.
- X. S. Zhao, L. C. Yin, T. Zhang, M. Zhang, Z. B. Fang, C. Z. Wang, Y. J. Wei, G. Chen, D. Zhang, Z. H. Sun and F. Li, Nano Energy, 2018, 49, 137–146 CrossRef CAS.
- X. L. Xing, R. J. Liu, M. Anjass, K. C. Cao, U. Kaiser, G. J. Zhang and C. Streb, Appl. Catal., B, 2020, 277, 119195 CrossRef CAS.
- P. Wang, G. Zhang, M. Y. Li, Y. X. Yin, J. Y. Li, G. Li, W. P. Wang, W. Peng, F. F. Cao and Y. G. Guo, Chem. Eng. J., 2019, 375, 122020 CrossRef CAS.
- J. H. Hou, K. Jiang, R. Wei, M. Tahir, X. G. Wu, M. Shen, X. Z. Wang and C. B. Cao, ACS Appl. Mater. Interfaces, 2017, 9, 30626–30634 CrossRef CAS PubMed.
- L. L. Cheng, Y. Y. Hu, L. Ling, D. D. Qiao, S. C. Cui and Z. Jiao, Electrochim. Acta, 2018, 283, 664–675 CrossRef CAS.
- L. J. Wang, F. Sun, J. H. Gao, Y. W. Zhu, T. Pei, L. X. Li, G. B. Zhao and Y. K. Qin, Energ. Fuel., 2018, 32, 9191–9201 CrossRef CAS.
- L. Pan, X. X. Li, Y. X. Wang, J. L. Liu, W. Tian, H. Ning and M. B. Wu, Appl. Surf. Sci., 2018, 444, 739–746 CrossRef CAS.
- S. T. Yang, X. X. Mao, Z. X. Cao, Y. H. Yin, Z. C Wang, M. J. Shi and H. Y. Dong, Appl. Surf. Sci., 2018, 427, 626–634 CrossRef CAS.
- X. X. Zhu, X. H. Huang, S. Anwer, N. Wang and L. D. Zhang, Langmuir, 2020, 36, 9284–9290 CrossRef CAS PubMed.
- L. Y. Pang, B. Zou, Y. C. Zou, X. Han, L. Y. Cao, W. Wang and Y. P. Guo, Colloids Surf., A, 2016, 504, 26–33 CrossRef CAS.
- O. Pezoti, A. L. Cazetta, K. C. Bedin, L. S. Souza, A. C. Martins, T. L. Silva, O. O. S. Júnior, J. V. Visentainer and V. C. Almeida, Chem. Eng. J., 2016, 288, 778–788 CrossRef CAS.
- T. M. Darweesh and M. J. Ahmed, Environ. Toxicol. Pharmacol., 2017, 50, 159–166 CrossRef CAS PubMed.
- M. T. Vu, H. P. Chao, T. V. Trinh, T. T. Le, C. C. Lin and H. N. Tran, J. Cleaner Prod., 2018, 180, 560–570 CrossRef CAS.
- M. Mansuer, L. Miao, D. Z. Zhu, H. Duan, Y. K. Lv, L. C. Li, M. X. Liu and L. H. Gan, Mater. Chem. Front., 2021, 5, 3061–3072 RSC.
- C. L. Long, X. Chen, L. L. Jiang, L. J. Zhi and Z. J. Fan, Nano Energy, 2015, 12, 141–151 CrossRef CAS.
- H. Chen, S. J. You, Y. Y. Ma, C. Y. Zhang, B. J. Jing, Z. Cai, B. Tang, N. Q. Ren and J. L. Zou, Chem. Mater., 2018, 17, 6014–6025 CrossRef.
- V. C. Hoang, V. G. Gomes and K. N. Dinh, Electrochim. Acta, 2019, 314, 49–60 CrossRef CAS.
- A. Venkatalaxmi, B. S. Padmavathi and T. Amaranath, Fluid Dyn. Res., 2004, 35, 229 CrossRef.
- R. Yan, K. Wang, X. D. Tian, X. Li, T. Yang, X. T. Xu, Y. T. He, S. W. Lei and Y. Song, Carbon Lett, 2020, 30, 331–344 CrossRef.
- M. F. Chen, D. Yu, X. Z. Zheng and X. P. Dong, J. Energy Storage, 2019, 21, 105–112 CrossRef.
- J. J. Zhou, S. X. Yuan, C. X. Lu, M. H. Yang and Y. Song, J. Electroanal. Chem., 2020, 878, 114704 CrossRef CAS.
- S. Ghosh, R. Santhosh, S. Jeniffer, V. Raghavan, G. Jacob, K. Nanaji, P. Kollu, S. K. Jeong and A. N. Grace, Sci. Rep., 2019, 9, 16315 CrossRef PubMed.
- H. X. Qu, X. J. Zhang, J. J. Zhan, W. Q. Sun, Z. C. Si and H. K. Chen, ACS Sustainable Chem. Eng., 2018, 6, 7380–7389 CrossRef CAS.
- M. Mansuer, L. Miao, Y. Qin, Z. Y. Song, D. Z. Zhu, H. Duan, Y. K. Lv, L. C. Li, M. X. Liu and L. H. Gan, Chin. Chem. Lett., 2022 DOI:10.1016/j.cclet.2022.03.027.
- Z. Y. Song, L. Miao, L. Ruhlmann, Y. K. Lv, D. Z. Zhu, L. C. Li, L. H. Gan and M. X. Liu, Adv. Mater., 2021, 33, 2104148 CrossRef CAS PubMed.
- H. Duan, Z. Y. Song, L. Miao, L. C. Li, D. Z. Zhu, L. H. Gan and M. X. Liu, J. Mater. Chem. A, 2022, 10, 9837–9847 RSC.
- H. M. Wei, J. Chen, N. Fu, H. J. Chen, H. L. Lin and S. Han, Electrochim. Acta, 2018, 266, 161–169 CrossRef CAS.
- D. Xu, Y. Tong, T. T. Yan, L. Y. Shi and D. S. Zhang, ACS Sustainable Chem. Eng., 2017, 5, 5810–5819 CrossRef CAS.
- T. E. Rufford, D. H. Jurcakova, K. Khosla, Z. H. Zhu and G. Q. Lu, J. Power Sources, 2010, 195, 912–918 CrossRef CAS.
- J. Li, K. Liu, X. Gao, B. Yao, K. F. Huo, Y. L. Cheng, X. F. Cheng, D. C. Chen, B. Wang, D. Ding, M. L. Liu and L. Huang, ACS Appl. Mater. Interfaces, 2015, 7, 24622–24628 CrossRef CAS PubMed.
- Y. X. Hao, F. Xu, M. Qian, J. J. Xu, W. Zhao and F. Q. Huang, RSC Adv., 2017, 7, 10901–10905 RSC.
- L. Sun, C. G. Tian, M. T. Li, X. Y. Meng, L. Wang, R. H. Wang, J. Yin and H. G. Fu, J. Mater. Chem. A, 2013, 21, 6462–6470 RSC.
- D. W. Wang, Y. G. Min and Y. H. Yu, J. Solid State Electr., 2015, 19, 577–584 CrossRef CAS.
- Y. Fan, P. F. Liu, B. Zhu, S. F. Chen, K. L. Yao and R. Han, Int. J. Hydrogen Energy, 2015, 40, 6188–6196 CrossRef CAS.
- Y. H. Lu, S. L. Zhang, J. M. Yin, C. C. Bai, J. H. Zhang, Y. X. Li, Y. Yang, Z. Ge, M. Zhang, L. Wei, M. X. Ma, Y. F. Ma and Y. S. Chen, Carbon, 2017, 124, 64–71 CrossRef CAS.
- W. Q. Tian, Q. M. Gao, L. M. Zhang, C. X. Yang, Z. Y. Li, Y. L. Tan, W. W. Qian and H. Zhang, J. Mater. Chem. A, 2016, 4, 8690–8699 RSC.
- C. L. Long, X. Chen, L. L. Jiang, L. J. Zhi and Z. J. Fan, Nano Energy, 2015, 12, 141–151 CrossRef CAS.
| This journal is © The Royal Society of Chemistry 2022 |

