
 Open Access Article
 This Open Access Article is licensed under a Creative Commons Attribution-Non Commercial 3.0 Unported Licence
Reusable alcohol oxidase–nPtCu/alginate beads for highly sensitive ethanol assay in beverages†
Nataliya Stasyuk *ab,
Olha Demkiva,
Galina Gaydaa,
Oksana Zakalskaa,
Andriy Zakalskiyad,
Roman Serkizac,
Taras Kavetskyybe and
Mykhailo Gonchar*ab
*ab,
Olha Demkiva,
Galina Gaydaa,
Oksana Zakalskaa,
Andriy Zakalskiyad,
Roman Serkizac,
Taras Kavetskyybe and
Mykhailo Gonchar*ab
aInstitute of Cell Biology, National Academy of Sciences of Ukraine, Lviv, Ukraine. E-mail: stasuk_natalia@ukr.net; demkiv@yahoo.com; galina.gayda@gmail.com; zakalska@yahoo.com; andriy.zakalskiy@yahoo.com; mykhailo1952@gmail.com
bDrohobych Ivan Franko State Pedagogical University, Drohobych, Ukraine
cIvan Franko National University of Lviv, Department of Solid State Physics, Lviv, Ukraine. E-mail: rserkiz@gmail.com
dInstitute of Animal Biology of the National Academy of Agrarian Sciences of Ukraine, Lviv, Ukraine
eThe John Paul II Catholic University of Lublin, 20-950 Lublin, Poland. E-mail: kavetskyy@yahoo.com
First published on 2nd August 2022
Abstract
Nanozymes (NZs) are nanoparticles that mimic the catalytic properties of natural enzymes. The present work aimed to obtain effective peroxidase mimetics (PO-like NZs), to characterize their morphological properties, estimate the kinetic parameters of NZs and evaluate the prospects of their application in analysis of ethanol. Herein, we have proposed a convenient spectrophotometric method for ethanol assay using reusable alginate beads enriched with alcohol oxidase (AO) and nanoparticles of PtCu (nPtCu) as PO-like NZs, and 3,3′,5,5′-tetramethylbenzidine (TMB) as a chromogen. The linear range for the proposed nPtCu–AO/alginate beads/TMB-based method is from 0.01 mM to 0.15 mM with a limit of detection of 3.3 μM ethanol. The method is used for the quantitative determination of ethanol in alcoholic beverages. The obtained results proved to be in a good correlation with the enzymatic reference method. These results highlight the potential of the nPtCu with PO-like activity in bioanalytical applications. The proposed method, being sensitive, economical and suitable for routine and micro-volume formats, can be used in clinical diagnostics for the detection of ethanol.
Introduction
Ethanol is a major component of alcoholic beverages and other products that undergo fermentation.1–3 Although alcohol is widely consumed, in high doses it can cause a variety of health complications and intoxication.4–6 Determining the level of various alcohols with high sensitivity, selectivity and precision is very important for many medical and industrial applications.7 To measure alcohol levels in biological liquids and beverages, many analytical methods such as gas chromatography,8 high performance liquid chromatography9 and spectrophotometry10 have been proposed. Although these methods are accurate and reliable, they conclude time-consuming stages of pre-processing. Among the reported methods, ethanol conversion enzymes, namely, alcohol oxidase (AO) and alcohol dehydrogenase (ADH) are frequently used for the construction of electrochemical biosensors for detection of ethanol due to their simplicity, low cost, and high sensitivity.11,12NAD+-dependent ADH can oxidize primary aliphatic and aromatic alcohols.13 NAD(P)-dependent dehydrogenases are widely used in analytical applications.14,15 However, the application of ADH in biosensorics is complicated because of additional cofactors for electrode regeneration.16 On the other hand, AO oxidizes primary alcohols to aldehydes and hydrogen peroxide (H2O2). AO contains the flavin-based cofactor which is tightly associated with the redox center of the enzyme, making it more pertinent for biosensor design.17,18 This is why almost all the proposed AO-based methods for analysis of ethanol exploit the monitoring of O2 consumption or H2O2 formation. In the case of spectrophotometric detection of ethanol, based on measurement of H2O2 concentration, a bi-enzymatic system coupled with peroxidase (PO) is typically used.19
Peroxidases (PO, E.C. 1.11.1.7) are oxidoreductases that contain an iron-porphyrin derivative (heme) in their active site and catalyze the oxidation of diverse organic compounds using H2O2 as the electron acceptor.20 Commercially, PO is used in many diagnostic kits, including immunological testing as well as in the treatment of industrial wastewater for biological improvement.21
A new class of enzymes, artificial peroxidases, has recently become known.22 Artificial enzymes or nanozymes (NZs) are nanomaterials with intrinsic enzyme-like characteristics that have been booming over the past decade because of their capability to address the limitations of natural; enzymes such as low stability, high cost, and difficult storage. Novel artificial PO-like NZs hold a great promise for successful assay of various real samples including food and biological liquids. Recently, various nanoparticles (NPs), in particular, the nanomaterials of metals and transition metal oxides were shown to decompose effectively H2O2.23,24 Among them, Prussian blue-based NPs and noble metal nanomaterials, such as gold (Au), platinum (Pt), and ruthenium (Ru) have attracted more attention because of their high catalytic activities, tunable morphology, and excellent biocompatibility. Compared with single-component noble metal NPs, hybrid (bi- and trimetallic) nanomaterials can provide a higher chance for enhancement in catalytic efficiency.25
Nowadays, there is limited data concerning the development of colorimetric (spectrophotometric) methods of ethanol analysis using of AO and PO-like NZs.26–34 Recently, it has been reported the synthesis of thiocyanide capped gold nanoparticles possessing AO-like activity, however the selectivity of ethanol detection was insufficient.26 The main analytical characteristics of the proposed alcohol oxidase–nanozyme-based methods for ethanol analysis are compared in Table 1. In these methods, chromogenic substrates such as TMB (3,3′,5,5′-tetramethylbenzidine) and ABTS (2,2′-azinobis[3-ethylbenzothiazoline-6-sulfonic acid]) have been commonly used. For example, AuPtRu were coupled with AO to detect ethanol in a buffer solution and mouse blood employing TMB as a chromogen substrate.27 Whereas, Kim and co-workers have detected ethanol in a linear concentration range from 100 to 500 μM with a detection limit of 25 μM by employing ABTS as a peroxidase substrate.28 In addition, one of the most effective artificial PO mimetics was shown to be Prussian blue nanocubes which in combination with AO and TMB showed an excellent linear range up to 10 mM at 652 nm.29 The other methods of ethanol assay are based on the AO and PO-like NZs was amperometry and electrochemical impedance spectroscopy, but the sensitivity of the proposed sensors was insufficient.31–34
| Selective layer | Mode of detection | Linear range, mM | LOD, μM | Reference |
|---|---|---|---|---|
| a hPBNCs – Prussian blue nanocubes; CB/PBNPs – nanocomposite formed by carbon black (CB) and Prussian nlue nanoparticles (PBNPs). | ||||
| nPtCu | Spectrophotometry | 0.01–0.15 | 3.3 | This work |
| Au/PtRu | 0.25–4 | 23.8 | 27 | |
| Fe3O4 | 0.1–0.5 | 25 | 28 | |
| hPBNCs | 0.04–10.8 | 30 | 29 | |
| Pd/Pt | — | 500 | 30 | |
| Pt/Ru | Amperometry | 0.025–0.2 | 3 | 31 |
| PO/Au | 0.005–3 | 2.3 | 32 | |
| Au | 0.01–4.7 | 7 | 33 | |
| CB/PBNPs | Electrochemical impedance spectroscopy | Up to 10 | 520 | 34 |
The aim of current research is to design reusable alginate beads loaded with AO and PO-like nanozyme PtCu (further – nPtCu) and their testing for ethanol analysis in beverages. In this paper, we describe synthesis, morphological characterization and estimation the catalytic parameters of NZs as artificial PO. AO was selected due to using it in our previous works related to the development of biosensors and enzymatic kits for assay of ethanol.35–37 Various analytical characteristics, such as specificity, sensitivity, repeatability and operational stability were investigated.
Results and discussion
Synthesis and characterization of PO mimetics
A number of metal-based composite nanomaterials were obtained using two chemical methods, namely, reduction from the inorganic salts and bath deposition on plate. The synthesized compounds were screened on their ability to oxidize o-DZ in the presence of H2O2 by monitoring optical density at 525 nm.38 It was shown that several synthesized NZs, especially nPtCu and nCu revealed the highest PO-like activities among all others (Table 2).| Kinetic parameters | |||||
|---|---|---|---|---|---|
| NZs | Specific activity, U mg−1 | KM, mM | Vmax, mM s−1 | kcat, μmol s−1 mg−1 | kcat/KM, s−1 mL mg−1 |
| a KM – Michaelis constant; Vmax – maximal reaction velocity; kcat – catalytic constant; kcat/KM – catalytic efficiency. | |||||
| nCuCeAu | 1.8 ± 0.12 | 0.82 | 5.3 × 10⁻⁴ | 0.053 | 0.065 |
| nPtAu | 1.4 ± 0.1 | 3.1 | 5.8 × 10⁻⁴ | 0.058 | 0.019 |
| nPtCu | 3.4 ± 0.5 | 5.3 | 2.5 × 10⁻⁵ | 0.023 | 0.004 |
| nCu | 3.0 ± 0.25 | 25.8 | 7 × 10⁻⁵ | 0.333 | 0.013 |
| nPdCe | 2.2 ± 0.05 | 103 | 6.8 × 10⁻⁵ | 1.35 × 10⁻⁴ | 0.005 |
| nCuCe | 1.65 ± 0.13 | 667 | 4 × 10⁻⁴ | 4.0 | 0.006 |
| PO40 | — | 3.7 | 0.004 | — | — |
The nPtCu and nCu with the highest PO-like activity were chosen for further detailed morphological characterization by SEM coupled with X-ray microanalysis (SEM-XRM). SEM provided information on the size and shape of the tested sample (see ESI, Fig. ESI 1†). Fig. ESI 1† presents the overall morphology of the formed particles. The XRM images of the most active PO mimetics (nPtCu and nCu) showed the characteristic peaks for metals of the composites. As shown in Fig. ESI 1a–c,† nPtCu have structure close to spherical with the size of near 200 nm, whereas the sizes of nCu was near 500 nm (Fig. ESI 1d and e†). The XRM images (Fig. ESI 1d and f†) showed the presence of all components of the tested materials. Pt0 formation has been proved by X-ray microanalysis, which showed the characteristic emission peaks at 2.2, 9.5, and 11.1 keV corresponding to the PtKα, PtKα, and PtKβ transitions, respectively (Fig. ESI 1c†). The characteristic peaks for Cu0 at 1.4 and 8.05 keV which correspond to the CuKα and CuKβ transitions, respectively, were shown in Fig. ESI 1c and f.†
Investigation of kinetic parameters (KM and Vmax) of NZs
For the obtained NZs with the highest PO-specific activities, the catalytic parameters (KM, Vmax, kcat) were estimated (Fig. 1, Table 2). | ||
| Fig. 1 Kinetic analysis for the NZs: nCu (a), nCuCe (b) and nPtCu (c) with H2O2 and o-DZ as substrates. A, B – parameters for the linear regression line; R – correlation coefficient; Vmax – maximum velocity of the reaction; KM – the apparent Michaelis–Menten constant. | ||
From the kinetic analysis, it was found that in 0.05 M acetate buffer at pH 4.5 in the presence of o-DZ as a substrate, nPtCu and nPtAu show similar to natural horseradish peroxidase (PO) KM values (toward H2O2), namely, 5.3 mM and 3.1 mM, respectively. As shown in Table 2, the apparent KM (further KM) value of the nCuCeAu toward H2O2 is significantly lower than that of the natural PO,41 suggesting that the nCuCeAu have higher affinity to H2O2. The maximum velocity (Vmax) of the reaction was also analyzed and compared with the natural PO enzyme. The data presented above also showed that for nCu the value of KM is significantly higher (7-fold), which indicates a lower (compared to PO) affinity of NZs to H2O2, probably, due to the steric difficulties of diffusion of substrate molecules to the surface of NZs (Table 2).
Table 2 shows the kinetic parameters of the NZs in solution, determined by the method of Lineweaver–Burk. The obtained kinetic parameters were compared with the kinetic characteristics of PO, with o-DZ as the substrate.
The selectivity test to other chromogenic substrates in two-substrate peroxidative reaction was also done, including ABTS (2,2′-azino-bis(3-ethylbenzothiazoline-6-sulfonic acid)), 4-aminoantipyrine (4-AAP), guaiakol and 3,3′,5,5′-tetramethyl benzidine (TMB) in comparison with o-DZ, according to the methods specified in subdiv. «determination of peroxidase-like activity of NZs in solution» (Fig. ESI 2†). It was shown that the obtained NZs have the highest activity toward to o-DZ, while guaiacol cannot serve as a substrate. It should be noted that ABTS, as a substrate, occupies an intermediate place in this row. Summarizing the obtained results on the catalytic characteristics of the synthesized NZs it can be concluded that o-DZ and TMB are the best substrates for peroxidative reaction. In next experiments on ethanol assay we have used TMB as a chromogen.
Fabrication and characterisation of the alginate beads
In our study, alginate beads encapsulated with nPtCu and AO were used for the development of the spectrophotometric assay of ethanol. nPtCu and AO were incorporated into the alginate beads during the gelation. To study morphology and elemental composition on the bead's surface, SEM with energy-dispersive X-ray spectroscopy was used (Fig. 2). It should be noted that SEM images have been done in usual (a and c) and compo (b and d) modes, which allows to visualize the NZs located inside the alginate beads. As shown in Fig. 2a–d, nPtCu particles do not agglomerate during gelation. The XRM images show the characteristic peaks for Cu0, Pt0 (Fig. 2e), respectively.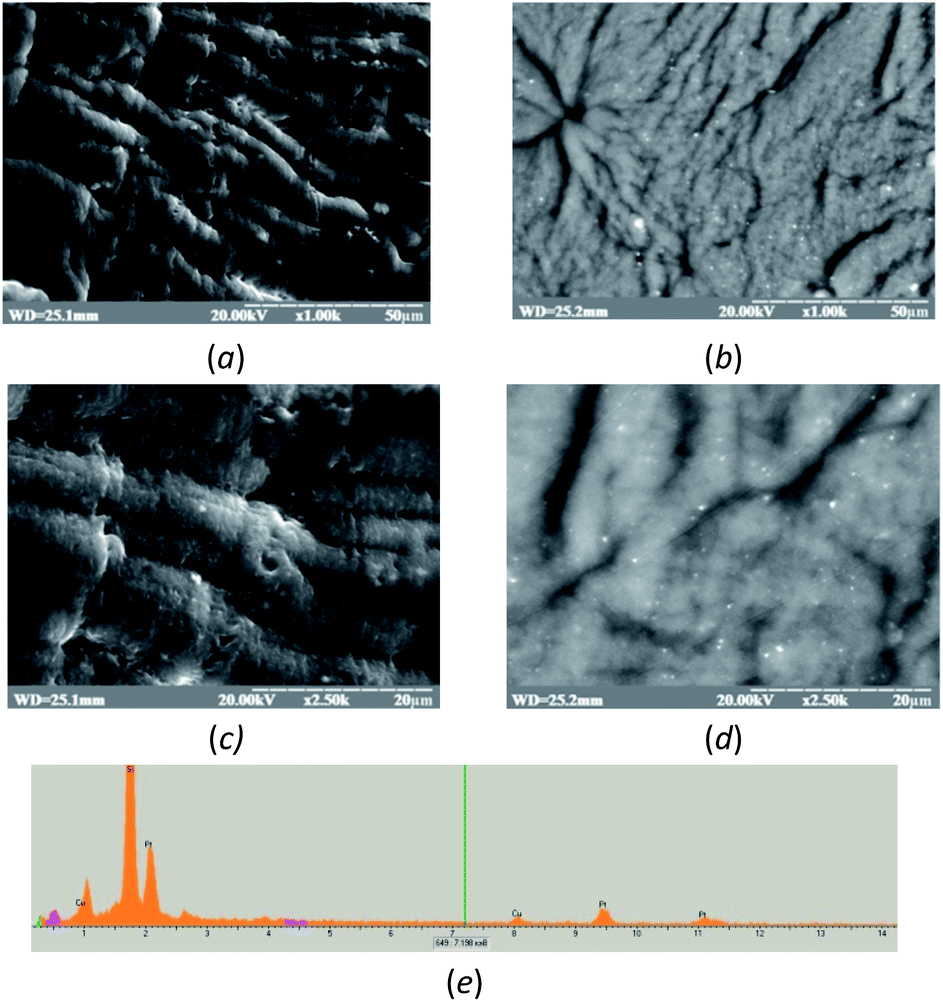 | ||
| Fig. 2 Characteristics of alginate beads encapsulated with nPtCu and AO (a–d): SEM images for ×1.000 (a and b) (scale bar 50 μm) and ×2.500 magnification (scale bar 20 μm) (c and d); X-ray spectral microanalysis (e). The accelerating voltage was 20 kV for all images. | ||
The characteristics of a developed method for ethanol assay
The proposed method is based on the reactions shown in Fig. 3. This figure represents the reactions which take place inside the alginate bead. First, the ethanol is oxidized to acetaldehyde and H2O2 under AO. The resulting H2O2 under the action of nPtCu oxidizes the TMB, forming the colored product (λmax 450 nm) in acidic medium. The final oxidized TMB is yellow colored oxidation product, yield to be directly proportional to the concentration of ethanol having the absorbance peak at 450 nm in acidic medium (data not shown).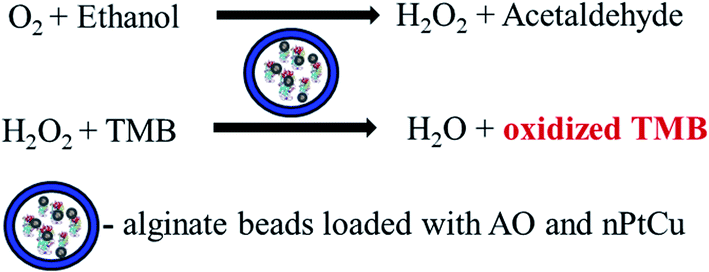 | ||
| Fig. 3 Principal scheme of the reactions for ethanol assay using nPtCu–AO/alginate beads/TMB method. | ||
For further application of the nPtCu–AO/alginate beads in analysis of ethanol, pH of phosphate buffer, temperature and TMB concentration in incubation mixture were optimized. The maximal sensitivity was shown to be under the following conditions the enzymatic reaction: 2.0 mM TMB in incubation mixture and 10 min of incubation of alginate beads with ethanol of the defined concentration in 50 mM phosphate buffer pH 7.5 (PB) at 22 °C. The optimizations of enzymatic–nanozymatic steps of the reaction were carried out too. Optimal concentrations of AO and nPtCu in one alginate bead were estimated as following: 46 mU for AO and 7 mU for nPtCu (see subdiv. «formation of nPtCu–AO/alginate beads»). Also it was shown that the nPtCu had no alcohol oxidase-like activity at experimental conditions (data not shown).
Fig. ESI 3† demonstrates the dependency of optical density (OD) of reaction mixture on concentration of H2O2 for nPtCu-loaded alginate beads. The linearity of calibration graph for H2O2 detection is from 0.01 mM to 0.1 mM with the limit of detection (LOD) 2.5 μM. Fig. 4 demonstrates the dependency of OD of reaction mixture on concentration of ethanol. In Fig. 4 the analytical response of the nPtCu–AO/alginate beads/TMB-based method to ethanol concentration ranging from 0.005 mM to 4.5 mM is shown (Fig. 4a). It is worth noting that the profile of OD at 450 nm reveals a high linear relationship with ethanol concentration ranging from 0.01 to 0.15 mM and the LOD was shown to be 3.3 μM (Fig. 4b). The analytical characteristics of nPtCu–AO/alginate beads/TMB-based method are summarized in Table 3 in relation to other enzymatic–nanozymatic methods.
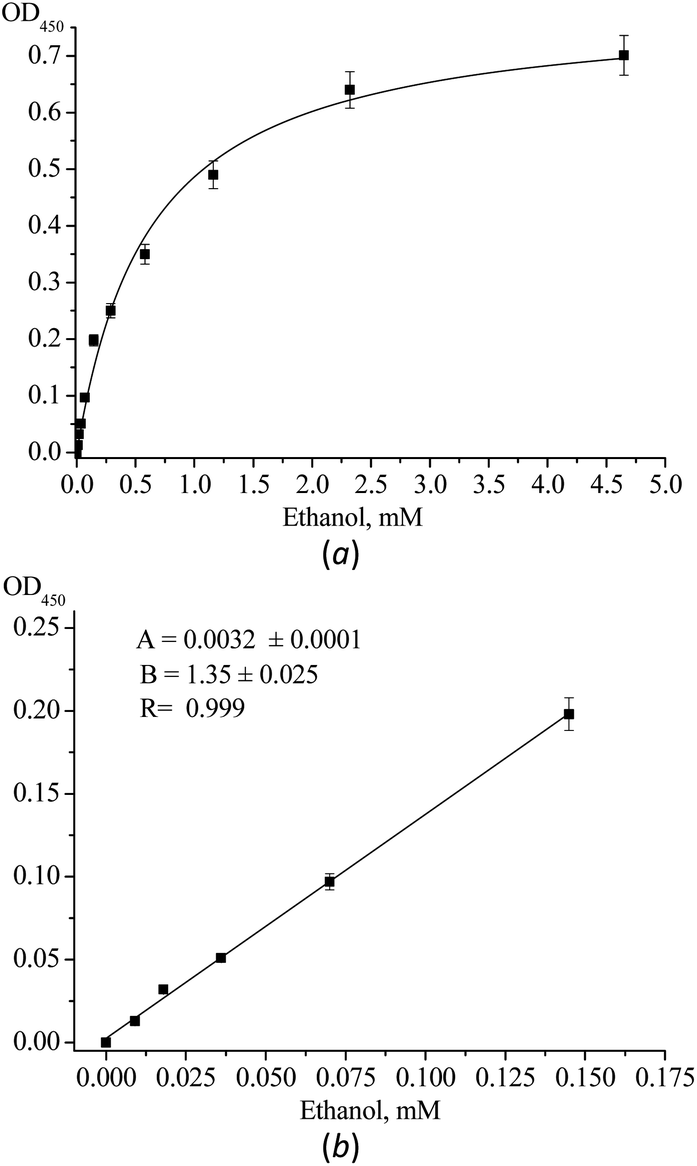 | ||
| Fig. 4 The dependence of OD of reaction mixture on the concentration of ethanol in final mixture (a) and linear calibration curve (b) for nPtCu–AO/alginate beads/TMB-based method of ethanol assay. A, B – parameters for the linear regression line; R – correlation coefficient. | ||
| Sample | Value declared by the producer, % | Method | Difference, % | |||
|---|---|---|---|---|---|---|
| “Alcotest” | CV, % | “nPtCu–AO/alginate bead” | CV, % | |||
| a CV – coefficient of variation. | ||||||
| Liquor “Aperitif”, Italy | 11 | 10.93 ± 0.50 | 4.6 | 11.43 ± 0.65 | 5.7 | +4.3 |
| Champagne “Latini Sparkling”, Germany | 8.5 | 9.03 ± 0.30 | 3.3 | 9.04 ± 0.55 | 6.0 | +0.1 |
| Wine “Aznauri”, dry red, Ukraine | 9–13 | 9.61 ± 0.40 | 4.2 | 10.04 ± 0.45 | 4.5 | +4.3 |
The sensitivity of the spectrophotometric method of ethanol assay is characterized by the slope of the regression line (B) of the calibration graph. Comparison of B values allows to appreciate the level of analyte's conversion on each stage of reaction. The level of ethanol conversion to H2O2 is 49% (Fig. ESI 3† and 4b). The main characteristics of the developed and other enzymatic-nanozyme methods of ethanol assay are summarized in Table 1.
The high selectivity is the necessary requirement for each analytic method. To study the selectivity of the developed analytical approach, different 1 mM alcohols with varying lengths and branching (methanol, ethanol, 1-propanol and 1-butanol) were tested (Fig. ESI 4†). It was shown that nPtCu–AO/alginate beads responds differently to alcohol samples and exhibits the highest response to methanol (100%) and ethanol (92%). This validates the potential of the nPtCu–AO/alginate bead-based method for ethanol assay in beverages. The developed spectrophotometric nPtCu–AO/alginate bead/TMB-based enzymatic–nanozymatic method for the quantitative analysis of ethanol is highly sensitive (see Table 1). Also selectivity to ethanol is not high, but it precisely reflects the intrinsic selectivity of AO to alcohols (Fig. ESI 4†). It is worth mentioning that the reaction between nPtCu–AO/alginate beads and TMB can also proceed at room temperature and it does not need long incubation time. This feature of the proposed method is prospective for the development of portable test system with automatic variant of ethanol assay as well as for semi-quantitative detection of ethanol level. Thus, the proposed analytical method being sensitive, low-cost and suitable for both routine and micro-volume formats, will be promising for using in clinical diagnostics and ethanol assay in food products or beverages.
Repeatability of analysis and stability of the nPtCu–AO/alginate beads
The repeatability of assay using a single alginate bead loaded with nPtCu and AO was investigated by successively detecting 1.0 mM ethanol for 5 times. The relative standard deviation (RSD) was 4.33%, indicating a good repeatability. Storage stability of alginate beads was investigated by every day monitoring its response to 1 mM ethanol concentration. The one alginate beads retained 56% of their initial response even after 4 days of storage at room temperature, indicating its good storage stability in 10 mM CaCl2.Assay of ethanol in real samples
Determination of ethanol concentration in beverages is an accidental request to forensic laboratories. We have reported earlier about the development of AO-based method for ethanol analysis by the amperometric biosensors.35–37 In order to demonstrate the practical feasibility of the proposed enzymatic–nanozymatic method, contents of ethanol were determined in beverages using SAT method. Estimation of ethanol in the initial sample from the parameters of linear regression was done, taking into account factors of dilution (eqn (1)); calculation of the average concentration from values for two dilutions of the sample:
 | (1) |
 | ||
| Fig. 5 Assay of ethanol by nPtCu–AO/alginate beads/TMB-based method in samples of liquor “Aperitif” (a), champagne “Latini Sparkling” (b), and dry red wine “Aznauri” (c) using SAT calibration method. A, B – parameters for the linear regression line; N – dilution factor; C – calculated initial concentration of ethanol; R – correlation coefficient. | ||
The average contents of the ethanol determined by the developed spectrophotometric method and the reference method are presented in Table 3. The differences less than 5% between the results of both methods were observed.
The concentrations of the tested ethanol, estimated using two methods, have a strong (R = 0.987) correlation (Fig. ESI 5†).
Therefore, the developed nPtCu–AO/alginate bead-TMB-based method can be successfully used for ethanol assay in alcoholic beverages. The reproducibility of the proposed analytical method is satisfactory: the coefficients of variation are less than 7% (Table 3).
Experimental
Reagents
Cerium(III) chloride (CeCl3), ascorbic acid, chloroplatinic acid (H2PtCl6), copper(II) sulfate (CuSO4), palladium chloride (PdCl3), sodium borohydride (NaBH4), cetrimonium bromide (CTAB), o-dianisidine, hydrogen peroxide (H2O2, 30%), iron(III) chloride (FeCl3 × 4H2O), gold(III) chloride solution (HAuCl4), calcium(II) chloride (CaCl2), alginic acid, ethanol, methanol, propanol, 1-butanol and all other reagents and solvents used in this work were purchased from Sigma-Aldrich (Steinheim, Germany). All reagents were of analytical grade and were used without further purification. All solutions were prepared using ultra-pure water obtained with the Milli-Q® IQ 7000 Water Purification system (Merck KGaA, Darmstadt, Germany).Synthesis of nanozymes by the chemical reduction method
Nanozymes (NZs) were synthesized by the chemical reduction of metal ions from appropriate salts using CTAB and ascorbic acid (AA) according to the schemes which were reported by us recently with some modifications.38 The conditions of synthesis, which were chosen experimentally, are presented in Table ESI 1.†Briefly: mixture 1, containing solutions of salt #1 and CTAB, was vigorously stirred for 5 min at 20 °C and after AA adding, it was heated at 100 °C during 10 min. Mixture 2, containing the heated mixture 1, salt #2 and AA, was heated at 100 °C during 10 min and then stirred for 15 min at 20 °C. To obtain tri-metal NZs, salt #3 was added to the heated mixture 2, stirred and heated during 15 min.
The synthesized NZs were collected by centrifugation at 16![[thin space (1/6-em)]](https://www.rsc.org/images/entities/char_2009.gif) 000 rpm for 40 min (Hettich Micro-22R centrifuge), washed twice with water, and precipitated by centrifugation. Pellets were suspended in 1.0 mL water and stored until use at +4 °C.
000 rpm for 40 min (Hettich Micro-22R centrifuge), washed twice with water, and precipitated by centrifugation. Pellets were suspended in 1.0 mL water and stored until use at +4 °C.
Synthesis of nanozymes by chemical bath deposition method
The core–shell CuCe and CoCu NZs on zinc plate substrate were synthesized by chemical bath deposition method. It includes preparation of an aqueous bath containing 0.1 M solution of salts, namely, copper(II) sulphate or cobalt(II) chloride with the addition of aqueous NH3 solution (28%) under constant stirring at room temperature with resultant pH ∼ 12. For this aim, the well cleaned Zn plate substrate was placed in reaction bath at room temperature for 20 h resulting in the direct growth of metallic nanoparticles on Zn substrate. After that, 0.1 M cerium(III) chloride (for synthesis of CuCe) or 0.1 M copper(II) sulphate (for synthesis of CoCu) was added to the reaction bath and stayed during 20 hours at room temperature. Then, the produced NPs were washed from the surface of the Zn plate and were collected by centrifugation under 16000g for 40 min (Hettich Micro-22R centrifuge), washed twice with water, and precipitated by centrifugation. Pellets were suspended in 1.0 mL water and stored until use at +4 °C.
For the formation of core–shell–shell NZs, CuCeAu and CoCuCe, the previously synthesized thin films (CuCe or CoCu) onto Zn substrate was vertically dipped into beaker containing 0.01 M cerium(III) chloride or hydrogentetrachloroaurate solution in 28% of NH3 making an angle of 45° with the wall of beaker. The reaction baths maintained at room temperature for 1 day. The resulting CuCeAu and CoCuCe were washed several times with water, dried in air atmosphere and used for further characterization.
Formation of nPtCu–AO/alginate beads
nPtCu (0.09 mL, 3.4 U mg−1, concentration 1 mg mL−1) and AO (0.03 mL, 70 U mL−1) were thoroughly mixed with 1 mL 2.5% algic acid. The aliquots of mixture (0.025 mL) were injected into a solution of 0.3 M CaCl2 at a flow rate of 5 mL min−1. The obtained nPtCu–AO-impregnated alginate beads were formed via gelation. Gelation occurs immediately upon the contact of the alginate and Ca2+, forming homogeneous spherical beads with an average diameter of 2.5 mm. The resulting beads were washed with 10 mM CaCl2 three times. The obtained composite alginate beads were stored in 10 mM CaCl2 till usage. For analysis of ethanol in each test tube one of such prepared bead was taken. The produced Ca-alginate beads were chosen for further investigation.The principal scheme of the formation of the Ca-alginate beads with incorporated nPtCu and AO is presented on the Fig. 6.
 | ||
| Fig. 6 The principal scheme of the formation of the Ca-alginate composite beads. | ||
Morphological analysis of NZs by scanning electron microscopy (SEM)
Morphological analyses of the samples were performed using a SEM microanalyzer (REMMA-102-02, Sumy, Ukraine). The samples in different dilutions were dropped onto the surface of a silicon wafer and were dried at room temperature. The samples in different dilutions (2 μL or one alginate bead) were dropped onto the surface of a silicon wafer and were dried at room temperature. The distance from the last lens of the microscope to the sample (WD) ranged from 24 mm to 25 mm, respectively. The accelerator voltage was 20000 kV.
Determination of peroxidase-like activity of NZs in solution
The PO-like activity of the NZs was measured by the colorimetric method, with o-dianisidine (o-DZ) as a chromogenic substrate in the presence of H2O2 according the procedure described early by us.35 The generated color was determined at 525 nm using a Shimadzu UV1650 PC spectrophotometer (Kyoto, Japan). One unit (U) of PO-like activity was defined as the amount of NZs converting 1 μmol o-DZ into the colored product per 1 min at 30 °C under standard assay conditions. The specific PO-like activity was expressed in μmol min−1·mg−1 of NZ and calculated using the following formula:
 | (2) |
Estimation of kinetic parameters
The Michaelis–Menten constants (KM) and maximum velocity (Vmax) for the oxidation of o-DZ in the presence of H2O2 and the NZ at room temperature were determined by measuring the activity rates (under the assay conditions) at substrate concentrations ranging from 0–50 mM H2O2 with a fixed concentrations of o-DZ (0.017 mM) and NZ (in incubation mixture) in 0.05 M acetate buffer, pH 4.5. The values of kcat were calculated by the formula: kcat = Vmax/CNZ, where CNZ is the concentration of NZ in incubation mixture, mg mL−1. Because, of difficulty to determine the concentration of NZs in mM units, but only in mass units (mg mL−1), the dimension of kcat is expressed in s−1 μmol mg−1.Determination of the substrate specificity for NZ
The substrate specificity to the chromogenic substrates in a two-substrate reaction in the presence of H2O2 was examined. As organic substrates ABTS, 4-AAP, guaiakol, TMB and o-DZ were used. To study the activity of NZ in solution, an aliquot of NZ and the tested organic substrate in the presence of H2O2 was incubated for a fixed time in 50 mM acetate buffer, pH 4.5. The analysis of pseudo PO-activity was done according to the procedure described in subdiv. “determination of peroxidase-like activity of NZs in solution”.Isolation and purification of AO
AO (EC 1.1.3.13) was isolated from the cells of the selected AO-overproducing strain Ogataea (Hansenula) polymorpha C-105. Cell-free extract was fractionated by an ammonium sulfate, then electrophoretically homogeneous enzyme was obtained by ion exchange chromatography on DEAE-Toyopearl 650 M.39–41 Activity of AO was determined by the rate of hydrogen peroxide formation in reaction with methanol as monitored by the peroxidative oxidation of o-DZ in the presence of PO. Purified AO with specific activity 20 U mg−1 of protein was kept as suspension in 70% ammonium sulfate, 50 mM phosphate buffer, pH 7.5 (PB).The development of nPtCu–AO/alginate bead/TMB-based method for ethanol assay
Calibration for ethanol was carried out in the following way: 0.230 mL ethanol standard solution with concentration from 0.001% to 1.25% in PB was mixed in glass tube with one alginate bead and incubated at room temperature during 10 min. Resulted solution was supplemented in each test tube with 1 mL 2.5 mM TMB in PB. The reaction mixture was incubated at room temperature during 2 min followed by the addition of 0.5 mL 0.8 M HCl and the resulted mixture was detected spectrophotometrically at 450 nm. The dependencies of absorbance for the resulted TMB oxidized products on ethanol concentration were studied. The corresponding calibration graphs were built. Each experiment was repeated for 3 times.Ethanol assay in real samples of beverages
The samples of wine “Aznauri”, dry red (PJSC “Odessainprom”, Ukraine), liquor “Aperitif” (Campari, Italy) and champagne “Latini Sparkling” (Peter Mertes, Germany) were used for ethanol analysis. All samples were diluted stepwise by 50 mM PB. All samples were analyzed using a standard addition test (SAT). Each assay was performed for two dilutions of the sample and repeated 3 times.Reference method for ethanol determination
Ethanol assay was carried out using enzymatic analytical kit “Alcotest” by the measurement of the colored product formation in peroxidative oxidation of chromogen by H2O2 generated from ethanol in AO reaction.35 Because of a high sensitivity of the method, the “fixed reaction time” was used at the incomplete conversion of analyte.Statistic analysis
All the measurement's results and the level of correlation between results obtained by the different analytical methods were calculated by computer program Origin 8.5 Pro and Microsoft Excel.Conclusions
A number of metal-based composite nanoparticles were obtained using the two chemical methods, in particular, reduction from the inorganic salts and bath deposition on plate. The morphological properties, catalytic parameters (KM, Vmax, kcat) and selectivity to different chromogenic substrates were studied for the synthesized NZs with the highest specific activities.Novel colorimetric method based on alginate beads encapsulated with nPtCu and AO have been developed and optimized. The proposed method exhibits a high sensitivity to ethanol, broad linear range (10–150 μM), low detection limit (3.3 μM), satisfactory storage stability and repeatability. The developed method was tested on the real samples of alcoholic beverages. High correlation of the obtained results and the reference enzymatic method was demonstrated.
Funding
This research was partially supported by the National Research Foundation of Ukraine (project no. 2020.02/0100 “development of new nanozymes as catalytic elements for enzymatic kits and chemo/biosensors”), National Academy of Sciences of Ukraine: the programs: “smart sensor devices of a new generation based on modern materials and technologies” and “double-acting anticancer drugs to overcome the acquired resistance of malignant cells to chemotherapy” (0122U200211), grant “new dual casein kinase 2 inhibitors and histone deacetylase for targeted tumor chemotherapy” for research laboratories/groups of young scientists in priority areas of science and technology in 2021–2022, and Ministry of Education and Science of Ukraine (projects no. 0120U103398, 0121U109539, 0122U000874 and 0121U109543).Author contributions
Nataliya Stasyuk, Demkiv Olha, Galina Gayda: investigation, validation, writing – original draft; Roman Serkiz, Taras Kavetskyy: visualization. Oksana Zakalska, Andriy Zakalskiy: methodology, formal analysis, visualization. Mykhailo Gonchar: conceptualization, supervision, writing - review & editing, project administration, funding acquisition, resources.Conflicts of interest
There are no conflicts to declare.References
- B. Kuswandi, T. Irmawati, M. A. Hidayat, J. Jayus and M. Ahmad, Sensors, 2014, 14, 2135–2149, DOI:10.3390/s140202135.
- P. Puligundla, D. Smogrovicova, C. Mok and V. S. R. Obulam, Renewable Energy, 2019, 133, 1366–1379, DOI:10.1016/j.renene.2018.06.062.
- A. Dasgupta, Chapter 1 – Alcohol: Pharmacokinetics, Health Benefits With Moderate Consumption and Toxicity, Critical Issues in Alcohol and Drugs of Abuse Testing, ed. A. Dasgupta, Academic Press, 2nd edn, 2019, pp. 1–16, DOI:10.1016/B978-0-12-815607-0.00001-0.
- F. Al-Taher, in Halal Food Production, ed. M. N. Riaz and M. M. Chaudry, CRC Press, Boca Raton, FL, USA, 2004, p. 379 Search PubMed.
- B. E. Leonard, Alcohol Alcohol., 1986, 21, 325–338 CAS . PMID: 2434114..
- M. N. Riaz and M. M. Chaudry, Alcohol: The Myths and Realities, in Handbook of Halal and Haram Products, Publishing Centre of American Muslim Research & Information, Richmond Hill, NY, USA, 1997, p. 16, https://www.routledgehandbooks.com/, DOI:10.1201/9781315119564-3.
- M. A. A. Halim, M. M. M. Salleh, M. I. A. M. Kashim, A. A. Ahmad and N. Nordin, Int. J. Asian Soc. Sci., 2014, 4(12), 1176–1190 Search PubMed , https://archive.aessweb.com/index.php/5007/article/view/2709.
- A. Tangerman, Clin. Chem., 1997, 43, 1003–1009 CrossRef CAS . PMID: 9191553..
- L. M. Avila, A. D. Santos, D. I. Mançano de Mattos, C. Gimenes de Souza, D. Andrade and L. d'Avila, Fuel, 2018, 212, 236–239, DOI:10.1016/j.fuel.2017.10.039.
- M. Sriariyanun, P. Mutrakulcharoen, S. Tepaamorndech, K. Cheenkachorn and K. Rattanaporn, Orient. J. Chem., 2019, 35(2), 744–750 CAS.
- O. M. Istrate, L. Rotariu and C. Bala, Sensors, 2021, 21(19), 6510, DOI:10.3390/s21196510.
- S. Sivashankar, N. S. Kumar and K. R. N. Mazumder, Int. J. Pharm. Sci. Rev. Res., 2020, 65(1), 68–82, DOI:10.47583/ijpsrr.2020.v65i01.010.
- S. Alpat and A. Telefoncu, Sensors, 2010, 10(1), 748–764, DOI:10.3390/s100100748.
- H. R. Zare, N. Nasirizadeh, S. M. Golabi, M. Namazian, M. M. Ardakani and D. Nematollahi, Sens. Actuators, B, 2006, 114, 610–617, DOI:10.1016/j.snb.2005.06.013.
- F. Tian and G. Zhu, Sens. Actuators, B, 2004, 97, 103–108, DOI:10.1016/j.snb.2003.08.002.
- A. Malinauskas, T. Ruzgas, L. Gorton and L. T. Kubota, Electroanalysis, 2000, 12, 194–198, DOI:10.1002/(SICI)1521-4109(200002)12:3<194::AID-ELAN194>3.0.CO;2-6.
- S. R. Chinnadayyala, M. Santhosh, N. K. Singh and P. Goswami, Biosens. Bioelectron., 2015, 69, 155–161, DOI:10.1016/j.bios.2015.02.015.
- M. Das and P. Goswami, Bioelectrochemistry, 2013, 89, 19–25, DOI:10.1016/j.bioelechem.2012.08.007.
- A. M. Azevedo, D. M. Prazeres, J. M. Cabral and L. P. Fonseca, Biosens. Bioelectron., 2005, 21(2), 235–247, DOI:10.1016/j.bios.2004.09.030.
- N. Stasyuk, O. Smutok, O. Demkiv, T. Prokopiv, G. Gayda, M. Nisnevitch and M. Gonchar, Sensors, 2020, 20, 4509, DOI:10.3390/s20164509.
- S. Sanjay, Front. Chem., 2019, 7, 1–10, DOI:10.3389/fchem.2019.00046.
- M. Liang and X. Yan, Acc. Chem. Res., 2019, 52(8), 2190–2200, DOI:10.1021/acs.accounts.9b00140.
- J. I. Reyes-De-Corcuera, H. E. Olstad and R. García-Torres, Annu. Rev. Food Sci. Technol., 2018, 9, 293–322, DOI:10.1146/annurev-food-030216-025713.
- W. Dong, Y. Zhuang, S. Li, X. Zhang, H. Chai and Y. Huang, Sens. Actuators, B, 2018, 255(2), 2050–2057, DOI:10.1016/j.snb.2017.09.013.
- M. Liang and X. Yan, Acc. Chem. Res., 2019, 52(8), 2190–2200, DOI:10.1021/acs.accounts.9b00140.
- S. R. Ahmed, G. A. Ortega, S. Kumar, S. Srinivasan and A. R. Rajabzadeh, New J. Chem., 2022, 46, 1194–1202, 10.1039/D1NJ03648C.
- L. Feng, Y. Gong, Y. Cao, Y. Deng, S. Liang, X. Tian, H. Gu and J.-J. Yin, Nanoscale Adv., 2020, 2, 1583–1589, 10.1039/D0NA00002G.
- M. I. Kim, J. Shim, H. J. Parab, S. C. Shin, J. Lee and H. G. Park, J. Nanosci. Nanotechnol., 2012, 12(7), 5914–5919, DOI:10.1166/jnn.2012.6375.
- S. Wang, H. Yan, Y. Wang, N. Wang, Y. Lin and M. Li, Microchim. Acta, 2019, 186, 738, DOI:10.1007/s00604-019-3826-6.
- Y. Zhang, Q. Liu, C. B. Ma, Q. Wang, M. Yang and Y. Du, Theranostics, 2020, 10(11), 5064–5073, DOI:10.7150/thno.42601.
- N. Stasyuk, G. Gayda, A. Zakalskiy, O. Zakalska, R. Serkiz and M. Gonchar, Food Chem., 2019, 285, 213–220, DOI:10.1016/j.foodchem.2019.01.117.
- S. R. Chinnadayyala, A. Kakoti, M. Santhosh and P. Goswami, Biosens. Bioelectron., 2014, 55, 120–126, DOI:10.1016/j.bios.2013.12.005.
- S. R. Chinnadayyala, M. Santhosh, N. K. Singh and P. Goswami, Biosens. Bioelectron., 2015, 69, 155–161, DOI:10.1016/j.bios.2015.02.015.
- S. Cinti, M. Basso, D. Moscone and F. Arduini, Anal. Chim. Acta, 2017, 960, 123–130, DOI:10.1016/j.aca.2017.01.010.
- M. V. Gonchar, M. M. Maidan, H. M. Pavlishko and A. A. Sibirny, Food Technol. Biotechnol., 2001, 39, 37–42 CAS . https://www.ftb.com.hr/archives/103-volume-39-issue-no-1/743-a-new-oxidase-peroxidase-kit-for-ethanol-assays-in-alcoholic-beverages.
- O. Smutok, B. Ngounou, H. Pavlishko, G. Gayda, M. Gonchar and W. Schuhmann, Sens. Actuators, B, 2006, 113, 590–598, DOI:10.1016/j.snb.2005.07.055.
- O. Demkiv, N. Stasyuk, R. Serkiz, G. Gayda, M. Nisnevitch and M. Gonchar, Appl. Sci., 2021, 11, 777, DOI:10.3390/app11020777.
- N. Stasyuk, G. Gayda, T. Kavetskyy and M. Gonchar, RSC Adv., 2022, 12, 2026–2035 RSC . https://pubs.rsc.org/en/Content/ArticleLanding/2022/RA/D1RA08127F.
- M. V. Gonchar, G. P. Ksheminska, N. M. Hladarevska and A. A. Sibirny, Catalaseminus mutants of methylotrophic yeast Hansenula polymorpha impaired in regulation of alcohol oxidase synthesis, in Genetics of respiratory enzymes in yeasts Wroclaw, ed. T. M. Lachowicz, Wroclaw University Press, 1990, pp. 222–228 Search PubMed.
- S. V. Shleev, G. P. Shumakovich, O. V. Nikitina, O. V. Morozova, H. M. Pavlishko, G. Z. Gayda and M. V. Gonchar, Biochemistry, 2006, 71(3), 245–250, DOI:10.1134/S0006297906030035.
- O. V. Lebedeva, N. N. Ugarova and I. V. Berezin, Biokhimiia, 1977, 42(8), 1372–1379 CAS . PMID: 20989..
Footnote |
| † Electronic supplementary information (ESI) available. See https://doi.org/10.1039/d2ra02106d |
| This journal is © The Royal Society of Chemistry 2022 |