DOI:
10.1039/D2RA02057B
(Paper)
RSC Adv., 2022,
12, 11658-11664
Chains or rings? Polymorphism of an isoniazid derivative derivatized with diacetone alcohol†
Received
31st March 2022
, Accepted 3rd April 2022
First published on 14th April 2022
Abstract
Isoniazid was derivated with diacetone alcohol in a Schiff-base reaction in order to yield N′-[(2E)-4-hydroxy-4-methylpentan-2-ylidene]pyridine-4-carbohydrazide. The resulting product was determined to be polymorphic, exhibiting two crystal forms: form I and form II. From the crystal structure determination using SC-XRD it was determined that form I crystalizes in the C2/c space group while form II crystalizes in the P21/c space group. The hydrogen bonding patterns of both forms are distinctively different from each other: form I forms a chain hydrogen bond motif by forming a hydrogen bond between the hydroxyl group and the oxygen of the amide group while form II forms dimers with a ring hydrogen bond motif forming between the hydroxyl group and the pyridine group. From DSC analysis form I and form II are enantiotropically related, with form I converting to form II at 132.3 °C before melting at 142.3 °C. Based on both experimental and computational evidence, we conclude that form I is a metastable form, with form II being the most stable form. This is another case of a “disappearing polymorph.”
1 Introduction
Polymorphism is the phenomenon where a compound can exist in more than one crystal structure.1,2 Many APIs have been determined to be polymorphic, with the number of known polymorphic forms being dependent on the time and effort used to search for more forms. For APIs, properties such as solubility, dissolution rate, appearance, etc.3,4 can differ between different polymorphs. For pharmaceuticals this becomes significant. On one hand it is possible to obtain a new polymorph with better properties than the older known form.5,6 On the other hand, the appearance of a new polymorph can be detrimental, such as the case of Ritonavir, where the new form was thermodynamically more stable than the original form with poorer physicochemical properties that led to Abbott withdrawing the drug from the market and losing millions of dollars in the process. Therefore, for new and existing APIs the need to adequately screen for polymorphs and characterize them becomes crucial for the success of an API entering the market.
Isoniazid, an anti-bacterial often combined with p-aminosalicylic acid and streptomycin, is used as an effective treatment for tuberculosis (TB).7 Isoniazid itself is a fairly simple drug molecule consisting of primarily an amide, a pyridine and a hydrazine group. Only until recently was isoniazid considered to be monomorphic, with at least three forms reported in total so far.8 The first and most stable crystal structure of isoniazid consists of a series of interconnected N–H⋯N hydrogen bonds that form a spiral-type structure.9,10 These interactions can be reduced by changing the primary amine to either a secondary amine or to an imine.11–17 This effectively could leave the amide group as the only strong hydrogen bond donor, and thus could possibly allow one to design co-crystals with more robust intermolecular interactions involving the pyridine ring.18 These hydrazine derivatives of isoniazid also tend to be polymorphic.11,19–21 From a crystal engineering perspective, this offers two significant advantages: the first being better control over the hydrogen bond pairs (and thus also gives greater degree of predictability and ease of control),22,23 and two, properties which are further tuneable by selecting the polymorph with better physicochemical properties or stability. Together with the possibility of improving the inherent bioavailability of isoniazid, the advantages of derivatizing isoniazid should prove advantageous.
The title compound N′-[(2E)-4-hydroxy-4-methylpentan-2-ylidene]pyridine-4-carbohydrazide (iz4h4m2p, see Scheme 1) was synthesized by reacting isoniazid with diacetone alcohol (4-hydroxy-4-methyl-2-pentanone, 4h4m2p) in a Schiff-base reaction. iz4h4m2p was first reported in a previous work in a cocrystal with 4-tert-butylbenzoic acid24 but the crystal structure of iz4h4m2p by itself had not been reported. 4h4m2p was used due to the presence of the hydroxyl group, which could possibly allow the formation of an intramolecular hydrogen bond between the hydroxyl group and amide, while the remainder of the aliphatic backbone could be used to increase the lipophilic character of isoniazid, which has been an approach used to improve isoniazid.25 We wanted to explore the potential of a Schiff-base derivatised form of isoniazid with varying functional groups to expand the range of potential coformers that could be used for different crystal engineering purposes. This required an understanding of the intermolecular interactions present in the pure form of iz4h4m2p in a crystal structure. In an effort to characterize said structure, it was discovered that this compound was polymorphic. Hence, the objective of this work was to explore the polymorphism of this compound using traditional screening methods. Two polymorphic forms of iz4h4m2p were discovered, which were then characterized by SC-XRD, PXRD, DSC and FTIR.
 |
| | Scheme 1 Schiff-base reaction of isoniazid with 4h4m2p to form iz4h4m2p. | |
2 Experiment
2.1 Materials
All materials were purchased from Sigma-Aldrich, and were used as is without further purification.
2.2 General procedure for synthesis of iz4h4m2p
A general method of obtaining iz4h4m2p is given as follows: 0.250 g of isoniazid (1.82 mmol) was dissolved in 10 mL of ethanol (absolute). A few drops (0.5 mL) of 4h4m2p was added to this mixture. This solution was refluxed for 18 h, after which it was transferred to vial, which was kept loosely open. Crystals of were grown from this mixture after several days. The different methods used to obtain the different crystal forms is given in the results and discussion.
2.3 General procedures for characterization methods
Powder X-ray diffraction (PXRD). Powder X-ray diffraction is used to determine the bulk phase purity of each sample. PXRD data for all forms were measured at 293 K on a Bruker D2 Phaser diffractometer which employs a sealed tube Co X-ray source (λ = 1.78896 Å), operating at 30 kV and 10 mA, and LynxEye PSD detector in Bragg–Brentano geometry. Powder patterns for both forms is present in the ESI,† where the experimentally measured pattern is compared to the calculated patterns obtained from the SC-XRD data (Fig. 1).
 |
| | Fig. 1 Ortep diagram of form I. Atomic numbering used is the same for both forms. | |
Single crystal X-ray diffraction (SC-XRD). The Bruker D8 VENTURE PHOTON CMOS 100 area detector diffractometer, equipped with a graphite monochromated MoKα1 (λ = 0.71073 Å) sealed tube (50 kV, 30 mA), was used to collect all the intensity data. Crystal structures were determined at 173 K and to achieve satisfactory thermal ellipsoids. The program SAINT+, vers. 6.02 was used to integrate the data and the program SADABS27 was used to make empirical absorption corrections. Space group assignments were made using XPREP26 on all compounds. In all cases, the structures were solved in the WinGX28 Suite of programs by intrinsic phasing using SHELXT29 and refined using full-matrix least-squares/difference Fourier techniques on F2 using SHELXL.29 All non-hydrogen atoms were refined anisotropically. All carbon-bound hydrogen atoms were placed at idealized positions and refined as riding atoms with Uiso parameter 1.2 or 1.5 times those of their parent atoms. Nitrogen-bound and oxygen-bound hydrogen atoms were located in the difference Fourier map and their coordinates and isotropic displacement parameters refined freely. Diagrams and publication material were generated using ORTEP-3![[thin space (1/6-em)]](https://www.rsc.org/images/entities/char_2009.gif) 30 and MERCURY.31 The crystallographic information can be found in the ESI in Table S1.†
30 and MERCURY.31 The crystallographic information can be found in the ESI in Table S1.†
Hirshfeld surface analysis. Hirshfeld surface analysis is a computational method that can be used to explore intermolecular interactions in molecular crystals that are weaker than hydrogen bonds, as well as to determine the ‘shape’ of molecular fragments, which are key to understanding the overall packing. The figures and fingerprint plots presented in this work were generated using Crystal Explorer 17.5.32 All images were generated using a high (standard) resolution.
FTIR analysis. FTIR spectra was collected using the Bruker Alpha II model equipped with the Eco-ATR sampling module. Background noise was subtracted and small amount of the sample of interest was placed onto the ATR crystal. Spectra were measured from 600 to 4000 cm−1 range, resolution 4 cm−1 with 24 scans per sample. Spectra were collected using the ATR-FTIR in a room with air conditioning set at 22 °C. After spectral acquisition the ATR crystal was cleaned using isopropanol.
Differential scanning calorimetry (DSC). Differential scanning calorimetry data were collected using a Mettler Toledo DSC 3 with aluminium pans under nitrogen gas (flow rate = 10 mL min−1). Exothermic events were shown as peaks. Samples were heated and cooled to determine melting points as well as any additional phase transitions. The temperature and energy calibrations were performed using pure indium (purity 99.99%, m.p. 156.6 °C, heat of fusion: 28.45 J g−1) and pure zinc (purity 99.99%, m.p. 479.5 °C, heat of fusion: 107.5 J g−1). Samples were heated to 250 °C from 25 °C before being cooled back down at 25 °C at a heating or cooling rate of 10 °C min−1 or 40 °C min−1.
Hot stage microscopy. Hot stage microscopy was done on an Olympus SZ61 equipped with a Kofler hot bench. Images were captured using an Olympus EP50 camera. Various heating and cooling techniques were applied to capture the phase transitions.
Calculations. Intermolecular energies at 0 K of form I and II were calculated using PIXEL33,34 as incorporated in the August 2014 version of the CLP35 package. The calculations were carried out as described within the CLP manual. The calculation was initialized by geometrically normalizing bonds involving H to neutron distances within CLP, followed by the calculation of an ab initio MP2/6-31G(d,p) molecular electron density using Gaussian-09 (ref. 36) revision E.01. This molecular electron density description was then used as input by PIXEL to carry out the calculations.Intramolecular energy DFT calculations for the molecules in form I and II were computed at the M06-2X-6-311G(d,p)37 level at 0 K in the gas phase using Gaussian-09. Grimme dispersion corrections (D3) were applied to all calculations.38 In the calculations, the molecular geometry (angles and torsion angles) derived from the crystal coordinates for all atoms (except hydrogens) were kept frozen but bond lengths allowed to optimise, while H atom positions were allowed to fully optimize.
3 Results and discussion
3.1. Obtaining form I and form II
During our investigation, our initial goal was to find an optimal method for the synthesis iz4h4m2p. From our initial batches we obtained form I. This was obtained using the method described above, with crystals obtained from slow evaporation of the reaction mixture. This procedure was repeated using the exact same method when form II was discovered. However, we failed to obtain form I again using this procedure. To try overcome this, several different methods were deployed. One of the first was to recrystallize form I using different solvents in a slow evaporation method. The solvents used included acetonitrile, methanol, dichloromethane, isopropanol and n-propanol. However, these attempts failed as we obtained form II each time. Another attempt included altering the reaction conditions. This included changing the solvent, altering the amount of 4h4m2p (for example, using 1.03 mmol of 4h4m2p with 1.82 mmol of isoniazid using the same synthesis procedure), reaction times (from 2 hours to 48 hours), temperatures (doing room temperature reactions to reflux) etc. Despite all this, we still exclusively obtained form II. From these experiments we conclude that form I is the metastable form, whose formation was kinetically favoured and is a chance discovery, while form II is the most stable form. Despite this, we were still able to isolate enough to characterize form I by the methods described above. To further confirm the stability, we used slurry methods where we mixed equal masses (0.050 g) of each form I and form II with 0.5 mL of hexane. The resulting powder consisted of purely form II, with no trace of form I. Even in our attempts at seeding form I, where powders of form I added to a supersaturated solution of iz4h4m2p (from form II), showed the conversion of form I to form II.
We also attempted to obtain more polymorphic forms using sublimation experiments. Both crystals of form I and form II were used in sublimation experiments. These experiments involved heating crystals at around 130–140 °C on a Kofler hot bench. Unfortunately the crystals obtained from these experiments were that of isoniazid, which indicates that at high temperatures iz4h4m2p is unstable and may be prone to reversing the Schiff base reaction (see Scheme 1, we assume water vapor in the atmosphere allowed this reaction to occur).
3.2. Crystal structures of form I and form II
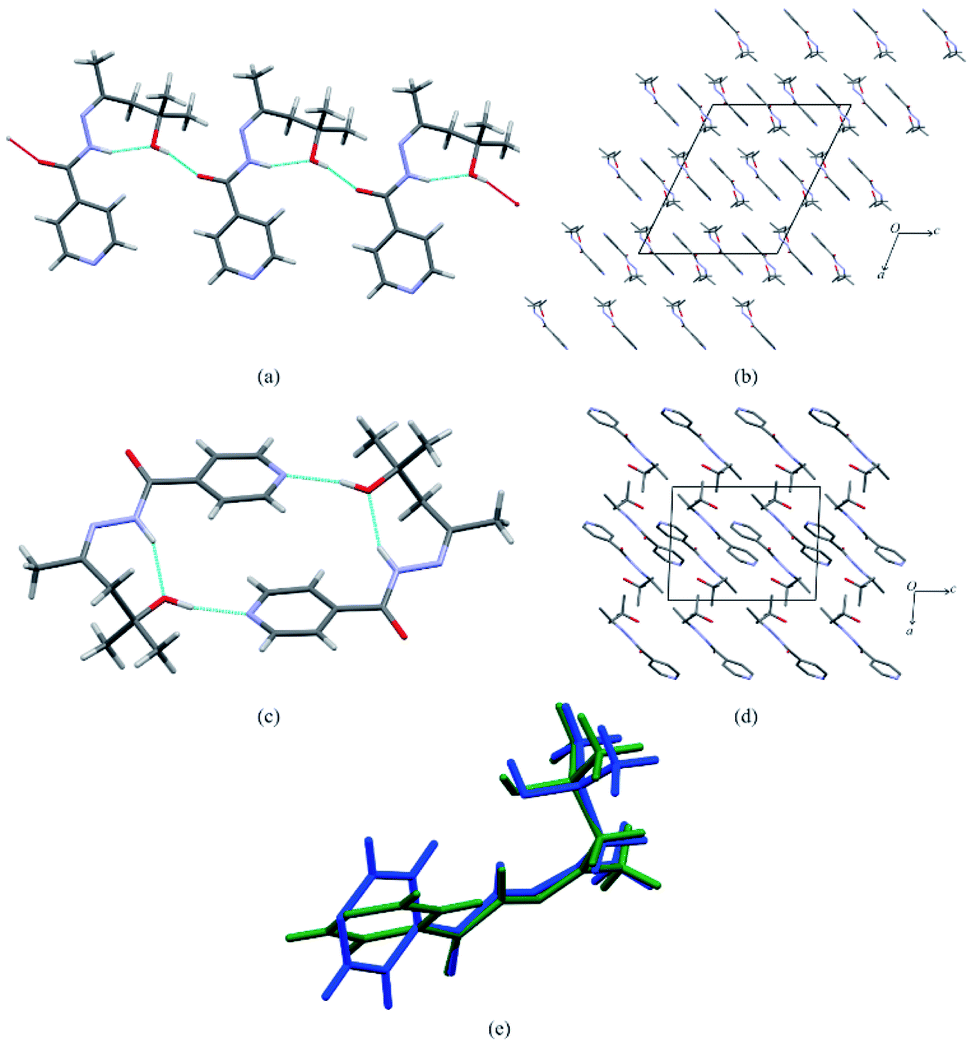
Form I formed colourless blocks while form II formed as colourless plates. Form I crystalizes in the C2/c space group while form II crystalizes in the P21/c space group. For both crystal structures, the amide group forms an intramolecular hydrogen bond to the hydroxyl group (N2–H2A⋯O2). Apart from this, the hydrogen bonding for both crystal structures differs significantly. In form I a hydrogen bond forms between the hydroxyl group to the oxygen atom of the amide group (O2–H2B⋯O1), forming a chain hydrogen bond motif C22(6) (see Fig. 2a). It should be noted that in form I, the pyridyl nitrogen (N1) is not involved in any strong hydrogen bonding. Form II on the other hand forms a ring based hydrogen bond motif R33(18), with the hydroxyl group forming a hydrogen bond to the pyridal nitrogen (N1). This effectively forms dimers (see Fig. 2c). In the case of form II, the amide N–H group or the hydroxyl group does not form a strong hydrogen bond to the oxygen of the amide group (O1). iz4h4m2p also exhibits conformational polymorphism, which is most notable due to the different torsional angle of the pyridyl ring (Fig. 2e). The torsional angle between the ring and the amide group (C4–C3–C6–O1) for form I and form II respectively is 14.48° and 31.77°. This contrast may be due to the effect of the hydrogen bonding present: form I is not restricted by hydrogen bonding and will accept a conformation with a low energy. Intramolecular DFT calculations show that the molecule in form I is more stable compared to the molecule in form II by 3.1 kJ mol−1. On the other hand form II will be locked to a conformation that allows the formation of the hydrogen bond between the pyridine ring and hydroxyl group. Consequently, because of the different hydrogen bonding interactions, each form will packing differently. Form I overall forms layered type packing, with each chain forming rows with the pyridine ring forming π⋯π stacking between adjacent chains (Fig. 2b). This π⋯π stacking does not exist for form II, which is a consequence of the hydrogen bonded dimers (Fig. 2d). The packing coefficients (calculated using PLATON39) for both form I and form II are 67.7% and 69.7% respectively, which indicates that form II is more efficient at packing than form I by 2%.
 |
| | Fig. 2 The crystals structures of form I and form II showing: (a) the chain hydrogen bond motif found in form I, (b) the crystal structure packing of form I (with hydrogen omitted for clarity), (c) the dimer with the ring hydrogen bond motif, (d) the crystal structure packing of form II (with hydrogen omitted for clarity) and (e) the molecular overlay of iz4h4m2p molecules from the asymmetric units of form I (blue) and form II (green). | |
Intermolecular energy calculations using PIXEL indicates the intermolecular energy of form II (−164.7 kJ mol−1) is lower than form I (−145.3 kJ mol−1) by 19.4 kJ mol−1. Adding the intermolecular and intramolecular energies leads to the lattice energy (Elatt = Uinter + ΔEintra), which is −145.3 and −161.6 kJ mol−1 for form I and form II respectively. The calculated lattice energies show that form II is more stable than form I by 16.2 kJ mol−1. Thus the intramolecular energies for the individual molecules are not that different, but the intermolecular interactions in form II make this form considerably more favoured, and it is not surprising that we did not manage to crystallise form I again (Table 1).
Table 1 Hydrogen bond table for the crystal structures of form I and form II of iz4h4m2p
| D–H⋯A |
d(D–H) |
d(H⋯A) |
d(D⋯A) |
∠(DHA) |
| Symmetry transformations used to generate equivalent atoms: (i) x, y − 1, z (ii) −x + 1, −y + 1, −z + 1. |
| Form I |
| N2–H2A⋯O2 |
0.888(19) |
1.888(19) |
2.7220(18) |
156(2) |
| O2–H2B⋯O1 (i) |
0.84(2) |
1.89(2) |
2.7088(15) |
164(2) |
|
| Form II |
| N2–H2A⋯O2 |
0.898(15) |
1.913(15) |
2.7370(13) |
152(12) |
| O2–H2B⋯N1 (ii) |
0.892(19) |
1.903(19) |
2.7778(13) |
166(16) |
3.3. Hirshfeld analysis
Hirshfeld surface diagrams were generated for both form I and form II and both are presented in Fig. 3. One of the most noticeable differences between the two Hirshfeld surfaces is in the large red spot at the pyridyl nitrogen of form II (Fig. 3g and h), which is much smaller in form I. This arises due to the strong hydrogen bonding described previously. The small red spot on the pyridyl nitrogen on form I arises from a weak C–H hydrogen bond (C9–H9⋯N1). Conversely, for form II a weaker hydrogen bond between the oxygen (O1) from the amide group also exist (C4–H4⋯O1). One other noticeable weak C–H hydrogen bond in form II is that of C1–H1⋯N3, indicating that the imine might also be involved in some weak hydrogen bonding, although this has not been observed for form I. A pair of red and blue triangles spotted on the shape index of form I (Fig. 3d) along with the relatively flat region on the curvedness of form I (Fig. 3e) confirms that form I consists of a series of chains of iz4h4m2p stacked together by π⋯π stacking interactions. Conversely, the shape index and curvedness of form II (Fig. 3i and j) does not share this feature, indicates that packing of form II does not involve π⋯π stacking, but rather is organized by other weak interactions instead such as C–H hydrogen bonding. This is supported by an increased amount of surface contact arising from C–H interactions found in form II when comparing form I and form II, as seen in Fig. 4.
 |
| | Fig. 3 The Hirshfeld surfaces for form I and form II with (a)–(e) representing the di, de, dnorm, shape index and curvedness respectively for form I and (f)–(j) representing the di, de, dnorm, shape index and curvedness respectively for form II. | |
 |
| | Fig. 4 The comparison of the contributions for each contact towards the Hirshfeld surface area between form I and form II. | |
3.4. FTIR spectra
FTIR spectroscopy can be used for the quick identification of the polymorphs of iz4h4m2p. The FTIR spectra for form I and form II as well as that of isoniazid were measured. These spectra are compared with each other and are presented in Fig. 5. It first should be noted that although the hydroxyl groups typically forms a broad medium to strong band in the 3550–3230 cm−1 range, the hydrazide functional group (O![[double bond, length as m-dash]](https://www.rsc.org/images/entities/char_e001.gif) C–NH–NH2) also forms a medium to strong band in the same region as the hydroxyl group, giving the spectra a similar shape in this region. However, it is still possible to distinguish between isoniazid and iz4h4m2p, as well as between the two forms of iz4h4m2p by using other vibrational peaks. One of the first noticeable differences between isoniazid and that of both forms of iz4h4m2p should be the lack of a –NH2 group. This can easily be observed by the absence of a medium-strong peak in the 1635–1600 cm−1 region that is associated with the –NH2 deformation vibration (which is not to be confused the strong peak appearing in the 1680–1635 cm−1 region that is associated with the carbonyl stretch).
C–NH–NH2) also forms a medium to strong band in the same region as the hydroxyl group, giving the spectra a similar shape in this region. However, it is still possible to distinguish between isoniazid and iz4h4m2p, as well as between the two forms of iz4h4m2p by using other vibrational peaks. One of the first noticeable differences between isoniazid and that of both forms of iz4h4m2p should be the lack of a –NH2 group. This can easily be observed by the absence of a medium-strong peak in the 1635–1600 cm−1 region that is associated with the –NH2 deformation vibration (which is not to be confused the strong peak appearing in the 1680–1635 cm−1 region that is associated with the carbonyl stretch).
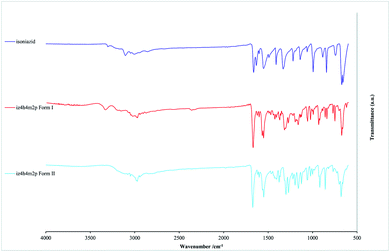 |
| | Fig. 5 The FTIR spectra for isoniazid, form I and form II of iz4h4m2p. | |
One notable difference between the spectra of form I and form II is the absence of a medium peak around the 3300–3350 cm−1 region in form II, which appears as a weak band instead. This peak is most likely associated with the N–H stretch of an amide group. This increase in the intensity of form I is most likely the result of the chain hydrogen bond motif described previously, as the carbonyl group forming a hydrogen bond may have affected the dipole moment of the N–H group in form I. This peak can be used as a signature peak when a quick comparison is needed.
3.5. DSC curves
The DSC curves obtained for both forms of iz4h4m2p is presented in Fig. 6. The curve of form I heated at 10 °C min−1 will be referred to as the slow curve, while the one heated at 40 °C min−1 will be referred to as the fast curve. Measurements were done in triplicate to determine errors. From the slow curve for form I it can be observed that two significant peaks are observed occurring almost one after the other. The first small peak represents the solid-state phase transition of form I to form II. This is supported by the temperature range of the second, larger peak coinciding closely to the same temperature for the melting/decomposition of form II obtained from the curve of form II. The curve for form II does not show any other significant peaks before the melting/decomposition one. In order to determine the melting point and heat of fusion of form I alone without transforming to form II, the sample was heated quickly at 40 °C min−1 (fast curve) to prevent the sample having enough time to transform from form I to form II. From the fast curve of form I the melting/decomposition peak was found to be 139.7 °C, which is roughly 2 °C below the melting/decomposition peak of form II. Both forms showed no significant peaks on the cooling cycle. The onset temperatures along with the associated enthalpies is tabulated in Table 2. To determine whether the two forms are monotropically or enantiotropically related, several rules can be applied. The heat-of-fusion rule states that for an enantiotropic system, the form with the higher melting point will have a lower heat-of-fusion.40 For this system, this rule is difficult to apply since the enthalpies are similar in size and have a margin of error between them. However, the heat-of-transition rule provides a clearer interpretation. It states that “if an endothermal transition is observed at some temperature it may be assumed that there is a transition point below it”.40 From the slow curve of form I an endothermic peak was observed, with a subsequent endothermic peak matching closely to the melting peak of form II. This is best represented by the qualitative energy vs. temperature curves observed in Fig. 7, in particular ΔHI→II. Based on this observation it can be observed unambiguously that form I and form II are enantiotropically related.
 |
| | Fig. 6 DSC curves for the polymorphs of iz4h4m2p. | |
Table 2 Thermodynamic information regarding the DSC curves
| Property |
Form I |
Form II |
| This is the onset temperature. These melting peaks may not necessarily represents pure melting, as the sample may have started decomposing beyond this point. From the slow curve of form I. From the curve of form II. From the expression ΔS = ΔH/T. |
| Tfusa [°C] |
139.7 ± 0.1 |
142.6 ± 0.1b |
| 142.1 ± 0.1 c |
| ΔfusH [kJ mol−1] |
32.3 ± 0.8 |
33.93 ± 0.8 b |
| 33.17 ± 0.9 c |
| ΔfusSd [J K−1 mol−1] |
78.2 ± 1.9 |
81.6 ± 1.9b |
| 79.9 ± 1.9c |
| Transition to mod |
I → II |
— |
| Ttrans |
132.29 ± 0.1b |
— |
| ΔtransH [kJ mol−1] |
3.51 ± 0.8b |
— |
| ΔtransS [J K−1 mol−1] |
8.65 ± 1.9b |
— |
 |
| | Fig. 7 The energy vs. temperature diagram showing the enantiotropic relation between form I and form II. | |
3.6. Hot stage microscopy
A block-like crystal of form I was placed on a glass microscope slide and covered by a glass cover slip. This was heated until melting, and significant changes were captured. For form I no significant changes were observed until heated to 125 °C (Fig. 8b). This block started to move and become darker, with a clear phase transformation occurring. This process occurs and finishes around 135 °C (Fig. 8c). Melting starts occurring after 140 °C and finishes at 145 °C (see video part of ESI†). After cooling, a wax-like solid remained, which indicated that no recrystallization occurred, as expected from comparing the DSC curve. Form II was also examined part of the hot stage microscopy. The crystal of form II remained unchanged until melting (Fig. 8e and f). Upon cooling, like form I, a wax-like solid remained, indicating no recrystallization occurred. Videos depicting the melting of form I and its phase transition are available as ESI.†
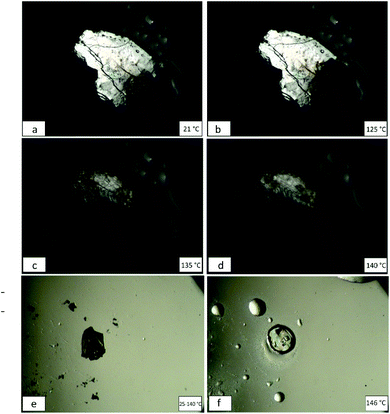 |
| | Fig. 8 Hot stage microscopy images showing a block of form I at room temperature (a). The crystal starts undergoing a phase transition at 125 °C (b) before finishing at around 135 °C (c). Melting occurs after 140 °C (d). Form II for most of its time from 25–140 °C until melting (f). | |
4 Conclusions
Two polymorphic forms of iz4h4m2p were discovered and characterized. Form I is a metastable phase that proved to be elusive to obtain again, while form II is the most stable form, and obtained repeatedly from most solvents. From the crystal structure analysis of both forms it is revealed that the two forms can be differentiated by two different hydrogen bond motifs: form I using a chain hydrogen bond motif and form II using a ring hydrogen bond motif. Form I utilises π⋯π stacking, while form II uses different weaker hydrogen bonding (C–H) to stabilise its packing. From the DSC analysis, form I has an enantiotropic thermal relation to form II. Computational studies confirm our observations that form II is much more stable than form I, despite the molecular conformation of iz4h4m2p in form I to be more stable than the conformation of iz4h4m2p in form II. This is due to the overall intermolecular energy of form II being much lower than form I. Here we have presented a case of a “disappearing” polymorphic system,41 where the formation of one form (form I) is overtaken by the formation of another (form II). Thus, for future work it may prove to be worthwhile to find and characterize more polymorphs, while also finding a more reliable and consistent method of obtaining form I.
Conflicts of interest
There are no conflicts to declare.
Acknowledgements
This material is based upon work supported financially by the University of the Witwatersrand and the Molecular Sciences Institute. The National Research Foundation National Equipment Programme (UID 78572) is thanked for financing the purchase of the single-crystal diffractometer, and the DSI/NRF Centre of Excellence in Strong Materials is thanked for use of the D2-phaser.
Notes and references
- P. H. Karpinski, Chem. Eng. Technol., 2006, 29, 233–237 CrossRef CAS
 .
. - J. Lu and S. Rohani, Curr. Med. Chem., 2009, 16, 884–905 CrossRef CAS PubMed .
- V. R. Vázquez Marrero, C. Piñero Berriós, L. De Dios Rodríguez, T. Stelzer and V. López-Mejiás, Cryst. Growth Des., 2019, 19, 4101–4108 CrossRef PubMed .
- A. Lévesque, T. Maris and J. D. Wuest, J. Am. Chem. Soc., 2020, 142, 11873–11883 CrossRef PubMed .
- H. M. Wolff, L. Quere and J. Riedner, US8232414B2, 2012 .
- K. Higashi, K. Ueda and K. Moribe, Adv. Drug Delivery Rev., 2017, 117, 71–85 CrossRef CAS PubMed .
- M. D. Iseman, Eur. Respir. J., 2002, 20, 87–94 CrossRef PubMed .
- K. Zhang, N. Fellah, A. G. Shtukenberg, X. Fu, C. Hu and M. D. Ward, CrystEngComm, 2020, 22, 2705–2708 RSC .
- L. H. Jensen, J. Am. Chem. Soc., 1954, 265, 4663–4667 CrossRef .
- G. Rajalakshmi, V. R. Hathwar and P. Kumaradhas, Acta Crystallogr., Sect. B: Struct. Sci., Cryst. Eng. Mater., 2014, 70, 331–341 CrossRef CAS PubMed .
- D. Hean, T. Gelbrich, U. J. Griesser, J. P. Michael and A. Lemmerer, CrystEngComm, 2015, 17, 5143–5153 RSC .
- D. Hean, J. P. Michael and A. Lemmerer, J. Mol. Struct., 2018, 1157, 693–707 CrossRef CAS .
- A. Lemmerer, J. Bernstein and V. Kahlenberg, CrystEngComm, 2010, 12, 2856–2864 RSC .
- S. Y. Wang, X. M. Song and L. X. Duan, Acta Crystallogr., Sect. E: Struct. Rep. Online, 2008, 64, o1880 CrossRef CAS PubMed .
- Z. L. Lu, B. Z. Shan, C. Y. Duan, Y. P. Tian, X. Z. You, H. K. Fun and K. Sivakumar, Acta Crystallogr., Sect. C: Cryst. Struct. Commun., 1996, 52, 1720–1722 CrossRef .
- V. Meenatchi, K. Muthu, M. Rajasekar and S. Meenakshisundaram, Spectrochim. Acta, Part A, 2014, 124, 423–428 CrossRef CAS PubMed .
- V. Jayaprakash, A. K. Timiri, V. Vijayan, B. N. Sinha and V. Devadasan, J. Pharm. Chem., 2019, 6, 1–4 CAS .
- T. R. Shattock, K. K. Arora, P. Vishweshwar and M. J. Zaworotko, Cryst. Growth Des., 2008, 8, 4533–4545 CrossRef CAS .
- V. Vrdoljak, B. Prugovečki, I. Primožič, T. Hrenar, D. Cvijanović, J. Parlov Vuković, R. Odžak, M. Skočibušić, S. Prugovečki, J. Lovrić, D. Matković-Čalogović and M. Cindrić, New J. Chem., 2018, 42, 11697–11707 RSC .
- L. Tom, V. Smolenski, J. Jasinski and M. R. P. Kurup, ChemRxiv, 2018 DOI:10.26434/chemrxiv.6489425 .
- C. R. Taylor, M. T. Mulvee, D. S. Perenyi, M. R. Probert, G. M. Day and J. W. Steed, J. Am. Chem. Soc., 2020, 142, 16668–16680 CrossRef CAS PubMed .
- A. Lemmerer, J. Bernstein and V. Kahlenberg, CrystEngComm, 2011, 13, 5692–5708 RSC .
- A. Lemmerer, CrystEngComm, 2012, 14, 2465–2478 RSC .
- L. G. Madeley, D. C. Levendis and A. Lemmerer, Acta Crystallogr., Sect. C: Struct. Chem., 2019, 75, 200–207 CrossRef CAS PubMed .
- C. F. de Faria, T. Moreira, P. Lopes, H. Costa, J. R. Krewall, C. M. Barton, S. Santos, D. Goodwin, D. Machado, M. Viveiros, M. Machuqueiro and F. Martins, Biomed. Pharmacother., 2021, 144, 112362 CrossRef CAS PubMed .
- Bruker, SAINT+ and XPREP, Bruker AXS Inc., Madison, Wisconsin, USA, 2012 Search PubMed .
- Bruker, SADABS, Bruker AXS Inc., Madison, Wisconsin, USA, 2001 Search PubMed .
- L. J. Farrugia, J. Appl. Crystallogr., 1999, 32, 837–838 CrossRef CAS .
- G. M. Sheldrick, Acta Crystallogr., Sect. A: Found. Crystallogr., 2015, 71, 3–8 CrossRef PubMed .
- L. J. Farrugia, J. Appl. Crystallogr., 2012, 45, 849–854 CrossRef CAS .
- C. F. Macrae, I. Sovago, S. J. Cottrell, P. T. A. Galek, P. McCabe, E. Pidcock, M. Platings, G. P. Shields, J. S. Stevens, M. Towler and P. A. Wood, J. Appl. Crystallogr., 2020, 53, 226–235 CrossRef CAS PubMed .
- P. R. Spackman, M. J. Turner, J. J. McKinnon, S. K. Wolff, D. J. Grimwood, D. Jayatilaka and M. A. Spackman, J. Appl. Crystallogr., 2021, 54, 1006–1011 CrossRef CAS PubMed .
- A. Gavezzotti, J. Phys. Chem. B, 2003, 107, 2344–2353 CrossRef CAS .
- A. Gavezzotti, Z. Krystallog., 2005, 220, 499–510 CAS .
- A. Gavezzotti, New J. Chem., 2011, 35, 1360–1368 RSC .
- M. J. Frisch, G. W. Trucks, H. B. Schlegel, G. E. Scuseria, M. A. Robb, J. R. Cheeseman, G. Scalmani, V. Barone, B. Mennucci, G. A. Petersson, H. Nakatsuji, M. Caricato, X. Li, H. P. Hratchian, A. F. Izmaylov, J. Bloino, G. Zheng, J. L. Sonnenberg, M. Hada, M. Ehara, K. Toyota, R. Fukuda, J. Hasegawa, M. Ishida, T. Nakajima, Y. Honda, O. Kitao, H. Nakai, T. Vreven, J. J. A. Montgomery, J. E. Peralta, F. Ogliaro, M. Bearpark, J. J. Heyd, E. Brothers, K. N. Kudin, V. N. Staroverov, R. Kobayashi, J. Normand, K. Raghavachari, A. Rendell, J. C. Burant, S. S. Iyengar, J. Tomasi, M. Cossi, N. Rega, N. J. Millam, M. Klene, J. E. Knox, J. B. Cross, V. Bakken, C. Adamo, J. Jaramillo, R. Gomperts, R. E. Stratmann, O. Yazyev, A. J. Austin, R. Cammi, C. Pomelli, J. W. Ochterski, R. L. Martin, K. Morokuma, V. G. Zakrzewski, G. A. Voth, P. Salvador, J. J. Dannenberg, S. Dapprich, A. D. Daniels, O. Farkas, J. B. Foresman, J. V. Ortiz, J. Cioslowski and D. J. Fox, Gaussian-09, Revision E.01, Gaussian Inc., Wallingford, CT, U.S.A., 2009 Search PubMed .
- Y. Zhao and D. G. Truhlar, Theor. Chem. Acc., 2008, 120, 215–241 Search PubMed .
- S. Grimme, Wiley Interdiscip. Rev.: Comput. Mol. Sci., 2011, 1, 211–228 Search PubMed .
- A. L. Spek, J. Appl. Crystallogr., 2003, 36, 7–13 CrossRef CAS .
- A. Burger and R. Ramberfer, Mikrochim. Acta, 1979, 2, 259–271 CrossRef CAS .
- J. D. Dunitz and J. Bernstein, Acc. Chem. Res., 1995, 28, 193–200 CrossRef CAS .
Footnote |
| † Electronic supplementary information (ESI) available: Crystallographic information, PXRD patterns and Hirshfeld surface finger plots. CCDC 2133557–2133558. For ESI and crystallographic data in CIF or other electronic format see https://doi.org/10.1039/d2ra02057b |
|
| This journal is © The Royal Society of Chemistry 2022 |
Click here to see how this site uses Cookies. View our privacy policy here. 
 Open Access Article
 This Open Access Article is licensed under a Creative Commons Attribution-Non Commercial 3.0 Unported Licence
 ,
Manuel A. Fernandes
,
Manuel A. Fernandes