DOI:
10.1039/D2RA02056D
(Paper)
RSC Adv., 2022,
12, 15508-15516
Fabrication of composite material of RuCo2O4 and graphene on nickel foam for supercapacitor electrodes†
Received
30th March 2022
, Accepted 12th May 2022
First published on 23rd May 2022
Abstract
Supercapacitors are energy storage devices with the advantage of rapid charging and discharging, which need a higher specific capacitance and superior cycling stability. Hence, a composite material consisting of RuCo2O4 and reduced graphene oxide with a nanowire network structure was synthesized on nickel foam using a one-step hydrothermal method and annealing process. The nanowire network structure consists of nanowires with gaps that provide more active sites for electrochemical reactions and shorten the diffusion path of electrolyte ions. The prepared electrodes exhibit outstanding electrochemical performance with 2283 F g−1 at 1 A g−1. When the current density is 10 A g−1, the specific capacitance of the electrodes is 1850 F g−1, which maintains 81% of the initial specific capacitance. In addition, the prepared electrodes have a long-term cycling life with capacitance retention of 92.60% after 3000 cycles under the current density of 10 A g−1. The composite material is a promising electrode material for high-performance supercapacitors.
1 Introduction
Supercapacitors have a longer cycle life than batteries and a higher energy density than conventional capacitors, which have led to increasing research into them.1,2 Based on the energy storage mechanism, they are divided into two categories:3 one is the double-layer supercapacitor, which uses the double layer to store energy, and another is the pseudocapacitor, which derives its energy from the Faraday redox reaction occurring at the electrodes.4 For double-layer supercapacitors, the electrode materials are mainly different carbon materials, including activated carbon,5 carbon nanotubes,6 graphene7 and carbon aerogel.8 Typically, the electrode materials for pseudocapacitors are conducting polymers and transition metal oxides.9
To date, Co3O4, RuO2, MnO2, TiO2 and NiO have been widely studied because of their high theoretical specific capacitance. However, the dense structure, poor conductivity and poor adhesion to the current collector of these materials will limit their power performance. So far, there are two practical strategies to overcome the shortcomings mentioned above of single component transition metal oxides. The first is to improve the performance by compounding with other metal oxides.10 If the combination of two transition metal oxides can compensate for each other's defects, a new composite material with excellent electrochemical properties can be obtained by adjusting the feeding ratio of the two metal oxides. Recently, binary transition metal oxides have shown better performance than single metal oxides due to their more multivalent active sites.11 Bimetallic compounds such as ZnCo2O4, NiCo2O4,12 NiMoO4, RuCo2O4![[thin space (1/6-em)]](https://www.rsc.org/images/entities/char_2009.gif) 13 and CoMoO4 are recognized as promising alternatives to single metal oxides due to their low cost and abundant content. Combining carbon materials with transition metal oxides is another reasonable solution to overcome the disadvantages of single metal oxides. Moreover, carbon materials have been taken into consideration in the development of transition metal oxides as electrode materials.
13 and CoMoO4 are recognized as promising alternatives to single metal oxides due to their low cost and abundant content. Combining carbon materials with transition metal oxides is another reasonable solution to overcome the disadvantages of single metal oxides. Moreover, carbon materials have been taken into consideration in the development of transition metal oxides as electrode materials.
Graphene, a sp2 hybrid carbon sheet with high electrical conductivity and excellent chemical stability,14 has received extensive attention and has been used as an electrode material for supercapacitors and lithium-ion batteries.15 However, strong p–p interactions between adjacent graphene lamellae lead to a certain degree of graphene aggregation, which results in a sharp decrease in the electrochemically active surface area, resulting in a lower specific capacitance.16 Many feasible approaches have been proposed to solve this problem.17,18 N doping can not only increase the specific capacitance but also maintain the high power density of graphene-based supercapacitors.19 On the other hand, the surface of graphene is modified by combining with inorganic materials,20 which not only reduces the aggregation of graphene, but also increases the contact area for electrochemical reactions.21 As one of the electrode materials for graphene-based supercapacitors, reduced graphene oxide (rGO) can be directly reduced by graphene oxide (GO), which is simple and has broad application prospects. In conclusion, we believe that rGO and binary transition metal oxide composites can complement each other and jointly improve the performance of both electrode materials.
Here, a green, cost-effective and straightforward one-step hydrothermal method is reported to prepare electrode composites of RuCo2O4 and rGO on nickel foam (NF), named RuCo2O4/rGO@NF. In RuCo2O4/rGO@NF, NF acts as a conductive substrate to provide support for the composite, and rGO provides a two-dimensional network for electron transport and modifies the surface of NF to make it more suitable for the growth of RuCo2O4. The capacitance performance, charge/discharge cycle stability and capacitance retention performance of RuCo2O4/rGO@NF electrode composites were investigated.
2 Experiment
2.1 Experimental reagents and materials
Nickel foam (NF) was provided by Kunshan Guangjiayuan New Material Co. Ltd. Sulfuric acid (H2SO4, 95–98%), hydrogen chloride (HCl, 36–38%), hydrogen peroxide (H2O2, 30%), potassium permanganate (KMnO4), potassium hydroxide (KOH), sodium nitrate (NaNO3), acetone (CH3COCH3, 99.5%), ethanol (C2H5OH, 99.5%) and graphite powder used in the experiments were purchased from Beijing Fine Chemicals Co., Ltd. Ruthenium chloride (RuCl3) was acquired from Beijing Merida Technology Co., Ltd. Cobalt nitrate hexahydrate (Co(NO3)2·6H2O) was procured from Anhui Zesheng Technology Co., Ltd.
2.2 Synthesis of GO and RuCo2O4/rGO@NF
GO was synthesized according to a modified Hummers' method.22 The detailed steps for the preparation of GO can be found in ESI (S1†). Before the start of the experiment, the NF was cut into small pieces of 20 mm × 10 mm × 1 mm and washed with 3 mM HCl solution, acetone, ethanol and deionized water for 30 min by ultrasonication, respectively. The pieces were then dried at 60 °C for 12 h. The 7.5 mL GO solution (2 mg mL−1) was dispersed by sonication for 1.5 h. A black solution was obtained by adding 0.4 mmol RuCl3, 0.8 mmol Co(NO3)2·6H2O and 1.0 mmol urea to a beaker containing 7.5 mL of distilled water and stirring vigorously for 40 min. The acidity of the black solution was adjusted to neutral with potassium hydroxide solution. The black solution was mixed with the GO solution and stirred for another 40 min to obtain 15 mL of the mixed solution. The weighed NF and the above mixed solution were placed in a 25 mL autoclave and heated in a vacuum oven at 120 °C for 15 h. After the reaction was completed and cooled to room temperature, the NF was washed with ethanol and deionized water and then dried in an oven at 90 °C for 4 h. Finally, it was annealed in a muffle furnace at 300 °C for 2 h. For the preparation of RuCo2O4@NF and rGO@NF composite electrode materials, see ESI (S2 and S3†). The quality of the electrode active material and the experimental temperature in the experiment are shown in the ESI S3.†
2.3 Structural characterization
The surface morphology of the prepared electrode material was observed by scanning electron microscopy (SEM, Quanta 600, FEI) and transmission electron microscopy (TEM, JEM-2100, JEOL). The compositions and crystalline phases of the composites were studied using X-ray powder diffraction (XRD, Germany) in the range of 2θ = 10°–90°. The specific chemical composition and elemental oxidation state information of the composites were determined by X-ray photoelectron spectroscopy (XPS, Model PHI 5300, Physical Electronics, USA). Inductively coupled plasma emission spectroscopy (ICP-OES) was performed by ICP-OES iCAP6300 (Thermo Fisher). Nitrogen adsorption experiment of the sample was conducted by Tri-Star II3020 of micron instruments, and its specific surface area of the sample was obtained by analyzing its adsorption isotherm curve by Brunauer–Emmett–Teller (BET).
2.4 Electrochemical measurements
The electrochemical properties associated with the electrode materials were tested by an electrochemical workstation (CHI 760E, CH Instruments) using a conventional three-electrode system, in which the prepared electrode was used as the working electrode, a platinum sheet as the counter electrode and a saturated calomel electrode (SCE) as the reference electrode. Cyclic voltammetry (CV), galvanostatic charge/discharge (GCD) and electrochemical impendence spectroscopy (EIS) were performed in a 6 mol L−1 KOH electrolyte solution. The CV performance was conducted in the potential range of −0.2 to 0.6 V (vs. SCE) at various scanning rates (5–100 mV s−1). The GCD performance was obtained within a potential window from −0.1 V to 0.5 V (vs. SCE) at different current densities from 1 A g−1 to 10 A g−1. EIS was carried out with a perturbation amplitude of 5 mV at open circuit potential in a frequency range from 100 kHz to 0.01 Hz. The capacitance of the electrode was calculated from the charge/discharge curves and eqn (1).23| |
 | (1) |
3 Results and discussion
3.1 Morphological and structural analysis
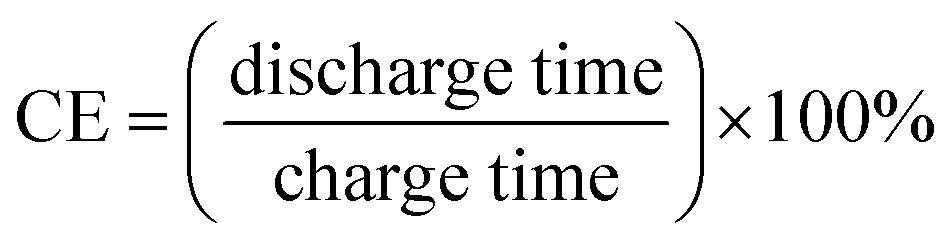
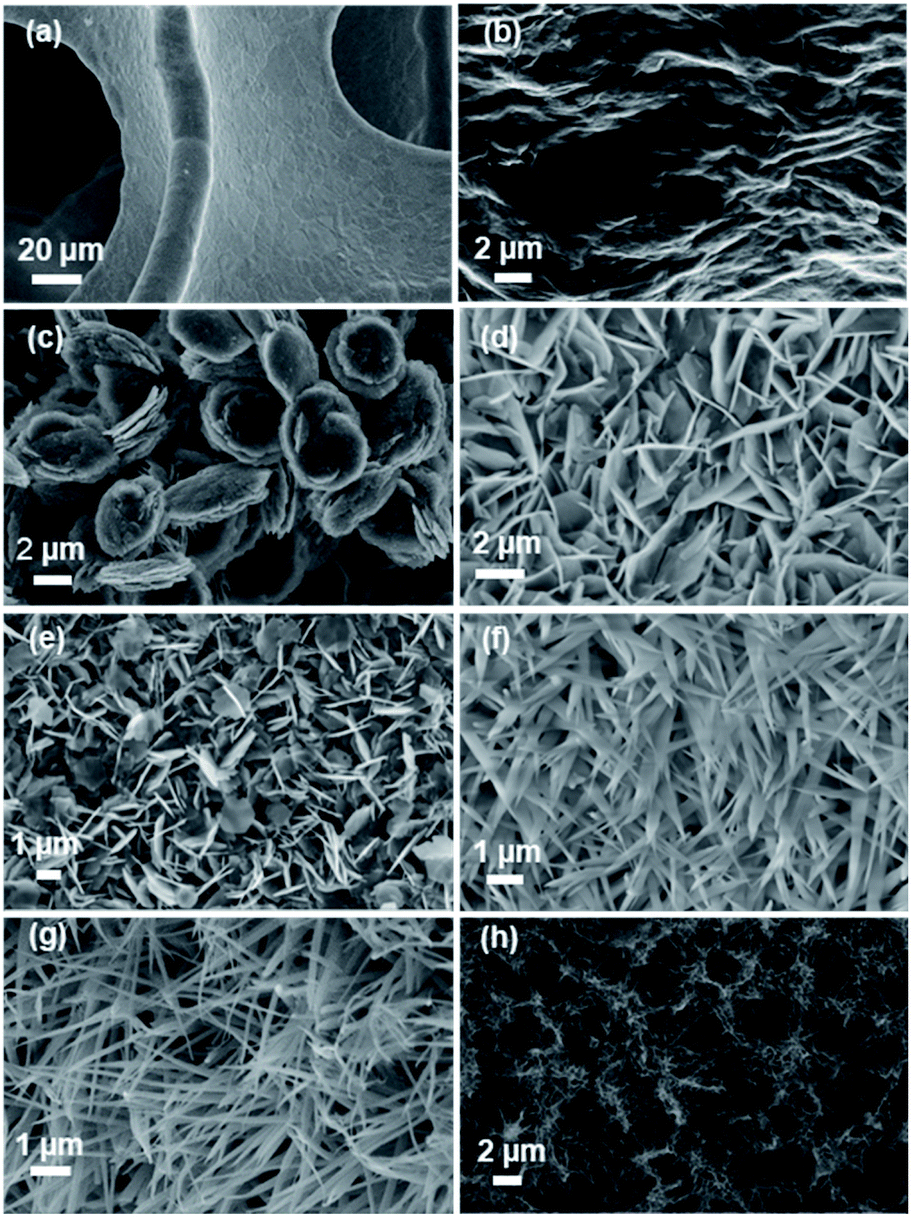
SEM was used to examine the morphology and structure of the synthesized electrode materials. NF has a very smooth surface, as seen in Fig. 1a. The surface of the sample becomes rough when the rGO is added, as shown in Fig. 1b. The SEM image of rGO@NF reveals a significant number of folds and cracks. Because smooth graphene is thermodynamically unstable, folds and cracks in the graphene sheet are inevitable.24 The large number of folds and cracks reduces ion transport resistance and minimizes ion diffusion distance, resulting in higher charge storage.25 During the hydrothermal process, RuCo2O4 is deposited on the NF in the form of nearly circular flakes that are tightly packed and clustered together to form a button, as shown in Fig. 1c. These closely packed flakes limit contact between the electrolyte and the electrode, decreasing active site utilization. As a result, pristine NF is less suited as a substrate for RuCo2O4 direct growth. RuCo2O4/rGO@NF (Fig. 1g and h) has a homogeneous nanowire network structure, in contrast to rGO@NF and RuCo2O4@NF. The electrolyte solution may quickly reach the gaps between these nanowires, reducing the ion diffusion path and better utilizing the electrode material.26 The presence of rGO appears to have had a substantial impact on the morphology and structural arrangement of RuCo2O4 nanosheets, promoting the formation of the RuCo2O4/rGO@NF nanowire network structure.27 RuCo2O4/rGO@NF nanowires can be directly grown on nickel foam without adding any other binder.19 This improves the contact between the electrolyte and the electrode material, allowing electrolyte ions to reach the nanomaterial surface more effectively and avoiding the effect of dead surfaces.
 |
| | Fig. 1 SEM of samples. (a) NF, (b) rGO@NF, (c) RuCo2O4@NF, and (g, h) RuCo2O4/rGO@NF; SEM of samples at different reaction time. (d) 5 h, (e) 10 h, (g) 15 h; (f) unannealed RuCo2O4/rGO@NF sample. | |
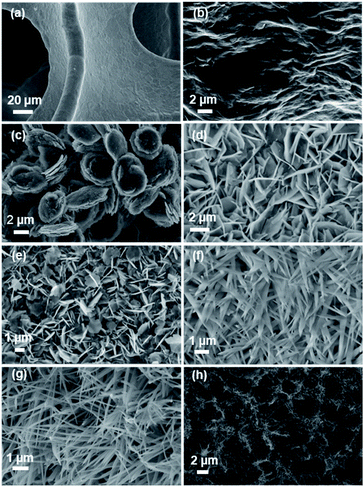
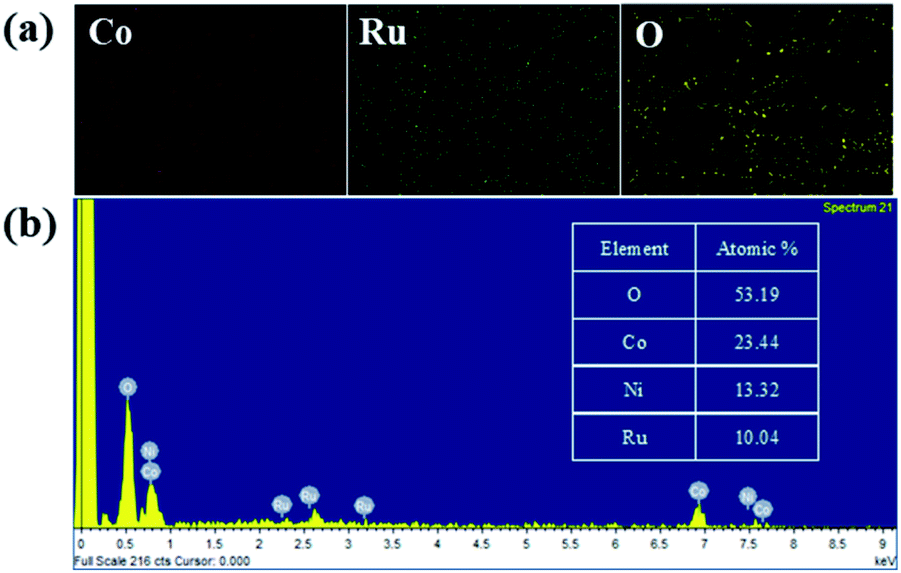
The elemental mappings of cobalt (red), ruthenium (green) and oxygen (yellow) for the image in Fig. 1g is shown in Fig. 2a. It is clear that cobalt, ruthenium and oxygen are uniformly distributed in the material. Energy-dispersive X-ray spectroscopy (EDS) mappings were used to analyze the structure of the synthesized material and identified the product as RuCo2O4, as shown in Fig. 2b. Inductively coupled plasma (ICP) testing was used to better understand the exact ratio between cobalt and ruthenium. The ratio of cobalt to ruthenium in the composite is approximately 2:1, according to the analysis results in Table 1, which is consistent with the EDS results.
 |
| | Fig. 2 (a) The EDS mapping of the RuCo2O4/rGO@NF composite, Co elements (red), Ru elements (green), and O elements (yellow); (b) EDS results of RuCo2O4/rGO@NF. | |
Table 1 ICP-OES result of RuCo2O4/rGO@NF
| Element |
wt% |
m (mg) |
n (mmol) |
msample (mg) |
| Co |
5.2791 |
3.7957 |
0.0644 |
71.9 |
| Ru |
4.1294 |
2.9690 |
0.0294 |
71.9 |
The reaction time has a substantial impact on the material morphology in most cases,28,29 and the morphology of the electrode material was explored at different reaction times to further investigate the reasons for the formation of RuCo2O4 nanowires. Fig. 1d depicts the morphology of the sample after 5 h of reaction time, which revealed a crossed sheet structure. When the reaction time was increased to 10 h (Fig. 1e), fine nanowires grew between the gaps of the nanosheets, and most of the morphology was nanosheet with only a small proportion being nanowire. When the reaction time was increased to 15 h, the morphology completely transformed into nanowires, as shown in Fig. 1g. Furthermore, comparing the morphology of the materials before and after annealing (Fig. 1f and g) it can be seen that the structure of nanowires was formed before annealing, but the nanowires were thick and short, while after annealing, the nanowires became thinner and longer, and the gap between adjacent nanowires became larger, indicating that annealing mainly affected the size of nanowires and had little effect on the shape of nanowires.30 Meanwhile, by comparing the morphology of added and unadded rGO (Fig. 1c and g), it can be concluded that the formation of nanowires is influenced by the substrate.31 In conclusion, the formation of nanowires is mainly influenced by the reaction time and the conductive substrate.
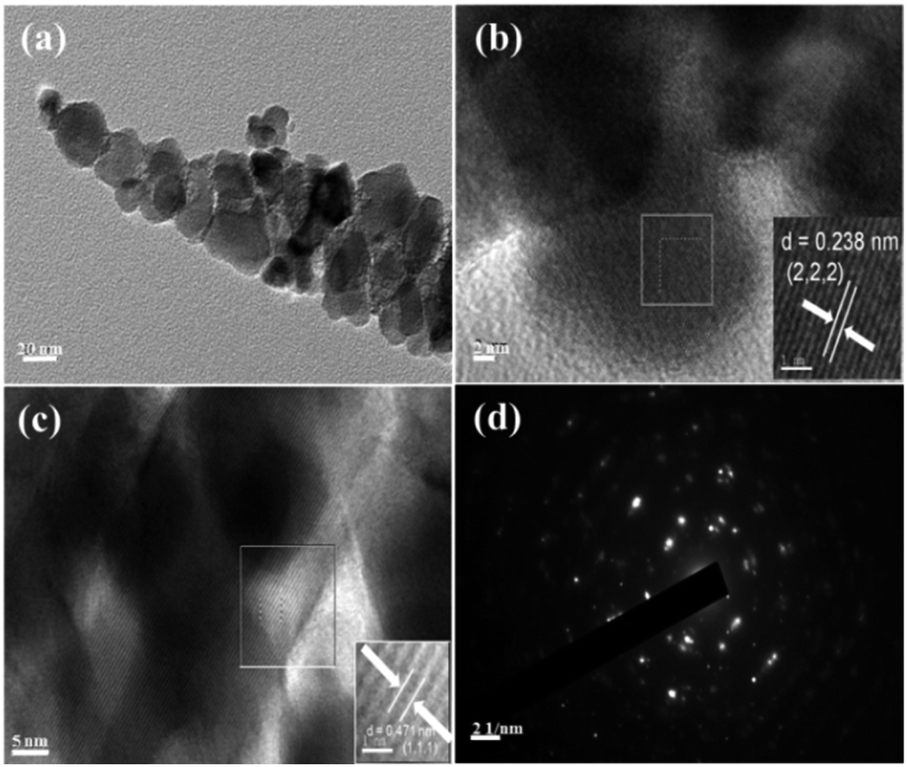
The morphology and structure of RuCo2O4/rGO@NF were further investigated by transmission electron microscopy (TEM), selected area electron diffraction (SAED) and high resolution TEM (HRTEM) as shown in Fig. 3. In Fig. 3a, nanowire structures are observed, which are consistent with the SEM images. The HRTEM images of RuCo2O4/rGO@NF (Fig. 3b and c) show distinct lattice stripes with measured planar spacing of 0.238 nm and 0.471 nm, corresponding to the (222) and (111) crystallographic planes of RuCo2O4, respectively. The SAED pattern of RuCo2O4/rGO@NF is shown in Fig. 3d, and the relatively weak diffraction rings imply that RuCo2O4/rGO@NF is polycrystalline.
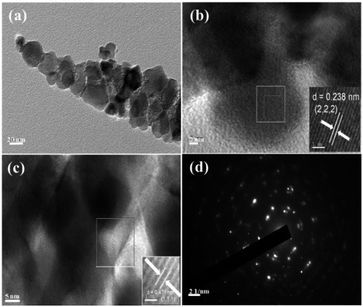 |
| | Fig. 3 (a) TEM of RuCo2O4/rGO@NF; (b) and (c) is HRTEM images of RuCo2O4/rGO@NF; the insets of (b) and (c) are enlarged images of the selected rectangular region; (d) SAED pattern of RuCo2O4/rGO@NF. | |
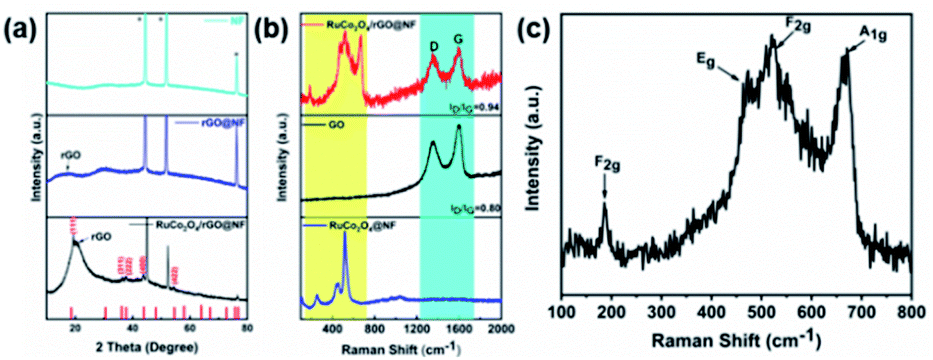
The prepared RuCo2O4/rGO@NF, rGO@NF and NF were analyzed by XRD, as shown in Fig. 4a. There are three strong peaks at 44.88, 52.25 and 76.52, corresponding to the (111), (200) and (220) diffraction planes of nickel (JCPDS No. 87-0712). Additionally, five diffraction peaks located near 18.63, 36.12, 37.78, 43.91 and 54.51 correspond to the (111), (311), (222), (400) and (422) crystal planes of the RuCo2O4 phase (JCPDS No. 73-1048), respectively. The intensity of the characteristic peaks of RuCo2O4 is relatively weak, indicating that the grain size of the formed RuCo2O4 is smaller, which corresponds to the smaller size nanowires in the SEM image. The broad peak located near 20 corresponds to the (002) crystal plane of rGO, and the position of rGO moves with the degree of GO reduction.32,33
 |
| | Fig. 4 (a) XRD of RuCo2O4/rGO@NF, rGO@NF and NF; (b) Raman spectra of RuCo2O4/rGO@NF, RuCo2O4@NF and GO, (c) fine spectra of RuCo2O4. | |
In addition, the size of the crystals was calculated according to the XRD pattern and Scherer's formula (eqn (2)).34
| |
 | (2) |
where
Dp is the crystallite size,
λ is the X-ray wavelength,
β is the full width at half maximum wavelength, and
θ is the diffraction angle. Furthermore,
K is 0.89, the Scherer constant, and
λ is 0.15406 nm.
The grain sizes of the five diffraction peaks located near 18.63, 36.12, 37.78, 43.91 and 54.51 are 24.20, 31.43, 18.02, 18.38 and 22.38 nm respectively, with an average of 22.88 nm. The planar spacing of RuCo2O4 can be calculated according to the Bragg equation. When the 2θ is 18.36 and 37.78, the planar spacing is 0.471 nm and 0.238 nm, respectively, which is consistent with that measured planar spacing by lattice fringes in TEM. The Bragg equation is shown below.
| | |
2dsinθ = nλ
| (3) |
where
d is the planar spacing,
θ is the diffraction angle,
λ is the wavelength of the X-ray, Cu Kα (
λ = 0.15406 nm), and
n is 1.
Raman spectroscopy was performed to determine whether rGO and RuCo2O4 were successfully loaded on NF substrate. In general, the Raman spectrum of graphene has two characteristic peaks: the D peak at 1350 cm−1 and the G peak at 1580 cm−1. The former is related to the A1g symmetry mode of graphene-based materials, reflecting the defects and disorder of graphene, and the latter is related to the E2g mode of graphene, which is caused by the planar vibrations of sp2 carbon atoms.35,36 As shown in Fig. 4b, there are D peaks (1348 cm−1) and G peaks (1588 cm−1) in GO and as-prepared RuCo2O4/rGO@NF composites, and their positions are also identical, indicating that rGO was successfully loaded on NF substrate. However, the peak intensity ratios (ID/IG) of D and G are significantly different. The ID/IG reflects the defect density and graphitization degree of the G-based materials. The ID/IG of RuCo2O4/rGO@NF (0.94) is higher than that of GO (0.80), indicating that the RuCo2O4/rGO@NF composites have more disorder. Meanwhile, the ID/IG of RuCo2O4/rGO@NF composites became larger compared with GO, indicating that the oxygen-containing functional groups in GO lamellae were removed and GO was reduced to some extent.37,38 The peaks of RuCo2O4 were also observed in the RuCo2O4@NF composite. The fine spectra of pure RuCo2O4 is shown in Fig. 4c. The two peaks at 186 and 521 cm−1 are associated with the F2g mode of RuCo2O4, while the two peaks at 473 and 671 cm−1 correspond to the Eg and A1g modes of RuCo2O4,12,39 respectively.
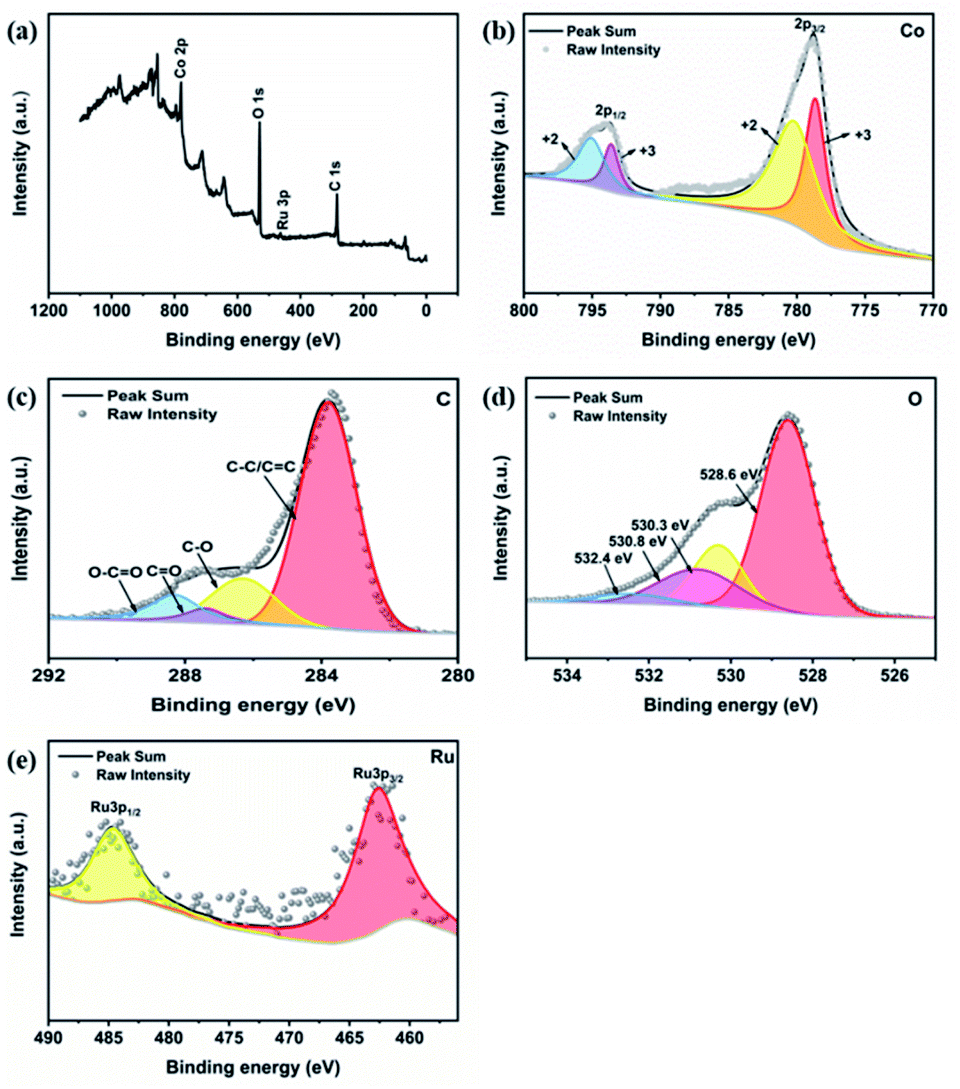
The full-width scanning spectra of the RuCo2O4/rGO@NF composite is shown in Fig. 5a. The characteristic peaks of C1s, Ru3p, Co2p and O1s were observed at binding energies of 284.4 eV, 463.9 eV, 779.2 eV and 533.2 eV, respectively, which indicate the presence of C, Ru, Co and O elements in the composite. The Co2p spectrum (Fig. 5b) reveals two double peaks and two vibrational peaks of Co2+ and Co3+. The deconvolution peaks at 780.2 and 795.05 eV correspond to Co2+, while the other two peaks centered at 778.64 eV and 793.6 eV are associated with Co3+,40 which confirms the existence of two oxidation states of Co in the prepared RuCo2O4/rGO@NF composites. The C1s spectrum of the RuCo2O4/rGO@NF composites (Fig. 5c) contains four peaks of C–C/C![[double bond, length as m-dash]](https://www.rsc.org/images/entities/char_e001.gif) C, C–O, CO and O–CO at 284.2, 286.3, 287.4 and 288.3 eV, respectively.41 The prominent peak belongs to the C–C/CC bond, and the peaks of the oxygen-containing functional groups are much lower than the C–C/CC functional group peak, indicating that GO has been effectively reduced. The O1s spectra in the RuCo2O4/rGO@NF composites can be deconvoluted into four peaks at different positions (Fig. 5d). Specifically, the peak observed at 528.6 eV is the metal–oxygen bond.42 The peak at 530.3 eV belongs to the oxygen in the surface hydroxyl group of RuCo2O4, suggesting that RuCo2O4 is hydroxylated and forms surface hydroxyl oxides. Furthermore, the peak at 530.8 eV is relevant to the presence of a large number of low-oxygen coordination defect sites in the material, and the peak at 532.4 eV is associated with the diversity of physically/chemisorbed water near or on the material.43 Fig. 5e shows the narrow spectrum of Ru3p with two distinct peaks at 462.7 eV and 484.7 eV, which correspond to the 3p3/2 and 3p1/2 orbitals of Ru4+, respectively.42
C, C–O, CO and O–CO at 284.2, 286.3, 287.4 and 288.3 eV, respectively.41 The prominent peak belongs to the C–C/CC bond, and the peaks of the oxygen-containing functional groups are much lower than the C–C/CC functional group peak, indicating that GO has been effectively reduced. The O1s spectra in the RuCo2O4/rGO@NF composites can be deconvoluted into four peaks at different positions (Fig. 5d). Specifically, the peak observed at 528.6 eV is the metal–oxygen bond.42 The peak at 530.3 eV belongs to the oxygen in the surface hydroxyl group of RuCo2O4, suggesting that RuCo2O4 is hydroxylated and forms surface hydroxyl oxides. Furthermore, the peak at 530.8 eV is relevant to the presence of a large number of low-oxygen coordination defect sites in the material, and the peak at 532.4 eV is associated with the diversity of physically/chemisorbed water near or on the material.43 Fig. 5e shows the narrow spectrum of Ru3p with two distinct peaks at 462.7 eV and 484.7 eV, which correspond to the 3p3/2 and 3p1/2 orbitals of Ru4+, respectively.42
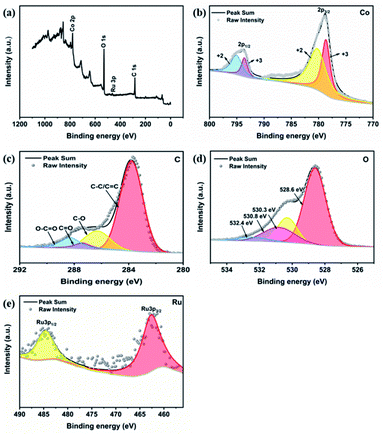 |
| | Fig. 5 (a) XPS full-width scanning spectra of RuCo2O4/rGO@NF; high-resolution XPS spectra of (b) Co2p, (c) C1s, (d) O1s, and (e) Ru3p. | |
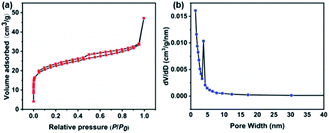
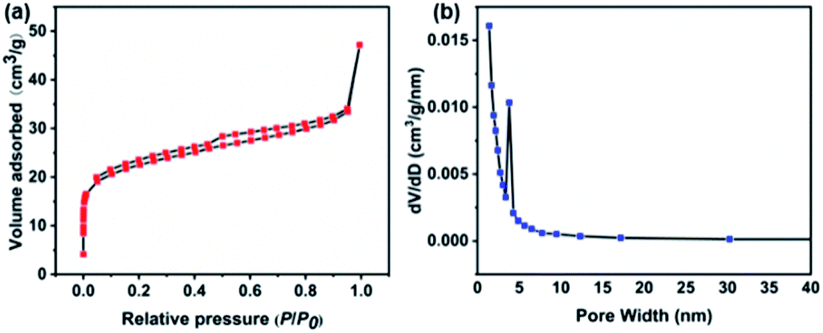
Nitrogen adsorption and desorption tests were performed to further investigate the specific surface area and pore size distribution information of RuCo2O4/rGO@NF.30 Fig. 6a depicts a representative adsorption–desorption isotherm, which belongs to the type IV with a hysteresis line in the range of 0.2–1.0 P/P0 and a BET specific surface area of 74.65 m2 g−1.44 The pore size distribution is shown in Fig. 6b. The sample is dominated by mesopores with a uniform distribution of pore sizes centered at 4 nm.45
 |
| | Fig. 6 The results of RuCo2O4/rGO@NF. (a) N2 adsorption/desorption isotherm; (b) pore size distribution. | |
3.2 Growth mechanism of RuCo2O4/rGO@NF
Based on the morphological and structural analysis, the possible growth mechanism for the synthesis of RuCo2O4/rGO@NF was proposed. First, during the hydrothermal process, metallic nickel on the surface of NF is directly oxidized to Ni(OH)2 in the presence of GO and O2, while GO is reduced to rGO.46–48 And rGO is tightly covered on the surface of NF by electrostatic force. Then, Ru3+ and Co2+ precipitate a mixture of precursors consisting of ruthenium hydroxyl carbonate and cobalt hydroxyl carbonate in the above environment.49,50 Finally, during the annealing process, the metal precursors are transformed into RuCo2O4 and Ni(OH)2 is converted into NiO.49 Therefore, the chemical reactions that may occur throughout the whole preparation process are as follows.29,49 It should be noted that a small part of nickel foam participated in the reaction in the hydrothermal process, but the capacitance contributed in the RuCo2O4/rGO@NF electrode composite material was very small.| | |
Ni + GO + O2 → Ni(OH)2 + rGO + H2O
| (4) |
| | |
NH2CONH2 + H2O → 2NH3 + CO2
| (5) |
| | |
Ru3+ + 2Co2+ + 3OH− + 2CO32− + 2H2O → RuCo2(OH)3(CO3)2·2H2O
| (9) |
| | |
4RuCo2(OH)3(CO3)2·2H2O + O2 → 4RuCo2O4 + 8CO2↑ + 14H2O↑
| (10) |
3.3 Electrochemical properties
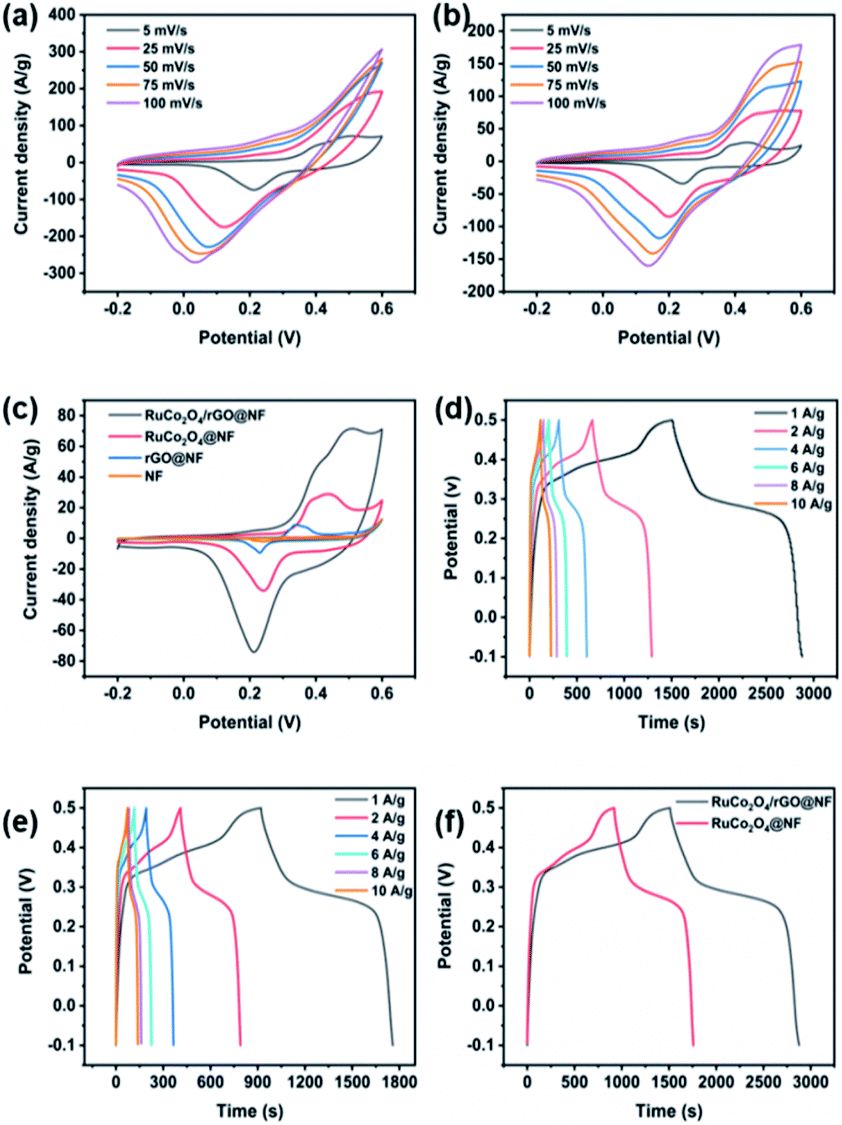
Here, the electrochemical properties of the RuCo2O4/rGO@NF composites were investigated in order to determine the best preparation method and performance. Fig. 7a exhibits the CV curves of the RuCo2O4/rGO@NF composite electrode. Apparently, all CV curves have a pair of redox peaks at scanning rates from 5 mV s−1 to 100 mV s−1, demonstrating that the specific capacitance of the RuCo2O4/rGO@NF composite electrode is primarily controlled by the Faraday redox reaction, which is completely different from the double-layer supercapacitor, whose CV curves are usually close to rectangular.51 The shape of the CV curves measured at various scanning rates hardly changes, but the area of the CV curves increases with increasing scanning rates, indicating that RuCo2O4/rGO@NF has good capacitive behavior and superior rate performance, and the same phenomenon appears in GCD.
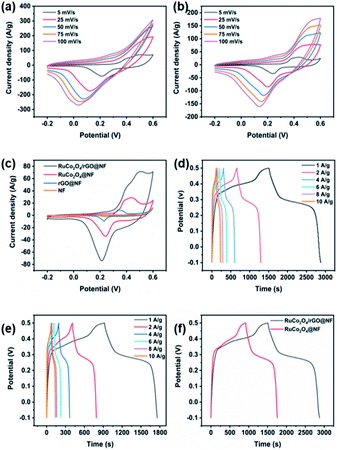 |
| | Fig. 7 (a, b) CV curves of RuCo2O4/rGO@NF and RuCo2O4@NF electrodes at various scanning rates; (c) CV comparison curves of RuCo2O4/rGO@NF, RuCo2O4@NF, rGO@NF and bare NF electrodes; (d, e) GCD curves of RuCo2O4/rGO@NF and RuCo2O4@NF electrodes at different current densities; (f) GCD curves of RuCo2O4/rGO@NF and RuCo2O4@NF electrodes at a current density of 1 A g−1. | |
It is worth noting that when the scan rate increases, the oxidation peak moves toward the higher potential and the reduction peak moves toward the lower potential, which may be related to the internal diffusion resistance of the electrode.52 Additionally, no significant oxidation peak was observed when the scan rate was increased to 25 mV s−1. Only by expanding the potential window, the oxidation peak of the CV curve can be found again at high scan rates. This phenomenon can be explained by the fact that the potential of the oxidation peak is higher than 0.6 V at high scan rates.19 Similarly, the redox peaks related to RuCo2O4 are also present in the CV curves of RuCo2O4@NF, as shown in Fig. 7b. The possible reaction mechanism of RuCo2O4 is shown below.53–56
| | |
RuCo2O4 + OH− + H2O = RuOOH + 2CoOOH + e−
| (12) |
| | |
CoOOH + OH− ↔ CoO2 + H2O + e−
| (13) |
| | |
RuOOH + OH− ↔ RuO2 + H2O + e−
| (14) |
It should be stated that in the electrochemical reaction, the redox reaction of RuCo2O4 is dominated, and we discuss the formation of the by-product NiO in the growth mechanism. Although its contribution to capacitance is small, this small fraction of NiO from the nickel foam substrate also undergoes redox reactions, as shown in the following equation.57
| | |
NiO + OH− ↔ NiOOH + e−
| (15) |
The peaks of RuCo2O4/rGO@NF (Fig. 7a) are more obvious than those of RuCo2O4@NF (Fig. 7b), indicating that the redox degree of RuCo2O4/rGO@NF is higher, which due to the larger specific surface area of the composite and the nanowire network structure that provides more active sites for the Faraday redox reaction. Fig. 7c presents the comparative plots of CV curves of pure NF, prepared rGO@NF, RuCo2O4@NF and RuCo2O4/rGO@NF samples. Eqn (16)58 shows that the specific capacitance is proportional to the area enclosed by the CV curve.59
| |
 | (16) |
where
Cp (F g
−1) is specific capacitance,

represent the area enclosed by the CV curve,
m (g) is the mass of active substance, Δ
V (V) is the CV test potential window, and
s (V s
−1) refers to the scan rate of the CV curve.
Obviously, the enclosed area of RuCo2O4/rGO@NF is much larger than that of RuCo2O4@NF, which indicates that the specific capacitance of RuCo2O4/rGO@NF is larger than that of RuCo2O4@NF. This indicates that the addition of rGO can improve the conductivity of RuCo2O4/rGO@NF electrode and can significantly increase its specific capacitance. Meanwhile, by comparing the area enclosed by the CV curves of rGO@NF and RuCo2O4@NF, it is possible to conclude that the majority of the capacitance comes from RuCo2O4 and only a small portion from rGO. By comparing the area enclosed by the pure NF and rGO/NF curves, it can be seen that there are no visible redox peaks in the CV curves of bare NF samples, and the closed area is relatively small. Therefore, the contribution of NF is almost negligible.10 The area of rGO/NF is significantly increased due to the dual effects of the double-layer capacitance of rGO and the pseudocapacitance of NF. It should be noted that the curve has a pair of small redox peaks, which is mainly attributed to the electrochemical reaction of a small amount of nickel oxide produced by the foamed nickel substrate. The reaction equation is shown in eqn (15).
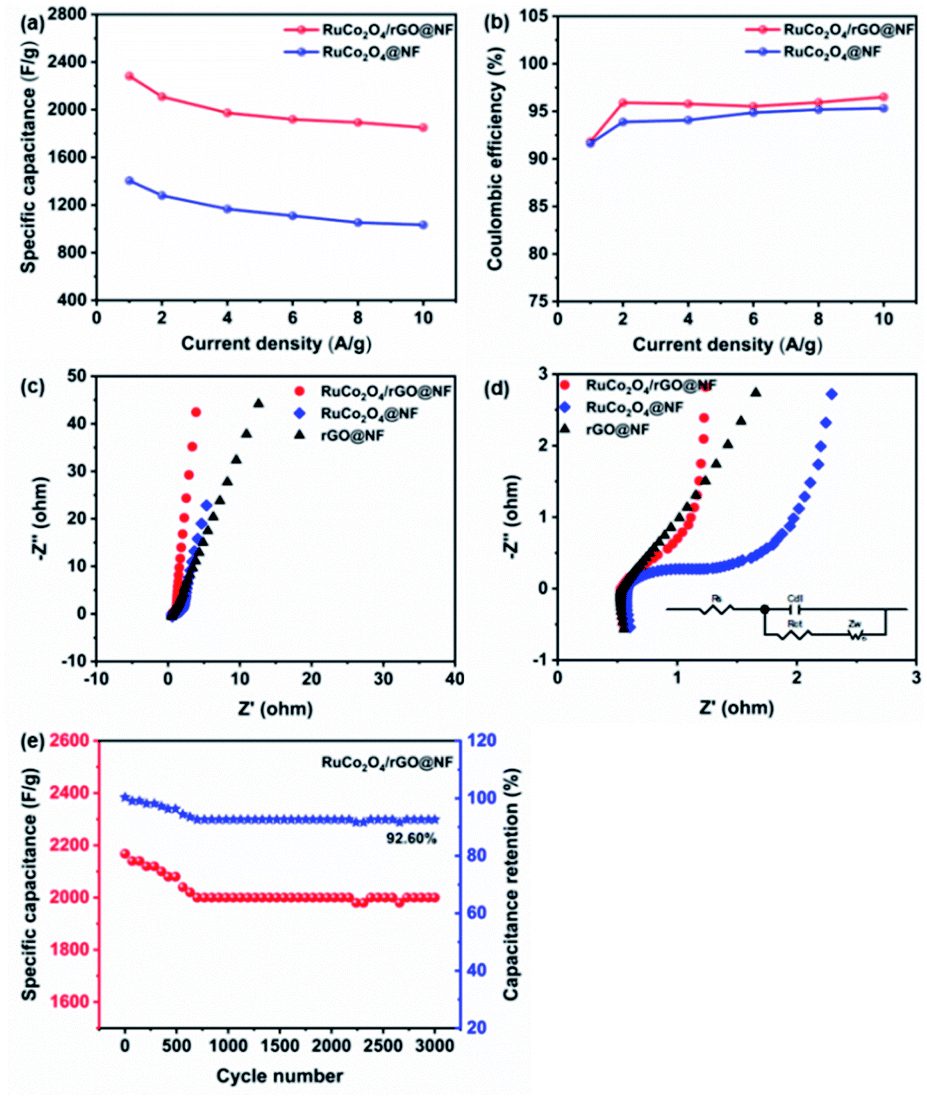
Fig. 7d and e show the galvanostatic charge/discharge curves of the RuCo2O4/rGO@NF and RuCo2O4@NF samples, respectively. Obviously, the discharging part of the GCD curve has two distinctive features for both RuCo2O4/rGO@NF electrode and RuCo2O4@NF electrode: the sudden drop of potential and the slow decay of potential, which are typical Faraday characteristics.36 Typically, the charging and discharging curves represent the oxidation and reduction processes, respectively, and these two parts are almost symmetrical throughout the process, indicating that the redox reaction at the electrode is reversible.64 The specific capacitance of the RuCo2O4/rGO@NF composite electrode is 2283, 2110, 1973, 1920, 1893 and 1850 F g−1 when the current density is 1, 2, 4, 6, 8 and 10 A g−1, respectively, as calculated from eqn (1). Under the same conditions, the specific capacitance of RuCo2O4@NF (1405, 1280, 1167, 1110, 1053, 1016 F g−1) is slightly smaller.
Fig. 8a reveals the curves of the specific capacitance varying with the current density. When the current density was changed from 1 to 10 A g−1, the capacitance retention of the RuCo2O4/rGO@NF and RuCo2O4@NF electrodes was 81% and 72%, respectively, which indicates that the prepared composite electrode has a superior rate capability. The specific capacitance decreases with increasing current density because the active material does not have enough time to participate in the reaction at higher current densities.35 Meanwhile, the specific capacitance of RuCo2O4/rGO@NF is much higher than that of RuCo2O4@NF (Fig. 7f) under the same current density. The substantial increase in specific capacitance is not only due to the synergistic effect between the fast electron transport channels provided by the open nanowire network structure and the more active sites provided by the rGO nanosheets, but is also related to the fact that the nanowire network structure is grown directly on the NF, shortening the transport path of electrolyte ions.65
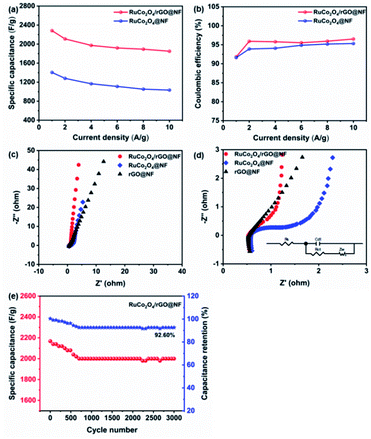 |
| | Fig. 8 (a) The specific capacitances of the prepared RuCo2O4/rGO@NF and RuCo2O4@NF composites under various current densities; (b) the Coulomb efficiency of the prepared RuCo2O4/rGO@NF and RuCo2O4@NF composites; (c) Nyquist diagrams of the prepared RuCo2O4/rGO@NF, RuCo2O4@NF and rGO@NF composites; (d) high-frequency region of (c), the circuit inset is the equivalent circuit modeled; (e) cyclic stability test of RuCo2O4/rGO@NF. | |
Fig. 8b shows the charge/discharge coulombic efficiency of RuCo2O4/rGO@NF and RuCo2O4@NF electrodes at different current densities. The calculation formula of coulombic efficiency is shown in eqn (17):
| |
 | (17) |
The coulombic efficiencies of RuCo2O4/rGO@NF and RuCo2O4@NF are 95% and 94%, respectively, indicating that the prepared electrode undergoes a reversible Faraday redox reaction.
Fig. 8c presents the Nyquist plots of the RuCo2O4/rGO@NF, RuCo2O4@NF and rGO@NF composite electrodes. These curves consist of two parts: a small circular curve in the high frequency region and a straight line in the low frequency region, the former being the charge transfer limiting process and the latter being the diffusion limiting process.66 It is well known that a larger diameter of the circular curve implies a larger charge transfer resistance (Rct), and a larger slope of the straight line results in a lower ion diffusion resistance. Obviously, the diameter of the circular curve of the RuCo2O4/rGO@NF (Rct = 0.3917) composite is smaller than that of RuCo2O4@NF (Rct = 0.4067). In addition, the straight line of RuCo2O4/rGO@NF is more vertical than RuCo2O4@NF and rGO@NF, which means that the electrolyte can enter RuCo2O4/rGO@NF electrode material more easily and with good permeability.12 The intercept of the Nyquist curve with the horizontal axis represents the equivalent series resistance (Rs) of the electrodes, which is one of the factors affecting the charge/discharge rate performance of the supercapacitor. As shown in Fig. 8d, the intercept between RuCo2O4/rGO@NF and the horizontal axis is smaller than RuCo2O4@/NF and rGO@NF, indicating that the electrolyte resistance is smaller and the composite material has good contact with the collector. Therefore, it can be concluded that the RuCo2O4/rGO@NF composites have low charge transfer resistance and good capacitive characteristics, which are similar to the analytical results of CV and GCD.
The cycling stability of the RuCo2O4/rGO@NF electrode was tested by continuous charge–discharge cycling at a high current density of 10 A g−1, as shown in Fig. 8e. The RuCo2O4/rGO@NF composite electrode exhibited good cycling stability and stable capacitance, and the specific capacitance retention rate was 92.60% after 3000 charge–discharge cycles. During the first 700 cycles, the capacity retention dropped from 100% to 92.60%. In the subsequent 2300 cycles, although there was a small fluctuation, the specific capacitance retention rate was always around 92.60%. The excellent cycling stability indicates the potential application of the RuCo2O4/rGO@NF electrode in supercapacitors. Table 2 shows the comparison results between the prepared electrodes and previous related studies. It is easy to see that the RuCo2O4/rGO@NF composite electrode has excellent performance in all aspects.
Table 2 The comparison results of electrochemical characteristics of the prepared RuCo2O4/rGO@NF electrode with those of previous studies
| Electrode materials |
Specific capacity |
Rate performance |
Cycle performance |
Current density |
Ref. |
| NiCo2S4@rGO |
2003 F g−1 at 1 A g−1 |
86% (1–20 A g−1) |
86% (3500 cycles) |
5 A g−1 |
60 |
| ZnCo2O4 flower |
1657 F g−1 at 1 A g−1 |
78% (1–16 A g−1) |
89% (2000 cycles) |
8 A g−1 |
61 |
| Co3O4/ZnCo2O4/CuO |
890 F g−1 at 1 A g−1 |
29.43% (1–10 A g−1) |
90% (1000 cycles) |
10 A g−1 |
62 |
| RuCo2O4 |
372 mA h g−1 at 3.3 A g−1 |
55% (3.3–41 A g−1) |
92% (10000 cycles) |
17 A g−1 |
63 |
| RuCo2O4 |
1469.2 F g−1 at 6.6 A g−1 |
72.8% (6.6–40 A g−1) |
91.3% (3000 cycles) |
13 A g−1 |
54 |
| RuCo2O4/rGO@NF |
2283 F g−1 at 1 A g−1 |
81% (1–10 A g−1) |
92.6% (3000 cycles) |
10 A g−1 |
This work |
Based on the above analysis, the reasons for the superior electrochemical characteristics of the RuCo2O4/rGO@NF nanowire electrode are as follows. Firstly, in RuCo2O4/rGO@NF composites, RuCo2O4 has more redox reaction active sites compared with single metal oxides,67 rGO has good electrical conductivity and large specific surface area, and NF provides strong support for the synthesis of the composites.68 Secondly, the thin and long nanowires are separated from each other to form a highly open network structure, which promotes ion diffusion at the electrolyte/electrode interface and brings the electrolyte solution into full contact with the electroactive reaction sites.69 Third, the composite material is grown directly on NF without the addition of conductive agents and binders, which avoids the blockage and destruction of the active material, ensures higher conductivity and reduces the contact resistance between the electroactive material and NF.70
4 Conclusions
A nanowire structure composite electrode of RuCo2O4 and reduced graphene oxide was prepared on nickel foam by a one-step hydrothermal method. Based on the dual synergistic effect of RuCo2O4 and reduced graphene oxide, the binder-free supercapacitor electrode achieved a specific capacitance of 2283 F g−1 at 1 A g−1. When the current density was increased from 1 A g−1 to 10 A g−1, the specific capacitance of the RuCo2O4/rGO@NF electrode decreased by only 19%. In addition, the capacitance retention of the electrode was 92.60% after 3000 cycles at a current density of 10 A g−1. The results show that it has excellent cyclic stability The excellent electrochemical performance of the three-electrode is attributed to the unique nanowire network structure of RuCo2O4, the large specific surface area of reduced graphene oxide and the three-dimensional porous conductive structure of NF, as well as the synergistic effect among the three. These advantages shorten the ion transport path, increase the redox reaction active sites, enhance the contact between the electrode and the electrolyte solution, and improve the electrochemical performance. This synthetic route can directly prepare NF-loaded bimetallic oxide and reduced graphene oxide composite electrode materials, which provides a new idea for the design and preparation of practical supercapacitor electrode materials.
Conflicts of interest
There are no conflicts to declare.
Acknowledgements
We sincerely thank the National Natural Science Foundation of China (No. 21271027) for their help in this work.
Notes and references
- L. Bao, J. Zang and X. Li, Nano Lett., 2011, 11, 1215–1220 CrossRef CAS PubMed.
- Z. Fan, J. Yan, W. Tong, L. Zhi, G. Ning, T. Li and W. Fei, Adv. Funct. Mater., 2011, 21, 2366–2375 CrossRef CAS.
- Y. Liu, N. Fu, G. Zhang, M. Xu, W. Lu, L. Zhou and H. Huang, Adv. Funct. Mater., 2017, 27, 1605307 CrossRef.
- C. Hao, L. Hu, C. Min, Y. Yan and L. Wu, Adv. Funct. Mater., 2014, 24, 934–942 CrossRef.
- T. Thomberg, H. Kurig, A. Jänes and E. Lust, Microporous Mesoporous Mater., 2011, 141, 88–93 CrossRef CAS.
- Y. Gao, G. P. Pandey, J. Turner, C. R. Westgate and B. Sammakia, Nanoscale Res. Lett., 2012, 7, 651 CrossRef PubMed.
- J. J. Yoo, K. Balakrishnan, J. Huang, V. Meunier, B. G. Sumpter, A. Srivastava, M. Conway, A. M. Reddy, J. Yu and R. Vajtai, Nano Lett., 2011, 11, 1423–1427 CrossRef CAS PubMed.
- X. Zhang, Z. Lin, B. Chen, W. Zhang, S. Sharma, W. Gu and Y. Deng, J. Power Sources, 2014, 246, 283–289 CrossRef CAS.
- H. Y. Wu and H. W. Wang, Int. J. Electrochem. Sci., 2012, 7, 4405–4417 CAS.
- C. Tang, X. Yin and H. Gong, ACS Appl. Mater. Interfaces, 2013, 5, 10574–10582 CrossRef CAS PubMed.
- M. He, L. Cao, W. Li, X. Chang and Z. Ren, J. Mater. Sci., 2021, 8613–8626 CrossRef CAS.
- A. Lv, S. Lu, W. Xu, Z. Wang, Y. Shen and G. Liu, Appl. Surf. Sci., 2020, 511, 145538 CrossRef CAS.
- S. S. Karade, S. Lalwani, J. H. Eum and H. Kim, Sustainable Energy Fuels, 2020, 4, 3066–3076 RSC.
- A. A. Khaleed, A. Bello, J. K. Dangbegnon, F. U. Ugbo, F. Barzegar, D. Y. Momodu, M. J. Madito, T. M. Masikhwa, O. Olaniyan and N. Manyala, J. Mater. Sci., 2016, 51, 6041–6050 CrossRef CAS.
- J. W. Liang, D. H. Wei and Y. C. Zhu, Part. Part. Syst. Charact., 2013, 30, 143–147 CrossRef.
- Y. Fang, B. Luo, Y. Jia, X. Li, B. Wang, Q. Song, F. Kang and L. Zhi, Adv. Mater., 2012, 24, 6348–6355 CrossRef CAS PubMed.
- Y. Bo, L. Na, H. Zhu, X. Zhu and J. Yang, ChemSusChem, 2013, 6, 474–480 CrossRef PubMed.
- B. You, L. Wang, Y. Li and J. Yang, Chem. Commun., 2013, 49, 5016–5018 RSC.
- S. Min, C. Zhao, G. Chen and X. Qian, Electrochim. Acta, 2014, 115, 155–164 CrossRef CAS.
- H. Liu, J. Zhang, D. Xu, B. Zhang, S. Lei, L. Huang and S. Tan, Appl. Surf. Sci., 2014, 317, 370–377 CrossRef CAS.
- J. Ma, K. Wang, L. Li, T. Zhang, Y. Kong and S. Komarneni, Ceram. Int., 2015, 41, 2050–2056 CrossRef CAS.
- Z. Zhang, R. Cui, Y. Xiao, C. Li and G. Lv, Nanotechnology, 2020, 31, 445402 CrossRef PubMed.
- X. Wang, Y. Xiao, D. Su, L. Zhou, S. Wu, L. Han, S. Fang and S. Cao, Electrochim. Acta, 2016, 377–384 CrossRef.
- H. Jeon, J. H. Han, D. M. Yu, J. Y. Lee and Y. T. Hong, J. Ind. Eng. Chem., 2016, 45, 105–110 CrossRef.
- N. Cirigliano, E. Perre, C. J. Kim and B. Dunn, Chem. Rev., 2012, 104, 4463–4492 Search PubMed.
- K. Xu, R. Zou, W. Li, L. Qian, X. Liu, A. Lei and J. Hu, J. Mater. Chem. A, 2014, 2, 10090–10097 RSC.
- H. Wang, Y. Liang, T. Mirfakhrai, Z. Chen and H. S. Casalongue, Nano Res., 2011, 4, 729–736 CrossRef CAS.
- B. Hou, Y. Guo, W. Guo and L. Hou, J. Alloys Compd., 2017, 708, 524–530 CrossRef.
- J. Wu, R. Mi, S. Li, P. Guo, J. Mei, H. Liu, W. M. Lau and L. M. Liu, RSC Adv., 2015, 5, 25304–25311 RSC.
- C. Liu, W. Jiang, F. Hu, X. Wu and D. Xue, Inorg. Chem. Front., 2018, 835–843 RSC.
- D. Li, Y. Gong, M. Wang and C. Pan, Nano-Micro Lett., 2017, 9, 33–41 CrossRef PubMed.
- D. Mandal, P. Routh and A. K. Nandi, ChemistrySelect, 2017, 2, 3163–3171 CrossRef CAS.
- A. K. Nandi, D. Mandal, P. Routh and A. K. Mahato, ChemElectroChem, 2019, 5136–5148 Search PubMed.
- B. Saravanakumar, G. Ravi, V. Ganesh, R. K. Guduru and R. Yuvakkumar, Mater. Sci. Energy Technol., 2019, 2, 130–138 Search PubMed.
- J. Balamurugan, T. D. Thanh, S. B. Heo, N. H. Kim and J. H. Lee, Carbon, 2015, 94, 962–970 CrossRef CAS.
- C. Zhao, P. Ju, S. Wang, Y. Zhang, S. Min and X. Qian, Electrochim. Acta, 2016, 218, 216–227 CrossRef CAS.
- Y. Liu, J. Zhou, J. Tang and W. Tang, Chem. Mater., 2015, 7034–7041 CrossRef CAS.
- F. Wang, G. Li, Q. Zhou, J. Zheng, C. Yang and Q. Wang, Appl. Surf. Sci., 2017, 425, 180–187 CrossRef CAS.
- D. Zhang, H. Yan, Y. Lu, K. Qiu, C. Wang, Y. Zhang, X. Liu, J. Luo and Y. Luo, Dalton Trans., 2014, 43, 15887–15897 RSC.
- D. P. Dubal, N. R. Chodankar, R. Holze and D.-H. Kim, ChemSusChem, 2017, 1771–1782 CrossRef CAS PubMed.
- S. Yang, Y. Lin, X. Song, P. Zhang and L. Gao, ACS Appl. Mater. Interfaces, 2015, 7, 17884 CrossRef CAS PubMed.
- N. R. Chodankar, D. P. Dubal, S. Ji and D. Kim, Adv. Mater. Interfaces, 2018, 5, 1800283 CrossRef.
- N. Garg, M. Basu and A. K. Ganguli, J. Phys. Chem. C, 2014, 17332–17341 CrossRef CAS.
- L. Jinlong, Z. Wang, L. Tongxiang, Y. Meng, K. Suzuki and H. Miura, J. Electroanal. Chem., 2017, 799, 595–601 CrossRef.
- S. Hussain, M. Hassan, M. S. Javed, A. Shaheen and G. Liu, Ceram. Int., 2020, 835–843 Search PubMed.
- S. Min, C. Zhao, Z. Zhang, K. Wang, G. Chen, X. Qian and Z. Guo, RSC Adv., 2015, 5, 62571–62576 RSC.
- C. Zhao, S.-L. Chou, Y. Wang, C. Zhou, H.-K. Liu and S.-X. Dou, RSC Adv., 2013, 3, 16597–16603 RSC.
- S. Min, C. Zhao, G. Chen and X. Qian, Electrochim. Acta, 2014, 115, 155–164 CrossRef CAS.
- S. Sahoo and J. J. Shim, ACS Sustainable Chem. Eng., 2016, 241–251 Search PubMed.
- S. Vijayanand, P. A. Joy, H. S. Potdar, D. Patil and P. Patil, Sens. Actuators, B, 2010, 121–129 Search PubMed.
- J. Zhang, J. Jiang and X. S. Zhao, J. Phys. Chem. C, 2011, 115, 6448–6454 CrossRef CAS.
- L. Jiang, R. Zou, W. Li, J. Sun, X. Hu, Y. Xue, G. He and J. Hu, J. Mater. Chem. A, 2013, 1, 478–481 RSC.
- N. R. Chodankar, D. P. Dubal, S.-H. Ji and D.-H. Kim, Adv. Mater. Interfaces, 2018, 5, 1800283 CrossRef.
- D. Dubal, N. Chodankar, R. Holze, D.-H. Kim and P. Gomez-Romero, ChemSusChem, 2017, 10, 1771–1782 CrossRef CAS PubMed.
- L. Q. Mai, F. Yang, Y. L. Zhao, X. Xu, L. Xu and Y. Z. Luo, Nat. Commun., 2011, 2, 1–5 Search PubMed.
- J. Wang, T. Ye, Y. Shao, Z. Lu, Y. Lin, H. Wu, G. Li, K. Chen and D. Tang, J. Electrochem. Soc., 2021, 168, 120553 CrossRef.
- Y. J. Yang, J. Appl. Electrochem., 2020, 50, 1301–1313 CrossRef CAS.
- A. A. Ensafi, N. Ahmadi and B. Rezaei, RSC Adv., 2015, 5, 91448–91456 RSC.
- A. K. Nandi, M. Debasish and R. Parimal, Chem.–Asian J., 2018, 13, 1–38 CrossRef.
- F. Wang, G. Li, Q. Zhou, J. Zheng, C. Yang and Q. Wang, Appl. Surf. Sci., 2017, 425, 180–187 CrossRef CAS.
- G. Rajeshkhanna and G. R. Rao, Electrochim. Acta, 2018, 261, 265–274 CrossRef CAS.
- S. Zhou, Z. Ye, S. Hu, C. Hao, X. Wang, C. Huang and F. Wu, Nanoscale, 2018, 10, 15771–15781 RSC.
- S. S. Karade, S. Lalwani, J.-H. Eum and H. Kim, Sustainable Energy Fuels, 2020, 4, 3066–3076 RSC.
- C. Xia, Y. Xie, Y. Wang, W. Wang and H. Du, J. Appl. Electrochem., 2013, 1225–1233 CrossRef CAS.
- Y. Zhang and Z. Guo, Chem. Commun., 2014, 50, 3443–3446 RSC.
- X. Chen, X. Chen, F. Zhang, Y. Zhi and S. Huang, J. Power Sources, 2013, 243, 555–561 CrossRef CAS.
- J. Li, Y. Zou, B. Li, F. Xu and C. Xiang, Ceram. Int., 2021, 16562–16569 CrossRef CAS.
- S. Kong, K. Cheng, T. Ouyang, K. Ye and G. Wang, J. Electroanal. Chem., 2017, 35–42 CrossRef CAS.
- K. N. Hui, K. S. Hui, Z. Tang, V. V. Jadhav and Q. X. Xia, J. Power Sources, 2016, 330, 195–203 CrossRef CAS.
- H. Peng, G. Wei, K. Sun, G. Ma, E. Feng, X. Yang and Z. Lei, New J. Chem., 2018, 42, 18328–18334 RSC.
|
| This journal is © The Royal Society of Chemistry 2022 |
Click here to see how this site uses Cookies. View our privacy policy here. 
 Open Access Article
 This Open Access Article is licensed under a Creative Commons Attribution-Non Commercial 3.0 Unported Licence
 *,
Wenguo Xu,
Shuguang Li and
Xiuqi Dong
*,
Wenguo Xu,
Shuguang Li and
Xiuqi Dong

 represent the area enclosed by the CV curve, m (g) is the mass of active substance, ΔV (V) is the CV test potential window, and s (V s−1) refers to the scan rate of the CV curve.