 Open Access Article
Preparation and characterization of pure phase CdMnTe nanopowders by a hydrothermal route
Pengfei Yu *,
Tingquan Shao,
Wenfei Liu,
Pandeng Gao,
Biru Jiang,
Shiwei Zhao,
Zhao Han,
Xuanbing Gu and
Jiahong Zheng
School of Materials Science and Engineering, Chang'an University, Xi'an 710061, China. E-mail: yupengfei@chd.edu.cn; Fax: +86 29 88495414; Tel: +86 29 88486065
First published on 29th June 2022
Abstract
In this paper, CdMnTe nanopowders with uniform shapes were prepared through a facile hydrothermal route using 3-mercaptopropionic acid (MPA) as the stabilizer and modifier. The effects of different experimental conditions including Cd-to-MPA ratio, pH value and reaction temperature on the phase composition and formation mechanism of as-prepared nanopowders were studied. XRD results indicated as-prepared CdMnTe nanopowders were pure phase and had cubic sphalerite structure with high crystallinity. SEM and Rietveld refinement clearly showed that the powders were about 10–100 nm in size. In PL measurement, there was a strong luminescence peak in the infrared region 1.717–1.826 eV. Compared with the CdMnTe single crystal, a blue shift of about 0.109 eV indicated a wider band gap. In UV-vis spectra, the absorption peak of the sample blue shifted with the decrease of crystal size, which indicated an obvious quantum confinement effect (QCE) in nanopowders. The optimal conditions for the preparation of CdMnTe nanopowders are 180 °C for 24 h with the molar ratio 1![[thin space (1/6-em)]](https://www.rsc.org/images/entities/char_2009.gif) :
:![[thin space (1/6-em)]](https://www.rsc.org/images/entities/char_2009.gif) 1 of Cd
1 of Cd![[thin space (1/6-em)]](https://www.rsc.org/images/entities/char_2009.gif) :
:![[thin space (1/6-em)]](https://www.rsc.org/images/entities/char_2009.gif) MPA at pH 13. In particular, the growth kinetics and possible formation mechanism of the nanopowders were proposed.
MPA at pH 13. In particular, the growth kinetics and possible formation mechanism of the nanopowders were proposed.
1. Introduction
Cadmium manganese tellurium (CdMnTe) is a promising candidate material for semiconductor radiation detectors with a wide band gap, high resistivity, high carrier mobility, and special photoelectric properties.1–7 CdMnTe single crystals can be synthesized via Czochralski (CZ),8 Bridgeman,9,10 and Vertical Gradient Freeze (VGF) methods.11 However, these fabrication techniques allow the crystal growth and sputtering to be manipulated with a high degree of accuracy, but long time and high cost of these methods are needed.11–13 In recent years, many methods have been developed to produce high-quality nanopowders with novel structure and functionalities. CdTe quantum dots (QDs) are considered to be high-quality QDs due to their excellent photoluminescence properties.14,15 They are used in solar energy, light-emitting diodes, and bioimaging applications.16 Balakrishnan et al. synthesized CdZnTe QDs in aqueous solution by a reflux method.17 Compared to CdTe QDs, CdZnTe QDs have less nonradiative recombination centers and lower defect density. Some studies have been reported the synthesis of Mn2+ partially substituted Cd2+ ions in CdTe lattices.18 However, Bhattacharyya et al. performed a one-step kinetically controlled solid-state reaction at high temperature (1000 °C) to incorporate carbon-coated Mn-doped CdTe nanocrystals, but the atomic ratio of Mn/Cd was 0.031.13 The hydrothermal route provides a viable way for Mn ion to be doped in CdTe. This method can conveniently prepare high-quality nanopowders at low temperature with controllable morphologies. It can also be used to prepare CdMnTe nanopowders. Some studies show that the prepared CdMnTe QDs can be applied in biochemical detection and biomedicine due to their unique properties, but the prepared quantum dots contain impurities.19,20 CdMnTe single crystal is an important material for room temperature radiation detectors, and the preparation of nano-powders with high purity is significant for growing CdMnTe single crystals.21–23In this work, pure CdMnTe nanopowders were synthesized by a hydrothermal route, and C3H6O2S (MPA) was used as a stabilizer to give them good dispersibility. The optimal experimental conditions such as the molar ratio of Cd![[thin space (1/6-em)]](https://www.rsc.org/images/entities/char_2009.gif) :
:![[thin space (1/6-em)]](https://www.rsc.org/images/entities/char_2009.gif) MPA, reaction temperature and pH value were determined. The properties of the CdMnTe nanopowders were characterized by various equipments including X-ray diffraction (XRD), scanning electron microscopy (SEM), Transmission Electron Microscope (TEM), photoluminescence spectroscopy (PL), X-ray photoelectron spectroscopy (XPS) and ultraviolet absorption spectroscopy (UV-vis). Qualitative and doping studies of the nanopowders were carried out using electron diffraction spectroscopy (EDS), thereby proposing the formation mechanism of CdMnTe nuclei. The as-prepared CdMnTe nanopowders can be further used to synthesize CdMnTe single crystal.
MPA, reaction temperature and pH value were determined. The properties of the CdMnTe nanopowders were characterized by various equipments including X-ray diffraction (XRD), scanning electron microscopy (SEM), Transmission Electron Microscope (TEM), photoluminescence spectroscopy (PL), X-ray photoelectron spectroscopy (XPS) and ultraviolet absorption spectroscopy (UV-vis). Qualitative and doping studies of the nanopowders were carried out using electron diffraction spectroscopy (EDS), thereby proposing the formation mechanism of CdMnTe nuclei. The as-prepared CdMnTe nanopowders can be further used to synthesize CdMnTe single crystal.
2. Methods
2.1 Hydrothermal synthesis
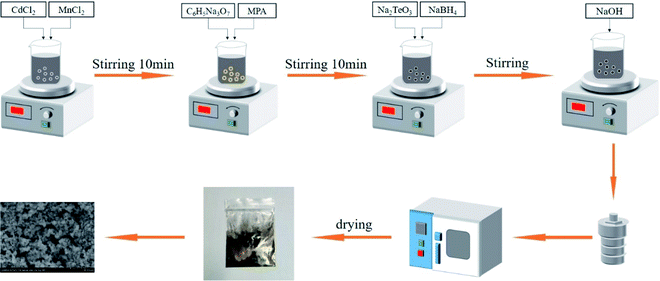
The cadmium chloride (CdCl2), manganese chloride (MnCl2), sodium citrate (C6H5Na3O7), mercapto propionic acid (MPA) and sodium borohydride (NaBH4) used in this paper were analytical level reagents and could be used directly without further purification.Firstly, a mixed solution constituted with 30 mmol of CdCl2 and 13 mmol of MnCl2 solutions was magnetically stirred for 10 min. Then, 4 mmol of C6H5Na3O7 and 14 mmol of MPA were added into the above solution to prevent the oxidation of Cd2+ and Mn2+. Later, 43.7 mmol of Na2TeO3 and 90 mmol of NaBH4 were added to the above solution, respectively. Finally, the pH was changed to 11–14 by dropwise addition of NaOH solution (4 M). The molar ratio of Cd, Mn, Te and MPA referred was 1![[thin space (1/6-em)]](https://www.rsc.org/images/entities/char_2009.gif) :
:![[thin space (1/6-em)]](https://www.rsc.org/images/entities/char_2009.gif) 0.5
0.5![[thin space (1/6-em)]](https://www.rsc.org/images/entities/char_2009.gif) :
:![[thin space (1/6-em)]](https://www.rsc.org/images/entities/char_2009.gif) 1.5
1.5![[thin space (1/6-em)]](https://www.rsc.org/images/entities/char_2009.gif) :
:![[thin space (1/6-em)]](https://www.rsc.org/images/entities/char_2009.gif) n (n = 1, 1.5, 2). The mixed solution then got transferred into sealed stainless steel autoclave to proceed the hydrothermal reaction at desired temperature (140 °C, 160 °C, 180 °C, 200 °C). Then, the autoclave was cooled to room temperature. The bottom sediment was placed in a test tube for centrifugation. The nanopowders were washed with deionized water and ethanol twice in sequence, and then dried in air at 80 °C for 12 h. The experimental process is shown in Fig. 1.
n (n = 1, 1.5, 2). The mixed solution then got transferred into sealed stainless steel autoclave to proceed the hydrothermal reaction at desired temperature (140 °C, 160 °C, 180 °C, 200 °C). Then, the autoclave was cooled to room temperature. The bottom sediment was placed in a test tube for centrifugation. The nanopowders were washed with deionized water and ethanol twice in sequence, and then dried in air at 80 °C for 12 h. The experimental process is shown in Fig. 1.
For preparing the CdMnTe nanopowders, how different Cd![[thin space (1/6-em)]](https://www.rsc.org/images/entities/char_2009.gif) :
:![[thin space (1/6-em)]](https://www.rsc.org/images/entities/char_2009.gif) MPA ratio, pH value and reaction temperature affect the morphology and size of the prepared samples were investigated, while other reaction factors remained unchanged.19,20 First, the CdMnTe nanopowders prepared at different temperatures, kept other conditions fixed. Our work showed that increasing pH yielded purer CdMnTe nanopowders. Then, the amount of MPA added was changed and other reaction parameters were fixed (the molar ratio of Cd
MPA ratio, pH value and reaction temperature affect the morphology and size of the prepared samples were investigated, while other reaction factors remained unchanged.19,20 First, the CdMnTe nanopowders prepared at different temperatures, kept other conditions fixed. Our work showed that increasing pH yielded purer CdMnTe nanopowders. Then, the amount of MPA added was changed and other reaction parameters were fixed (the molar ratio of Cd![[thin space (1/6-em)]](https://www.rsc.org/images/entities/char_2009.gif) :
:![[thin space (1/6-em)]](https://www.rsc.org/images/entities/char_2009.gif) Mn
Mn![[thin space (1/6-em)]](https://www.rsc.org/images/entities/char_2009.gif) :
:![[thin space (1/6-em)]](https://www.rsc.org/images/entities/char_2009.gif) Te was 1
Te was 1![[thin space (1/6-em)]](https://www.rsc.org/images/entities/char_2009.gif) :
:![[thin space (1/6-em)]](https://www.rsc.org/images/entities/char_2009.gif) 0.5
0.5![[thin space (1/6-em)]](https://www.rsc.org/images/entities/char_2009.gif) :
:![[thin space (1/6-em)]](https://www.rsc.org/images/entities/char_2009.gif) 1.5, the reaction temperature was 180 °C, and the reaction time was 24 h).
1.5, the reaction temperature was 180 °C, and the reaction time was 24 h).
2.2 Characterization
X-ray powder diffraction (XRD) measurement was conducted on a diffractometer on a D8 ADVANCE using Cu Kα radiation (λ = 1.5418 Å). Scanning electron microscope (SEM) with energy dispersive X-ray spectroscopy (EDS) was inspected the preparation of the morphology and composition of the sample. In addition, crystalline features were investigated by high-resolution observations conducted in the transmission electron microscopy (HR-TEM, JEOL JEM-F200) operates at 200 kV. The low-temperature (10 K) PL spectrum was tested using a 488 nm Ar-ion laser as the excitation source. The sample was attached on a cold copper finger in a closed-cycle cryostat. And the test device was equipped with TRIAX 550 tri-grating monochromator and photomultiplier tube with a resolution of better than 0.3 nm. An argon ion laser Ultraviolet-vis spectroscopy (UV-vis) was tested by a SHIMADZU UV-3150 spectrometer in the wavelength range of 600–300 nm at room temperature. X-ray photoelectron spectroscopy (XPS) measurements were obtained with a Thermo Scientific K-Alpha + X-ray photoelectron spectrometer. Moreover, Raman spectrum was measured at room temperature using Horiba Scientific LabRAM HR Evolution with a 532 nm laser beam.Work had compared the structure and calculated structure of CdMnTe nanopowders with Rietveld refinement algorithm.24 The refinement parameters, such as background, lattice parameters, crystallite size, profile half width, local strain, thermal isotropic vectors, and spatial coordinates had been calculated. These parameters provided high precision for studying the structure of the CdMnTe nanopowders.
3. Results and discussion
3.1 Effects of different experiment conditions on phase and morphology of CdMnTe nanopowders
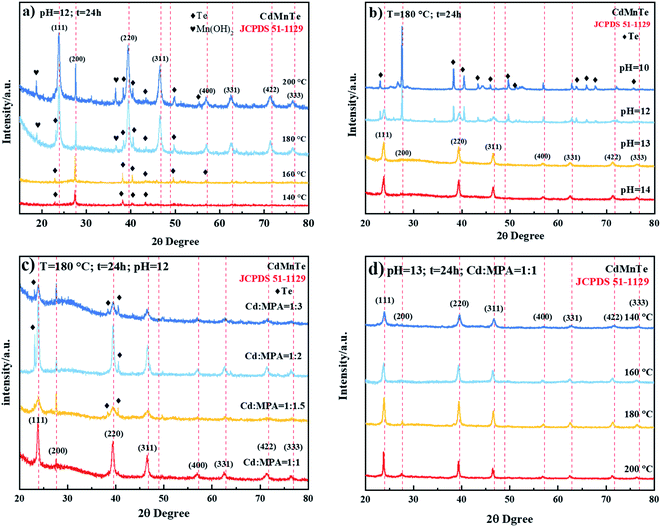
Fig. 2 shows XRD patterns of the nanopowders prepared at different conditions. The diffraction peaks of prepared nanopowders correspond perfectly with card JCPDS-51-1129 (red dashed line). In Fig. 2a, it can be seen that XRD lines shift progressively at small 2θ angles and the crystal quality is also improved as temperature increases. Therefore, it indicates that the hydrothermal route will accelerate the reaction process, and the quality of the as-prepared CdMnTe nanopowders is improved at higher reaction temperatures. The reaction rate will decrease with temperature and the process will be inhibited at 140 °C. Under the strong alkaline condition (pH = 13), the formation of hydrogen bonds cause growth of CdTe crystal nucleus, prepared pure CdMnTe nanopowders (Fig. 2b). However, when the pH of the solution is not high (pH = 11, 12), products have Te impurity. Fig. 2c shows the optimal molar ratio of Cd to MPA is 1. MPA, as one of the organic stabilizers, can be used to achieve shape and size control, change the surface energy of crystals, and tune the kinetics of crystal growth. Under the condition of less than 200 °C, it still maintains high thermal stability in terms of crystal nucleation, growth, and alignment control.19,25 MPA can provide hydrogen bonds and generate cross-linking reaction. When the ratio of MPA to Cd ions is 1, cross-linking reaction occurs with Cd ions and Mn ions, then combined with Te ions in equal proportions to form CdMnTe nanopowders. When the reaction temperature increases from 140 °C to 200 °C, the crystal quality is improved, as shown in Fig. 2d. Thus, the optimal condition for the preparation of CdMnTe nanopowders is 180 °C for 24 h with the molar ratio 1![[thin space (1/6-em)]](https://www.rsc.org/images/entities/char_2009.gif) :
:![[thin space (1/6-em)]](https://www.rsc.org/images/entities/char_2009.gif) 1 of Cd
1 of Cd![[thin space (1/6-em)]](https://www.rsc.org/images/entities/char_2009.gif) :
:![[thin space (1/6-em)]](https://www.rsc.org/images/entities/char_2009.gif) MPA at pH 13.
MPA at pH 13.
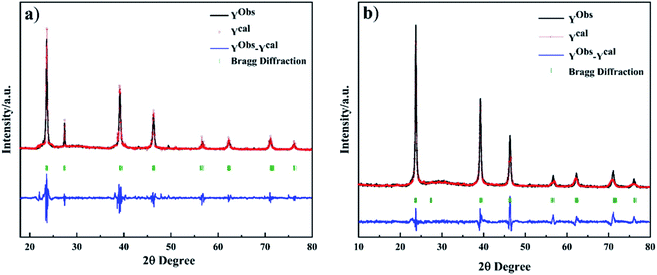
Fig. 3 shows Rietveld refinement plot of CdMnTe nanopowders prepared with different reaction temperature. The calculated diffraction profiles are in good agreement with the experimental results, indicating a high degree of accuracy between the experimental and calculated patterns. The calculated Bragg diffraction corresponds exactly to the peaks of card PDF-51-1129. The calculated lattice parameters of CdMnTe nanopowders at different temperatures is shown in Table 1. As the temperature increases, a0, b0 and c0 all increase linearly due to the substitution of Mn2+ for Cd2+ in the CdTe lattice, resulting in an increase in nanopowders volume. The results confirm that MPA reacts with Cd2+ and Mn2+ ions to form stable Cd2+–RS− and Mn2+–RS− complexes, causing more Te to compensate for the positive charge. This confirms that the Mn2+ will incorporated into CdTe during crystallization, and pure CdMnTe nanopowders need to be prepared by hydrothermal conditions.22 According to the above analysis, it is concluded that the growth process of CdMnTe nanocrystals is directional adhesion.
![[thin space (1/6-em)]](https://www.rsc.org/images/entities/char_2009.gif) :
:![[thin space (1/6-em)]](https://www.rsc.org/images/entities/char_2009.gif) MPA = 1
MPA = 1![[thin space (1/6-em)]](https://www.rsc.org/images/entities/char_2009.gif) :
:![[thin space (1/6-em)]](https://www.rsc.org/images/entities/char_2009.gif) 1, pH = 13 and 24 h
1, pH = 13 and 24 h
| T/Ka | GOF/χ2 | Nominal mol% | Lattice parameterb | Cell volume (Å3) | Rwp | Rp | Crystallite size (nm) | |
|---|---|---|---|---|---|---|---|---|
| Cd2+ | Mn2+ | a0 (Å) = b0 = c0 | ||||||
| a Identification number samples: CdMnTe nanopowders with 140, 160, 180 and 200 °C, pH = 13 and the molar ratio of MPA and Cd is 1, respectively.b Values obtained from refinement of XRD patterns carried out using the Rietveld method. | ||||||||
| 413.15 | 2.7 | 0.805 | 0.195 | 6.49285 | 273.720 | 0.09 | 0.07 | 18.8(1.5) |
| 433.15 | 2.8 | 0.771 | 0.229 | 6.50198 | 274.876 | 0.09 | 0.08 | 29.4(7.5) |
| 453.15 | 4.6 | 0.755 | 0.245 | 6.51014 | 275.912 | 0.14 | 0.11 | 38.9(0.5) |
| 473.15 | 5.4 | 0.767 | 0.233 | 6.50752 | 275.579 | 0.17 | 0.14 | 42.0(6.7) |
3.2 Morphological aspects of the CdMnTe nanopowders prepared hydrothermally
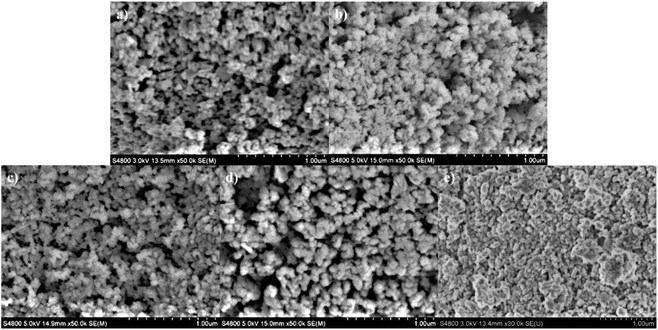
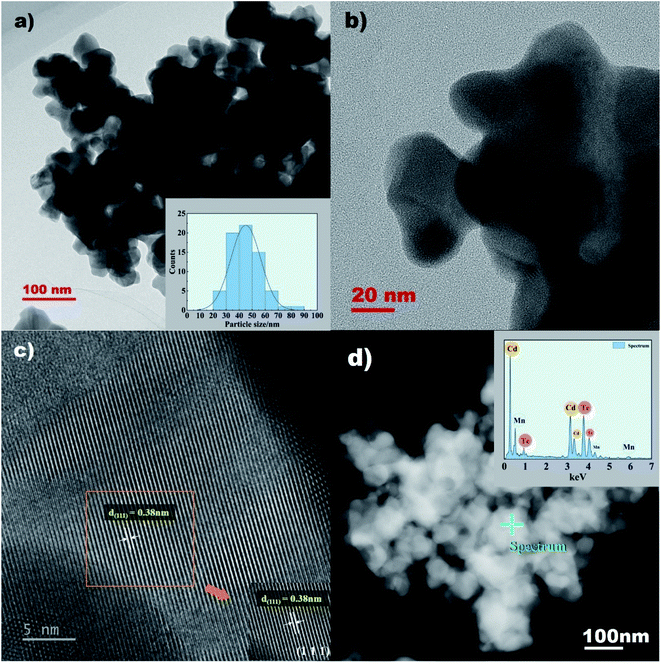
The morphology of the CdMnTe nanopowders is analyzed by SEM micrographs, as shown in Fig. 4. The CdMnTe nanopowders are spherical and the particle size is 20–100 nm. When the temperature was 140 °C and 160 °C, the average particle size of CdMnTe nanopowders is between 10 and 40 nm (Fig. 4a and b). The average size of CdMnTe nanopowders prepared at 180 °C and 200 °C is between 40 and 80 nm (as shown in Fig. 4c and d). However, in Fig. 4e, in absence of MPA, the CdMnTe nanopowders agglomerated into bigger one with diameters of 200–600 nm. The temperature and stabilizer content in the hydrothermal route will trigger the formation of crystal growth under fast kinetic reaction conditions, and these results are consistent with the simulation results from Rietveld's refinement method.In addition, the detailed crystalline structure features of the CdMnTe nanopowders prepared under the optimal condition were investigated by HR-TEM observations (Fig. 5). The spherical crystals exhibited a particle size between 30 and 60 nm (Fig. 5a). In addition, SAED provides a high crystallinity of the spherical CdMnTe nanopowders (Fig. 5b). SAED pattern of the squared area in Fig. 5b indicates that the preferential stacking of the CdMnTe nanopowders proceeds along the cubic structure basal plane with a Miller index of (111). The interplanar spacing calculated in the (111) plane is 0.38 nm (Fig. 5c). The value is very close to the interplanar spacing positions in the cubic sphalerite structure. In Fig. 5d, EDS characterization of CdMnTe nanopowders prepared under optimal conditions with MPA as stabilizer proves that no impurities appear. These results are supported by the particle size, as calculated in the Rietveld refinement results (Table 1).
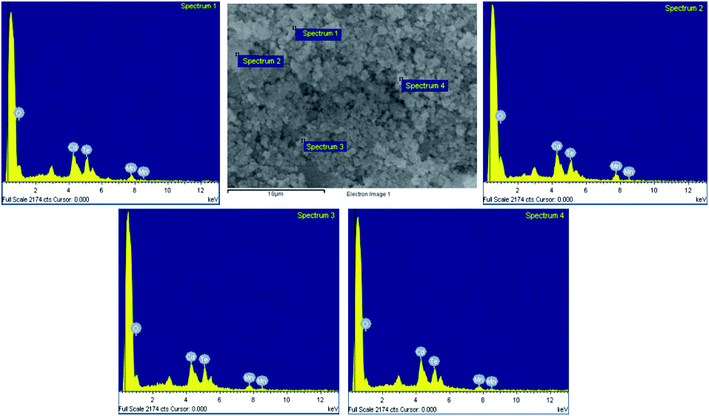
The EDS technique is used to qualitative study the composition of CdMnTe nanopowders. To study the effect of MPA, the elemental composition of the prepared samples without MPA is obtained, as shown in Fig. 6. The results indicate that O element appears at 1.158 keV. The lack of protection by MPA means that fewer nuclei can be formed and more O-related impurities will appear. The results show that MPA can ensure the pure phase of CdMnTe nanopowders.
Raman scattering spectroscopy is used to study the crystal quality and molecular structure of CdMnTe nanopowders. Fig. 7 shows the Raman spectra of CdMnTe nanopowders from 50 to 350 cm−1 at room temperature. The excitation wavelength was 532 nm. In Fig. 7a, there are two peaks at 159 cm−1 and 137 cm−1 for the CdMnTe nanopowders corresponding to the transverse optic (TO) and longitudinal optic (LO) modes of CdTe. Two peaks 92 and 72 cm−1 corresponding to A1 phonon mode of Te.27 And two peaks at 137 cm−1 and 119 cm−1 corresponding to the transverse optic (TO) and longitudinal optic (LO) modes of hexagonal NiAs-type antiferromagnetic MnTe.28 In Fig. 7b, the decrease of the peak intensity and their broadening confirm the Cd2+ substitution by Mn2+. The increase of Mn2+ concentration makes Raman band blue shift from 142 to 137 cm−1 and from 124 to 119 cm−1, respectively. These results are in good agreement with XPS and XRD.
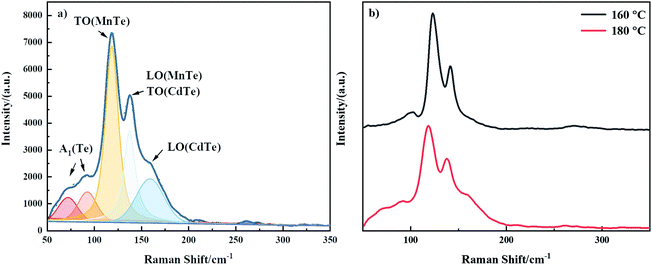 | ||
| Fig. 7 Raman spectra of the CdMnTe nanopowders: (a) prepared under optimal conditions; (b) prepared at 160 °C and 180 °C. | ||
XPS can be used to analyze the chemical composition of CdMnTe nanopowders.26 The characteristic peaks of Cd 3d5/2 and Mn 2p3/2 of the prepared CdMnTe nanopowders are shown in Fig. 8. With increasing temperature, the width of the Cd 3d5/2 peak became broader (from 2.36 eV to 2.46 eV) and it blue-shifted to lower energies (from 405.48 eV to 404.58 eV) (Fig. 8a). The Cd atoms are expected to bond with Mn atoms at lower energies. This is because the electronegativities (χ) of, Mn (χp = 1.55), Cd (χp = 1.69), and Te (χp = 2.10) are in increasing order. The Mn 2p2/3 peaks of the as-prepared CdMnTe nanopowders are shown in Fig. 8b. The peak shifts to the lower energy region (from 641.08 eV to 640.28 eV) with increasing temperature. The explanation may be similar to the above, atomic bonding is expected to occur at lower energies.29
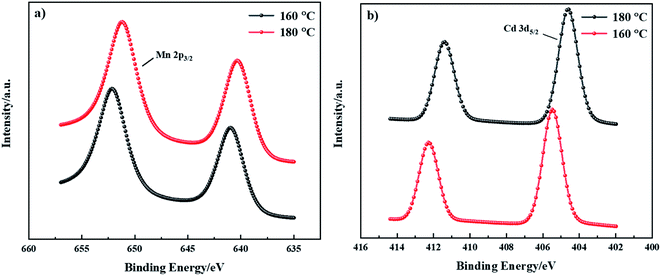 | ||
| Fig. 8 XPS spectra of the CdMnTe nanopowders prepared at 160 °C and 180 °C, (a) Cd 3d XPS spectrum and (b) Mn 2p. | ||
3.3 Formation mechanism of CdMnTe nanopowders
For the above discussion, it can be concluded that the amount of stabilizer MPA affects the morphology of the product. MPA can form two types of complexes with Cd2+ and Mn2+ (mono-sulfide and disulfide). The reaction of Cd2+ with MPA on the crystal surface can be described in formulas (1) and (2): Cd2+ reacts with MPA to form (Cd–RS)+ and Cd(RS)2 complexes.22 From the perspective of reaction equilibrium, when the molar ratio of stabilizer MPA and Cd![[thin space (1/6-em)]](https://www.rsc.org/images/entities/char_2009.gif) :
:![[thin space (1/6-em)]](https://www.rsc.org/images/entities/char_2009.gif) MPA in the solution is 1
MPA in the solution is 1![[thin space (1/6-em)]](https://www.rsc.org/images/entities/char_2009.gif) :
:![[thin space (1/6-em)]](https://www.rsc.org/images/entities/char_2009.gif) 1, the mono-sulfur complex plays a dominant role in the reaction. This is beneficial to the stability of the product. During the Ostwald maturation stage, the equilibrium growth/dissolution among the complexes is maintained, resulting in the as-prepared CdMnTe nanopowders with small size and thus excellent PL intensity.30
1, the mono-sulfur complex plays a dominant role in the reaction. This is beneficial to the stability of the product. During the Ostwald maturation stage, the equilibrium growth/dissolution among the complexes is maintained, resulting in the as-prepared CdMnTe nanopowders with small size and thus excellent PL intensity.30
Cd2+ + RS− =![[thin space (1/6-em)]](https://www.rsc.org/images/entities/char_2009.gif) (Cd–RS)+ (Cd–RS)+
| (1) |
(Cd–RS)−![[thin space (1/6-em)]](https://www.rsc.org/images/entities/char_2009.gif) + +![[thin space (1/6-em)]](https://www.rsc.org/images/entities/char_2009.gif) RS− = Cd(RS)2 RS− = Cd(RS)2
| (2) |
With the increase of NaBH4 content, BH4− is released, reducing TeO32−, promoting a complex reaction to form CdTe nuclei. In addition, Cd2+ will be replaced by Mn2+ to form nuclei of CdMnTe.
BH−4![[thin space (1/6-em)]](https://www.rsc.org/images/entities/char_2009.gif) + +![[thin space (1/6-em)]](https://www.rsc.org/images/entities/char_2009.gif) 4H2O = 4H2↑ 4H2O = 4H2↑![[thin space (1/6-em)]](https://www.rsc.org/images/entities/char_2009.gif) + +![[thin space (1/6-em)]](https://www.rsc.org/images/entities/char_2009.gif) B(OH)−4 B(OH)−4
| (3) |
3H2![[thin space (1/6-em)]](https://www.rsc.org/images/entities/char_2009.gif) + +![[thin space (1/6-em)]](https://www.rsc.org/images/entities/char_2009.gif) TeO32− = TeO32− =![[thin space (1/6-em)]](https://www.rsc.org/images/entities/char_2009.gif) Te2− + 3H2O Te2− + 3H2O
| (4) |
(Cd–RS)+![[thin space (1/6-em)]](https://www.rsc.org/images/entities/char_2009.gif) + +![[thin space (1/6-em)]](https://www.rsc.org/images/entities/char_2009.gif) Te2− = CdTe + RS− Te2− = CdTe + RS−
| (5) |
If the molar ratio of MPA dosage is gradually increased, the mono-sulfur complexes will further react with the RS− provided by the decomposed MPA to form more stable disulfide complexes. The free Cd2+ ions and the large amount of Te ions react with the disulfide complexes in the initial stage. Therefore, the prepared CdMnTe nanopowder contains more Te impurities in the crystal. Consistent with the observations of the XRD spectra, a higher Cd![[thin space (1/6-em)]](https://www.rsc.org/images/entities/char_2009.gif) :
:![[thin space (1/6-em)]](https://www.rsc.org/images/entities/char_2009.gif) MPA ratio produces a smaller amount of free Cd2+ ions, which results in a higher Te content in the prepared nanopowders.
MPA ratio produces a smaller amount of free Cd2+ ions, which results in a higher Te content in the prepared nanopowders.
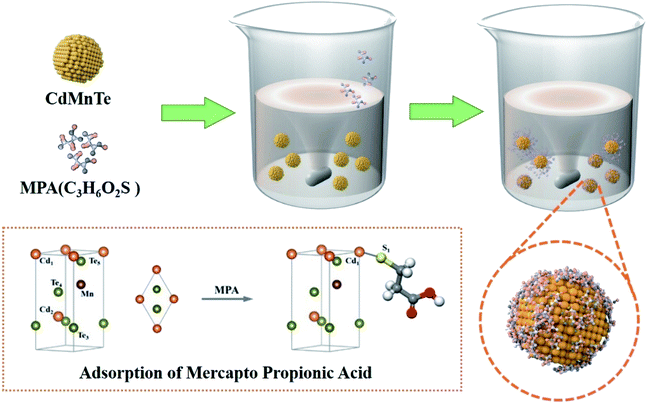
It is confirmed that crystal growth can be altered from the influence of experimental conditions. Once MPA is introduced into this system, size control and shape evolution are easily achieved by changing the amount of MPA. In this process, it is important that MPA provides hydrogen bonds in the particles and generates cross-linking reactions. Three possible effects of MPA on the growth of CdMnTe nanostructures are obtained: (1) MPA has a great adsorption effect on the surface of the particles due to inhibiting the growth of crystals. (2) The mutual cross-linking of hydrogen bonds can be suppressed. (3) The self-assembly process is facilitated by reducing the energy of the crystal and surface. The preparation of samples during the self-assembly process is shown in Fig. 9.
3.4 Optical properties analysis of CdMnTe nanopowders
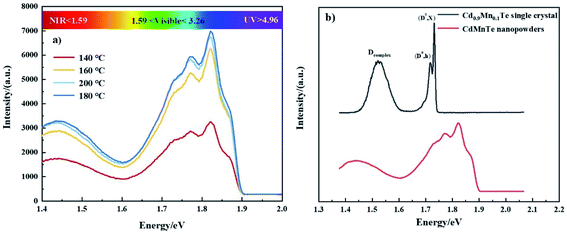
Fig. 10 shows the PL spectra of CdMnTe nanopowders and Cd0.9Mn0.1Te single crystal at 10 K. In Fig. 10a, there are two main luminescence peaks in the infrared region 1.717–1.826 eV for CdMnTe nanopowders prepared by different temperatures. The edge emission peak (D0, X) at 1.83 eV is mainly attributed to the recombination of electrons in the conduction band and holes in the valence band. The (D0, h) peak at 1.78 eV corresponds to the recombination of acceptor and hole27. In Fig. 10b, it can be seen that both the neutral donor-bound excitons (D0, X) of CdMnTe nanopowder peak and the neutral donor to valence band peak blue shift about 0.109 eV (from 1.717 eV to 1.826 eV) compared with CdMnTe single crystal31–33. This phenomenon usually occurs when the size of CdMnTe nanopowders decreases and the energy gap widens. To explain the observed activity, we can consider quantum effects: the energy gap width between the Highest Occupied Molecular Orbital (HOMO) and the Lowest Unoccupied Molecular Orbital (LUMO) increases with decreasing crystal size25. Therefore, in this study, the energy levels close to the Fermi level are formed by the quasi-continuous spectrum to form discrete energy levels resulting. The total intensity of emission peaks increases with increasing Mn2+ doping concentration. This behavior can be attributed to the improvement of crystal quality and the reduction of intrinsic defects. The band gap of the CdMnTe nanopowders also increases with the increase of Mn2+ doping content. This phenomenon will increase the PL excitation photon energy, resulting in a blue-shift phenomenon compared to the low-doped Cd0.9Mn0.1Te single crystal34. Alternatively, if MPA is used to modify the surface of CdMnTe nanopowders, it may help to reduce the number of charges on the surface of CdMnTe nanopowders, thereby reducing the directional polarizability of ionic bonds. This behavior can explain the interfacial effect leading to the reduction of the Stokes shift.Fig. 11 shows the UV-vis absorption spectra of CdMnTe nanopowders at different temperatures. The CdMnTe nanopowder has an absorption peak at 350 nm (3.54 eV) in the ultraviolet region. The bandgap energy of CdMnTe single crystal is tunable at 1.5–2.1 eV.35,36 It is found that the decrease of powder particle size results in a blue shift of the absorption peak. This is because the quantum confinement effect exists in nano-sized CdMnTe powders, but not in CdMnTe crystal with continuous bandgap. Kayanuma et al.37 proposed the Effective Mass Approximation Model (EMAM) and well explained this phenomenon. The ground state energy of the in situ infinite deep potential well of spherical crystal excitons is provided in eqn (6):
 | (6) |
![[thin space (1/6-em)]](https://www.rsc.org/images/entities/char_2009.gif) is the band gap of material,
is the band gap of material,  the Rydberg effective energy, μ the reduced mass, ε the permittivity of material, and R the radius of nanopowders. The size-dependent shift in the exciton energy of nanometer cluster can be derived as eqn (7):
 | (7) |
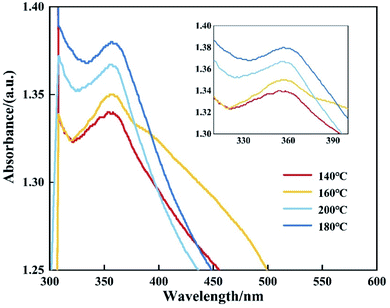 | ||
| Fig. 11 UV-visible absorption spectra of CdMnT nanopowders prepared at different reaction temperature. | ||
In the above equation, the quantum confinement effect dominates as the radius decreases. This phenomenon causes a change in the direction of the high energy (blue shift). The optical properties of CdMnTe nanopowders are being further studied.
4. Conclusions
CdMnTe crystal is a promising semiconductor radiation detector material, which can be synthesized by CdMnTe nanopowders. In this paper, CdMnTe nanopowders were prepared by a hydrothermal route using C3H6O2S (MPA) as the stabilizer and modifier. The nanopowders were analyzed by XRD, SEM, TEM, EDS, Raman, XPS, PL, UV-vis to reveal the effects of different experimental conditions including Cd-to-MPA ratio, pH value and reaction temperature on the properties of CdMnTe nanopowders. The results indicated that the as-prepared CdMnTe nanopowders were pure phase and had zinc blende structure. The morphology of the nanopowders was spherical with particle size of 20–100 nm. MPA could protect the powders from oxidation. The PL emission peak is tunable from 1.717 to 1.826 eV. Compared with CdMnTe single crystal, the blue shift of about 0.109 eV and the reduction of the intensity indicated a wider of band gap. The blue-shift of UV-vis absorption peak was theoretically analyzed, and the QCE of CdMnTe nanopowders was proved. The optimal condition for the preparation of CdMnTe nanopowders is 180 °C for 24 h with the molar ratio 1![[thin space (1/6-em)]](https://www.rsc.org/images/entities/char_2009.gif) :
:![[thin space (1/6-em)]](https://www.rsc.org/images/entities/char_2009.gif) 1 of Cd
1 of Cd![[thin space (1/6-em)]](https://www.rsc.org/images/entities/char_2009.gif) :
:![[thin space (1/6-em)]](https://www.rsc.org/images/entities/char_2009.gif) MPA at pH 13. The key molar ratio of Cd
MPA at pH 13. The key molar ratio of Cd![[thin space (1/6-em)]](https://www.rsc.org/images/entities/char_2009.gif) :
:![[thin space (1/6-em)]](https://www.rsc.org/images/entities/char_2009.gif) MPA = 1
MPA = 1![[thin space (1/6-em)]](https://www.rsc.org/images/entities/char_2009.gif) :
:![[thin space (1/6-em)]](https://www.rsc.org/images/entities/char_2009.gif) 1 explained the possible crystal growth mechanism and process. Thus, the as-prepared CdMnTe nanopowders with pure phase and high quality had potential application in the synthesis of CdMnTe single crystals used for radiation detectors.
1 explained the possible crystal growth mechanism and process. Thus, the as-prepared CdMnTe nanopowders with pure phase and high quality had potential application in the synthesis of CdMnTe single crystals used for radiation detectors.
Conflicts of interest
The authors declare that they have no known competing financial interests or personal relationships that could have appeared to influence the work reported in this paper.Acknowledgements
This work was supported by the Fundamental Research Funds for the Central Universities (No. 300102310204, 300102311405 and 300102310203), the National Natural Science Foundations of China (Grant No. 51602026), and National College Students Innovation and Entrepreneurship Training Program of Chang’an University (No. 202110710091).References
- D. L. Peterson, A. Petrou, M. Dutta, A. K. Ramdas and S. Rodriguez, Solid State Commun., 1982, 43, 667–669 CrossRef CAS.
- A. E. Turner, R. L. Gunshor and S. Datta, Appl. Opt., 1983, 22, 3152–3154 CrossRef CAS PubMed.
- H. Guerrero, J. L. Escudero and E. Bernabeu, Sens. Actuators, A, 1993, 39, 25–28 CrossRef CAS.
- A. Burger, K. Chattopadhyay, H. Chen, J. O. Ndap and R. D. Rosemeier, J. Cryst. Growth, 1999, 198–199, 872–876 CrossRef.
- A. Mycielski, A. Burger, M. Sowinska, M. Groza, A. Szadkowski, P. Wojnar, B. Witkowska, W. Kaliszek and P. Siffert, Phys. Status Solidi C, 2005, 5, 1578–1585 CrossRef.
- A. Hossain, Y. Cui, A. E. Bolotnikov, G. S. Camarda and R. B. James, J. Electron. Mater., 2009, 38, 1593–1599 CrossRef CAS.
- K. Kim, G. Jeng and P. Kim, J. Appl. Phys., 2013, 6, 063706 CrossRef.
- H. M. Hobgood, B. W. Swanson and R. N. Thomas, J. Cryst. Growth, 1987, 3, 510–520 CrossRef.
- K. H. Kim, A. E. Bolotnikov, G. S. Camarda, R. Tappero, A. Hossain, Y. Cui, J. Franc, L. Marchini, A. Zappettini and P. Fochuk, IEEE Trans. Nucl. Sci., 2012, 4, 1510–1515 Search PubMed.
- J. Zhang, W. Jie, T. Wang, D. Zeng, S. Ma, H. Hua and B. Yang, Mater. Res. Bull., 2008, 5, 1239–1245 CrossRef.
- M. Azoulay, J. Cryst. Growth, 1993, 7, 588–592 CrossRef.
- K. H. Kim, R. Gul, V. Carcelén, A. E. Bolotinkov, G. S. Carmarda, G. Yang, A. Hossain, Y. Cui, R. B. James, J. Hong and S. U. Kim, J. Cryst. Growth, 2010, 312, 781–784 CrossRef CAS.
- S. Bhattacharyya, D. Zitoun and A. Gedanken, Nanotechnology, 2011, 22, 075703 CrossRef PubMed.
- S. J. Lim, B. Chon, T. Joo and S. K. Shin, J. Phys. Chem. C, 2008, 112, 1744–1747 CrossRef CAS.
- H. Pan, H. Chu, S. Zhao, Y. Li and D. Li, Appl. Phys. Express, 2019, 12, 022001 CrossRef.
- T. Torchynska and Y. Vorobiev, Semiconductor II-VI Quantum Dots with Interface States and Their Biomedical Applications, InTech, 2011 Search PubMed.
- J. Balakrishnan, L. K. Preethi, D. Sreeshma, A. Jagtap, K. K. Madapu, S. Dhara and K. S. R. K. Rao, J. Phys. D: Appl. Phys., 2021, 54, 145103 CrossRef CAS.
- G. L. Tan, M. Wang, W. Kai, Z. Lin and X. F. Yu, Nanostruct. Mater., 2011, 13, 5799–5807 CAS.
- J. Li, T. Yang, W. H. Chan, M. M. F. Choi and D. Zhao, J. Phys. Chem. C, 2013, 117, 19175–19181 CrossRef CAS.
- D. Zhao, Z. He, W. H. Chan and M. M. F. Choi, J. Phys. Chem. C, 2009, 113, 1293–1300 CrossRef CAS.
- F. Shi, L. Yan, Z. Lin, D. Ma and X. Su, Sens. Actuators, B, 2015, 220, 433–440 CrossRef CAS.
- F. Gao, J. Li, F. Wang, T. Yang and D. Zhao, J. Lumin., 2015, 159, 32–37 CrossRef CAS.
- Q. Zhang, Y. Q. Chen, H. U. Feng, M. X. Zhang and N. H. University, J. Nanchang Hangkong Univ., Nat. Sci., 2014, 1, 60–63 Search PubMed.
- M. Haedrich, N. Lorenz, H. Metzner, U. Reisloehner, S. Mack, M. Gossla and W. Witthuhn, Thin Solid Films, 2007, 515, 5804–5807 CrossRef CAS.
- A. L. Rogach, T. Franzl, T. A. Klar, J. Feldmann, N. Gaponik, V. Lesnyak, A. Shavel, A. Eychmuller, Y. P. Rakovich and J. F. Donegan, J. Phys. Chem. C, 2007, 111, 14628–14637 CrossRef CAS.
- C. Y. Lee, P. Gong, G. M. Harbers, D. W. Grainger, D. G. Castner and L. J. Gamble, Anal. Chem., 2006, 78, 3316–3325 CrossRef CAS PubMed.
- P. Yu, T. Shao, Z. Ma, P. Gao, B. Jing, W. Liu, C. Liu, Y. Chen, Y. Liu, Z. Fang and L. Luan, IEEE Trans. Nucl. Sci., 2021, 68, 458–462 CAS.
- J. Zhang, L. Qin, Z. Pan, B. Wei, Y. Jing, Y. Zhang, X. Tang and J. Zhu, J. Raman Spectrosc., 2020, 51, 1383–1389 CrossRef CAS.
- K. Kayanuma, Phys. Rev. B, 1998, 38, 9797–9805 CrossRef PubMed.
- Y. Wang and N. Herron, J. Phys. Chem., 1991, 95, 525–532 CrossRef CAS.
- P. Yu, Y. Chen, J. Song, Y. Zhu, M. Zhang, B. Zhang, Y. Wang, W. Li, L. Luan and Y. Du, Mat. Sci. Eng. B, 2019, 246, 120–126 CrossRef CAS.
- P. Yu, L. Luan, Y. Du, J. Zheng and W. Jie, J. Cryst. Growth, 2015, 430, 103–107 CrossRef CAS.
- X. Wang, L. Wei, G. Tao and M. Huang, Chinese Chem. Lett., 2011, 22, 233–236 CrossRef CAS.
- N. Bouarissa, A. Gueddim, S. A. Siddiqui, M. Boucenna and A. Al-Hajry, Superlattices Microstruct., 2014, 72, 319–324 CrossRef CAS.
- K. H. Kim, A. E. Bolotnikov, G. S. Camarda, G. Yang, A. Hossain, Y. Cui, R. B. James, J. Hong and S. U. Kim, J. Appl. Phys., 2009, 106, 023706 CrossRef.
- J. J. Zhang, W. Q. Jie, L. J. Luan, T. Wang and D. M. Zeng, J. Electron. Mater., 2008, 37, 1154–1162 CrossRef.
- A. L. Rogach, T. Franzl, T. A. Klar, J. Feldmann, N. Gaponik, V. Lesnyak, A. Shavel, A. Eychmuller, Y. P. Rakovich and J. F. Donegan, J. Phys. Chem. C, 2007, 111, 14628–14637 CrossRef CAS.
| This journal is © The Royal Society of Chemistry 2022 |

