 Open Access Article
Structure-based design and synthesis of a novel long-chain 4′′-alkyl ether derivative of EGCG as potent EGFR inhibitor: in vitro and in silico studies†
Satyam Singh a,
Revathy Sahadevan
 b,
Rajarshi Roy
 a,
Mainak Biswasc,
Priya Ghosha,
Parimal Kar
 a,
Avinash Sonawanea and
Sushabhan Sadhukhan
 *bde
*bde
aDepartment of Biosciences and Biomedical Engineering, Indian Institute of Technology Indore, Madhya Pradesh 453 552, India
bDepartment of Chemistry, Indian Institute of Technology Palakkad, Kerala 678 623, India. E-mail: sushabhan@iitpkd.ac.in
cSchool of Biotechnology, KIIT Deemed to be University, Bhubaneswar, Orissa 751 024, India
dPhysical & Chemical Biology Laboratory, Indian Institute of Technology Palakkad, Kerala 678 623, India
eDepartment of Biological Sciences & Engineering, Indian Institute of Technology Palakkad, Kerala 678 623, India
First published on 16th June 2022
Abstract
Herein, we report the discovery of a novel long-chain ether derivative of (−)-epigallocatechin-3-gallate (EGCG), a major green tea polyphenol as a potent EGFR inhibitor. A series of 4′′-alkyl EGCG derivatives have been synthesized via regio-selectively alkylating the 4′′ hydroxyl group in the D-ring of EGCG and tested for their antiproliferative activities against high (A431), moderate (HeLa), and low (MCF-7) EGFR-expressing cancer cell lines. The most potent compound, 4′′-C14 EGCG showed the lowest IC50 values across all the tested cell lines. 4′′-C14 EGCG was also found to be significantly more stable than EGCG under physiological conditions (PBS at pH 7.4). Further western blot analysis and imaging data revealed that 4′′-C14 EGCG induced cell death in A431 cells with shrunken nuclei, nuclear fragmentation, membrane blebbing, and increased population of apoptotic cells where BAX upregulation and BCLXL downregulation were observed. In addition, autophosphorylation of EGFR and its downstream signalling proteins Akt and ERK were markedly inhibited by 4′′-C14 EGCG. MD simulation and the MM/PBSA analysis disclosed the binding mode of 4′′-C14 EGCG in the ATP-binding site of EGFR kinase domain. Taken together, our findings demonstrate that 4′′-C14 EGCG can act as a promising potent EGFR inhibitor with enhanced stability.
1. Introduction
The epidermal growth factor receptor (EGFR) protein is a member of the ErbB family of tyrosine kinases that regulates several biological processes such as cell proliferation, migration, apoptosis, survival, differentiation, etc.1 Frequent mutation or overexpression of EGFR has been shown to be involved in the progression of various types of cancer including non-small cell lung cancer, prostate, skin, and breast cancer.2 Thus, targeting EGFR via EGFR-specific tyrosine kinase inhibitors (TKIs) and monoclonal antibodies (mAbs) has become an attractive therapeutic approach for cancer treatment over the years. Several EGFR TKIs such as gefitinib,3 erlotinib,4 afatinib,5 rociletinib,6 and osimertinib7 have been approved by the United States Food and Drug Administration (FDA) for the treatment of patients harbouring activating mutations such as L858R, T790M or exon 19 deletions.8 EGFR developed resistance against the first-generation TKIs due to their reversible nature and T790M gatekeeper mutation. The second-generation TKIs were able to effectively inhibit T790M, L858R, and exon 19 deletion mutant forms of EGFR.9 However, EGFR also acquired resistance against the second-generation TKIs and the later exhibited off-target affinity towards the wild-type EGFR. Further emergence of C797S mutation resulted the resistance in osimertinib (a third generation TKIs) therapy as the mutation averts the covalent bond formation between the inhibitor and C797.9 Despite showing great efficacy against EGFR, significant side effects have also been observed for these TKIs.10 In addition, drug resistance to several FDA-approved TKIs are also reported.11,12 These warrant further research works on the development of effective natural or synthetic inhibitors that will specifically target the EGFR with minimal to zero side effects.Structure–activity relationship (SAR) approach have been proven to be instrumental in targeted drug discovery applications.13–15 Several potent EGFR inhibitors were discovered based on the comprehensive SAR studies on the medicinally important scaffolds.16–19 Various drug delivery systems have also been explored to reduce the doses and in that context, metal–phenolic networks have recently been identified as promising agent for the development of cancer nanomedicine due to its less toxicity and pH based drug release.20 On the other hand, targeted theranostic nano vehicle with immunostimulatory activities showed promising results to avert the drug resistance and remove cancer causing stem cells.21 In the quest of searching novel TKIs with less toxicity profile, compounds from natural origin might prove to be promising. Despite significant advances in the cancer treatments using potent small molecule synthetic drugs, the resistance to chemotherapy and off-target toxicity makes the use of synthetic molecules difficult and sometimes unsuitable. On the other hand, several natural products have recently been used in cancer treatment and have shown very promising efficacy as well as selectivity.22–24 Small molecules of natural origin display a wide range of structural diversity and promising biological activities with fewer side effects and less toxicity towards benign cells. Over 60% of the anticancer drugs presently in the clinical application with proven efficacy against several types of cancer are of natural origin such as plants, microorganisms, marine organisms, etc.25 In addition, semisynthetic molecules bearing minor chemical modifications on the parent natural products have also been shown to exhibit increased biological efficacy, pharmacokinetics with fewer side effects.25–27 Various novel strategies have been introduced to discover the molecular targets of natural products without chemically modifying them, such as drug affinity responsive target stability, stability of proteins from rates of oxidation, cellular thermal shift assay, thermal proteome profiling, and bioinformatics-based analysis of connectivity. These analytical methods play critical roles in identifying the mechanisms of action of drugs of natural origin.28
Plant-based polyphenols are one such class of natural products comprised of a large structurally diverse molecules with multiple bioactivities exhibiting a plethora of health beneficial effects. One of the promising biologically active polyphenols is (−)-epigallocatechin-3-gallate (EGCG), a major ingredient in green tea. The FDA and European Food Safety Authority (EFSA) have classified EGCG as “Generally Recognized as Safe” (GRAS) for its health beneficial effects.29 Green tea polyphenols mainly EGCG, exhibits various health-beneficial and disease-preventive activities including immunomodulatory,30 anti-oxidant,31 anti-cancer,32 and anti-bacterial.31 EGCG has shown anticancer activities such as inhibition of cancer cell proliferation,33 activation of apoptotic pathways,34 inhibition of angiogenesis, invasion, and metastasis in various types of cancer.35 Nevertheless, despite EGCG possessing great therapeutic and chemopreventive properties, its use in clinical trials has been rather limited because of poor bioavailability,36,37 chemical instability,38,39 low membrane permeability,40 and rapid metabolism.41 To overcome the aforementioned shortcomings, various structural modifications have been done with EGCG to achieve enhanced biological properties, increased stability, and improved bioavailability.42–47
Herein, we decided to regio-selectively introduce alkyl chains of varied length at 4′′ position of EGCG through an ether linkage (Scheme 1), due to its resistance to hydrolysis, and test them for their potential to inhibit EGFR. Seven novel 4′′-alkyl EGCG derivatives were synthesized and characterized by 1D and 2D-NMR. Cytotoxicity profiles were evaluated on high, moderate, and low endogenous EGFR-expressing cell lines A431, HeLa, and MCF-7, respectively. The compounds were also tested in a non-cancerous cell line (HEK-293) to ensure their tumor-targeting ability. Finally, the most promising compound, 4′′-C14 EGCG, was evaluated for its ability to induce apoptosis. The inhibitory activity of 4′′-C14 EGCG was examined against pEGFR and its downstream signalling proteins pAKT and pERK. Further, the stability of 4′′-C14 EGCG was evaluated and compared with EGCG under physiological conditions (PBS, pH 7.4). Molecular docking and molecular dynamic (MD) simulation studies were also carried out against the ATP binding pocket of the EGFR kinase domain to elucidate its binding mode with 4′′-C14 EGCG. The results obtained from the above analysis suggest that 4′′-C14 EGCG acts as a potent EGFR inhibitor (Fig. 1).
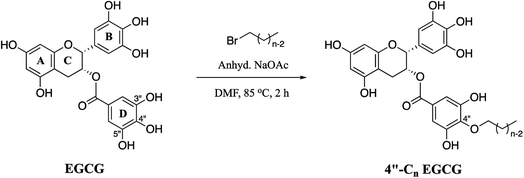 | ||
| Scheme 1 Synthetic route for 4′′-alkyl EGCG derivatives (4′′-Cn EGCG), where n = 6, 8, 10, 12, 14, 16, and 18. | ||
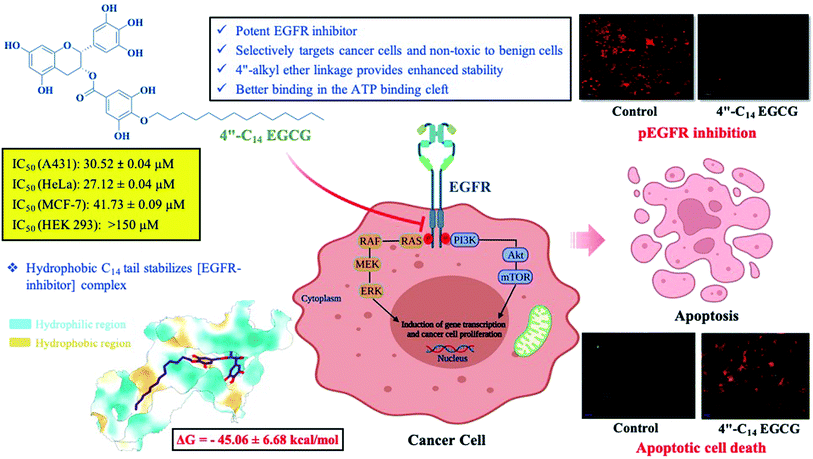 | ||
| Fig. 1 Schematic representation of 4′′-C14 EGCG mediated pEGFR inhibition and induction of apoptosis. | ||
2. Materials and methods
2.1. Chemistry
EGCG was purchased from Carbosynth Ltd, UK. 1-Bromoalkanes of different chain lengths (C6, C8, C10, C12, C14, C16, and C18) were bought from Sisco Research Laboratories (SRL) Pvt. Ltd, India. Silica gel (230–400 mesh) for column chromatography was purchased from Spectrochem Pvt. Ltd, India. All the solvents used were of reagent grade. LC-MS was recorded in ESI mode on LC-MS-IT-TOF (Shimadzu Pvt. Ltd) instrument. 1H, 13C, and HMBC NMR were recorded in Bruker AVANCE III 500 FT NMR spectrometer. FTIR spectrum was recorded using PerkinElmer Spectrum 100 spectrometer based on a universal attenuated total reflectance (ATR) sensor.2.2. Biological evaluation
![[thin space (1/6-em)]](https://www.rsc.org/images/entities/char_2009.gif) :
:![[thin space (1/6-em)]](https://www.rsc.org/images/entities/char_2009.gif) 1000) overnight at 4 °C and then washed using 1X PBST. Next, membranes were incubated with HRP-conjugated anti-rabbit/anti-mouse IgG secondary antibodies in 1X PBST (1
1000) overnight at 4 °C and then washed using 1X PBST. Next, membranes were incubated with HRP-conjugated anti-rabbit/anti-mouse IgG secondary antibodies in 1X PBST (1![[thin space (1/6-em)]](https://www.rsc.org/images/entities/char_2009.gif) :
:![[thin space (1/6-em)]](https://www.rsc.org/images/entities/char_2009.gif) 2000) for 2 h at room temperature. The membrane was washed using 1X PBST, developed using standard chemiluminescent substrate (BioRad) and images were captured on a Fusion Solo S chemidoc system (Vilber). β-Actin and Gapdh were used as loading controls. Protein band intensities were quantified by using Image J software (NIH) with respect to their corresponding loading controls.
2000) for 2 h at room temperature. The membrane was washed using 1X PBST, developed using standard chemiluminescent substrate (BioRad) and images were captured on a Fusion Solo S chemidoc system (Vilber). β-Actin and Gapdh were used as loading controls. Protein band intensities were quantified by using Image J software (NIH) with respect to their corresponding loading controls.![[thin space (1/6-em)]](https://www.rsc.org/images/entities/char_2009.gif) :
:![[thin space (1/6-em)]](https://www.rsc.org/images/entities/char_2009.gif) 200) overnight at 4 °C. Then, the cells were washed thrice with 1X cold PBS and incubated with Alexa Fluor conjugated secondary antibody (1
200) overnight at 4 °C. Then, the cells were washed thrice with 1X cold PBS and incubated with Alexa Fluor conjugated secondary antibody (1![[thin space (1/6-em)]](https://www.rsc.org/images/entities/char_2009.gif) :
:![[thin space (1/6-em)]](https://www.rsc.org/images/entities/char_2009.gif) 500) in the dark at room temperature for 2 h. Upon completion of the incubation, the coverslips were mounted on glass slides using Antifade Gold DAPI (Invitrogen) and sealed with nail paint. Slides were imaged by using a confocal laser scanning microscope (FV1200MPE, IX83 Model, Olympus).
500) in the dark at room temperature for 2 h. Upon completion of the incubation, the coverslips were mounted on glass slides using Antifade Gold DAPI (Invitrogen) and sealed with nail paint. Slides were imaged by using a confocal laser scanning microscope (FV1200MPE, IX83 Model, Olympus).2.3. Theoretical section
![[thin space (1/6-em)]](https://www.rsc.org/images/entities/char_2009.gif) 000 configurations was generated for both systems, which were further used for the trajectory analysis using the Cpptraj module of AmberTools.62,65
000 configurations was generated for both systems, which were further used for the trajectory analysis using the Cpptraj module of AmberTools.62,65The protein–ligand binding free energy was calculated using the Molecular Mechanics Poisson Boltzmann Surface Area (MMPBSA).66–68 The binding free energy was estimated using the following equation.69
| ΔGbind = ΔH − TΔS ≈ ΔEinternal + ΔGsolv − TΔS | (1) |
The total binding free energy (ΔGbind) comprises internal energy (ΔEinternal), desolvation free energy (ΔGsolv), and configurational entropy (TΔS). For the high computational cost, the entropic contribution was not considered in our study. The binding free energy was estimated using 10![[thin space (1/6-em)]](https://www.rsc.org/images/entities/char_2009.gif) 000 configurations obtained from the last 100 ns. Further, we decomposed the total binding free energy at the per-residue level using the molecular mechanics generalized Born surface area (MMGBSA) scheme.70
000 configurations obtained from the last 100 ns. Further, we decomposed the total binding free energy at the per-residue level using the molecular mechanics generalized Born surface area (MMGBSA) scheme.70
3. Results and discussion
3.1. Chemistry
EGCG has three aromatic rings (A, B, and D, Scheme 1) and they are connected by a pyran ring (C, Scheme 1). The antioxidant property of EGCG results from the transfer of hydrogen atoms or single-electron transfer reactions involving multiple phenolic hydroxyl groups. Among all the hydroxy groups present in EGCG, the 4′′-OH is uniquely posed and most acidic because of the presence of the ester group at its para position. We wanted to take this advantage of the 4′′-OH position to regio-selectively incorporate the alkyl chains. Of note, previous reports71,72 suggest that the loss of 4′′-OH group from EGCG does not significantly alter its biological activities as compared to parent analog, EGCG.A total of seven 4′′-alkyl EGCG derivatives with varied hydrophobicity were synthesised as described in Scheme 1. Purity (>98%) of the compounds were confirmed using high-performance liquid chromatography (HPLC), and their structures were characterized using ESI-LC-MS, FT-IR, 1H NMR, and 13C NMR. The positioning of the alkyl chain in 4′′-alkyl EGCG derivatives (taking an example of 4′′-C14 EGCG) was further confirmed by the Heteronuclear Multiple-Bond Correlation (HMBC) 2D-NMR experiment (Fig. 2). The 4′′-C assignment was made by comparing the 13C-NMR of EGCG and 4′′-alkyl derivatives of EGCG. As expected, significant differences in the chemical shift values were observed for C-1′′, C-3′′, C-4′′, and C-5′′, which implies that the alkylation happened in the D-ring of EGCG. Further, the assignment is in well agreement with the reported literature.73,74
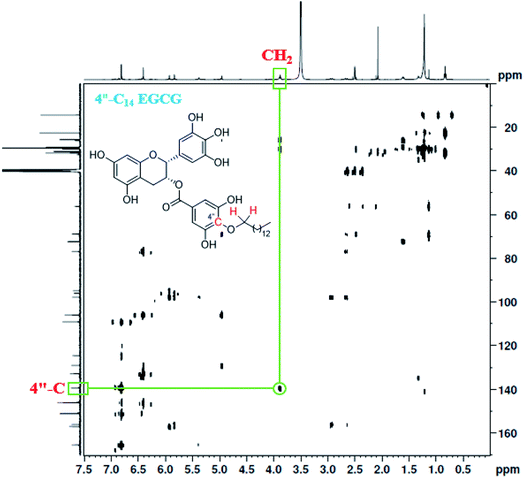 | ||
| Fig. 2 HMBC NMR of 4′′-C14 EGCG. The highlighted cross peak indicates that the carbon at 4′′ position is directly connected to –OCH2– (as shown in the inset). | ||
3.2. Biological evaluation
For A431 cells, 4′′-C6 EGCG and 4′′-C8 EGCG showed the highest IC50 value (105.09 ± 0.03 μM and 109 ± 0.02), while a successive addition of two methylene groups, i.e. –(CH2)2– in the alkyl chain such as 4′′-C10 EGCG, 4′′-C12 EGCG and 4′′-C14 EGCG decreased the IC50 values to 100.04 ± 0.02 μM, 50.53 ± 0.06 μM and 30.52 ± 0.04 μM, respectively. While adding more hydrophobicity to the alkyl chain as can be seen in 4′′-C16 EGCG and 4′′-C18 EGCG, the IC50 values further increased (84.94 ± 0.02 μM, 94.59 ± 0.01 μM respectively) as compared to 4′′-C14 EGCG. This suggested that among the seven derivatives, 4′′-C14 EGCG exhibited the most potent antiproliferative activity against A431 cells. Next, we studied the cytotoxicity of the 4′′-alkyl derivatives on HeLa cells. Here also, we found 4′′-C14 EGCG displaying the lowest IC50 value (27.12 ± 0.04 μM) among the compounds tested. In the case of MCF-7 cells, 4′′-C8 EGCG exhibited a high IC50 value of 156.5 ± 0.58 μM. More hydrophobic derivatives showed lower IC50 values, thus correlating well with the hydrophobicity of the alkyl chain as can be seen in 4′′-C10 EGCG (99.04 ± 0.42 μM), 4′′-C12 EGCG (96.92 ± 0.19 μM), and 4′′-C14 EGCG (41.73 ± 0.09 μM). Further, increase in hydrophobicity resulted in increased IC50 values (compared to 4′′-C14 EGCG) as can be seen for 4′′-C16 EGCG (51.25 ± 0.08 μM) and 4′′-C18 EGCG (133.97 ± 0.02 μM). Taken together, the results obtained from all the three tested human cancer cell lines (A431, HeLa, and MCF-7) suggested that the introduction of a fourteen-carbon long aliphatic hydrocarbon at 4′′ position of EGCG (4′′-C14 EGCG) exhibited the most potent antiproliferative activity (see Table 1) among the tested compounds. Therefore, we selected 4′′-C14 EGCG for further studies. In addition, to ensure that the 4′′-alkyl EGCG derivatives are not toxic to the non-cancerous cells, their antiproliferative activities were carried out against the HEK-293 cell line. After incubating the HEK-293 cells with 4′′-alkyl EGCG derivatives, none of them displayed any cytotoxicity till 150 μM (See Table 1). This indicates that the synthesized 4′′-alkyl EGCG derivatives are selective towards the cancer cells and not toxic to the non-cancerous cells. We also checked the anti-proliferative activity of gefitinib, an FDA-approved first generation EGFR inhibitor in all the cell lines tested. It showed an IC50 of 6.68 ± 0.06, 5.53 ± 0.09 and 9.16 ± 0.07 μM, against A431, HeLa and MCF-7 cell lines, respectively. Although, 4′′-C14 EGCG displayed lower IC50 value in HeLa cells as compared to A431, the endogenous expression of EGFR in A431 is much higher than that in HeLa and this prompted us to select A431 over HeLa for further studies. Of note, the over-expression of EGFR has been recognized as one of the major cancer-driving mechanisms for the development and progression of various types of cancer including pancreatic cancer, skin cancer, lung cancer, breast cancer, etc.18
| Compounds | IC50 (μM) | |||
|---|---|---|---|---|
| A431 | HeLa | MCF-7 | HEK-293 | |
| 4′′-C6 EGCG | 105.9 ± 0.03 | 114.6 ± 0.23 | 50.51 ± 0.23 | >150 |
| 4′′-C8 EGCG | 109 ± 0.02 | 88.17 ± 0.04 | 156.5 ± 0.58 | >150 |
| 4′′-C10 EGCG | 100.04 ± 0.02 | 112.3 ± 0.02 | 99.04 ± 0.42 | >150 |
| 4′′-C12 EGCG | 50.53 ± 0.06 | 81.32 ± 0.06 | 96.92 ± 0.19 | >150 |
| 4′′-C14 EGCG | 30.52 ± 0.04 | 27.12 ± 0.04 | 41.73 ± 0.09 | >150 |
| 4′′-C16 EGCG | 84.94 ± 0.02 | 104.6 ± 0.05 | 51.25 ± 0.08 | >150 |
| 4′′-C18 EGCG | 94.59 ± 0.01 | 60.59 ± 0.10 | 133.97 ± 0.02 | >150 |
| EGCG | 53.78 ± 0.04 | 61.63 ± 0.03 | 72.83 ± 0.04 | >150 |
| Gefitinib | 6.68 ± 0.06 | 5.53 ± 0.09 | 9.16 ± 0.07 | 24.48 ± 0.04 |
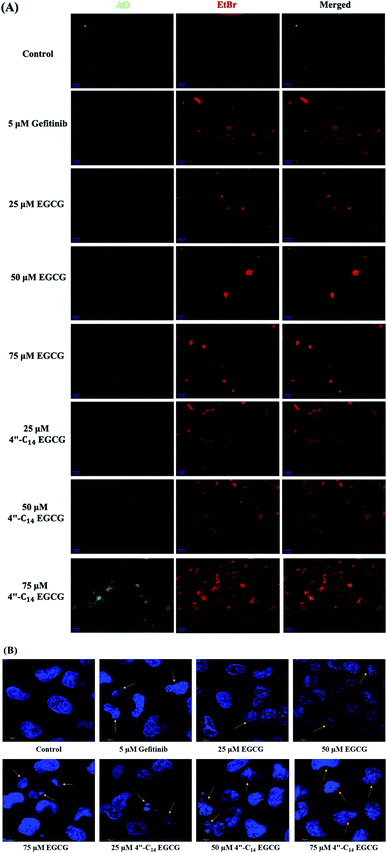
We also carried out 4′,6-diamidino-2-phenylindole (DAPI) staining to distinguish the normal and apoptotic cells by observing their nuclear morphological changes upon treatment of A431 cells with 4′′-C14 EGCG, EGCG, and gefitinib treatment for 24 h (Fig. 4B). Obtained results suggested that the nuclear structure was intact in the control cells, whereas 4′′-C14 EGCG, EGCG, and gefitinib treated cells exerted the enhanced nuclear damage in a concentration-dependent manner.
| Time | Degradation (%) in PBS at pH 7.4 | |
|---|---|---|
| EGCG | 4′′-C14 EGCG | |
| 5 h | 36.52 ± 3.06 | 20.51 ± 0.93 |
| 24 h | 50.72 ± 2.27 | 27.80 ± 1.43 |
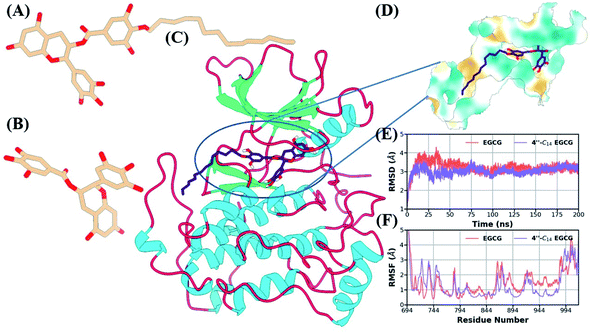
We also estimated the solvent-accessible surface area (SASA) and radius of gyration (RoG) to estimate the degree of solvent exposure and structural compactness of the kinase domain (Fig. S37A and B in the ESI†). Both the parameters also showed stability after the initial 50 ns. The RMSD value for EGCG was relatively lower compared to 4′′-C14 EGCG because of the missing hydrophobic tail region (Fig. S37C in the ESI†). Initially, the tail region of the EGCG derivative showed flexibility which got stabilized after 25 ns. We also estimated the RMSD distribution of the binding pocket (5 Å surrounding the molecule) for both complexes (Fig. S37D in the ESI†). The binding pocket for 4′′-C14 EGCG had increased flexibility, which got stabilized after 100 ns to reach equilibrium. On the other hand, in the case of EGFR/EGCG, the binding pocket remained stable throughout the simulation. The flexibility of the binding of EGFR/4′′-C14 EGCG increased mainly because of fourteen carbon alkyl chain attached to the 4′′ position in D ring of EGCG.
| Systems | ΔEvdW | ΔEelec | ΔGpol | ΔGnp | ΔEMMa | ΔGsolvb | ΔG |
|---|---|---|---|---|---|---|---|
| a ΔEvdW+ ΔEelec.b ΔGpol + ΔGnp.c The standard deviation (SD) is provided in the parenthesis. | |||||||
| EGCG | −31.94 (4.07) | −81.59 (11.08) | 82.36 (6.95) | −4.34 (0.11) | −113.53 (9.90) | 78.02 (6.92) | −35.52 (4.90) |
| 4′′-C14 EGCG | −57.11 (5.77) | −60.56 (12.38) | 79.40 (9.75) | −6.79 (0.38) | −117.67 (12.72) | 72.61 (9.64) | −45.06 (6.68) |
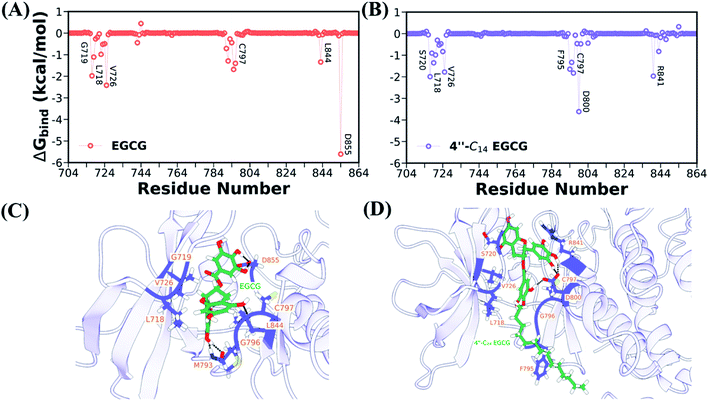
Next, we identified the critical residues for both systems, which contribute significantly to the binding (see Table S1 in the ESI†). The contribution of each residue to the total binding free energy was displayed in Fig. 11A and B. It is evident from Table S1† and Fig. 11A and B that D855 and D800 are the highest contributing residues for EGCG and 4′′-C14 EGCG, respectively. Several other residues, such as V726, L718, G796, contribute significantly to the binding for complexes. The location of all these key residues is shown in the ball and stick model for both cases (Fig. 11C and D).
Further, we also conducted the hydrogen bond analysis to complement the binding free energy, and the time evolution of protein-ligand hydrogen bonds is shown in Fig. S38B in the ESI.† The average number of hydrogen bonds is higher in EGCG, which is also evident from the electrostatic contribution to the total binding. However, both the ligands show a steady number of hydrogen bonds throughout the simulation length, indicating a stable and strong interaction. We also listed the important hydrogen bonds along with their occupancy present in both the systems (Table S2 in the ESI†). In case of EGCG, we found five critical hydrogen bonds (more than 35% occupancy) involving M793 and different oxygen atoms of D855, whereas only two hydrogen bonds were observed in case of 4′′-C14 EGCG. Regardless of those steady hydrogen bonds, a greater number of hydrogen bonds with lesser occupancy was observed in the case of 4′′-C14 EGCG (see Table S2 in the ESI†), which helps in stable binding and conferring stability of its tail region. We further support our finding with the help of Ligplot analysis which shows possible hydrophobic contacts and hydrogen bonds (Fig. S40 in the ESI†).
4. Conclusion
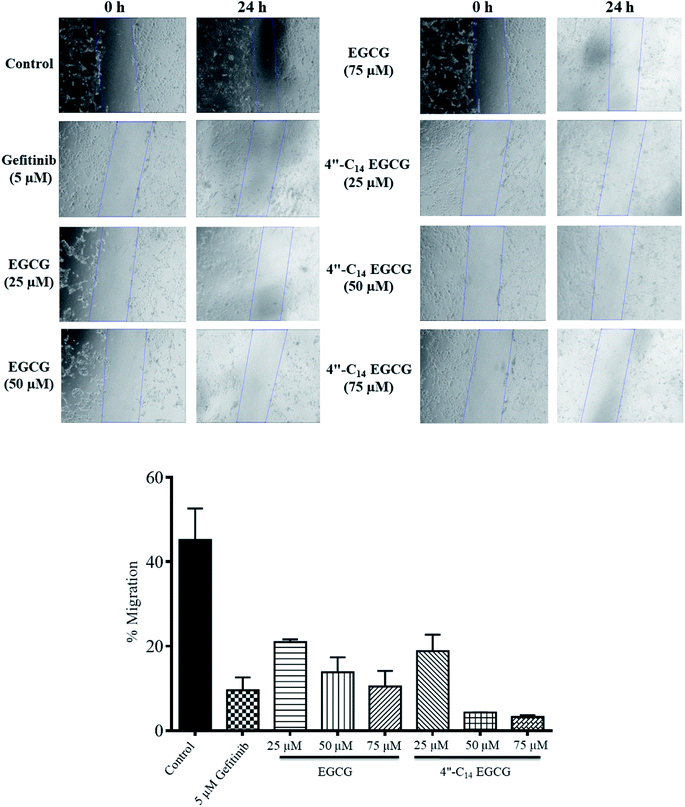
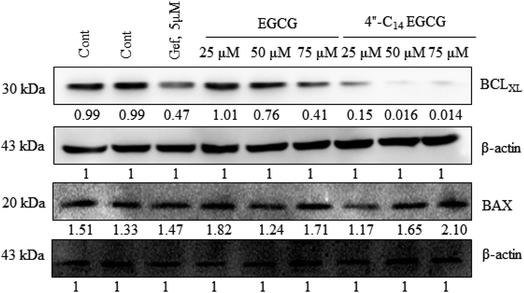
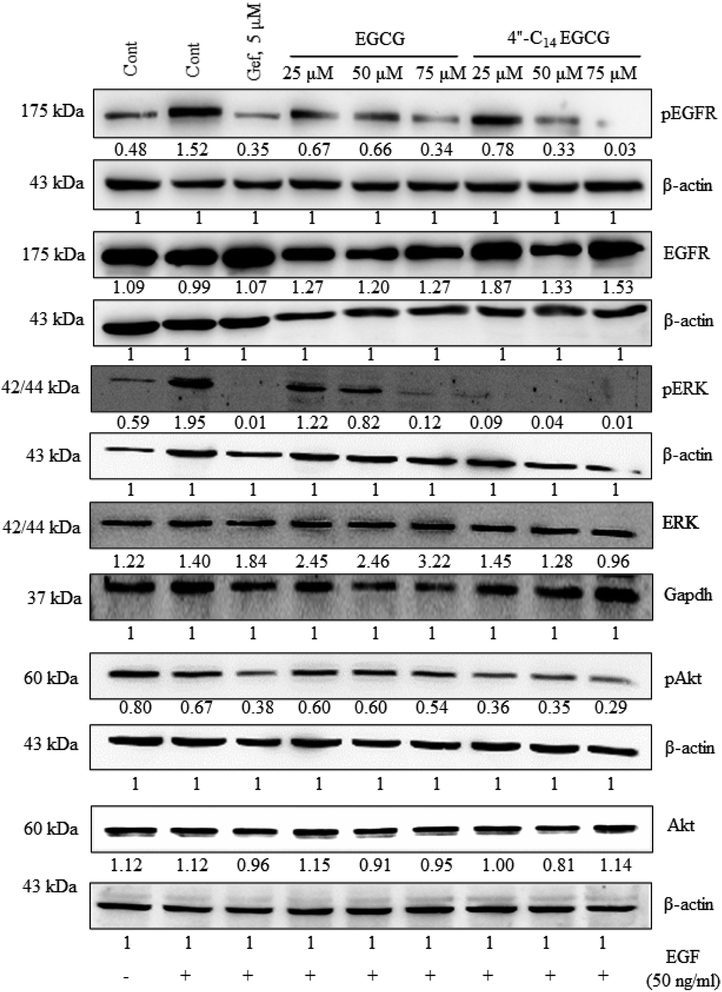
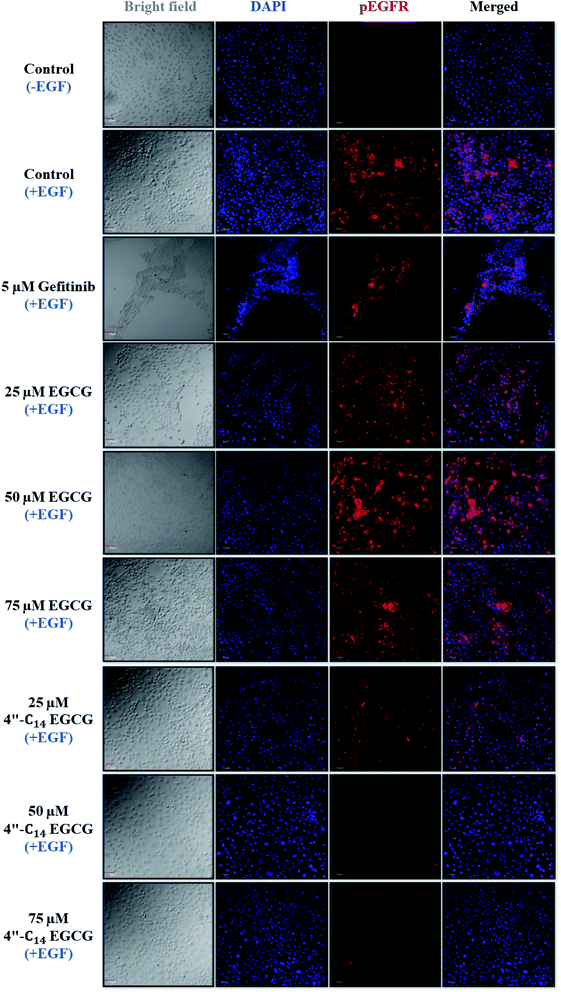
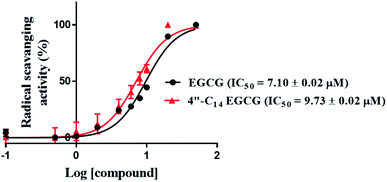
In this work, we designed and synthesized a series of 4′′-alkyl derivatives of EGCG and among them 4′′-C14 EGCG displayed the most promising inhibitory activity against EGFR tyrosine kinase. 4′′-C14 EGCG exhibited enhanced stability compared to EGCG in PBS buffer of pH 7.4. A comprehensive study on their cytotoxicity in selected cancer cell lines was performed by CCK8 assay, AO/EtBr staining, DAPI staining, western blotting, and immunocytochemistry analysis. Importantly, 4′′-alkyl EGCG derivatives were very selective in targeting the cancer cells and did not show any toxicity in the non-cancerous cell line. 4′′-C14 EGCG showed the lowest IC50 on A431, HeLa, and MCF-7 cells and it was even better than the parent molecule, EGCG. The event of apoptotic cell death was evident from the AO/EtBr and DAPI staining results. The wound-healing assay demonstrated that the migration of A431 cells were significantly reduced after the treatment of 4′′-C14 EGCG at 50 μM concentration. Western blot analysis revealed that A431 cells were undergoing apoptosis through downregulation of anti-apoptotic protein, BCLXL, and upregulation of pro-apoptotic protein, BAX. Further, our results showed that 4′′-C14 EGCG, unlike EGCG, was able to completely inhibit the phosphorylation of EGFR at 75 μM. The results from the immunocytochemistry experiments were also in agreement with the western blot analysis, further confirming the inhibition of EGFR autophosphorylation by 4′′-C14 EGCG. Our results also showed that 4′′-C14 EGCG was able to effectively inhibit the phosphorylation of the downstream signalling proteins of EGFR, namely ERK and Akt. Antioxidant activity of 4′′-C14 EGCG was not found to be significantly different from the parent molecule, EGCG. In addition, the binding mode of 4′′-C14 EGCG with EGFR kinase domain was studied and compared with EGCG by using molecular docking and MD simulation studies. It was evident from the MD simulation study that the addition of a fourteen-carbon long aliphatic hydrocarbon chain at 4′′ position (4′′-C14 EGCG) enhanced the structural framework of EGCG, resulting in an increased binding affinity with EGFR compared to the parent molecule, EGCG. Thus, the obtained results from in silico studies support our experimental findings. Taken together, we have identified a novel lipophilic derivative of EGCG, namely 4′′-C14 EGCG, as potent EGFR inhibitor and anticancer agent with improved stability and biological activity.Conflicts of interest
The authors declare that there is no conflict of interest.Acknowledgements
The authors gratefully acknowledge the financial support from the Indian Institute of Technology Indore and Indian Institute of Technology Palakkad for the provision of conducting research and the scholarship provided to the students by Govt. of India. This work was also supported by the Department of Science and Technology-Science & Engineering Research Board (DST-SERB), Govt. of India (ECR/2017/002082) and Council of Scientific & Industrial Research (CSIR), Govt. of India (02(0434)/21/EMR-II).References
- M. Wieduwilt and M. Moasser, Cell. Mol. Life Sci., 2008, 65, 1566–1584 CrossRef CAS PubMed
.
- Y. Yarden and G. Pines, Nat. Rev. Cancer, 2012, 12, 553–563 CrossRef CAS PubMed
.
- M. H. Cohen, G. A. Williams, R. Sridhara, G. Chen and R. Pazdur, Oncologist, 2003, 8, 303–306 CrossRef CAS PubMed
.
- J. R. Johnson, M. Cohen, R. Sridhara, Y.-F. Chen, G. M. Williams, J. Duan, J. Gobburu, B. Booth, K. Benson and J. Leighton, Clin. Cancer Res., 2005, 11, 6414–6421 CrossRef CAS PubMed
.
- R. T. Dungo and G. M. Keating, Drugs, 2013, 73, 1503–1515 CrossRef CAS PubMed
.
- J. C. Chuang, A. A. Salahudeen and H. A. Wakelee, Expert Opin. Pharmacother., 2016, 17, 989–993 CrossRef CAS PubMed
.
- A. L. Koch, P. J. Vellanki, N. Drezner, X. Li, P. S. Mishra-Kalyani, Y. L. Shen, H. Xia, Y. Li, J. Liu and J. F. Zirkelbach, Clin. Cancer Res., 2021, 27, 6638–6643 CrossRef CAS PubMed
.
- S. Wang, S. Cang and D. Liu, J. Hematol. Oncol., 2016, 9, 1–7 CrossRef PubMed
.
- K. S. Thress, C. P. Paweletz, E. Felip, B. C. Cho, D. Stetson, B. Dougherty, Z. Lai, A. Markovets, A. Vivancos and Y. Kuang, Nat. Med., 2015, 21, 560–562 CrossRef CAS PubMed
.
- W.-H. Hsu, J.-H. Yang, T. Mok and H. Loong, Ann. Oncol., 2018, 29, i3–i9 CrossRef PubMed
.
- L. Huang and L. Fu, Acta Pharm. Sin. B, 2015, 5, 390–401 CrossRef PubMed
.
- Q. Liu, S. Yu, W. Zhao, S. Qin, Q. Chu and K. Wu, Mol. Cancer, 2018, 17, 1–9 Search PubMed
.
- T. Wang, M.-B. Wu, J.-P. Lin and L.-R. Yang, Expert Opin. Drug Discovery, 2015, 10, 1283–1300 CrossRef CAS PubMed
.
- S. M. Meier-Menches, C. Gerner, W. Berger, C. G. Hartinger and B. K. Keppler, Chem. Soc. Rev., 2018, 47, 909–928 RSC
.
- S. K. Liew, S. Malagobadan, N. M. Arshad and N. H. Nagoor, Biomolecules, 2020, 10, 138 CrossRef CAS PubMed
.
- P. F. Lamie, A. M. El-Kalaawy, N. S. A. Latif, L. A. Rashed and J. N. Philoppes, Eur. J. Med. Chem., 2021, 214, 113222 CrossRef CAS PubMed
.
- S. Goyal, S. Jamal, A. Shanker and A. Grover, BMC Genomics, 2015, 16, 1–9 CrossRef PubMed
.
- P. Bhatia, V. Sharma, O. Alam, A. Manaithiya, P. Alam, M. T. Alam and M. Imran, Eur. J. Med. Chem., 2020, 204, 112640 CrossRef CAS PubMed
.
- N. Jiang, Y. Bu, Y. Wang, M. Nie, D. Zhang and X. Zhai, Molecules, 2016, 21, 1572 CrossRef PubMed
.
- Z. Zhang, L. Xie, Y. Ju and Y. Dai, Small, 2021, 17, 2100314 CrossRef CAS PubMed
.
- M. M. Joseph, A. N. Ramya, V. M. Vijayan, J. B. Nair, B. T. Bastian, R. K. Pillai, S. T. Therakathinal and K. K. Maiti, Small, 2020, 16, 2003309 CrossRef CAS PubMed
.
- S. F. Nabavi, A. G. Atanasov, H. Khan, D. Barreca, D. Trombetta, L. Testai, A. Sureda, S. Tejada, R. A. Vacca and V. Pittalà, Cancer Lett., 2018, 434, 101–113 CrossRef CAS PubMed
.
- M. Huang, J.-J. Lu and J. Ding, Nat. Prod. Bioprospect., 2021, 1–9 Search PubMed
.
- Â. Bisol, P. S. de Campos and M. L. Lamers, Phytother. Res., 2020, 34, 568–582 CrossRef PubMed
.
- M. Gordaliza, Clin. Transl. Oncol., 2007, 9, 767–776 CrossRef CAS PubMed
.
- M. Fridlender, Y. Kapulnik and H. Koltai, Front. Plant Sci., 2015, 6, 799 Search PubMed
.
- J. S. Arya, M. M. Joseph, D. R. Sherin, J. B. Nair, T. K. Manojkumar and K. K. Maiti, J. Med. Chem., 2019, 62, 8311–8329 CrossRef CAS PubMed
.
- J. Chang, Y. Kim and H. Kwon, Nat. Prod. Rep., 2016, 33, 719–730 RSC
.
- E. Cione, C. La Torre, R. Cannataro, M. C. Caroleo, P. Plastina and L. Gallelli, Molecules, 2020, 25, 63 CrossRef CAS PubMed
.
- S. Wang, Z. Li, Y. Ma, Y. Liu, C.-C. Lin, S. Li, J. Zhan and C.-T. Ho, Molecules, 2021, 26, 3755 CrossRef CAS PubMed
.
- M. Nikoo, J. M. Regenstein and H. Ahmadi Gavlighi, Compr. Rev. Food Sci. Food Saf., 2018, 17, 732–753 CrossRef CAS PubMed
.
- K.-j. Min and T. K. Kwon, Integr. Med. Res., 2014, 3, 16–24 CrossRef PubMed
.
- K.-W. Luo, W.-Y. Lung, X.-L. L. Chun-Xie and W.-R. Huang, Oncotarget, 2018, 9, 12261 CrossRef PubMed
.
- J. Gu, K. Qiao, P. Sun, P. Chen and Q. Li, Eur. Rev. Med. Pharmacol. Sci., 2018, 22, 4557–4563 Search PubMed
.
- S. Shankar, S. Ganapathy, S. R. Hingorani and R. K. Srivastava, Front. Biosci., 2008, 13, 440–452 CrossRef PubMed
.
- Z.-Y. Cai, X.-M. Li, J.-P. Liang, L.-P. Xiang, K.-R. Wang, Y.-L. Shi, R. Yang, M. Shi, J.-H. Ye and J.-L. Lu, Molecules, 2018, 23, 2346 CrossRef PubMed
.
- W. Dai, C. Ruan, Y. Zhang, J. Wang, J. Han, Z. Shao, Y. Sun and J. Liang, J. Funct. Foods, 2020, 65, 103732 CrossRef CAS
.
- Q. Y. Zhu, A. Zhang, D. Tsang, Y. Huang and Z.-Y. Chen, J. Agric. Food Chem., 1997, 45, 4624–4628 CrossRef CAS
.
- N. Li, L. S. Taylor, M. G. Ferruzzi and L. J. Mauer, Food Res. Int., 2013, 53, 909–921 CrossRef CAS
.
- A. Faralli, E. Shekarforoush, A. C. Mendes and I. S. Chronakis, Pharmaceutics, 2019, 11, 155 CrossRef CAS PubMed
.
- T. Miyazawa, Biofactors, 2000, 13, 55–59 CrossRef CAS PubMed
.
- X. Chen, B. Liu, R. Tong, S. Ding, J. Wu, Q. Lei and W. Fang, Langmuir, 2021, 37, 969–977 CrossRef CAS PubMed
.
- X. Zhang, J. Wang, J.-M. Hu, Y.-W. Huang, X.-Y. Wu, C.-T. Zi, X.-J. Wang and J. Sheng, Molecules, 2016, 21, 620 CrossRef PubMed
.
- J. L. Gonzalez-Alfonso, P. Peñalver, A. O. Ballesteros, J. C. Morales and F. J. Plou, Front. Nutr., 2019, 6, 30 CrossRef PubMed
.
- K. Osanai, K. R. Landis-Piwowar, Q. P. Dou and T. H. Chan, Bioorg. Med. Chem., 2007, 15, 5076–5082 CrossRef CAS PubMed
.
- Y. Oritani, Y. Setoguchi, R. Ito, H. Maruki-Uchida, T. Ichiyanagi and T. Ito, Biol. Pharm. Bull., 2013, 36, 1577–1582 CrossRef CAS PubMed
.
- C. Ping, T. Yao, S. Dong and Z. Xiao-ming, J. Zhejiang Univ., Sci., A, 2003, 4, 714–718 CrossRef PubMed
.
- S. Lindert, N. Alexander, N. Wötzel, M. Karakaş, P. L. Stewart and J. Meiler, Structure, 2012, 20, 464–478 CrossRef CAS PubMed
.
- R. A. Friesner, J. L. Banks, R. B. Murphy, T. A. Halgren, J. J. Klicic, D. T. Mainz, M. P. Repasky, E. H. Knoll, M. Shelley and J. K. Perry, J. Med. Chem., 2004, 47, 1739–1749 CrossRef CAS PubMed
.
- R. Friesner, R. JLB, T. Murphy, J. Halgren and D. Klicic, J. Med. Chem., 2004, 47, 1739–1750 CrossRef CAS PubMed
.
- R. A. Friesner, R. B. Murphy, M. P. Repasky, L. L. Frye, J. R. Greenwood, T. A. Halgren, P. C. Sanschagrin and D. T. Mainz, J. Med. Chem., 2006, 49, 6177–6196 CrossRef CAS PubMed
.
- E. Harder, W. Damm, J. Maple, C. Wu, M. Reboul, J. Y. Xiang, L. Wang, D. Lupyan, M. K. Dahlgren and J. L. Knight, J. Chem. Theory Comput., 2016, 12, 281–296 CrossRef CAS PubMed
.
- D. A. Case, I. Y. Ben-Shalom, S. R. Brozell, D. S. Cerutti, T. E. Cheatham III, V. W. D. Cruzeiro, T. A. Darden, R. E. Duke, D. Ghoreishi, M. K. Gilson, H. Gohlke, A. W. Goetz, D. Greene, R. Harris, N. Homeyer, Y. Huang, S. Izadi, A. Kovalenko, T. Kurtzman, T. S. Lee, S. LeGrand, P. Li, C. Lin, J. Liu, T. Luchko, R. Luo, D. J. Mermelstein, K. M. Merz, Y. Miao, G. Monard, C. Nguyen, H. Nguyen, I. Omelyan, A. Onufriev, F. Pan, R. Qi, D. R. Roe, A. Roitberg, C. Sagui, S. Schott-Verdugo, J. Shen, C. L. Simmerling, J. Smith, R. Salomon-Ferrer, J. Swails, R. C. Walker, J. Wang, H. Wei, R. M. Wolf, X. Wu, L. Xiao, D. M. York and P. A. Kollman, AMBER 2018, 2018, University of California, San Francisco Search PubMed
.
- J. Wang, R. M. Wolf, J. W. Caldwell, P. A. Kollman and D. A. Case, J. Comput. Chem., 2004, 25, 1157–1174 CrossRef CAS PubMed
.
- B. Wang and K. M. Merz, J. Chem. Theory Comput., 2006, 2, 209–215 CrossRef CAS PubMed
.
- J. A. Maier, C. Martinez, K. Kasavajhala, L. Wickstrom, K. E. Hauser and C. Simmerling, J. Chem. Theory Comput., 2015, 11, 3696–3713 CrossRef CAS PubMed
.
- D. J. Price and C. L. Brooks III, J. Chem. Phys., 2004, 121, 10096–10103 CrossRef CAS PubMed
.
- V. Kräutler, W. F. Van Gunsteren and P. H. Hünenberger, J. Comput. Chem., 2001, 22, 501–508 CrossRef
.
- R. W. Pastor, B. R. Brooks and A. Szabo, Mol. Phys., 1988, 65, 1409–1419 CrossRef
.
- H. J. Berendsen, J. v. Postma, W. F. van Gunsteren, A. DiNola and J. R. Haak, J. Chem. Phys., 1984, 81, 3684–3690 CrossRef CAS
.
- P. mesh Ewald, J. Chem. Phys., 1993, 98, 10089–10092 CrossRef
.
- R. Roy, B. Ghosh and P. Kar, ACS Omega, 2020, 5, 3932–3942 CrossRef CAS PubMed
.
- R. Roy, A. Mishra, S. Poddar, D. Nayak and P. Kar, J. Biomol. Struct. Dyn., 2020, 40, 2302–2315 CrossRef PubMed
.
- S. Singh, M. F. Sk, A. Sonawane, P. Kar and S. Sadhukhan, J. Biomol. Struct. Dyn., 2020, 39, 6249–6264 CrossRef PubMed
.
- D. R. Roe and T. E. Cheatham III, J. Chem. Theory Comput., 2013, 9, 3084–3095 CrossRef CAS PubMed
.
- R. Roy, M. F. Sk, N. A. Jonniya, S. Poddar and P. Kar, J. Biomol. Struct. Dyn., 2021, 1–13 Search PubMed
.
- L. Thurakkal, S. Singh, R. Roy, P. Kar, S. Sadhukhan and M. Porel, Chem. Phys. Lett., 2021, 763, 138193 CrossRef CAS PubMed
.
- M. F. Sk, R. Roy and P. Kar, J. Biomol. Struct. Dyn., 2020, 39, 3649–3661 CrossRef PubMed
.
- P. A. Kollman, I. Massova, C. Reyes, B. Kuhn, S. Huo, L. Chong, M. Lee, T. Lee, Y. Duan and W. Wang, Acc. Chem. Res., 2000, 33, 889–897 CrossRef CAS PubMed
.
- H. Gohlke, C. Kiel and D. A. Case, J. Mol. Biol., 2003, 330, 891–913 CrossRef CAS PubMed
.
- M. Maeda-Yamamoto, N. Inagaki, J. Kitaura, T. Chikumoto, H. Kawahara, Y. Kawakami, M. Sano, T. Miyase, H. Tachibana and H. Nagai, J. Immunol., 2004, 172, 4486–4492 CrossRef CAS PubMed
.
- M. Suzuki, K. Yoshino, M. Maeda-Yamamoto, T. Miyase and M. Sano, J. Agric. Food Chem., 2000, 48, 5649–5653 CrossRef CAS PubMed
.
- C. Minnelli, R. Galeazzi, E. Laudadio, A. Amici, D. Rusciano, T. Armeni, M. Cantarini, P. Stipa and G. Mobbili, Antioxidants, 2020, 9, 208 CrossRef CAS PubMed
.
- K. Kida, M. Suzuki, N. Matsumoto, F. Nanjo and Y. Hara, J. Agric. Food Chem., 2000, 48, 4151–4155 CrossRef CAS PubMed
.
- Z. Weihua, R. Tsan, W.-C. Huang, Q. Wu, C.-H. Chiu, I. J. Fidler and M.-C. Hung, Cancer Cell, 2008, 13, 385–393 CrossRef PubMed
.
- B. S. Cummings, L. P. Wills and R. G. Schnellmann, Curr. Protoc. Pharmacol., 2012, 56, 12.18.11–12.18.24 Search PubMed
.
- P. Friedl, E. Sahai, S. Weiss and K. M. Yamada, Nat. Rev. Mol. Cell Biol., 2012, 13, 743–747 CrossRef CAS PubMed
.
- P. Wee and Z. Wang, Cancers, 2017, 9, 52 CrossRef PubMed
.
- D. Singh, B. K. Attri, R. K. Gill and J. Bariwal, Mini-Rev. Med. Chem., 2016, 16, 1134–1166 CrossRef CAS PubMed
.
- G. da Cunha Santos, F. A. Shepherd and M. S. Tsao, Annu. Rev. Pathol.: Mech. Dis., 2011, 6, 49–69 CrossRef PubMed
.
- R. Ali and M. K. Wendt, Signal Transduction Targeted Ther., 2017, 2, 1–7 Search PubMed
.
- T. E Taylor, F. B Furnari and W. K Cavenee, Curr. Cancer Drug Targets, 2012, 12, 197–209 CrossRef PubMed
.
- S. Sang, M.-J. Lee, Z. Hou, C.-T. Ho and C. S. Yang, J. Agric. Food Chem., 2005, 53, 9478–9484 CrossRef CAS PubMed
.
- M. Akagawa, T. Shigemitsu and K. Suyama, Biosci., Biotechnol., Biochem., 2003, 67, 2632–2640 CrossRef CAS PubMed
.
- J. D. Lambert and R. J. Elias, Arch. Biochem. Biophys., 2010, 501, 65–72 CrossRef CAS PubMed
.
- R. Sahadevan, S. Singh, A. Binoy and S. Sadhukhan, Crit. Rev. Food Sci. Nutr., 2022, 1–30, DOI:10.1080/10408398.2022.2068500
.
- M. Wang, H. Zhang, L. Yi, P. Högger, R. Arroo, V. K. Bajpai, M.-A. Prieto, J. Simal-Gandara, S. Wang and H. Cao, Food Chem., 2022, 366, 130521 CrossRef CAS PubMed
.
- K. S. Gajiwala, J. Feng, R. Ferre, K. Ryan, O. Brodsky, S. Weinrich, J. C. Kath and A. Stewart, Structure, 2013, 21, 209–219 CrossRef CAS PubMed
.
- T. D. Goddard, C. C. Huang, E. C. Meng, E. F. Pettersen, G. S. Couch, J. H. Morris and T. E. Ferrin, Protein Sci., 2018, 27, 14–25 CrossRef CAS PubMed
.
Footnote |
| † Electronic supplementary information (ESI) available. See https://doi.org/10.1039/d2ra01919a |
| This journal is © The Royal Society of Chemistry 2022 |


