 Open Access Article
Glutathione-depleting polymer delivering chlorin e6 for enhancing photodynamic therapy†
Shi-yin Wang‡
a,
Guo Chen‡a,
Ji-feng Chena,
Jin Wangb,
Shao-hui Deng*a and
Du Cheng *a
*a
aPCFM Lab of Ministry of Education, School of Materials Science and Engineering, Sun Yat-sen University, Guangzhou 510275, P. R. China. E-mail: dengshh9@mail.sysu.edu.cn; chengdu@mail.sysu.edu.cn
bDepartment of Radiology, The Third Affiliated Hospital of Sun Yat-sen University, Guangzhou 510630, P. R. China
First published on 3rd August 2022
Abstract
The therapeutic effect of photodynamic therapy (PDT) is highly dependent on the intracellular production of reactive oxygen species (ROS). However, the ROS generated by photosensitizers can be consumed by the highly concentrated glutathione (GSH) in tumor cells, severely impairing the therapeutic effect of PDT. Herein, we synthesized a GSH-scavenging copolymer to deliver photosensitizer chlorin e6 (Ce6). The pyridyl disulfide groups, which have faster reactivity with the thiol groups of GSH than other disulfide groups, were grafted onto a hydrophobic block to encapsulate the Ce6. Under NIR irradiation, the Ce6 generated ROS to kill tumor cells, and the pyridyl disulfide groups depleted the GSH to prevent ROS consumption, which synergistically enhanced the therapeutic effect of PDT. In vitro and in vivo experiments confirmed the combinatory antitumor effect of Ce6-induced ROS generation and the pyridyl disulfide group-induced GSH depletion. Therefore, the pyridyl disulfide group-grafted amphiphilic copolymer provides a more efficient strategy for enhancing PDT and has promising potential for clinical application.
Introduction
Photodynamic therapy (PDT) has drawn tremendous attention in cancer therapy due to its spatiotemporally controlled feature which minimizes damage to normal tissues.1,2 In general, PDT utilizes photosensitizers (PS) to convert oxygen into toxic reactive oxygen species (ROS) for killing cancer cells when irradiated with a near-infrared (NIR) laser,3,4 which means that its therapeutic effect is highly dependent on the intracellular production of ROS.5,6The photosensitizer concentration in tumor tissue is a key factor for enhancing the generation of ROS.7,8 However, the majority of PSs are hydrophobic, including chlorin e6 (Ce6),9–11 porphyrin derivatives,12,13 and boron-dipyrromethene (BODIPY) derivatives.14,15 Although these PSs exhibit efficient ROS generation upon irradiation, free PSs are difficult to accumulate in a tumor and enter into cells.16,17 Nowadays, some nanocarriers including micelles and liposomes have been developed and approved for use in the clinic.18–20 Nanocarriers can not only load hydrophobic PSs with high efficiency, but also effectively deliver them into tumor cells. Thus, utilizing nanocarriers delivering PSs is an effective approach for increasing ROS generation.
Another challenge for PDT is that the PS-induced ROS can be consumed by glutathione (GSH), a key intracellular antioxidant, severely impairing the therapeutic effect of PDT.21,22 Worse still, GSH in tumor cells is overexpressed with several-fold higher concentration (up to 10 mM) than that in normal cells.23,24 Thus, consuming intracellular GSH is believed to be a direct and efficient strategy for enhancing the therapeutic efficacy of PDT.6,25,26 Considering the intrinsic property of the GSH thiol group, the most straightforward way to consume intracellular GSH is the introduction of some chemical groups that can react with the thiol group of GSH.26–29
Inorganic nanoparticles, such as oxidizing metal ions, mostly deplete GSH in a nonspecific way, and exhibit poor biocompatibility and unavoidable metabolic toxicity.30,31 Organic nanoparticles, such as alkenes and maleimides,32 induce GSH depletion only under alkaline pH conditions, making them difficult to use widely.33 Notably, disulfide–thiol exchange is a typical reaction to oxidize the thiol group for GSH depletion.34 Recently, disulfide bonds were introduced into nanocarriers to enhance PDT efficacy through disulfide–thiol exchange-induced GSH consumption.35–38 However, the incomplete reaction between the disulfide bond and the thiol group limited the efficiency of GSH depletion.39 Thus, an alternative GSH-depleting agent is desirable to achieve a complete disulfide–thiol exchange reaction to enhance the PDT outcome. It is well known that the pyridyl disulfide group has been extensively used for bioconjugation due to its significantly faster reactivity with thiols compared to most other disulfide groups.40,41 It was reported that pyridyl disulfide had a high exchange efficiency of almost 100% and resulted in a stable product: tautomeric 2-pyridothione.39,42 At present, there have been few reports about using pyridine disulfide groups to deplete GSH.43,44 Therefore, to introduce pyridyl disulfide groups into a nanocarrier might be a more effective strategy for consuming intracellular GSH.
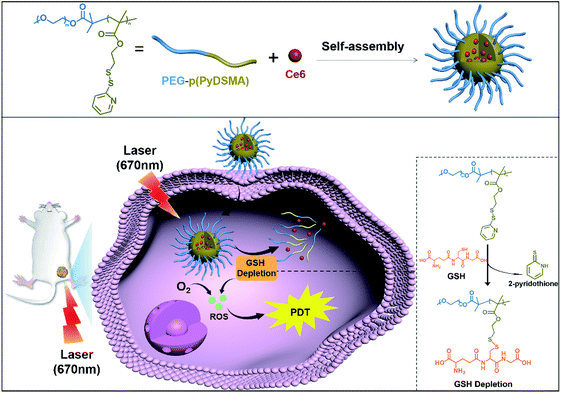
Considering that a nanocarrier with an uncomplicated structure might have more potential in clinical applications,45,46 we synthesized an amphiphilic diblock copolymer of monomethoxy-poly(ethylene glycol)-b-poly(pyridyl disulfide ethyl methacrylate), abbreviated as PEG–p(PyDSMA), to achieve both GSH depletion and hydrophobic PS delivery. The hydrophobic block p(PyDSMA) not only served as the hydrophobic core of a micelle to load Ce6, but also consumed GSH through the pendant pyridyl disulfide groups. In the tumor cells, the pyridyl disulfide groups in the p(PyDSMA) efficiently reacted with the thiol groups in the GSH to consume intracellular GSH, which increased the sensitivity of tumor cells to NIR/Ce6-induced oxidative stress. Therefore, we believe that the GSH-depleting nanocarrier shows excellent clinical potential for PDT against cancer (Scheme 1).
Experimental
Materials
Methoxy polyethylene glycols (mPEG, 2 kDa), 2,2′-dipyridyl disulfide (DPDS), 2-(2-hydroxyethyl) pyridine, methacryloyl chloride, and chlorin e6 (Ce6) were purchased from J&K Scientific Ltd (Beijing, China). Carbon disulfide (CS2), 1-dodecanethiol (C12H26S), 18-crown 6-ether (C12H24O6) and triethylamine (TEA) were purchased from Aladdin Co. (China). 2-Mercaptoethanol (C2H6OS) and 2,2′-azobisisobutyronitrile (AIBN) were purchased from 3A Chemicals Co. (China). Glacial acetic acid (AcOH), acetone, methanol (MeOH), dichloromethane (DCM), dimethyl ether (Et2O), isopropyl alcohol (IPA), 1,4-dioxane (C4H8O2), N,N-dimethylformamide (DMF) and other frequently-used chemical reagents were purchased from Guangzhou Chemical Reagent Company (Guangzhou, China). Human nasopharyngeal carcinoma cells (CNE-2) were provided from the Cell Bank of the Chinese Academy of Sciences (Shanghai, China). Cell culture medium RPMI-1640, phosphate-buffered saline (PBS), fetal bovine serum (FBS), and 0.25% trypsin were obtained from Gibco BRL (Carlsbad, CA, USA). Hoechst 33342, 1,1′-dioctadecyl-3,3,3′,3′-tetramethyl indotricarbocyanine iodide (DiR), dichlorofluorescein (DCF), annexin V-FITC, propidium iodide (PI) and other fluorescent staining agents were supplied by Yeasen Biotechnology Co. Ltd (Shanghai, China).Preparation of GSH-depleting SS-Py@Ce6 nanoparticles and GSH-nondepleting Py@Ce6 nanoparticles
GSH-depleting polymer PEG–p(PyDSMA) and GSH-nondepleting polymer PEG–p(PyEMA) were synthesized by reversible addition–fragmentation chain transfer polymerization (RAFT). The synthesis details are described in the ESI.† To prepare GSH-depleting SS-Py@Ce6 nanoparticles and GSH-nondepleting Py@Ce6 nanoparticles, the polymers (10 mg) PEG–p(PyDSMA) and PEG–p(PyEMA) were respectively dissolved in 1 mL of dimethyl sulfoxide (DMSO), and further mixed with 100 μL of Ce6 solution (10 mg mL−1, solvent: DMSO). The mixture was dispersed into 10 mL of deionized water and self-assembled to form Ce6-encapsulated micelles under ultrasound (60 Sonic Dismembrator, Fisher Scientific, USA). A Millipore Centrifugal Filter Device (MW cut-off: 100 kDa) and a syringe filter (pore size: 0.22 μm) were successively used for purification. Finally, the Ce6-encapsulated GSH-depleting SS-Py@Ce6 micelles and GSH-nondepleting Py@Ce6 micelles were obtained (with 1 mg mL−1 as the final concentration).Characterization of SS-Py@Ce6 nanoparticles
1H-NMR spectra were analyzed to verify the successful synthesis of monomers and polymers with a 400 MHz spectrometer (Bruker, Germany) in CDCl3. Gel permeation chromatography (Water Breeze, USA) was used to determine molecular weights and the polymer dispersity index (PDI). Sizes and zeta potentials of the Ce6-encapsulated GSH-depleting SS-Py@Ce6 micelles and GSH-nondepleting Py@Ce6 micelles were obtained with a Zetasizer Nano ZS analyzer (Malvern Instruments Ltd, UK). Transmission electron microscope (TEM) images of SS-Py@Ce6 and Py@Ce6 were recorded with a JEM-1400 Plus (JEOL, Japan) system at 120 kV. Samples (10 μL, 200 μg mL−1) were fixed onto a carbon-coated copper grid and stained by phosphotungstic acid solution before TEM analysis.Detection of extracellular ROS generation
Fluorescence spectra were used to detect extracellular ROS generation by GSH-depleting SS-Py@Ce6 and GSH-nondepleting Py@Ce6. In brief, a fluorescence probe DCFH-DA (1 eq., 1 mmol L−1) was dissolved in DMSO and hydrolyzed with NaOH solution (40 eq., 10 mmol L−1) at room temperature in the dark. After 30 min of reaction, PBS solution (10 mL) was added. The DCFH solution was well kept in a refrigerator at 4 °C in the dark. Then samples of different groups (i.e., SS-Py@Ce6 (+L), SS-Py@Ce6+10 mM GSH (−L), SS-Py@Ce6+10 mM GSH (+L), Py@Ce6 (+L), Py@Ce6+10 mM GSH (−L), and Py@Ce6+10 mM GSH (+L)) were mixed with 5 × 10⁻⁶ mmol L−1 DCFH solution (the laser groups were exposed to NIR irradiation (670 nm, 100 mW cm−2, 10 min)). ROS produced by photosensitizer Ce6 subsequently oxidized DCFH to fluorescent DCF. And the ROS generation level was determined by DCF fluorescence (excitation wavelength = 485 nm) using a spectrofluorophotometer (PerkinElmer Ltd, UK). To quantitively explore the influence of GSH on ROS generation in the different nanoparticle groups under irradiation, the nanoparticles (i.e., SS-Py@Ce6, SS-Py@Ce6+10 mM GSH, Py@Ce6, Py@Ce6+10 mM GSH) were mixed with DCFH solution. Then the fluorescence intensities of different groups were recorded at different time points of irradiation (0 min, 2 min, 4 min, 6 min, 8 min, 10 min) with the spectrofluorophotometer (PerkinElmer Ltd, UK).GSH-depletion assay of SS-Py@Ce6
To verify the GSH-depletion ability of SS-Py@Ce6, UV-vis spectra were used to detect the characteristic absorption peaks of GSH-depleting polymer. The pyridyl disulfide groups on the side chains of PEG–p(PyDSMA) polymer would exchange with the thiol groups of intracellular GSH. This reaction consumed GSH and produced stable tautomeric 2-pyridothione whose characteristic absorption peak for UV-vis spectra is at 343 nm. The GSH-depletion ability of the nanoparticles was characterized by the characteristic absorption peak of 2-pyridothione in the UV-vis spectra. SS-Py@Ce6 and Py@Ce6 nanoparticles with/without 10 mM GSH were detected with an Agilent Cary 60 UV-vis spectrophotometer with detection wavelengths from 300 nm to 700 nm.Stability of SS-Py@Ce6 and by-product to ROS
The stability of SS-Py@Ce6 and by-product 2-pyridothione to ROS was also determined by UV-vis spectra. The spectra of SS-Py@Ce6 and SS-Py@Ce6 nanoparticle solutions mixed with 60 μM 2-pyridothione were recorded with the Agilent Cary 60 UV-vis spectrophotometer. Then the above solutions were exposed to light irradiation (670 nm, 100 mW cm−2, 30 min). The UV-vis spectra after illumination were recorded to verify the stability of SS-Py@Ce6 and 2-pyridothione.Cell culture and animal model
The human NPC CNE-2 cell line was purchased from the Cell Bank of the Chinese Science Academy (Shanghai, China). RPMI-1640 medium supplemented with 10% fetal bovine serum and 1% penicillin-streptomycin was used to culture the CNE-2 cells. The cells were cultured at 37 °C under a humidified atmosphere with 5% CO2. Nude mice (6 weeks old) were purchased from Guangdong Medical Laboratory Animal Center. To establish a subcutaneously implanted tumor model, 3 × 10⁷ CNE-2 cells were subcutaneously injected into the arm pit of the mice. When tumor volumes reached about 100 mm3, the mice were ready to receive treatment.Cellular uptake and distribution in vitro of SS-Py@Ce6
The cellular uptake efficiency and distribution of GSH-depleting SS-Py@Ce6 and GSH-nondepleting Py@Ce6 were determined by confocal laser scanning microscopy (CLSM) and flow cytometry analysis. The human nasopharyngeal carcinoma cells (CNE-2) were cultured and incubated with RPMI-1640 medium (10% FBS) overnight at 37 °C (5% CO2). Then, the CNE-2 cells were incubated with medium containing GSH-depleting SS-Py@Ce6 or GSH non-depleting Py@Ce6 for 4 h. After that, the medium was replaced and the CNE-2 cells were incubated with fresh medium without nanoparticles for another 2 h. Before observation, Hoechst 33342 (10 μg mL−1) was used to stain the cell nuclei. The cellular uptake behavior and distribution of the nanoparticles were observed and recorded by confocal laser scanning microscopy (CLSM, Leica SP8, Germany). The cellular uptake efficiency of GSH-depleting SS-Py@Ce6 or GSH-nondepleting Py@Ce6 was quantified by flow cytometry analysis (Attune NxT, Invitrogen, America). And the untreated cells were set as a control. For flow cytometry analysis, the CNE-2 cells were incubated using the same procedure as above. After transfection, the cells were collected, trypsinized and resuspended in 1 × PBS for detection by flow cytometry analysis.Cell viability and apoptosis
The cytotoxicities of GSH-depleting SS-Py@Ce6 and by-product 2-pyridothione to CNE-2 cells were determined by MTT assay. For cytotoxicity analysis of GSH-depleting SS-Py@Ce6, the CNE-2 cells were seeded into 96-well plates (5 × 10³ cells per well) and treated with Py@Ce6 and SS-Py@Ce6 nanoparticles at different Ce6 concentrations (0.2, 0.4, 0.6, 0.8 and 1.0 μg mL−1) and the corresponding Ce6-encapsulated polymer concentrations (2.1, 4.2, 6.3, 8.4 and 10.5 μg mL−1), respectively. Then, the groups of SS-Py@Ce6+L and Py@Ce6+L were exposed to NIR irradiation (670 nm, 100 mW cm−2, 2 min). After irradiation, the CNE-2 cells were incubated with fresh RPMI-1640 medium containing 10% FBS. Then MTT solution was added into the medium and the cells were further incubated for 4 h. A microplate reader (BioTek) was used to record the absorbance at 570 nm of each sample. The cell viability was analyzed and quantitively calculated. For cytotoxicity analysis of by-product 2-pyridothione, the CNE-2 cells were treated with different concentrations of 2-pyridothione. The procedure was the same as above.Cell apoptosis was studied by flow cytometry. The CNE-2 cells were seeded into 12-well plates (2 × 10⁵ cells per well) and treated with PBS, Py@Ce6 or SS-Py@Ce6 nanoparticles at Ce6 concentrations of 1 μg mL−1. The cells of the laser groups were replaced with fresh medium and exposed to NIR irradiation (670 nm, 100 mW cm−2, 2 min). The CNE-2 cells were further cultured for 12 h at 37 °C. Then, the cells were trypsinized, collected, and stained with 5 μL of annexin V-FITC/PI dye for 15 min in the dark. Cell apoptosis was detected by a CytoFLEX flow cytometer (Beckman Coulter, Inc. Brea, CA, USA) and analyzed by FlowJo V10 software.
Analysis of intracellular ROS levels
Intracellular ROS levels were determined by confocal laser scanning microscopy (CLSM) and flow cytometry analysis. 2′,7′-Dichlorofluorescin diacetate (DCFH-DA, Abcam) was employed as a probe for intracellular reactive oxygen species (ROS). The CNE-2 cells were seeded into a 20 mm confocal plate and incubated with different treatments (PBS, Py@Ce6, SS-Py@Ce6, Py@Ce6+L or SS-Py@Ce6+L nanoparticles at Ce6 concentrations of 1 μg mL−1). After 4 h of transfection, the medium was replaced and the probe DCFH-DA was added into the medium. After irradiation and another 30 min of incubation, cell nuclei were stained with Hoechst 33342 (10 μg mL−1). Intracellular ROS generation was observed by CLSM (Ex = 488 nm, Em = 525 nm) and quantitatively analyzed by flow cytometry. The CNE-2 cells were plated into 12-well plates (2 × 10⁵ cells per well). The procedures of transfection and irradiation were the same as above. Then the CNE-2 cells were trypsinized and collected for flow cytometry analysis.Detection of intracellular GSH depletion
Intracellular GSH depletion was characterized with a commercial reduced GSH assay kit. The CNE-2 cells were seeded at a density of 1 × 10⁷ cells per well and treated with PBS+GSH, Py@Ce6+GSH, SS-Py@Ce6+GSH, Py@Ce6+GSH+L or SS-Py@Ce6+GSH+L. After treatment, the medium was replaced with fresh PBS. The disrupted cell solutions were mixed with GSH detection reagent for 10 min. The absorbance at 412 nm was measured and recorded. The relative intracellular GSH levels of different groups were calculated as follows:A0, A1, and A2 are the absorbances at 412 nm of the blank samples, control group, and experimental group, respectively.
Western blot analysis
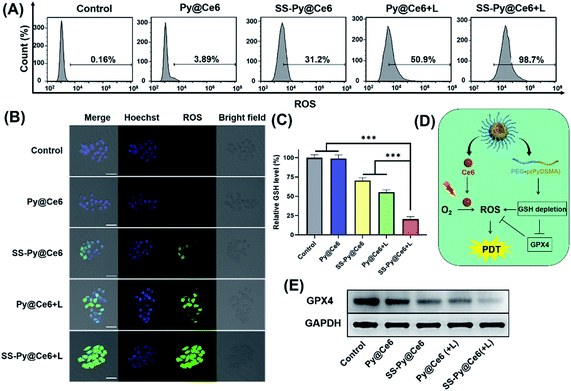
GSH depletion induced by the exchange reaction with the pyridyl disulfide groups of the polymer results in the downregulation of GPX4 protein. To further verify the intracellular GSH-depletion ability of the SS-Py@Ce6 nanoparticles at protein expression level, western blot analysis was conducted. The CNE-2 cells received different treatments (PBS, Py@Ce6, SS-Py@Ce6, Py@Ce6+L, or SS-Py@Ce6+L nanoparticles at Ce6 concentrations of 1 μg mL−1). Then RIPA lysis buffer lysed the CNE-2 cells to extract proteins. After separation by SDS-PAGE electrophoresis, the proteins were transferred onto a PVDF membrane (Millipore Corp. USA). Then 8000× dilutions of primary antibodies specific for GPX4 (Proteintech) and β-actin (Sigma) were added. A chemiluminescence imaging system (GE ImageQuant LAS 500, USA) was used to visualize the protein bands.In vivo biodistribution of SS-Py@Ce6
The in vivo biodistribution of SS-Py@Ce6 was imaged using a Carestream IS 4000 imaging system. NIR fluorescent dye DiR was encapsulated by the GSH-depleting polymer PEG–p(PyDSMA) to form fluorescent SS-Py@DiR nanoparticles. Nude mice bearing tumors were intravenously injected with SS-Py@DiR nanoparticles (at the dose of 400 μg kg−1). Then the kinetic in vivo fluorescence distribution was recorded at certain different time points (0, 3, 6, 9, 12, 24, and 48 h post injection). At 48 h after injection, the mice were dissected. The fluorescence of the excised organs (heart, liver, spleen, lung, and kidneys) and tumors were recorded using a Carestream live-animal imaging system.In vivo antitumor efficiency
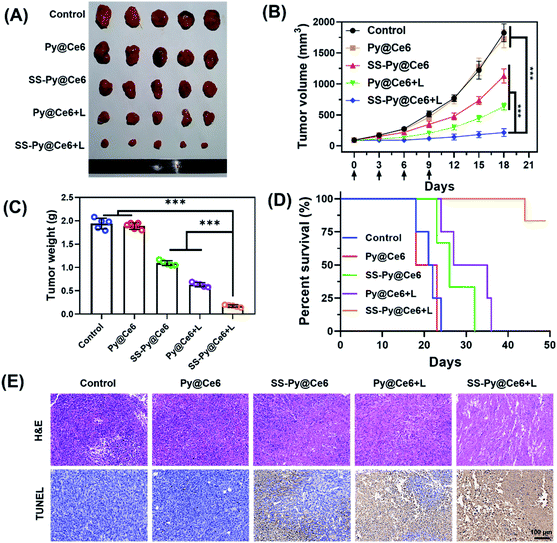
The CNE-2 tumor xenograft-bearing nude mice were randomly divided into five groups (n = 5) after the tumor volumes reached 100 mm3. The mice were intravenously injected with 100 μL of PBS, Py@Ce6 or SS-Py@Ce6 nanoparticles. At 6 h after injection, the Py@Ce6+L and SS-Py@Ce6+L groups were exposed to NIR irradiation at the tumor sites of the mice (670 nm, 100 mW cm−2, 10 min). The injection was performed on days 0, 3, 6, and 9. The perpendicular diameters of the tumors were measured with callipers and the tumor volumes of each mouse were recorded every three days after the treatment. (tumor volumes = (length × width2)/2). At 18 days after the first drug administration, the mice were sacrificed and dissected to obtain the excised solid tumors. The excised tumors were collected and photographed. The weights of the excised tumors were recorded. H&E staining and apoptotic TUNEL assays were performed on the excised tumor tissue sections to reveal the anti-tumor efficacy of different treatments. To determine the survival rate, the CNE-2 tumor xenograft-bearing nude mice were randomly divided into five groups (n = 6) and intravenously injected with various formulations as above. The mice were euthanized when the tumor volume reached 2000 mm3. The survival rate of the mice was recorded.Ethics statement
Nude mice (6 weeks old) were purchased from Guangdong Medical Laboratory Animal Center. All the mice received human care in compliance with the regulations of the Animal Care and Use Committee of Sun Yat-sen University (Guangzhou, China). All animal experiments were performed according to the guidelines for Care and Use of Laboratory Animals of the National Institutes of Health (NIH publication no. 85-23, revised 1996) and approved by the Animal Ethics Committee of Sun Yat-sen University (Guangzhou, China).Statistical analysis
Data were recorded as means ± standard deviation. The statistical significance between groups was determined by the unpaired two-tailed Student's t-test (*P < 0.05, **P < 0.01, ***P < 0.001).Results and discussion
Preparation and characterization of GSH-depleting SS-Py@Ce6
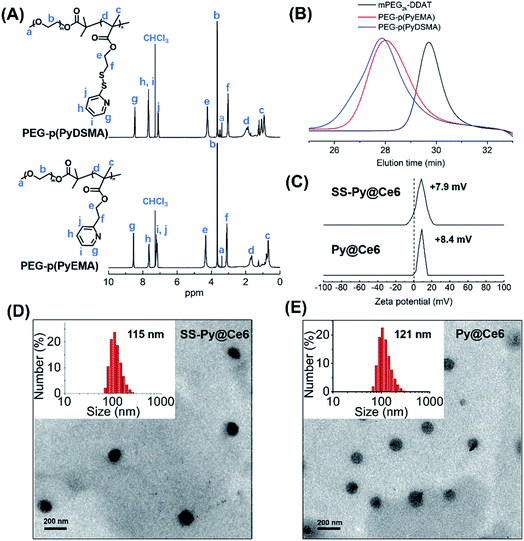
The GSH-depleting polymer PEG–p(PyDSMA) and GSH-nondepleting polymer PEG–p(PyEMA) were synthesized by reversible addition–fragmentation chain transfer polymerization (RAFT), with PyDSMA (containing pyridyl disulfide groups) and PyEMA (containing pyridine groups) as monomers, respectively (Fig. S1†). The synthesis procedures of 2-methyl-2-[(dodecylsulfanylthiocarbonyl) sulfanyl] propanoic acid (DDAT), macromolecular chain transfer agent mPEG2k–DDAT, GSH-reactive monomer PyDSMA, GSH-nonreactive monomer PyEMA and the details of the RAFT reaction are described in the ESI.† The successful synthesis of chain transfer agent, monomers and polymers was verified by 1H-NMR spectra (Fig. 1A and S2–S4†). The characteristic peaks of pyridine in the side chains were observed in the 1H-NMR spectra of both PEG–p(PyDSMA) and PEG–p(PyEMA) polymers: 8.46–8.54 ppm, aromatic proton ortho-N (g), 7.63–7.68 ppm, aromatic proton para-N (h), 7.10–7.18 ppm, aromatic proton ortho-disulfide linkage (j). GPC analysis showed that PEG–p(PyDSMA) and PEG–p(PyEMA) had higher molecular weights than the macromolecular chain transfer agent mPEG2k–DDAT (Fig. 1B). The Mn of PEG–p(PyDSMA) and PEG–p(PyEMA) were 8.6 kDa and 7.9 kDa, respectively (Fig. S5†). Both molecular weights of GSH-depleting polymer PEG–p(PyDSMA) and GSH-nondepleting polymer PEG–p(PyEMA) were uniformly distributed, with polydispersity indexes (PDI) of 1.28 and 1.22, respectively. These results suggested that PEG–p(PyDSMA) and PEG–p(PyEMA) had similar structures and molecular weights.To investigate the loading capacity of PEG–p(PyDSMA) and PEG–p(PyEMA) polymer, photosensitizers Ce6 were encapsulated to form nanoparticles SS-Py@Ce6 and Py@Ce6, which have a similar loading contents of Ce6 of about 8.7%. Fig. 1C–E show the particle sizes, zeta potentials and morphologies of SS-Py@Ce6 and Py@Ce6. As measured by DLS, GSH-depleting SS-Py@Ce6 and GSH-nondepleting Py@Ce6 showed hydrodynamic diameters of about 115 nm and 121 nm, respectively. And they both showed positive surface charges with zeta potentials of about +7.9 mV and +8.4 mV, respectively. From the transmission electron microscopy images, SS-Py@Ce6 and Py@Ce6 nanoparticles displayed a uniformly spherical shape. In this context, the Ce6-encapsulated micelles SS-Py@Ce6 and Py@Ce6 may have similar capacity in terms of Ce6-induced ROS generation due to their similar properties in particle size and morphology.
The synergistic effect on ROS level of PDT and GSH depletion
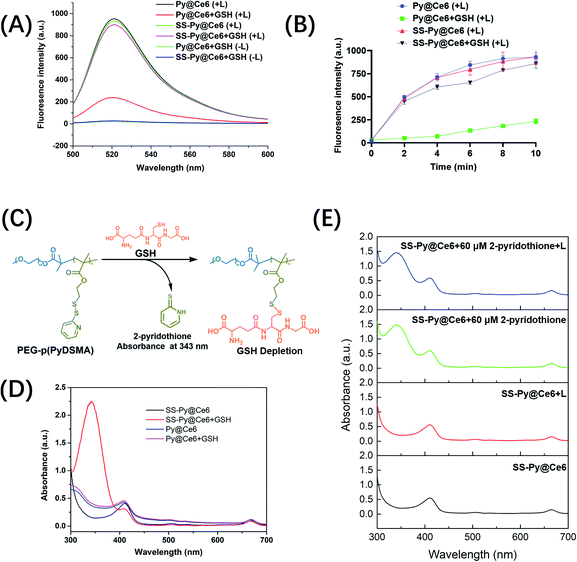
Glutathione (GSH), as a predominant antioxidant, maintains intracellular redox homeostasis by consuming oxidizing substances such as reactive oxygen species (ROS). Tumor cells are usually not susceptible to oxidative stress due to the high concentration of GSH (∼10 mM), which limits the efficiency of ROS-based PDT. According to our design, SS-Py@Ce6 would synergistically increase the ROS level through NIR/Ce6-induced ROS generation and p(PyDSMA)-based GSH depletion. To verify this, the extracellular ROS levels of GSH-depleting SS-Py@Ce6 and GSH-nondepleting Py@Ce6 were detected through fluorescence spectra, with dichlorofluorescein (DCF) as the fluorescent probe. As shown in Fig. 2A, the fluorescence intensity was associated with the ROS level. Both SS-Py@Ce6 and Py@Ce6 produced a great amount of ROS under 670 nm light irradiation (100 mW cm−2, 10 min) in the absence of GSH, indicating their significant photodynamic therapy effect. In the presence of 10 mM GSH, simulating the intracellular environment of tumor cells, the ROS produced by Py@Ce6 were significantly consumed by GSH, whereas the ROS produced by SS-Py@Ce6 were hardly consumed due to its GSH-depleting property, verifying that the GSH depletion induced by the PEG–p(PyDSMA) polymer may synergistically increase the intracellular ROS level. To quantitively explore the influence of GSH depletion on ROS level, the levels of ROS produced by SS-Py@Ce6 and Py@Ce6 with/without GSH were recorded at different irradiation times (0 min, 2 min, 4 min, 6 min, 8 min, 10 min) (Fig. 2B). After 2 min of irradiation, a great amount of ROS in the groups of SS-Py@Ce6, Py@Ce6 and SS-Py@Ce6+10 mM GSH were recorded, but only a small amount of ROS was detected in the Py@Ce6+10 mM GSH group. Even after 10 min of irradiation, the ROS level in the Py@Ce6+10 mM GSH group was much lower than in the other groups. This was due to the Py@Ce6-generated ROS being immediately consumed by GSH. These results demonstrated that SS-Py@Ce6 could rapidly deplete antioxidant GSH, avoiding the ROS scavenging effect by GSH.Then we verified whether the GSH depletion was attributable to the thiol–disulfide exchange reaction between the thiol groups in GSH and the pyridyl disulfide groups in the PEG–p(PyDSMA) polymer. The exchange reaction between PEG–p(PyDSMA) polymer and GSH generated the by-product tautomeric 2-pyridinethione whose characteristic absorption peak in the UV-vis spectra was at 343 nm (Fig. 2C). From the UV-vis spectra in Fig. 2D, Py@Ce6 did not show the characteristic absorption peaks of 2-pyridinethione with/without GSH, indicating that Py@Ce6 could not react with intracellular GSH. The characteristic absorption peak at 343 nm was observed in the UV-vis spectra of SS-Py@Ce6 with GSH, whereas no obvious peak at 343 nm was recorded without GSH, confirming that the pyridyl disulfide groups on the side chains of PEG–p(PyDSMA) polymer could efficiently react with GSH and induce rapid GSH depletion. What is more, the peak of 2-pyridinethione was still not detected when SS-Py@Ce6 micelles were exposed to irradiation (670 nm, 100 mW cm−2, 30 min) in the absence of GSH, suggesting that the pyridyl disulfide groups in the SS-Py@Ce6 micelles were very stable even under a high power level of NIR irradiation (Fig. 2E). The stability of by-product 2-pyridinethione was further studied. When SS-Py@Ce6 nanoparticles were mixed with 60 μM of free 2-pyridothione solution, there was almost no change in UV-vis spectra with or without irradiation, verifying that the by-product 2-pyridothione hardly reacts with ROS. These results strongly proved SS-Py@Ce6 could rapidly consume the antioxidant GSH, improving the ROS accumulation and enhancing PDT efficiency.
Efficient cellular uptake of SS-Py@Ce6
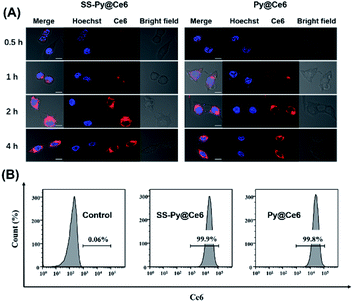
The cellular uptake efficiencies of GSH-depleting SS-Py@Ce6 and GSH-nondepleting Py@Ce6 were investigated by laser scanning confocal microscope analysis. The intracellular fluorescence of Ce6 (red) in CNE-2 cells receiving SS-Py@Ce6 and Py@Ce6 nanoparticles both gradually increased and reached a maximum 2 hours after transfection (Fig. 3A), indicating that the two nanoparticles had similar cellular internalization. CLSM images also showed that the red Ce6-fluorescence signal of SS-Py@Ce6 and Py@Ce6 nanoparticles was evenly dispersed around the nuclei stained by Hoechst 33342 (blue), suggesting that most nanoparticles were distributed in the cytoplasm. To quantitively study the cellular uptake efficiency, the CNE-2 cells receiving SS-Py@Ce6 and Py@Ce6 were subjected to flow cytometry analysis. Compared with the control group (0.06%), the majority of CNE-2 cells were successfully transfected with SS-Py@Ce6 or Py@Ce6 nanoparticles, with similar high cellular uptake efficiencies (99.9% and 99.8% vs. 0.06%) (Fig. 3B), respectively.Enhanced cytotoxicity of SS-Py@Ce6
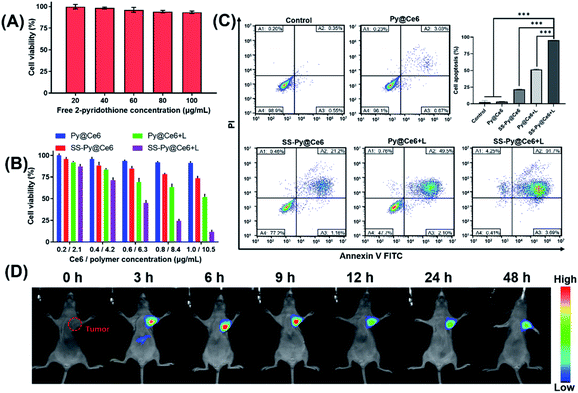
In the process of investigating the enhanced cytotoxicity of SS-Py@Ce6, we first excluded the cytotoxicity of by-product 2-pyridothione. As shown in Fig. 4A, the viability of cells treated with free 2-pyridothione was >90% even at a high concentration (100 μg mL−1), indicating that the by-product of GSH depletion causes little cytotoxicity to CEN-2 cells. We next investigated whether GSH-depleting micelles SS-Py@Ce6 could enhance the therapeutic effect of PDT (Fig. 4B). In the absence of irradiation, the treatment with GSH-nondepleting Py@Ce6 caused little cytotoxicity, whereas SS-Py@Ce6 caused a certain degree of cytotoxicity, which is probably due to the pyridyl disulfide group-induced GSH depletion. Upon NIR irradiation, the treatment with GSH-depleting SS-Py@Ce6 showed higher cytotoxicity than GSH-nondepleting Py@Ce6, indicating that the GSH-depleting SS-Py@Ce6 could synergistically enhance the PDT outcome. The above results were further confirmed by annexin V-FITC/PI flow cytometry analysis (Fig. 4C). The treatment with SS-Py@Ce6 in the absence of NIR irradiation only consumed GSH to increase the endogenous ROS, inducing a few apoptotic cells (∼22.36%). The treatment with Py@Ce6 plus NIR irradiation exhibited 51.6% of apoptotic cells, which was attributed to the ROS produced by PDT. In contrast, the treatment with SS-Py@Ce6 plus NIR irradiation exhibited the biggest apoptosis rate (∼95.39%), indicating GSH-depleting SS-Py@Ce6 could significantly enhance the therapeutic effect of PDT in vitro.Tumor accumulation of SS-Py@Ce6
The in vivo distribution of SS-Py@Ce6 was studied by using the Carestream IS 4000 imaging system (Fig. 4D). To monitor the distribution of nanoparticles, the NIR fluorescent dye DiR was used in the place of Ce6 to prepare SS-Py@DiR nanoparticles. The CNE-2 tumor xenograft-bearing nude mice were intravenously injected with SS-Py@DiR nanoparticles at a DiR dose of 400 μg kg−1. Then the fluorescence distribution of the nanoparticles was recorded at certain different time points (0, 3, 6, 9, 12, 24 and 48 h post injection). The fluorescence signals reached a maximum at the tumor tissue 6 h after injection. From observation of fluorescence in the excised organs (Fig. S6†), SS-Py@DiR nanoparticles were mainly distributed in tumor tissues, with some nanoparticles in the liver, and almost no nanoparticles in the heart, spleen, lung, or kidneys. These results proved that the GSH-depleting SS-Py@Ce6 nanoparticles could effectively accumulate in tumor tissue.Improvement of ROS levels induced by GSH depletion in vitro
The lethality of PDT to tumor cells depends on the ROS levels generated by photosensitizers under irradiation. The intracellular ROS generation level of SS-Py@Ce6 nanoparticles was detected by confocal laser scanning microscopy (CLSM) and flow cytometry analysis, with DCFH-DA as the ROS probe (Fig. 5A and B). There was no obvious fluorescence signal in the cells receiving Py@Ce6 without light irradiation (3.89%), which was similar to the control group (0.16%). A certain amount of ROS fluorescence (31.2%) was exhibited in the CNE-2 cells receiving SS-Py@Ce6 without irradiation due to the increased endogenous ROS by GSH depletion. Under 670 nm light irradiation, the cells receiving Py@Ce6 and SS-Py@Ce6 showed obvious fluorescence signals. According to the flow cytometry analysis, the intracellular ROS level of the cells receiving SS-Py@Ce6 with irradiation was much higher (98.7%) than that of Py@Ce6 (50.9%), indicating that SS-Py@Ce6 could enhance the intracellular ROS level.To further investigate whether the enhanced intracellular ROS level is attributable to GSH depletion, the GSH levels of CNE-2 cells receiving different treatments were measured. As shown in Fig. 5C, the GSH-depleting micelles SS-Py@Ce6 without irradiation can decrease the GSH levels of CNE-2. Under NIR irradiation, both SS-Py@Ce6 and Py@Ce6 can decrease the GSH levels of CNE-2 by Ce6-generated ROS. However, the SS-Py@Ce6 showed the lowest level of GSH, which was due to the combination of the pyridyl disulfide group-induced GSH depletion and PDT. It was reported35,47,48 that GSH depletion can improve ROS accumulation through inhibiting glutathione peroxidase 4 (GPX4) expression (Fig. 5D). Thus, western blot analysis of GPX4 in CNE-2 receiving different treatments was used to further confirm the GSH depletion (Fig. 5E), which was consistent with the GSH levels of the CNE-2 cells receiving different treatments. These results proved that SS-Py@Ce6 could effectively deplete GSH and increase the intracellular ROS level, thus improving the PDT effect.
Anti-tumor efficiency of SS-Py@Ce6 in vivo
Encouraged by the in vitro results of GSH-depleting nanocarrier and Ce6-based PDT, we studied the in vivo antitumor efficacy of SS-Py@Ce6 nanoparticles. The CNE-2 tumor xenograft-bearing nude mice were randomly divided into five groups (n = 5): PBS (negative control), GSH-nondepleting Py@Ce6 without NIR irradiation (Py@Ce6), GSH-nondepleting Py@Ce6 with NIR irradiation (Py@Ce6+L), GSH-depleting SS-Py@Ce6 without NIR irradiation (SS-Py@Ce6), and GSH-depleting SS-Py@Ce6 with NIR irradiation (SS-Py@Ce6+L). The in vivo tumor accumulation results of SS-Py@DiR nanoparticles showed that the highest signal intensity of dye DiR in the tumor tissue appeared 6 hours post injection (Fig. 4D), so the NIR irradiation at a wavelength of 670 nm was performed 6 h after nanoparticle injection. The Py@Ce6 treatment without NIR irradiation hardly inhibited the tumor growth. In contrast, the SS-Py@Ce6, Py@Ce6+L and SS-Py@Ce6+L treatments reduced the tumor volumes by 38.1, 65.1, and 88.2%, and reduced the tumor weights by 43.6, 67.5, and 91.0%, compared with the Py@Ce6 treatment 18 days after the first nanoparticle injection (Fig. 6A–C). The SS-Py@Ce6+L treatment showed greater antitumor inhibition effect than any other treatment, which was due to the combinatory effect of NIR/Ce6-induced ROS generation and the pyridyl disulfide group-induced GSH depletion. All the mice receiving Py@Ce6 survived less than 25 days, similar to the control group. Over half of the mice in the groups of SS-Py@Ce6 and Py@Ce6+L died within 30 d, and the rest of them did not survive longer than 36 days (Fig. 6D). Notably, over 80% of the mice receiving SS-Py@Ce6+L survived longer than 50 d, suggesting the significant anti-tumor effect of PDT enhanced by GSH depletion. Histological H&E staining and apoptotic TUNEL assays (Fig. 6E) revealed that the treatment of SS-Py@Ce6 under irradiation induced the highest degree of cell necrosis and apoptosis. The major organs of mice receiving different treatment did not exhibit pathological changes (Fig. S7†). These in vivo results proved that SS-Py@Ce6 nanoparticles can induce GSH consumption, making a tumor more susceptible to oxidative stress, which significantly enhances the effect of PDT.Conclusions
In this work, we designed a novel GSH-depleting nanocarrier to efficiently deliver the hydrophobic photosensitizer Ce6 and significantly enhance the therapeutic efficacy of PDT. The nanocarriers showed satisfactory Ce6 loading content and a great capacity to generate ROS. The pendant pyridyl disulfide groups on the side chain of the GSH-depleting copolymer effectively consumed the high concentration of GSH in tumor cells. The GSH depletion broke the redox homeostasis and promoted the intracellular ROS level, exhibiting significantly enhanced cytotoxicity and apoptosis. This study details an efficient and straightforward strategy for enhancing the PDT effect.Author contributions
Shi-yin Wang and Guo Chen contributed equally to this work. Shi-yin Wang: investigation, validation, writing – review & editing. Guo Chen: methodology, validation. Ji-feng Chen: validation. Jin Wang: funding acquisition. Shao-hui Deng*: methodology, supervision. Du Cheng*: conceptualization, supervision.Conflicts of interest
There are no conflicts to declare.Acknowledgements
This work was financially supported by the National Natural Science Foundation of China (21875289 and 91959118) and the National Natural Science Foundation of Guangdong Province (2022A1515011304).Notes and references
- J. M. Chen, T. J. Fan, Z. J. Xie, Q. Q. Zeng, P. Xue, T. T. Zheng, Y. Chen, X. L. Luo and H. Zhang, Biomaterials, 2020, 237, 119827 CrossRef CAS PubMed.
- A. Master, M. Livingston and A. Sen Gupta, J. Controlled Release, 2013, 168, 88–102 CrossRef CAS PubMed.
- S. Kwiatkowski, B. Knap, D. Przystupski, J. Saczko, E. Kedzierska, K. Knap-Czop, J. Kotlinska, O. Michel, K. Kotowski and J. Kulbacka, Biomed. Pharmacother., 2018, 106, 1098–1107 CrossRef CAS PubMed.
- E. Ostasnka, D. Aebisher and D. Bartusik-Aebisher, Biomed. Pharmacother., 2021, 137, 111302 CrossRef PubMed.
- Z. J. Zhou, J. B. Song, L. M. Nie and X. Y. Chen, Chem. Soc. Rev., 2016, 45, 6597–6626 RSC.
- W. Zhang, J. Lu, X. N. Gao, P. Li, W. Zhang, Y. Ma, H. Wang and B. Tang, Angew. Chem., Int. Ed., 2018, 57, 4891–4896 CrossRef CAS PubMed.
- I. Yakavets, M. Millard, V. Zorin, H. P. Lassalle and L. Bezdetnaya, J. Controlled Release, 2019, 304, 268–287 CrossRef CAS PubMed.
- M. G. Mokwena, C. A. Kruger, M. T. Ivan and A. Heidi, Photodiagn. Photodyn. Ther., 2018, 22, 147–154 CrossRef CAS PubMed.
- S. H. Deng, X. X. Li, S. Liu, J. F. Chen, M. Q. Li, S. Y. A. Chew, K. Leong and D. Cheng, Sci. Adv., 2020, 6, eabb4005 CrossRef CAS PubMed.
- C. Hu, X. Q. He, Y. X. Chen, X. T. Yang, L. Qin, T. Lei, Y. Zhou, T. Gong, Y. Huang and H. L. Gao, Adv. Funct. Mater., 2021, 31 Search PubMed.
- M. Shu, J. J. Tang, L. L. Chen, Q. Zeng, C. Li, S. T. Xiao, Z. Z. Jiang and J. Liu, Biomaterials, 2021, 268 Search PubMed.
- M. A. Rajora, J. W. H. Lou and G. Zheng, Chem. Soc. Rev., 2017, 46, 6433–6469 RSC.
- H. B. Cheng, B. Qiao, H. Li, J. Cao, Y. L. Luo, K. M. K. Swamy, J. Zhao, Z. G. Wang, J. Y. Lee, X. J. Liang and J. Yoon, J. Am. Chem. Soc., 2021, 143, 2413–2422 CrossRef CAS PubMed.
- J. Z. Zhao, K. J. Xu, W. B. Yang, Z. J. Wang and F. F. Zhong, Chem. Soc. Rev., 2015, 44, 8904–8939 RSC.
- J. Zhou, Y. Z. Zhang, G. C. Yu, M. R. Crawley, C. R. P. Fulong, A. E. Friedman, S. Sengupta, J. F. Sun, Q. Li, F. H. Huang and T. R. Cook, J. Am. Chem. Soc., 2018, 140, 7730–7736 CrossRef CAS PubMed.
- S. S. Lucky, K. C. Soo and Y. Zhang, Chem. Rev., 2015, 115, 1990–2042 CrossRef CAS PubMed.
- F. Hu, S. D. Xu and B. Liu, Adv. Mater., 2018, 30, 1801350 CrossRef PubMed.
- C. F. van Nostrum, Adv. Drug Delivery Rev., 2004, 56, 9–16 CrossRef CAS PubMed.
- F. Y. Zhou, B. Feng, H. J. Yu, D. G. Wang, T. T. Wang, Y. T. Ma, S. L. Wang and Y. P. Li, Adv. Mater., 2019, 31 Search PubMed.
- S. Moghassemi, A. Dadashzadeh, R. B. Azevedo, O. Feron and C. A. Amorim, J. Controlled Release, 2021, 339, 75–90 CrossRef CAS PubMed.
- P. T. Schumacker, Cancer Cell, 2015, 27, 156–157 CrossRef CAS PubMed.
- Y. J. Huang, Y. L. Jiang, Z. H. Xiao, Y. F. Shen, L. F. Huang, X. Y. Xu, G. F. Wei, C. J. Xu and C. S. Zhao, Chem. Eng. J., 2020, 380 Search PubMed.
- M. M. Chen, D. P. Liu, F. S. Liu, Y. N. Wu, X. J. Peng and F. L. Song, J. Controlled Release, 2021, 332, 269–284 CrossRef CAS PubMed.
- Y. X. Xiong, C. Xiao, Z. F. Li and X. L. Yang, Chem. Soc. Rev., 2021, 50, 6013–6041 RSC.
- T. Su, F. R. Cheng, Y. J. Pu, J. Cao, S. B. Lin, G. Z. Zhu and B. He, Chem. Eng. J., 2021, 411, 128561 CrossRef CAS.
- J. Feng, J. L. Gao, R. Y. Zhang, W. X. Ren and Y. B. Dong, ACS Appl. Bio Mater., 2020, 3, 8667–8675 CrossRef CAS PubMed.
- J. H. Shi, T. R. Wang, Y. Q. You, M. L. Akhtar, Z. J. Liu, F. Han, Y. Li and Y. Wang, Nanoscale, 2019, 11, 13078–13088 RSC.
- F. R. Liu, S. L. Gong, M. L. Shen, T. He, X. Q. Liang, Y. Q. Shu, X. X. Wang, S. Ma, X. C. Li, M. M. Zhang, Q. J. Wu and C. Y. Gong, Chem. Eng. J., 2021, 403, 126305 CrossRef CAS.
- J. Deng, F. Liu, L. Wang, Y. An, M. Gao, Z. Wang and Y. Zhao, Biomater. Sci., 2019, 7, 429–441 RSC.
- K. Cherukula, K. Manickavasagam Lekshmi, S. Uthaman, K. Cho, C.-S. Cho and I.-K. Park, Nanomaterials, 2016, 6, 76 CrossRef PubMed.
- C. M. Saporito-Magrina, R. N. Musacco-Sebio, G. Andrieux, L. Kook, M. T. Orrego, M. V. Tuttolomondo, M. F. Desimone, M. Boerries, C. Borner and M. G. Repetto, Metallomics, 2018, 10, 1743–1754 CrossRef CAS PubMed.
- H. Cao, S. Zhong, Q. Wang, C. Chen, J. Tian and W. Zhang, J. Mater. Chem. B, 2020, 8, 478–483 RSC.
- M. Monfared, M. D. Nothling, D. Mawad and M. H. Stenzel, Biomacromolecules, 2021, 22, 4295–4305 CrossRef CAS PubMed.
- X. Xiao, K. W. Wang, Q. Y. Zong, Y. L. Tu, Y. S. Dong and Y. Y. Yuan, Biomaterials, 2021, 270 Search PubMed.
- X. Meng, J. Deng, F. Liu, T. Guo, M. Y. Liu, P. P. Dai, A. P. Fan, Z. Wang and Y. J. Zhao, Nano Lett., 2019, 19, 7866–7876 CrossRef CAS PubMed.
- L. B. Ke, F. M. Wei, X. X. Liao, T. W. Rees, S. Kuang, Z. Liu, Y. Chen, L. N. Ji and H. Chao, Nanoscale, 2021, 13, 7590–7599 RSC.
- Z. H. Zhang, Y. X. Ding, Y. J. Li, P. Wu, J. Guo and C. C. Wang, Adv. Ther., 2019, 2, 1800113 CrossRef CAS.
- K. Li, W. Y. Dong, Y. X. Miao, Q. Z. Liu, L. Qiu and J. G. Lin, J. Photochem. Photobiol., B, 2021, 215 Search PubMed.
- I. Altinbasak, M. Arslan, R. Sanyal and A. Sanyal, Polym. Chem., 2020, 11, 7603–7624 RSC.
- R. Bej, A. Ghosh, J. Sarkar, B. B. Das and S. Ghosh, ChemBioChem, 2020, 21, 2921–2926 CrossRef CAS PubMed.
- Y. L. Yang, Y. Li, Q. N. Lin, C. Y. Bao and L. Y. Zhu, ACS Macro Lett., 2016, 5, 301–305 CrossRef CAS PubMed.
- M. Geven, H. Luo, D. Koo, G. Panambur, R. Donno, A. Gennari, R. Marotta, B. Grimaldi and N. Tirelli, ACS Appl. Mater. Interfaces, 2019, 11, 26607–26618 CrossRef CAS PubMed.
- X. T. Cheng, H. D. Xu, H. H. Ran, G. L. Liang and F. G. Wu, ACS Nano, 2021, 15, 8039–8068 CrossRef CAS PubMed.
- B. Y. Niu, K. X. Liao, Y. X. Zhou, T. Wen, G. L. Quan, X. Pan and C. B. Wu, Biomaterials, 2021, 277 Search PubMed.
- P. Zhang, J. Li, M. Ghazwani, W. C. Zhao, Y. X. Huang, X. L. Zhang, R. Venkataramanan and S. Li, Biomaterials, 2015, 67, 104–114 CrossRef CAS PubMed.
- Q. Zhang, X. L. Wang, P. Z. Li, K. T. Nguyen, X. J. Wang, Z. Luo, H. C. Zhang, N. S. Tan and Y. L. Zhao, Adv. Funct. Mater., 2014, 24, 2450–2461 CrossRef CAS.
- J. Chen, F. Chen, L. Zhang, Z. Yang, T. Deng, Y. Zhao, T. Zheng, X. Gan, H. Zhong, Y. Geng, X. Fu, Y. Wang and C. Yu, ACS Appl. Mater. Interfaces, 2021, 13, 27856–27867 CrossRef CAS PubMed.
- K. C. Liang, H. T. Sun, Z. B. Yang, H. Z. Yu, J. Shen, X. L. Wang and H. R. Chen, Adv. Funct. Mater., 2021, 31 Search PubMed.
Footnotes |
| † Electronic supplementary information (ESI) available. See https://doi.org/10.1039/d2ra01877b |
| ‡ The authors contributed equally to this work. |
| This journal is © The Royal Society of Chemistry 2022 |

