
 Open Access Article
 This Open Access Article is licensed under a Creative Commons Attribution-Non Commercial 3.0 Unported Licence
Structural, morphological, and electrical properties of silver-substituted ZnAl2O4 nanoparticles
Mohamed Amghar *a,
Amira Bougoffaa,
Abdessalem Trabelsia,
Abderrazek Oueslatib and
Essebti Dhahria
*a,
Amira Bougoffaa,
Abdessalem Trabelsia,
Abderrazek Oueslatib and
Essebti Dhahria
aLaboratory of Applied Physics, Faculty of Sciences of Sfax, University of Sfax, B. P. 1171, Sfax, 3000, Tunisia. E-mail: amgharmohamed498@gmail.com
bLaboratory of Spectroscopic Characterization and Optic Materials, University of Sfax, Faculty of Sciences of Sfax, B. P. 1171, 3000 Sfax, Tunisia
First published on 26th May 2022
Abstract
In this paper, nanoparticles of  (x = 0.05 and x = 0.1) were synthesized by the sol–gel auto-combustion method and characterized by various techniques. X-ray diffraction (XRD) for structural characterization confirms the successful formation of a cubic spinel structure with the space group Fd
![[3 with combining macron]](https://www.rsc.org/images/entities/char_0033_0304.gif) m. Their morphology was evaluated with a scanning electron microscope (SEM) which shows an agglomeration of nanoparticles. To characterize the electrical behavior of our compounds, we used impedance spectroscopy at temperatures ranging from 313 K to 653 K and frequencies ranging from 0.1 Hz to 1 MHz. The experimental data for the real and imaginary impedance parts were mounted on the equivalent grain resistance (Rg)//fractal capacitance (CPE) circuit. Indeed, the activation energies extracted from the electrical conductivity and the resistance of the grain resistance (Rg) closed and confirmed a transformation of the electrical behavior confirmed by a decrease in the resistance of the materials. The study of the alternating conductivity shows a Jonscher curve behavior and a thermally activated conduction process. The variation of the exponent “s” as a function of temperature shows, on the one hand, the presence of two models of conduction correlated barrier jump (CBH) and non-overlapping small polaron tunneling (NSPT) for x = 0.05 and, on the other hand, a CBH model for x = 0.1.
m. Their morphology was evaluated with a scanning electron microscope (SEM) which shows an agglomeration of nanoparticles. To characterize the electrical behavior of our compounds, we used impedance spectroscopy at temperatures ranging from 313 K to 653 K and frequencies ranging from 0.1 Hz to 1 MHz. The experimental data for the real and imaginary impedance parts were mounted on the equivalent grain resistance (Rg)//fractal capacitance (CPE) circuit. Indeed, the activation energies extracted from the electrical conductivity and the resistance of the grain resistance (Rg) closed and confirmed a transformation of the electrical behavior confirmed by a decrease in the resistance of the materials. The study of the alternating conductivity shows a Jonscher curve behavior and a thermally activated conduction process. The variation of the exponent “s” as a function of temperature shows, on the one hand, the presence of two models of conduction correlated barrier jump (CBH) and non-overlapping small polaron tunneling (NSPT) for x = 0.05 and, on the other hand, a CBH model for x = 0.1.
1. Introduction
Metal oxides with a spinel structure, which are commonly cultivated in AB2O4 compositional stoichiometry, are a class of compounds with a wide range of interesting magnetic, optical and electrical properties. In the normal spinel structure, A is a divalent metal ion which occupies the tetrahedral site and B is a trivalent metal ion which occupies the octahedral site,1 and oxygen has a closed fcc compaction arrangement, exhibiting a related specific character, to the possibility of transformation of electrical behavior.2 Zinc aluminate (ZnAl2O4) is a mineral with a normal spinel structure. ZnAl2O4 is of great application interest for catalytic reactions such as dehydration, cracking, dehydrogenation, and hydrogenation.3 Many advantages exist for zinc aluminate, including hydrophobic behavior, high thermal and chemical stability, low sintering temperature, high mechanical strength, and high quantum yields.4 ZnAl2O4 is of interest due to the large optical band gap (Eg = 3.8 eV) and is hence used in optoelectronic applications.5 This semiconductor material is used as a catalytic material. The sol–gel route,6 the solid-state method,7 the combustion method,8 and the solution route are most currently used to synthesize ZnAl2O4. Nanocrystalline materials, such as ZnAl2O4 spinels, have sparked considerable interest in the field of catalysis in recent years because they can be used as supports for noble metals to replace more traditional materials. In the field of photoemission application, ZnAl2O4 is a suitable host matrix, and a recent review of the literature revealed that ZnAl2O4 unsaturated and doped with different activating ions such as Eu3+, Dy3+, Tb3+, and Mn2+ exhibit d 'excellent phosphorus properties with various optical and medical applications.9 ZnAl2O4 has the unusual properties of having low dielectric permittivity and high quality (Q). The spinel structure of ZnAl2O4 by sintering for 4 h at 1700 °C, in 2008, Chen et al. reported and offered a high quality factor (quality (Q) × frequency (f)) and a low relative permittivity. As a noble material, silver atom proved especial physical properties where Ag incorporation had the role to affects the electrical properties of compounds leading to decrease of the electrical resistivity due to an increase of the concentration of electric charge carriers10–16 It is also found in the literature that the addition of Ag in spinel or perovskite systems, improves the size of the grains and the connectivity of these grains by the silver bonding path in the matrix.14–16 In recent years, nanocrystalline materials like ZnAl2O4 spinels have attracted considerable interest in the field of catalysis because they can be used as carriers of noble metals to substitute for more traditional materials.17,18 Typically, the use of silver as a doped element improves the electrical inhomogeneity on the grain and the surface microstructure,19–21 and catalytic activities. Additionally, when the highly conductive metal Ag provides a conduction path between the grains, the resistivity of the spinel will be reduced, greatly improving the activity, selectivity, recycling, and reproducibility of catalytic systems, making the material useful for potential of application.3,22,23 In the normal structure of the aluminum spinel (Zn)[Al2]O4, the Zn2+ cations occupy the 8a Wycoff tetrahedral sites positions, Al3+ cations occupy the 16d octahedral sites and O2− anions occupy the 32nd positions. On co-dopant with {Li,Al}, pairs of Zn2+ cations are substituted in equal proportion by Li+ and Al3+, to maintain charge neutrality, giving a composition of (Zn1−xLix)[Al2+x]O4.24–28 In our case, we substituted Zn2+ with Ag+. According to the equation of electronic neutrality, a rate of substitution “x” will induce the creation of a self-oxygen deficiency with a rate x/2. The electronic equation of the compounds is written in the following form .
.
In this regard, the present study aims to explore the impact of a substitution of zinc (Zn) by silver (Ag) in the A site of the ZnAl2O4 spinel lattice. In order to achieve a better understanding of the key issues involved in the process, the study considers nanoparticles of  (x = 0.05 and x = 0.1) synthesized by the sol–gel auto-combustion. Variations in structural, morphological and electrical properties of Ag doped ZnAl2O4 are investigated at several temperatures going from 313 to 653 K in the frequency range from 0.1 Hz to 1 MHz.
2. Experimental
2.1 Materials
Silver nitrate (AgNO3), zinc oxide (ZnO), aluminum nitrate (Al(NO3)3·9H2O), citric acid (C6H8O7), and nitric acid (HNO3) were purchased from Sigma-Aldrich.2.2 Sol–gel auto-combustion process
(7.68 mmol, 0.63 g) zinc oxide ZnO (98% purity) dissolved in nitric acid, (6.18 mmol, 6.07 g) aluminum nitrate Al(NO3)3·9H2O (98% purity), and (0.040 mmol, 0.07 g) silver nitrate AgNO3 (99.8% purity) were used as raw materials to prepare the samples of formula (x = 0.05 and x = 0.1) by the sol–gel auto-combustion method29 (this synthesis method is one of the most useful and attractive techniques for synthesizing nanoscale materials due to its advantages such as: low treatment temperature, homogeneous reactant distribution, the products obtained by this method exhibit high crystalline quality, narrow size distribution and uniform shape).30 Each of the precursors was dissolved individually in distilled water (50 ml). The solution obtained was then homogenized by adding (35.85 mmol, 5.76 g) citric acid C6H8O7 (98% purity) with constant stirring to result in a homogeneous transparent solution, which was then heated to 80 °C to obtain a viscose: gel solution. Then, the formed gel was heated on a hot plate at 180 °C to be transformed into powders which were ground and calcined in air at 350 °C for 6 h to obtain a dry fluffy mass. To remove organic matter and residual matter, the powder was calcined at 500 °C for 6 h. Then this powder was crushed and calcined at 700 °C for six hours to improve the crystallinity of the synthesized powders. In the last step, this powder was pressed into pellets 8 mm in diameter, finally sintered at 800 °C for 24 hours to induce crystallization. X-ray diffraction (XRD) with a D8 Advance diffractometer and monochromatic CuKα radiation λ = 1.54060 Å, was used to study the crystal structure and purity of the prepared samples. Morphology and chemical compositions were examined using a scanning electron microscope (SEM) SU5000, at an accelerating voltage (15.0 kV), equipped with an EDX detector. Impedance spectroscopy measurements in a temperature range of 313 K to 653 K and a frequency range of 0.1 Hz to 1 MHz using an Agilent 4294 analyzer, were used for the electrical studies of our samples.
2.3. Methods
Using the X-ray diffraction, the lattice parameters (aexp) of (x = 0.05 and x = 0.1) was calculated based on the following expression:31
 | (1) |
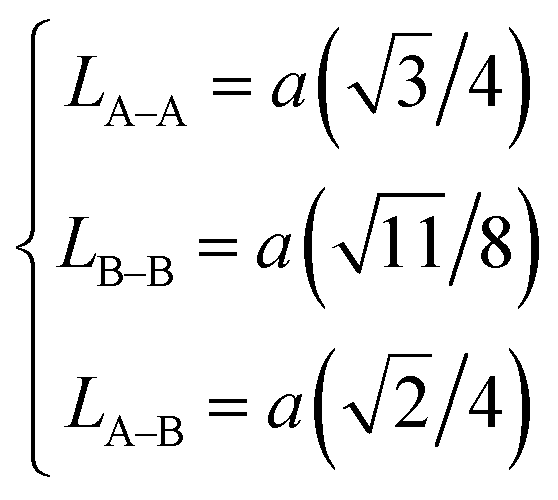
Then, the link lengths between the spinel structure sites (LA–A, LB–B, and LA–B) were deduced using Standely's equations:32
 | (2) |
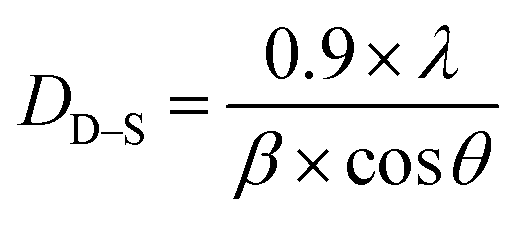
The crystallite size (DD–S) was estimated also from the main peak (311) of the XRD data referring to the Debye–Scherrer formula, as follows:33
 | (3) |
Taking into account the dependence of material properties on the direction considered, it has been proven that the strain-induced in powders due to imperfection and crystal distortion is proportional to  :
:
 | (4) |
Since the contributions of particle size and lattice strain to line broadening are independent of each other, then the observed line width is simply written as the sum of these two contributions which leads to the following Williamson–Hall equation:34
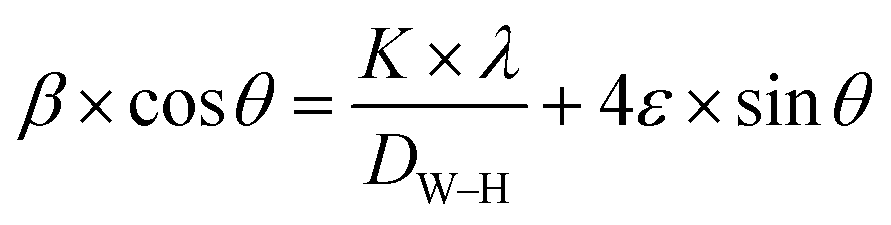 | (5) |
On the other hand, the X-ray density (dX-ray) was calculated, for each sample, using the following equation:35
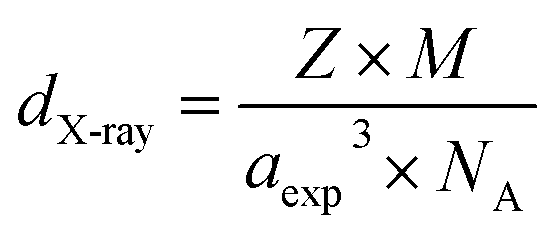 | (6) |
Accordingly, the bulk density dexp of the samples was determined using the following formula:36
 | (7) |
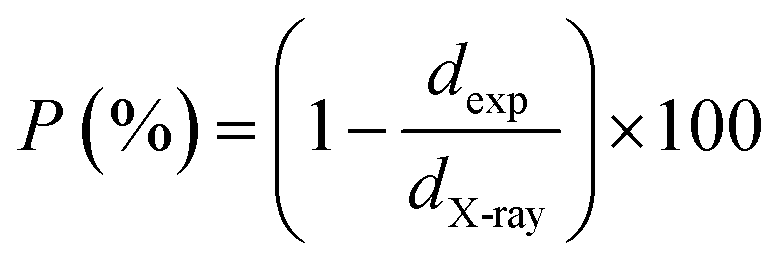
The difference between the X-ray density and the bulk density sets forward the notion of porosity (P), which is calculated by the following formula:37
 | (8) |
The dislocation density (δ) was used to represent the number of defects in the sample, which is defined as the length of the dislocation lines per unit volume of the crystal:38
 | (9) |
In the same contest, the number of unit cells (N) of the  crystals (for x = 0.05 and x = 0.1) was calculated using the following formula:32
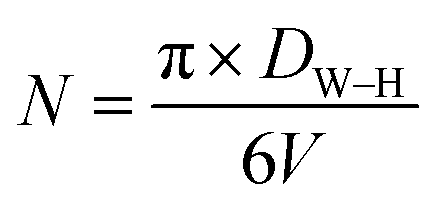 | (10) |
3. Results and discussion
3.1 Structural studies
XRD was used to identify the crystallization phases of the prepared samples, which are shown in Fig. 1 for x = 0.05 (a) and x = 0.1 (b) (where the experimental diffractogram is represented in red, the calculated one in a solid black line, their difference in blue, and the positions of the Bragg lines in green), exhibited the characteristic XRD peaks corresponding to the reflection of the planes of ZnAl2O4 (ref. 39) with a spinel cubic structure in the space group Fdm, (111), (220), (311), (222), (400), (331), (333), (440), (620), (533), (642), (553), and (800) (JCPDS no. 05-0669).39 In addition, diffraction peaks appeared in the XRD associated with the phase minority Ag, space group Fmm. The Rietveld refinement of two samples x = 0.05 and x = 0.1 of powder was carried out using the FULLPROF program40 Fig. 1.
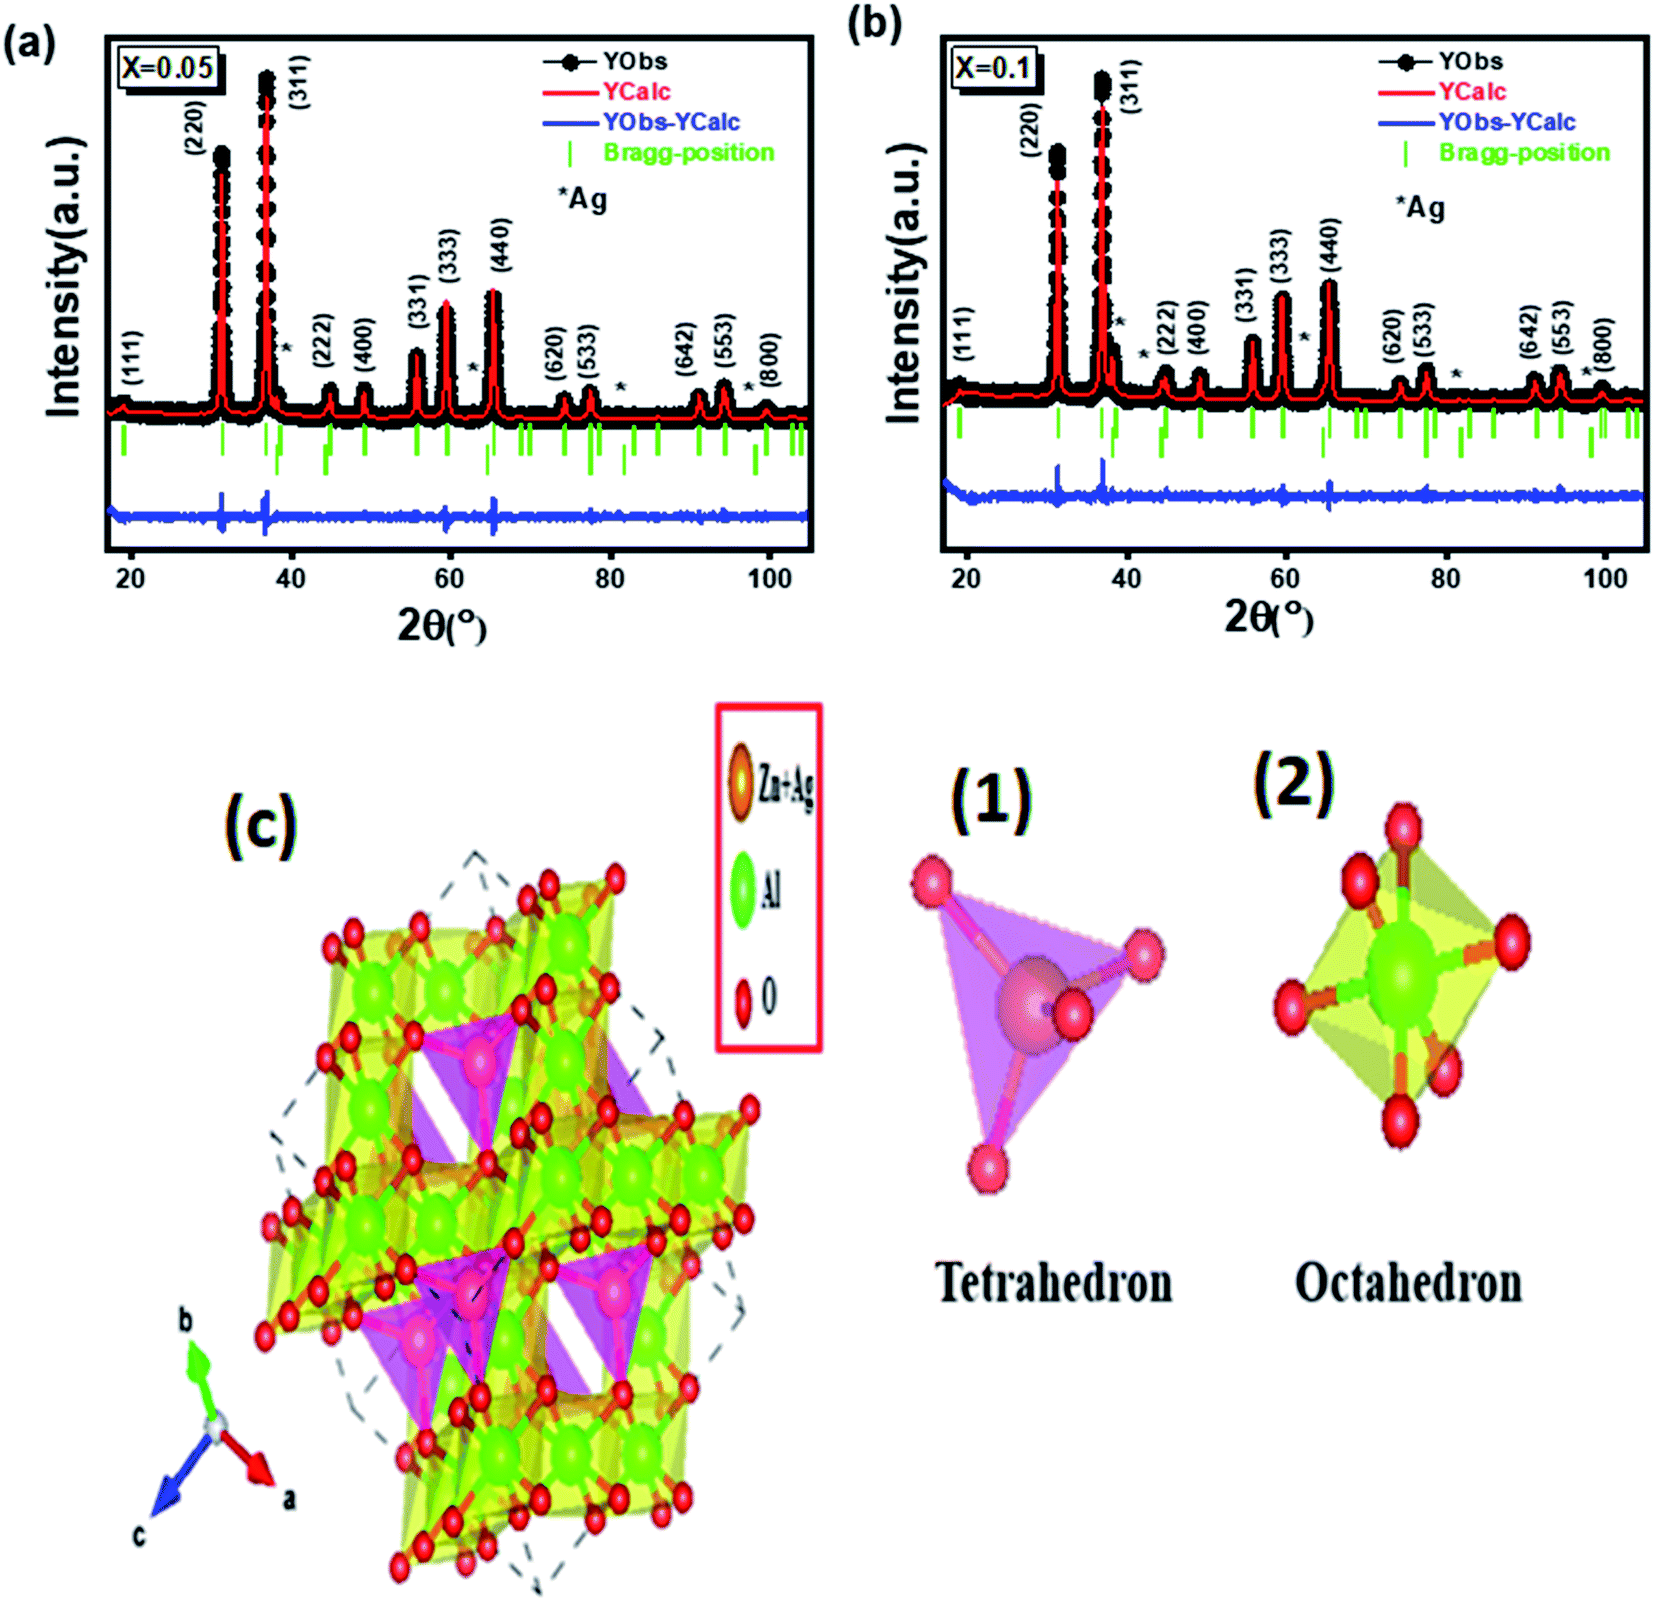 | ||
Fig. 1 Refined diffractograms of  (x = 0.05 (a) and x = 0.1 (b)). (c) Crystal structure of (x = 0.05 (a) and x = 0.1 (b)). (c) Crystal structure of  (x = 0.05) nanoparticles. (x = 0.05) nanoparticles. | ||
Fig. 1(c): showing the structure of these AB2O4 spinel structures. (1) tetrahedral gap site A(Zn + Ag): 64 per unit cell, 8 occupied) and (2) octahedral gap site B(Al): 32 per unit cell, 16 occupied). The values of the refinement parameters such as “goodness of fit” (χ2), the R-value of the profile (Rp), the R-value of the weighted profile (Rwp), the lattice constant parameter (a), and the volume of the cell (V) for all samples were calculated. The structural parameters obtained from the refinement of the profile are listed in Table 1.
 (x = 0.05 and x = 0.1) nanoparticles
|
x = 0.05 | x = 0.1 |
|---|---|---|
| a (Å) | 8.0812 | 8.0786 |
| V (Å3) | 527.7498 | 527.2438 |
| Rp (%) | 29.3 | 35.9 |
| Rwp (%) | 19.4 | 26.7 |
| χ2 | 1.787 | 2.982 |
| aexp (Å) | 8.0812 | 8.0786 |
| LA–A (Å) | 3.4993 | 3.4981 |
| LA–B (Å) | 3.3503 | 3.3492 |
| LB–B (Å) | 2.8571 | 2.8562 |
| DXRD (nm) | 28 | 26 |
| DW–H (nm) | 21 | 20 |
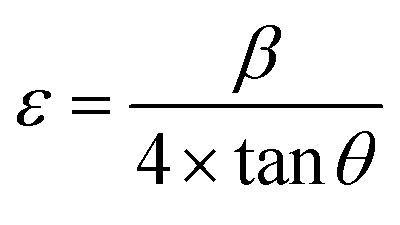
| ε (no unit) | −0.07487 | −0.06522 |
| DSEM (nm) | 30 | 39 |
| dX-ray (g cm−3) | 4.6151 | 4.6195 |
| dexp (g cm−3) | 2.6116 | 2.7255 |
| P (%) | 37.6351 | 37.5993 |
| δ (×10−3 nm−2) | 2.2676 | 2.5 |
| N (nm−2) | 20.8348 | 19.8617 |

Table 1 shows that as the concentration of Ag increases, the network parameters (8.0812 to 8.0786 Å), and the unit cell volume (527.7498 to 527.2438 Å3) decrease. This can be explained by the fact that the ionic radius of Ag+ which is equal to 1.26 Å is greater than that of Zn2+ which is 0.60 Å.41
The calculated values of aexp are shown in Table 1, these values decrease (8.0812 to 8.0786 Å) with silver concentration. This can be logically attributed to the difference between the ionic radius of the Zn2+ and Ag+ ions.42
In addition, link lengths between the spinel structure sites (LA–A, LB–B, and LA–B), crystallite size (D), lattice strain (ε), X-ray density (dX-ray), bulk density (dexp), porosity (P), dislocation density (δ), and unit cell number (N) were extracted from X-ray data and summarized in Table 1.
It is observed that the jump length of the tetrahedral and octahedral sites represented in Table 1, decreases with the addition of Ag+ ions for the two compounds, this decrease in the jump lengths is due to the decrease in the lattice parameter.42
The values obtained suggest that the value of the crystallites (28 to 26 nm) decreases with increasing Ag content. This is due to the lower solubility of Ag ions in these compounds and their low tendency to occupy the spinel structure.43 Crystal deficiency occurs in the spinel network when the Ag ion is incorporated therein due to the greater atomic radius of Ag+ ions relative to Zn2+.
The plot of (βhkl × cos![[thin space (1/6-em)]](https://www.rsc.org/images/entities/char_2009.gif) θ) versus (4sinθ) for the preferred orientation peaks of
θ) versus (4sinθ) for the preferred orientation peaks of  compounds (x = 0.05 and x = 0.1) is shown in Fig. 2.
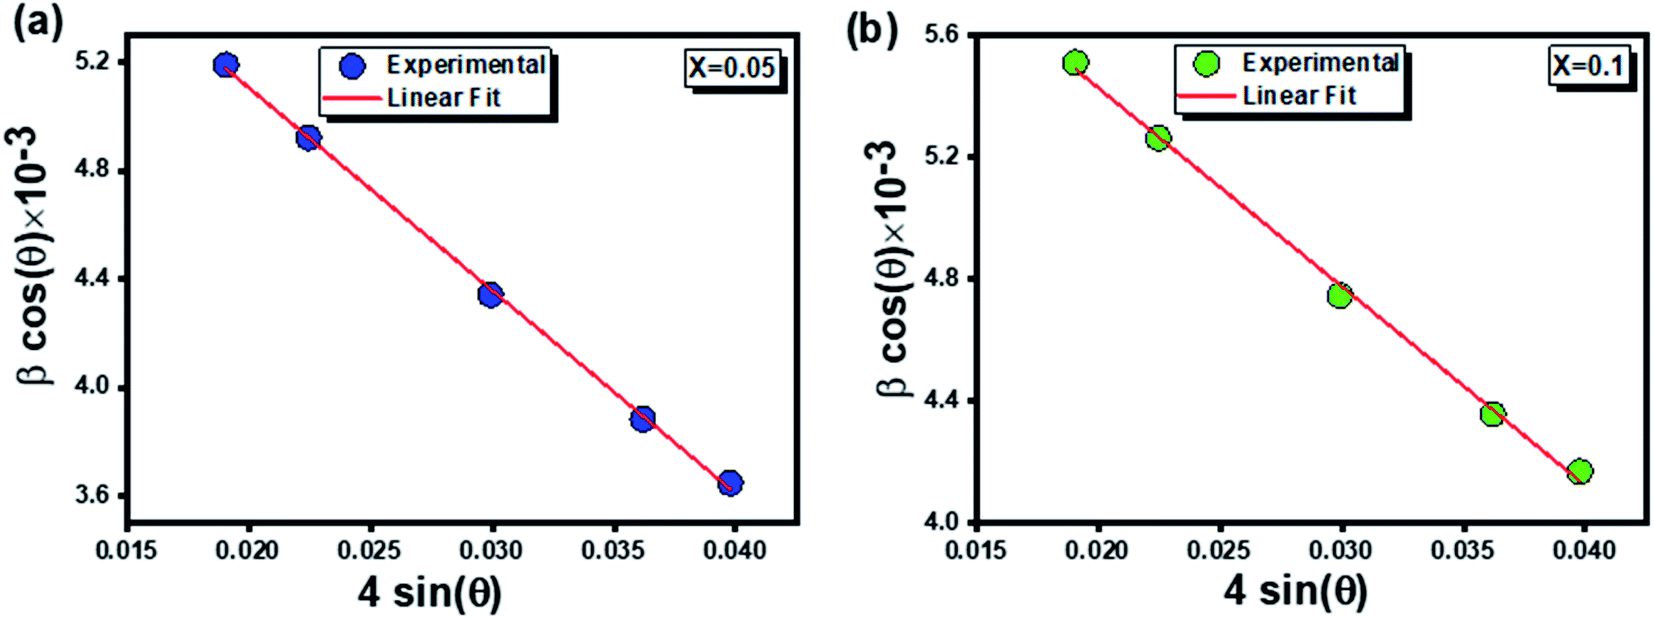 | ||
Fig. 2 The Williamson–Hall plots of  (x = 0.05 (a) and x = 0.1 (b)). (x = 0.05 (a) and x = 0.1 (b)). | ||
The average values of crystallite size (DW–H) and lattice strain (ε) were extracted from the intercept and the slope of the fitted line.
It is clearly remarkable that the crystallite sizes determined by the Debye–Scherrer model were smaller than that calculated by the Williamson–Hall method. This is owing to the broadening effect resulting from the lattice strain which was held in consideration only in the second model.
The data reveal that the X-ray density increases (4.6151 to 4.6195 g cm−3) with increasing Ag content due to the increase in molecular weight.44
The results clarify that the porosity values (37.6351 to 37.5993%) have the opposite density trend for the two compounds. This trend may be due to the creation of more cation vacancies with the reduction of oxygen vacancies which play a predominant role in accelerating densification, i.e. the decrease in oxygen ion diffusion would retard densification.42
The dislocation density (δ) increases by ((2.2676 to 2.5) × 10−3 nm−2) due to Ag doping.
It is worth noting that the concept of porosity (P), as well as the number of cell units (N), proves that the uniform particle size distribution is well agglomerated and almost homogeneous over the entire surface of the samples.32
3.2 Scanning electron microscopy (SEM) studies
The surface morphology of (x = 0.05 and x = 0.1) studied by scanning electron microscopy (SEM) is shown in Fig. 3(a and b). The micrographs obtained show the formation of multigrain agglomerations formed by fine crystallites having random shapes and sizes. Furthermore, these obtained images were carefully processed by the image analysis program (ImageJ) to extract the histograms of the particle size distribution of the two samples shown in Fig. 3(c and d). The determination of the average agglomerate size (DSEM) was therefore worked out, and it was found to be about 30 and 39 nm for x = 0.05 and x = 0.1 respectively. Furthermore, an appropriate dispersive X-ray analysis was carried out to confirm the presence of the chemical elements, present in the
  compounds. In this context, the presence of the elements Zn, Ag, Al, and O in Fig. 4(a and b) shows the substitution of the silver dopant in the nanoparticles.
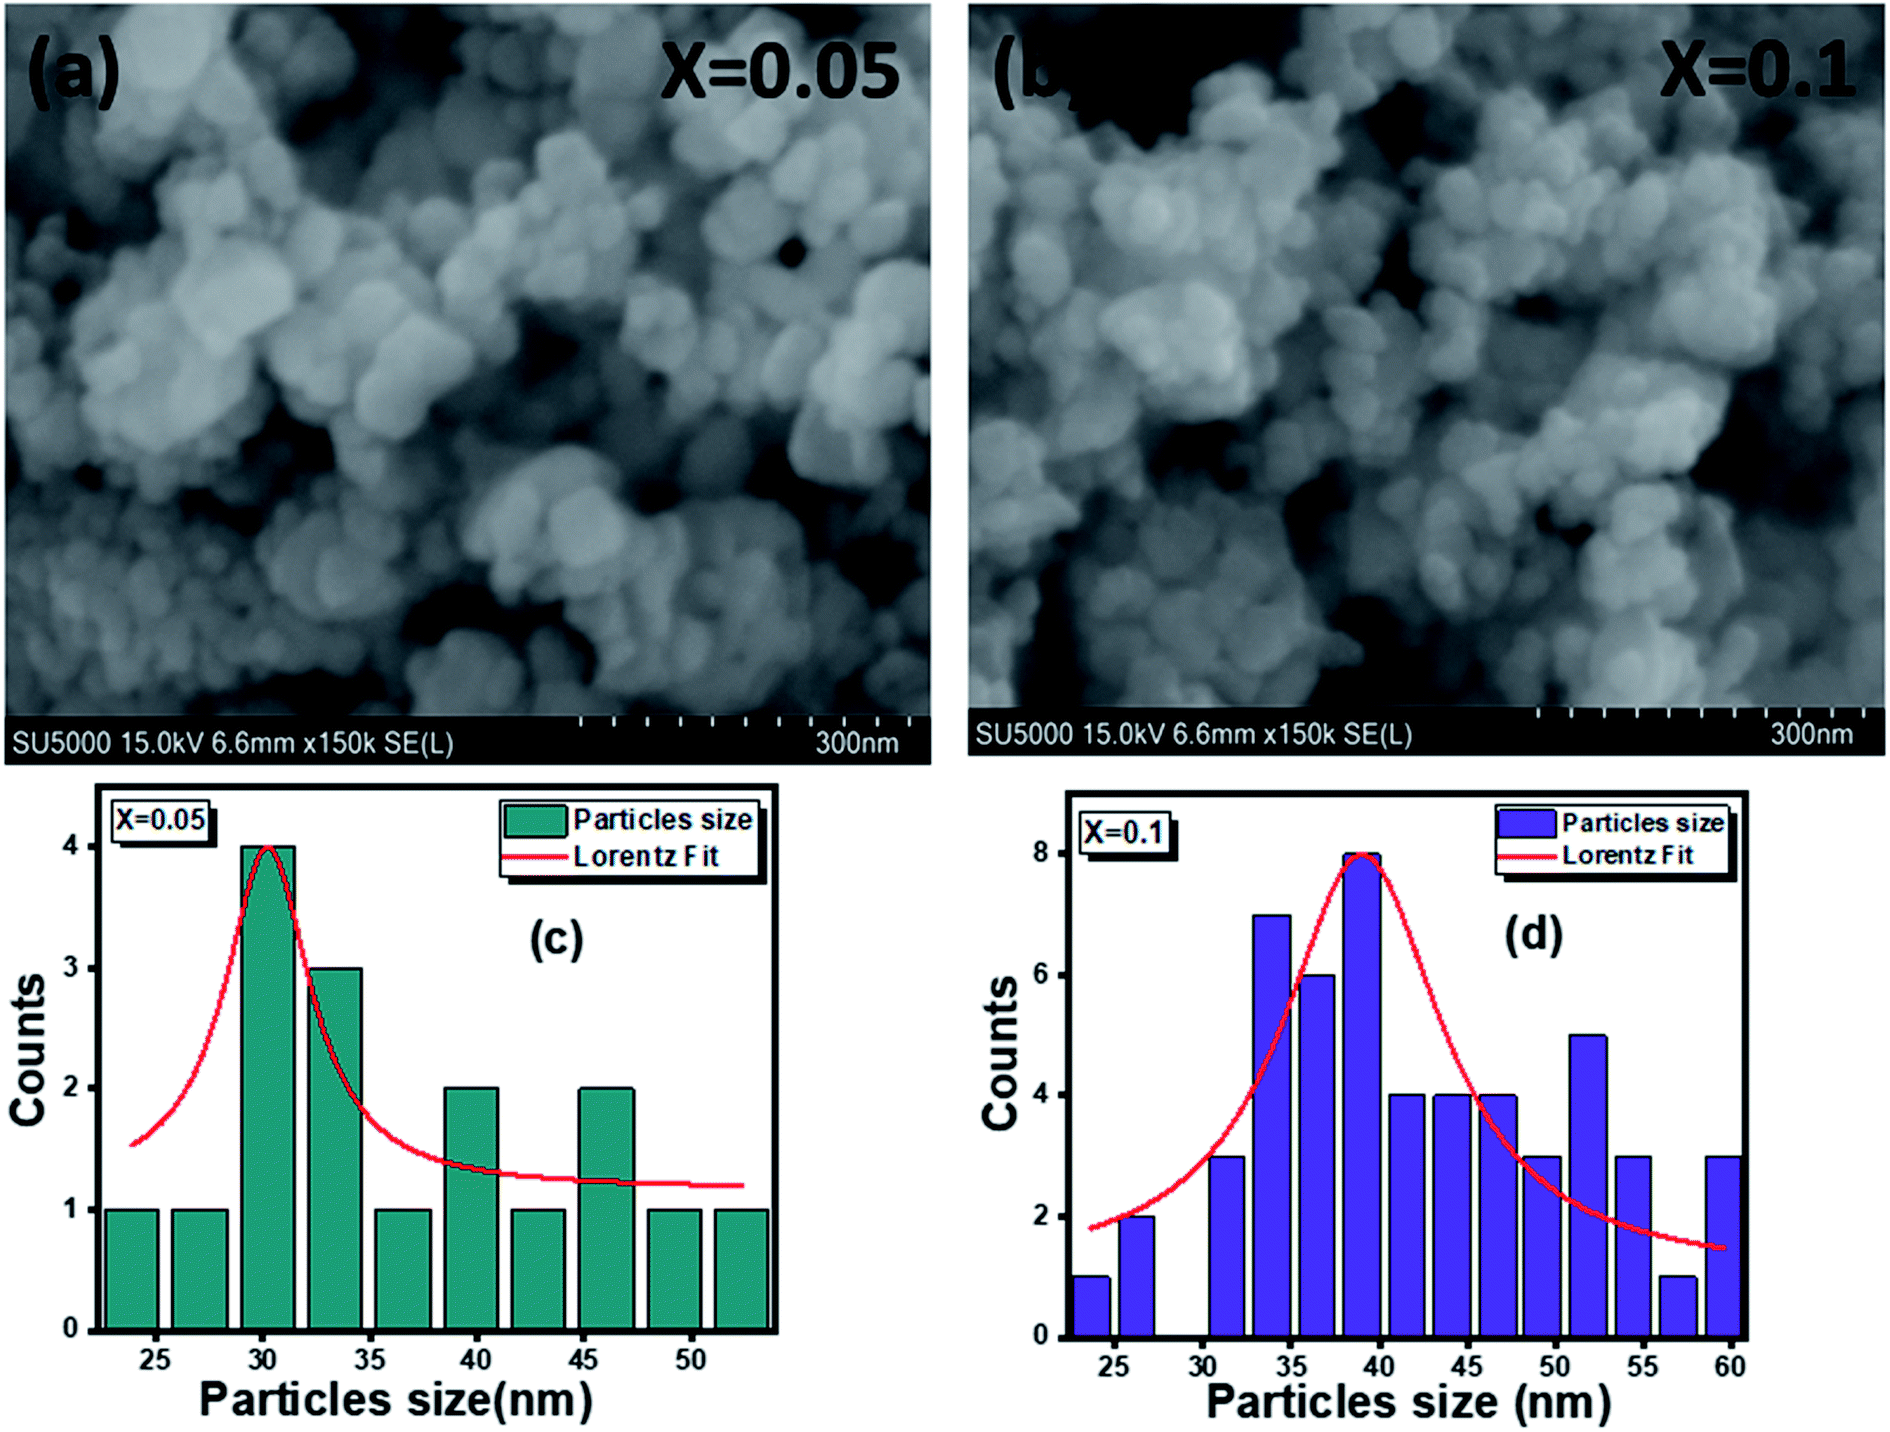 | ||
Fig. 3 Scanning electron microscope images of  (x = 0.05 (a) and x = 0.1 (b)) and grain size histograms of (x = 0.05 (a) and x = 0.1 (b)) and grain size histograms of  (x = 0.05 (c) and x = 0.1 (d)). (x = 0.05 (c) and x = 0.1 (d)). | ||
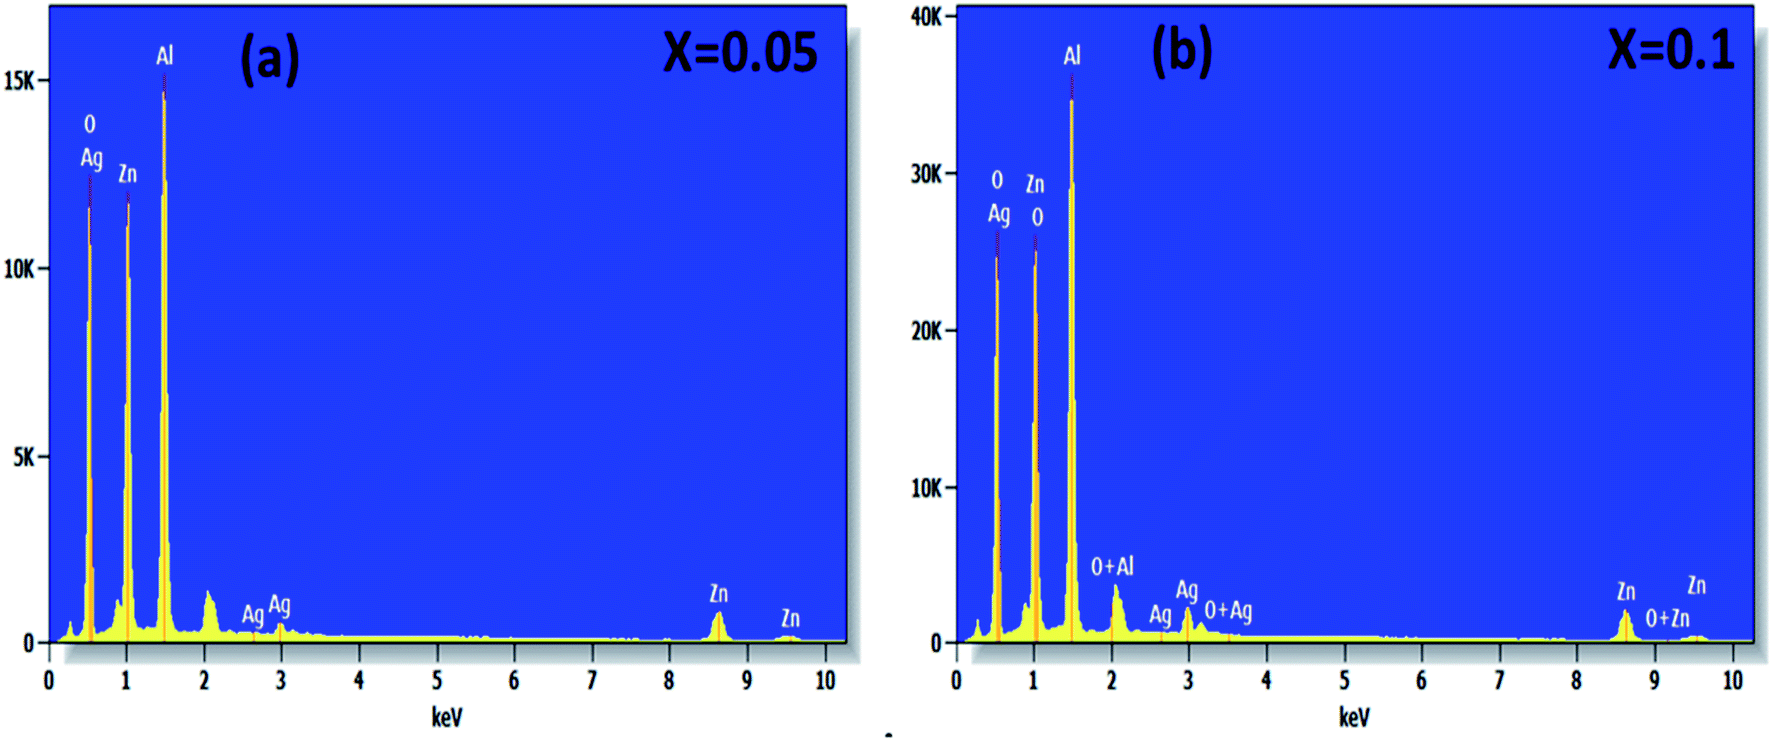 | ||
Fig. 4 EDX spectra of  (x = 0.05 (a) and x = 0.1 (b)) nanoparticles. (x = 0.05 (a) and x = 0.1 (b)) nanoparticles. | ||
3.3 Complex impedance spectroscopy
In order to study the relaxation process of nanomaterials, we measured the real (Z′) and imaginary (Z′′) parts of the complex impedance at several temperatures going from 313 to 653 K in the frequency range from 0.1 Hz to 1 MHz.
 studied for x = 0.05 and x = 0.1. The amplitude of Z′ is typically greater at low frequencies and gradually decreases with increasing frequency for both samples. Indeed, in the high frequency range, the plots show that Z′ reaches a minimum value independent of temperature. This behavior, consistent with the spinel materials one, can be explained by the space charge, which occurs when the potential barrier of the material has been reduced due to the increase in temperature. Hence, a possible improvement in the conductivity of the material with temperature at high frequencies is strongly expected it is consistent with the result of reports in the literature.45,46
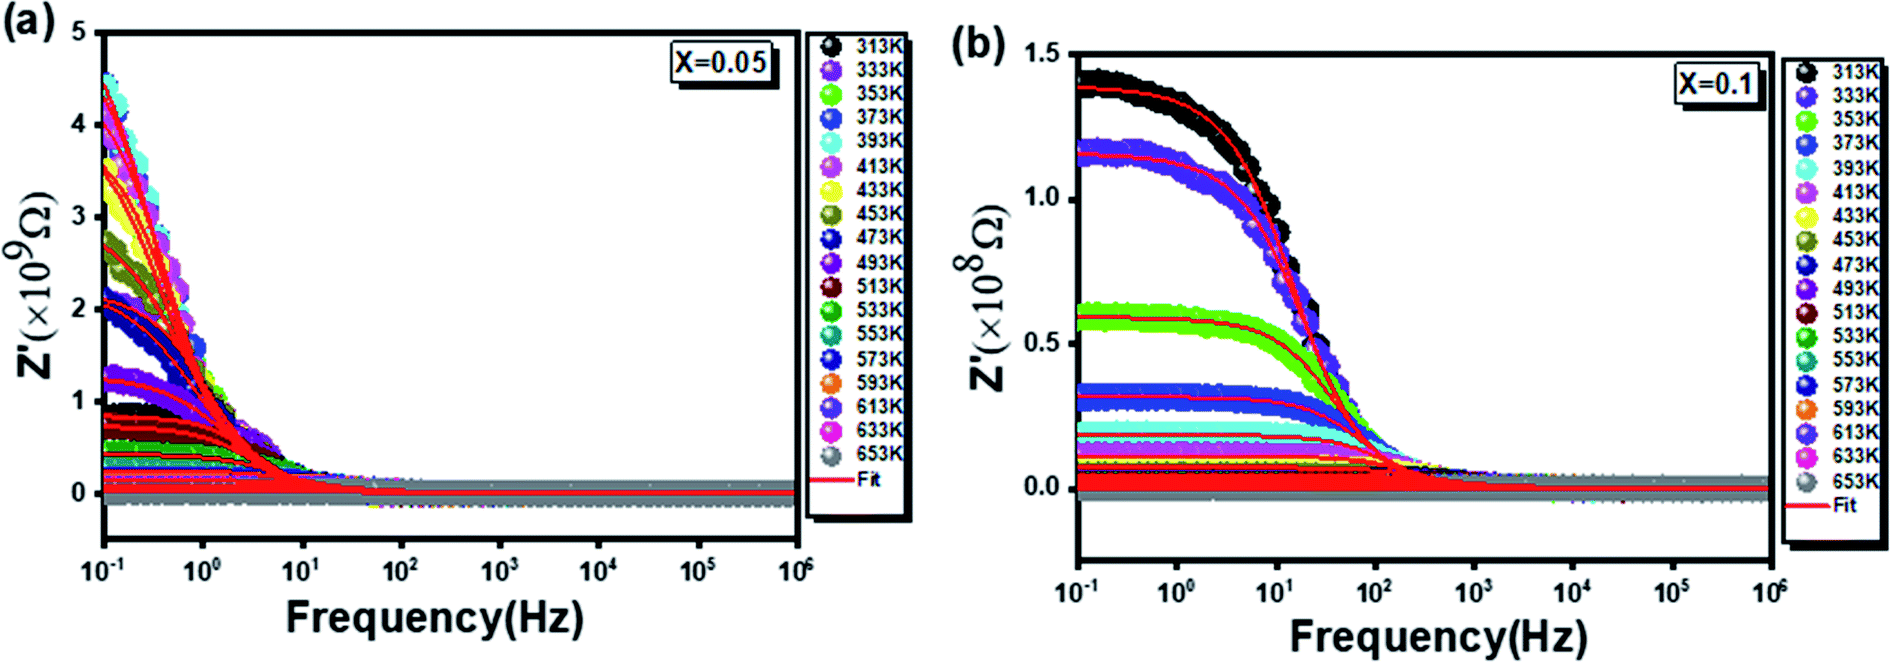 | ||
Fig. 5 Shows the variation of the real part of impedance Z′ with frequency and temperature for compounds  (x = 0.05 (a) and x = 0.1 (b)). (x = 0.05 (a) and x = 0.1 (b)). | ||
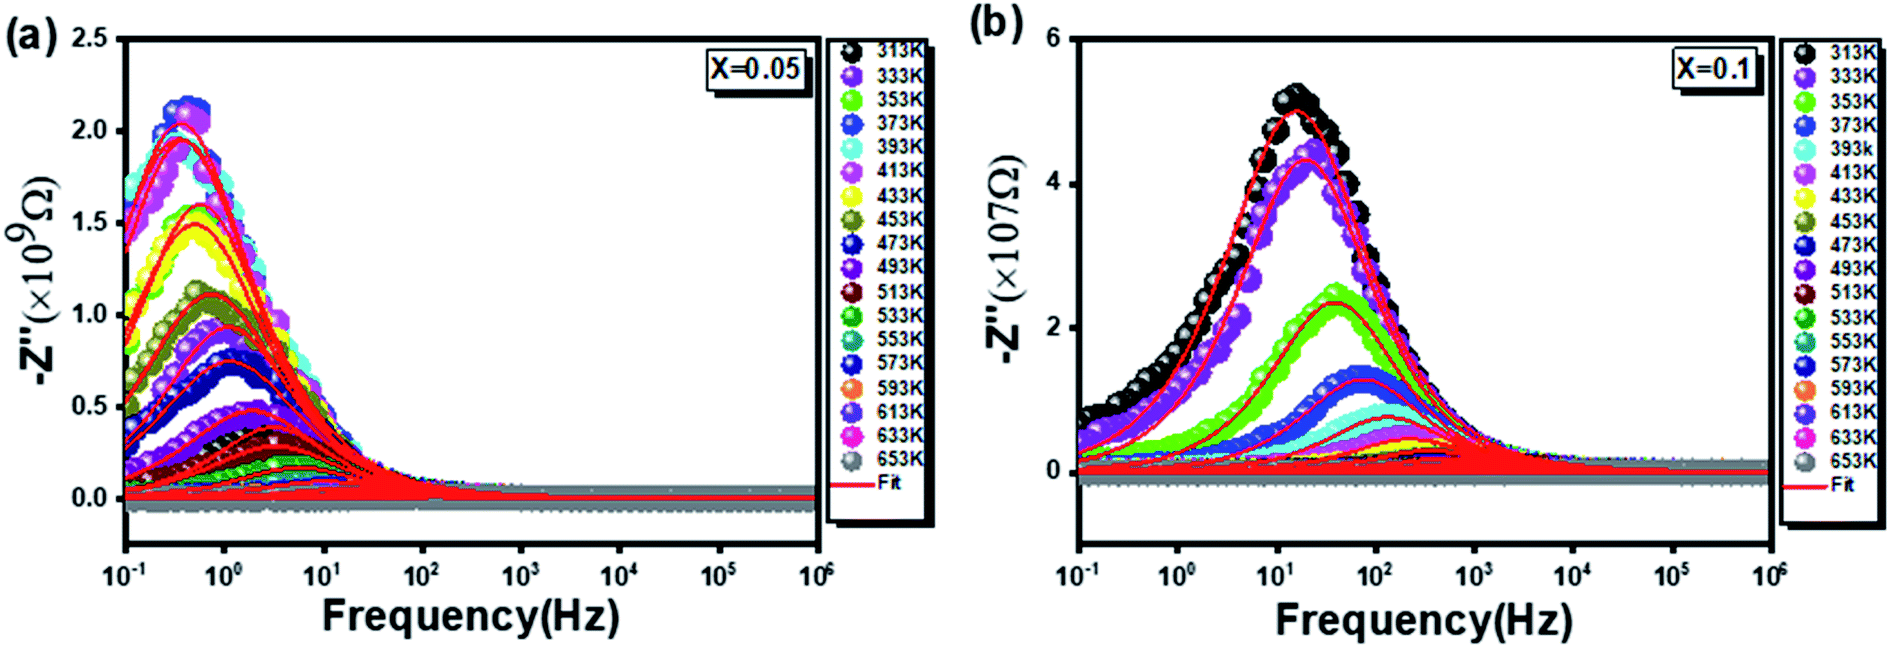 | ||
Fig. 6 Shows the variation of the real part of impedance Z′′ with frequency and temperature for compounds  (x = 0.05 (a) and x = 0.1 (b)). (x = 0.05 (a) and x = 0.1 (b)). | ||
In this respect, a relaxation phenomenon, probably explained by the presence of electrons and/or immobile species at low temperature and defects at high temperature, is well implemented.48 It is worth noting that the increase in temperature is at the origin of a characteristic broadening of the peaks with a slightly asymmetrical shape. Hence, a close relationship between the relaxation phenomenon and the handling temperature is confirmed.49 Furthermore, the increase in the relaxation peaks frequency with increasing temperature proves a non-Debye type of relaxation,50 befittingly described by Arrhenius' law:51
 | (11) |
In this context, from Fig. 7, giving the variation of ln(fmax) compared to (1000/T), the activation energies of the prepared samples are extracted. With values equal to 0.716 eV and 0.395 eV determined, by linear fit, respectively for x = 0.05 and x = 0.1, a decrease in the activation energy is observed by increasing the rate of substitution of silver.
 | ||
Fig. 7 The variation of ln(fmax) with respect to 1000/T for samples  (x = 0.05 (a) and x = 0.1 (b)). (x = 0.05 (a) and x = 0.1 (b)). | ||
 compounds are illustrated in Fig. 8. These plots, known by the Nyquist diagrams, allow to distinguish the contributions of electrodes, grains and grain boundaries.52 It is clearly seen, for the two compounds studied at all temperatures, that each diagram is formed only by a single semi-circle corresponding to the response of the grains. Besides, a thermally activated conduction process is to be reported from the decrease in the diameters of the semi-circles by increasing the temperature.53 In fact, this results in a significant increase in continuous conduction.54
 | ||
Fig. 8 Nyquist plots of  (x = 0.05 (a) and x = 0.1 (b)). (x = 0.05 (a) and x = 0.1 (b)). | ||
To better understand this process, the experimental data of the Nyquist plots were adjusted using Z-view software. Satisfactory adjustments are achieved by means of an equivalent circuit formed by a parallel combination of a grain resistance (Rg) and a fractal capacitance (CPE). The following relation55 gives the CPE impedance (ZCPE):
 | (12) |
In this respect, the good agreement between the theoretical and experimental findings confirms the contribution of the grains and the non-appearance of the effects of the grain boundaries within the inspected samples. The real (Z′) and imaginary (Z′′) complex impedance components of the equivalent circuit are studied on the basis of eqn (13) and (14):56
 | (13) |
 | (14) |
Fig. 5 and 6 represent the frequency dependence of the experimental data of Z′ and Z′′ with their adjustments using eqn (13) and (14). The good agreement between the experimental data (points) and theoretical data (continuous lines) confirms the choice of the electrical circuit.
On the other hand, the variation of grain resistance (Rg) as a function of temperature is conveniently plotted in Fig. 9 for the two rates of substitution of silver (x = 0.05 and x = 0.1). A decrease in Rg values with temperature is noted. This corresponds to a negative temperature coefficient of resistance (NTCR) behavior that may arise from an increased mobility of charge carriers.57 For the compound x = 0.05, a transition towards 393 K is observed (Fig. 9(a)). Contrary to the compound x = 0.1, one notes that Rg decreases with the increase in the temperature on all the range of temperature explored (Fig. 9(b)). Moreover the values for the two formulations are of a different order of magnitude for the two compounds.
 | ||
Fig. 9 Grain resistance diagrams as a function of the temperature of  (x = 0.05 and x = 0.1). (x = 0.05 and x = 0.1). | ||
Furthermore, the determination of the activation energies of our compounds was carried out on the basis of Arrhenius' law. Fig. 10(a and b) which illustrate the variations of [ln(1/Rg)] as a function of [1000/T] respectively for x = 0.05 and x = 0.1. Activation energy values equal to 0.706 eV for x = 0.05 and 0.390 eV for x = 0.1 were extracted from the previously mentioned plots.
 | ||
| Fig. 10 The variation of ln(1/Rg) as a function of 1000/T from the data of the equivalent circuit for x = 0.05 (a) and x = 0.1 (b). | ||
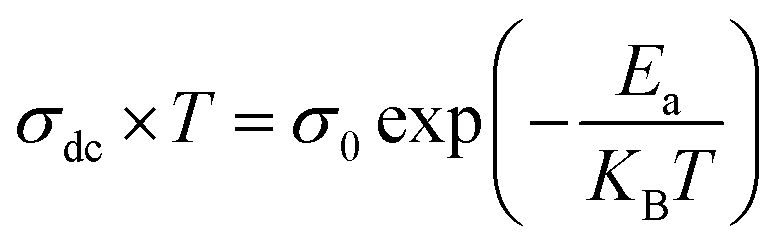
3.3.4.1 Ac conductivity. As shown in Fig. 11(a and b), ac-conductivity (σac) was measured for the two compounds over a wide temperature range (313 K to 653 K) at different frequencies (0.1 Hz to 1 MHz). All samples show a trend for semiconductor materials with an increase in conductivity with temperature. It is worth noting, for low frequencies, that all conductivity spectra plotted for different temperatures, are frequency-independent. However, at high frequencies, an increase in ac-conductivity (σac) with frequency is clearly observed for all temperature values. This arises from a relaxation of the ionic atmosphere resulting from the movement of particles.58 This behavior conforms to Jonscher's universal power law expressed as follows:59
| σac = σdc + Aωs | (15) |
 | ||
Fig. 11 Variation of the conductivity σac as a function of the frequency at different temperatures of the nanoparticles of  (x = 0.05 (a) and x = 0.1 (b)). (c) and (d) Typical example (conductivity vs. frequency at (613 K) for x = 0.05 and 0.1 adjusted using the power-law universal of Jonscher. (x = 0.05 (a) and x = 0.1 (b)). (c) and (d) Typical example (conductivity vs. frequency at (613 K) for x = 0.05 and 0.1 adjusted using the power-law universal of Jonscher. | ||
In the same context, a confirmation of this deduction was mentioned based on Fig. 11(c and d), obtained by fitting the experimental data of σac(f) according to the previous equation (eqn (15)).
On the other hand, to specify the conduction process or processes which appear in the compounds studied (for x = 0.05 and x = 0.1), the plotting of the variation of the exponent (s) as a function of the temperature, carried out in Fig. 12, proves to be essential. In this regard, it has been proven, for x = 0.05, the presence of two conduction processes namely the NSPT and the CBH respectively for low and high temperatures. Whereas for x = 0.1, only the CBH process is observed. This allows to affirm that the increase in the rate of substitution of silver leads to the homogeneity and uniformity of the conduction process.
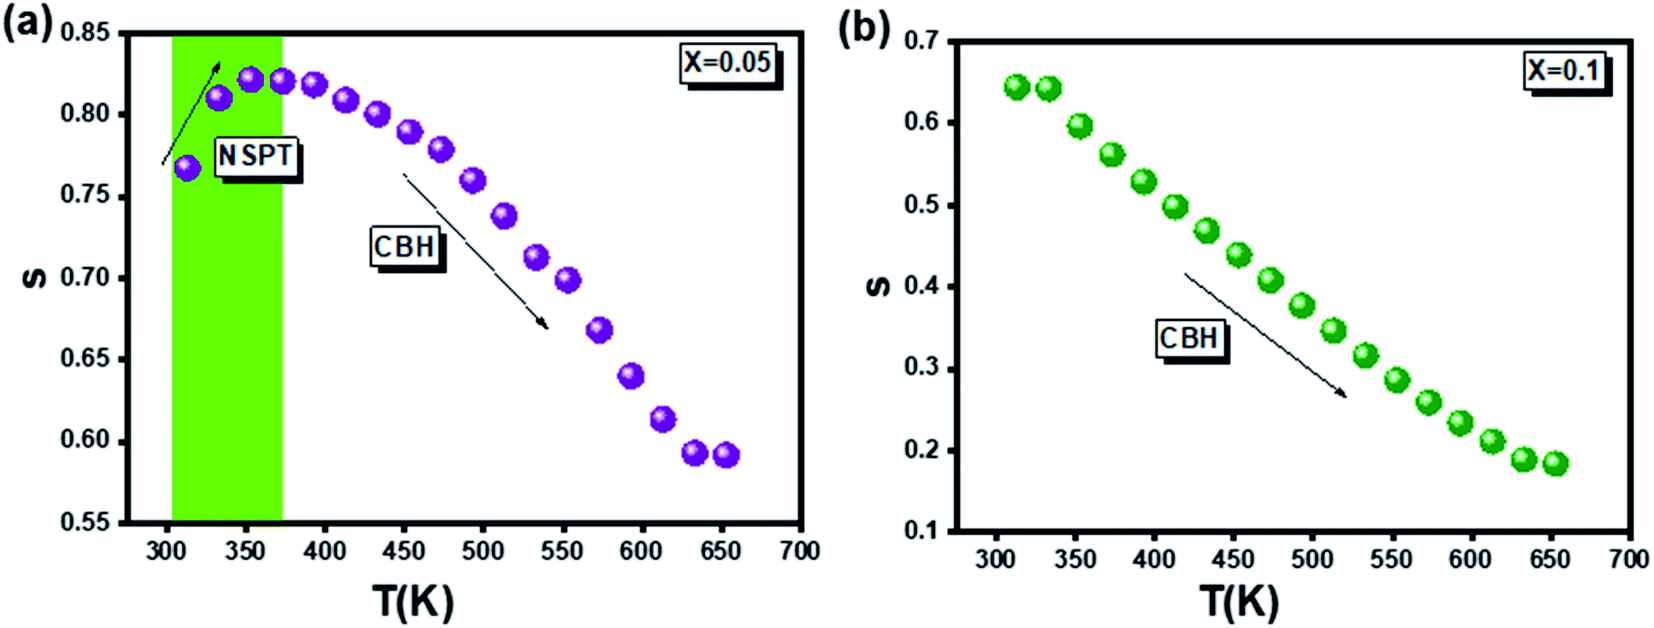 | ||
Fig. 12 Temperature dependence of the exponent s for the samples  (x = 0.05 (a) and x = 0.1 (b)). (x = 0.05 (a) and x = 0.1 (b)). | ||
3.3.4.2 Dc conductivity. The temperature dependence of the continuous conductivity (σdc) of the studied samples (for x = 0.05 and x = 0.1) is shown in Fig. 13. The plots obtained confirm the behavior of semiconductors mentioned in the previous section. An increase in continuous conductivity has been noted whether by increasing the temperature or by increasing the rate of Ag. The increase in σdc with the amount of Ag can be attributed to the good conductivity of this metal which ensures the improved grain connectivity. This effect leads to the reduction of the barriers encountered by the carriers and the diffusion of electrons.60 Additionally, Fig. 14 representing the variations of σdc × T with temperature for the two samples studied shows a partial linear response due to a thermally activated transport. The small polaron jump (SPH) model fits well to data in high temperature regions, described by the following mathematical relation:15
 | (16) |
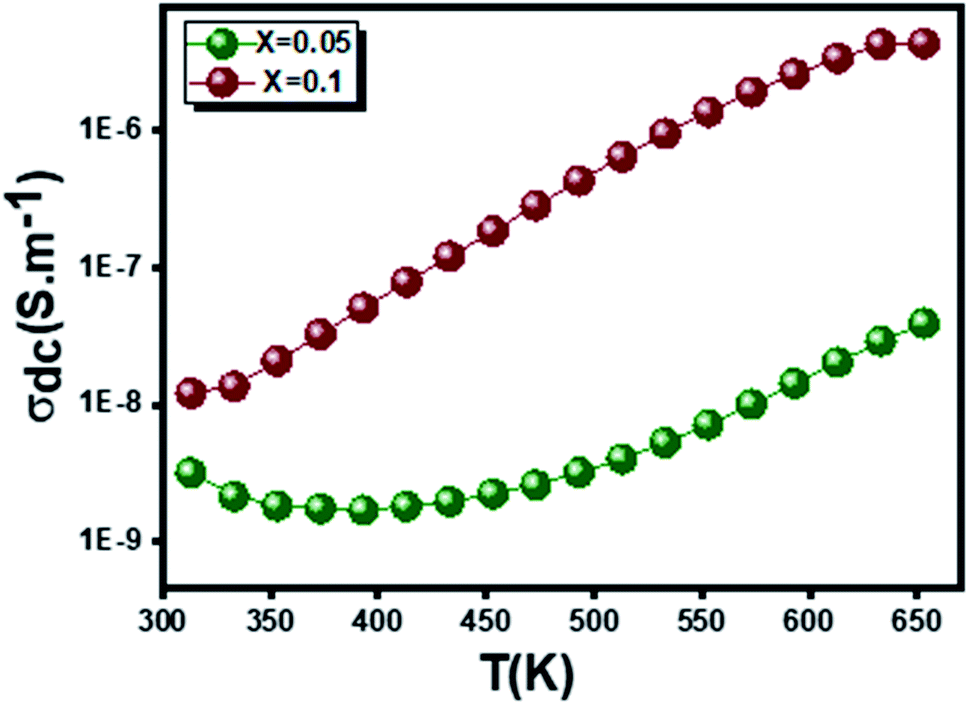 | ||
Fig. 13 The temperature dependence of the conductivity continues σdc in the  (x = 0.05 and x = 0.1) samples. (x = 0.05 and x = 0.1) samples. | ||
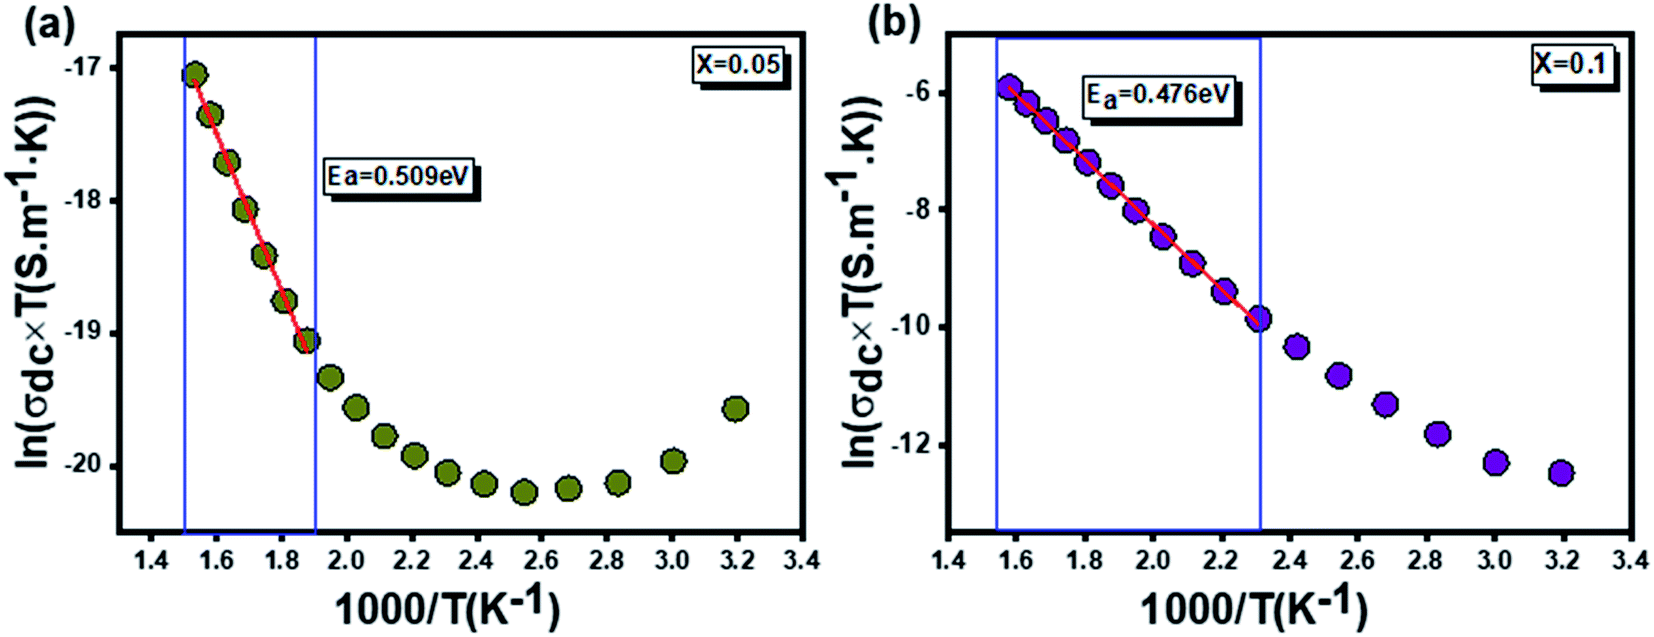 | ||
Fig. 14 Variation of Ln (σdc × T) vs. (1000/T) for  (x = 0.05 (a) and x = 0.1 (b)). (x = 0.05 (a) and x = 0.1 (b)). | ||
An adequate fit of the linear part of each curve gives the energy values d following activation: 0.509 eV for x = 0.05 (Fig. 14(a)) and 0.470 eV for x = 0.1 (Fig. 14(b)).
In the literature, various experimental instigations confirm that the substitution by silver element affects the physical properties of the materials.19–21 Accordingly, it is found that the presence of silver permits the activation of tunneling conduction processes. In addition, it was confirmed by Moualhi et al. that the presence of silver leads to the coexistence of multiple conduction mechanisms in the same material.19–21 In the present work, it was confirmed that increasing the rate of silver element enhance the quality of surface of the studied system, which induces the diminution of the number of the resistive barriers. This implies the diminution of the activation energy value by increasing the rate of the silver element.
On the other hand and based on the variable range hopping (VRH) model61 best fits the data in the low temperature region, written by the following equation:
 | (17) |
To fit the linear part of the curves in Fig. 15 giving the variation of ln(σdc) as a function of T−1/4, the Mott temperature (T0) was extracted. In this regard, T0 values of 0.3828 × 10⁸ K and 4.2368 × 10⁸ K were determined for x = 0.05 and x = 0.1, respectively.
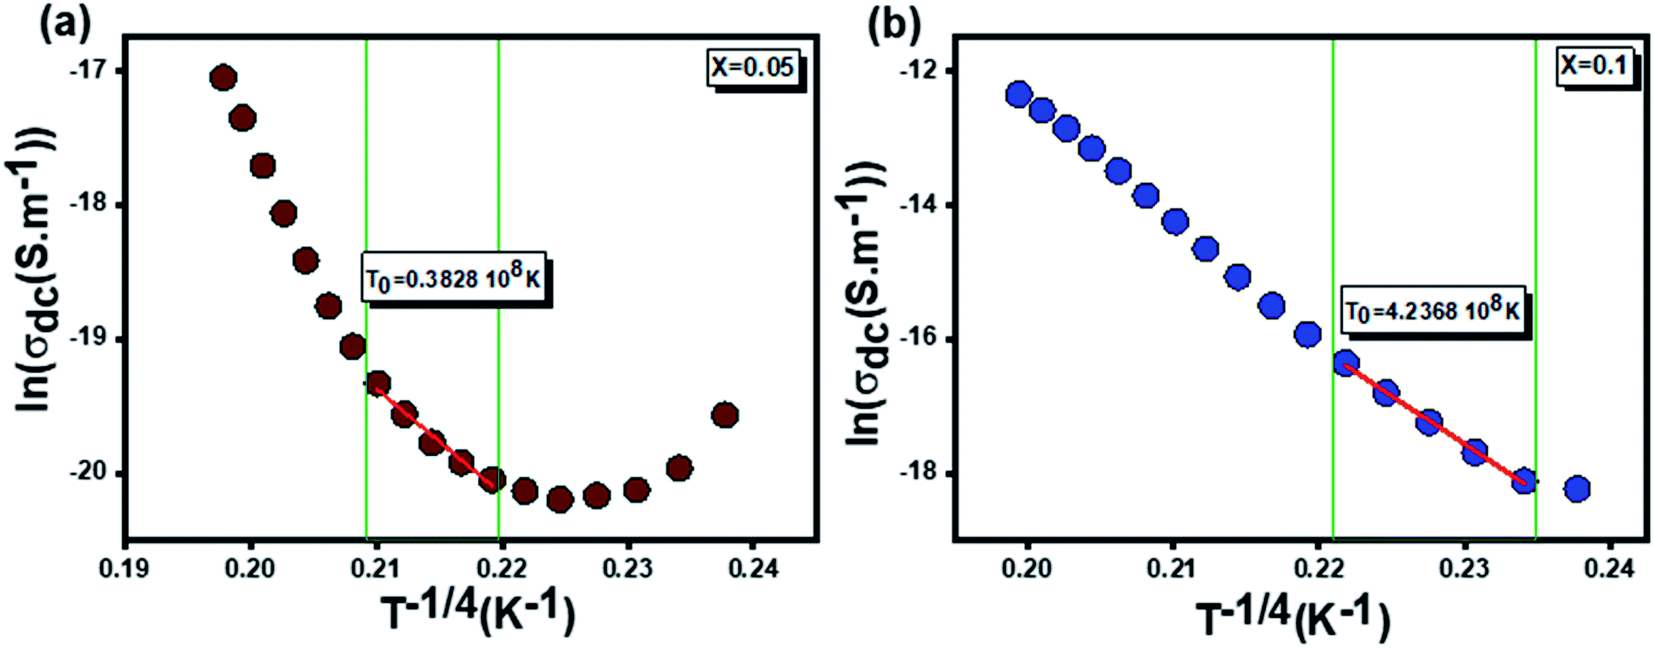 | ||
Fig. 15 Variation of Ln (σdc) vs. (T−1/4) for  (x = 0.05 (a) and x = 0.1 (b)). (x = 0.05 (a) and x = 0.1 (b)). | ||
Moreover, when T0 is a characteristic temperature coefficient which measures the degree of disorder, then it is suitably given by the following relation:47
 | (18) |
With calculated values of N(EF) equal to 0.8577 × 10²⁰ eV−1 cm−1 for x = 0.05 and 0.0775 × 10²⁰ eV−1 cm−1 for x = 0.1, we can confirm a decrease in the density of states located at the Fermi level by increasing the rate of substitution. This is in good agreement with the variation in grain activation energy shown in Fig. 10.
In the same context, the temperature dependence of the jump energy W(T) is given by the following equation:62
 | (19) |
Besides, the jump distance R(T) is defined as follows:63
 | (20) |
At T = 313 K, the respective calculated values of W and R corresponding to x = 0.05 are 0.1261 eV and 1.5 × 10⁻³ Å and those corresponding to x = 0.1 are 0.2299 eV and 2.75 × 10⁻³ Å.
Finally, it is worth noting that the conduction mechanism of our samples is governed by the VRH model in the low-temperature region and the SPH model in the high-temperature region.
According to Mott theory and basing on the conducted experimental results by Moualhi et al., the electrical conductivity of the oxides materials, at low temperatures, was explained by the activation of the variable range hopping process.64,65 In such case, the conduction process thermally inactivated. By increasing the temperature, a small polaron will formed, leading to the activation of the small polaron hopping mechanism. The aforementioned model was recently proposed to investigate the electrical response of manganite and ferrite oxides.64–67 In addition, both SPH and VRH models were used to investigate the electrical response of thin film materials.68,69
4. Conclusion
In summary, we have studied the structural and electrical properties of cubic spinel compounds prepared by self-combustion sol–gel route for nanoparticles forx = 0.05 and x = 0.1. Both compounds crystallize in the cubic structure of the Fdm space group with a nanometric grain size and exhibit a minority phase of Ag, according to XRD measurements. Then, EDX analysis confirmed the purity of the samples. The electrical properties of these materials have been studied in the frequency domain (0.1 Hz to 1 MHz) as well as the thermal domain (313 K to 653 K). The increase in the relaxation peak in the (Z′′) spectra with increasing temperature for the two compounds studied confirmed Arrhenius' law. In addition, electrical conductivity measurements follow Jonscher's law. The variation of the exponent (s) as a function of temperature proves that the models non-overlapping small polaron tunneling (NSPT) and correlated barrier jump (CBH) are associated with conduction mechanisms for x = 0.05, while the appropriate model is used for x = 0.1 is (CBH). The activation energy was calculated using the alternating current conduction dc, and the imaginary part of the impedance (Z′′). In this context, the activation energies extracted demonstrate a transformation of the electrical behavior as a function of the substitution process, which is confirmed by a decrease in the resistance of the material.
Conflicts of interest
There are no conflicts to declare.References
- A. K. Nikumbh and P. V. Adhyapak, Powder Technol., 2010, 202, 14–23 CrossRef CAS.
- I. C. Nlebedim, J. E. Snyder, A. J. Moses and D. C. Jiles, J. Magn. Magn. Mater., 2010, 322, 3938–3942 CrossRef CAS.
- Z. Zhu, Q. Zhao, X. Li, H. Li, M. Tade and S. Liu, Catal. Sci. Technol., 2013, 3, 788–796 RSC.
- M. Zawadzki and J. Wrzyszcz, Mater. Res. Bull., 2000, 35, 109–114 CrossRef CAS.
- K. Kumar, K. Ramamoorthy, P. M. Koinkar, R. Chandramohan and K. Sankaranarayanan, J. Nanopart. Res., 2007, 9, 331–335 CrossRef CAS.
- S. Mathur, M. Veith, M. Haas, H. Shen, N. Lecerf, V. Huch, S. Hüfner, R. Haberkorn, H. P. Beck and M. Jilavi, J. Am. Ceram. Soc., 2001, 84, 1921–1928 CrossRef CAS.
- N. J. van der Laag, M. D. Snel, P. C. M. M. Magusin and G. de With, J. Eur. Ceram. Soc., 2004, 24, 2417–2424 CrossRef CAS.
- O. Padmaraj, M. Venkateswarlu and N. Satyanarayana, Ceram. Int., 2015, 41, 3178–3185 CrossRef CAS.
- N. Pathak, P. S. Ghosh, S. Saxena, D. Dutta, A. K. Yadav, D. Bhattacharyya, S. N. Jha and R. M. Kadam, Inorg. Chem., 2018, 57, 3963–3982 CrossRef CAS PubMed.
- M. Mathew, C. Sudha Kartha and K. P. Vijayakumar, J. Mater. Sci.: Mater. Electron., 2009, 20, 294–298 CrossRef CAS.
- P. Lin, S. Lin, S. Cheng, J. Ma, Y. Lai, H. Zhou and H. Jia, Adv. Mater. Sci. Eng., 2014, 2014, 3 Search PubMed.
- N. D. Sankır, E. Aydın and M. Sankır, Int. J. Electrochem. Sci., 2014, 9, 3864–3875 Search PubMed.
- L.-Y. Lin, J.-L. Yu, S.-Y. Cheng and P.-M. Lu, Chin. Phys. B, 2015, 24, 078103 CrossRef.
- X. Yin, X. Liu, Y. Yan and Q. Chen, J. Sol-Gel Sci. Technol., 2014, 70, 361–365 CrossRef CAS.
- H. Rahmouni, M. Smari, B. Cherif, E. Dhahri and K. Khirouni, Dalton Trans., 2015, 44, 10457–10466 RSC.
- R. Kamila and B. Kurniawan, in IOP Conference Series: Materials Science and Engineering, IOP Publishing, 2019, vol. 496, p. 012019 Search PubMed.
- A. D. Ballarini, S. A. Bocanegra, A. A. Castro, S. R. De Miguel and O. A. Scelza, Catal. Lett., 2009, 129, 293–302 CrossRef CAS.
- T. Sirikajorn, O. Mekasuwandumrong, P. Praserthdam, J. G. Goodwin and J. Panpranot, Catal. Lett., 2008, 126, 313–318 CrossRef CAS.
- Y. Moualhi, H. Rahmouni, M. Gassoumi and K. Khirouni, Ceram. Int., 2020, 46, 24710–24717 CrossRef CAS.
- Y. Moualhi, H. Rahmouni and K. Khirouni, Phys. B, 2021, 616, 413129 CrossRef CAS.
- Y. Moualhi, M. Smari, H. Rahmouni, K. Khirouni and E. Dhahri, J. Alloys Compd., 2022, 898, 162866 CrossRef CAS.
- M. Smari, H. Rahmouni, N. Elghoul, I. Walha, E. Dhahri and K. Khirouni, RSC Adv., 2015, 5, 2177–2184 RSC.
- D. Zheng, J. Cao, P. Wang, J. Zhao, Y. Zhao, T. Zhang and C. Li, Environ. Technol., 2021, 42, 4528–4538 CrossRef CAS PubMed.
- C. O'Rourke and B. J. Morgan, Phys. Rev. Mater., 2018, 2, 045403 CrossRef.
- R. Djenadic, M. Botros and H. Hahn, Solid State Ionics, 2016, 287, 71–76 CrossRef CAS.
- E. S. Blaakmeer, F. Rosciano and E. R. van Eck, J. Phys. Chem. C, 2015, 119, 7565–7577 CrossRef CAS.
- M. J. Mees, G. Pourtois, F. Rosciano, B. Put, P. M. Vereecken and A. Stesmans, Phys. Chem. Chem. Phys., 2014, 16, 5399–5406 RSC.
- F. Rosciano, P. P. Pescarmona, K. Houthoofd, A. Persoons, P. Bottke and M. Wilkening, Phys. Chem. Chem. Phys., 2013, 15, 6107–6112 RSC.
- I. Ali, M. U. Islam, M. S. Awan, M. Ahmad, M. N. Ashiq and S. Naseem, J. Alloys Compd., 2013, 550, 564–572 CrossRef CAS.
- L. Ai and J. Jiang, Curr. Appl. Phys., 2010, 10, 284–288 CrossRef.
- J. Massoudi, D. Bouekkeze, A. Bougoffa, K. Khirouni, E. Dhahri and L. Bessais, Adv. Powder Technol., 2020, 31, 4714–4730 CrossRef CAS.
- A. Hadded, J. Massoudi, E. Dhahri, K. Khirouni and B. F. O. Costa, RSC Adv., 2020, 10, 42542–42556 RSC.
- Y. Benrighi, N. Nasrallah, T. Chaabane, V. Sivasankar, A. Darchen and O. Baaloudj, Opt. Mater., 2021, 115, 111035 CrossRef CAS.
- R. Abaira, T. Dammak, A. Matoussi and A. Younes, Superlattices Microstruct., 2016, 91, 365–374 CrossRef CAS.
- S. Nasrin, S. M. Hoque, F. U. Z. Chowdhury and M. M. Hossen, IOSR J. Appl. Phys., 2014, 6, 58–65 CrossRef.
- A. V. Humbe, A. C. Nawle, A. B. Shinde and K. M. Jadhav, J. Alloys Compd., 2017, 691, 343–354 CrossRef CAS.
- S. G. Kakade, R. C. Kambale, C. V. Ramanna and Y. D. Kolekar, RSC Adv., 2016, 6, 33308–33317 RSC.
- L. Aswaghosh, D. Manoharan and N. V. Jaya, Phys. Chem. Chem. Phys., 2016, 18, 5995–6004 RSC.
- Q. Dai, Z. Zhang, T. Zhan, Z.-T. Hu and J. Chen, ACS Omega, 2018, 3, 6506–6512 CrossRef CAS PubMed.
- H. M. Rietveld, J. Appl. Crystallogr., 1969, 2, 65–71 CrossRef CAS.
- S. Dabagh and G. Dini, J. Supercond. Novel Magn., 2019, 32, 3865–3872 CrossRef CAS.
- N. Okasha, J. Mater. Sci., 2008, 43, 4192–4197 CrossRef CAS.
- K. L. Routray, S. Saha and D. Behera, J. Electron. Mater., 2020, 49, 7244–7258 CrossRef.
- M. A. Ahmed, S. I. El-Dek, I. M. El-Kashef and N. Helmy, Solid State Sci., 2011, 13, 1176–1179 CrossRef CAS.
- Y. Moualhi, R. M’nassri, M. M. Nofal, H. Rahmouni, A. Selmi, M. Gassoumi, N. Chniba-Boudjada, K. Khirouni and A. Cheikrouhou, Eur. Phys. J. Plus, 2020, 135, 1–23 CrossRef.
- A. Omri, E. Dhahri, B. F. O. Costa and M. A. Valente, J. Magn. Magn. Mater., 2020, 499, 166243 CrossRef CAS.
- H. Chouaibi, J. Khelifi, A. Benali, E. Dhahri, M. A. Valente and A. koumina, J. Alloys Compd., 2020, 839, 155601 CrossRef CAS.
- A. Benali, M. Bejar, E. Dhahri, M. F. P. Graça and L. C. Costa, J. Alloys Compd., 2015, 653, 506–512 CrossRef CAS.
- A. Omri, E. Dhahri, B. F. O. Costa and M. A. Valente, J. Magn. Magn. Mater., 2020, 499, 166243 CrossRef CAS.
- S. E. Kossi, F. I. H. Rhouma, J. Dhahri and K. Khirouni, Phys. B, 2014, 440, 118–123 CrossRef.
- Z. Raddaoui, R. Lahouli, S. El Kossi, J. Dhahri, H. Belmabrouk and A. Bajahzar, J. Mater. Sci.: Mater. Electron., 2020, 31, 4836–4849 CrossRef CAS.
- H. Nyquist, Bell Syst. Tech. J., 1932, 11, 126–147 CrossRef.
- H. Felhi, R. Lahouli, M. Smari, H. Rahmouni, K. Khirouni and E. Dhahri, J. Mol. Struct., 2019, 1179, 1–10 CrossRef CAS.
- A. Shukla, R. N. P. Choudhary and A. K. Thakur, J. Phys. Chem. Solids, 2009, 70, 1401–1407 CrossRef CAS.
- F. B. Abdallah, A. Benali, M. Triki, E. Dhahri, M. P. F. Graca and M. A. Valente, Superlattices Microstruct., 2018, 117, 260–270 CrossRef CAS.
- A. Oueslati and A. Aydi, J. Adv. Dielectr., 2021, 11, 2150013 CrossRef CAS.
- A. Benali, M. Bejar, E. Dhahri, M. F. P. Graça and L. C. Costa, J. Alloys Compd., 2015, 653, 506–512 CrossRef CAS.
- C. Bharti and T. P. Sinha, Phys. B, 2011, 406, 1827–1832 CrossRef CAS.
- A. Bougoffa, J. Massoudi, M. Smari, E. Dhahri, K. Khirouni and L. Bessais, J. Mater. Sci.: Mater. Electron., 2019, 30, 21018–21031 CrossRef CAS.
- N. Panwar, D. K. Pandya and S. K. Agarwal, J. Phys.: Condens. Matter, 2007, 19, 456224 CrossRef.
- Y. Moualhi, H. Rahmouni and K. Khirouni, Results Phys., 2020, 19, 103570 CrossRef.
- A. Dhahri, A. Bougoffa, A. Zaouali, A. Benali, M. P. F. Graça, M. A. Valente, B. F. O. Costa, N. Abdelmoula and J. F. Mariano, Eur. Phys. J. Plus, 2021, 136, 829 CrossRef CAS.
- N. F. Mott and E. A. Davis, Electronic Processes in Non-Crystalline Materials, Oxford University Press, 2012 Search PubMed.
- S. Ayachi, Y. Moualhi, H. Rahmouni, M. Gassoumi and K. Khirouni, Phys. B, 2020, 591, 412244 CrossRef CAS.
- Y. Moualhi, R. M'nassri, H. Rahmouni, M. Gassoumi and K. Khirouni, RSC Adv., 2020, 10, 33868–33878 RSC.
- Y. Moualhi, A. Mleiki, H. Rahmouni and K. Khirouni, Eur. Phys. J. Plus, 2022, 137, 1–15 CrossRef.
- Y. Moualhi, M. M. Nofal, R. M’nassri, H. Rahmouni, A. Selmi, M. Gassoumi, K. Khirouni and A. Cheikrouhou, Ceram. Int., 2020, 46, 1601–1608 CrossRef CAS.
- B. Tiss, Y. Moualhi, N. Bouguila, M. Kraini, S. Alaya, C. Croitoru, I. Ghiuta, D. Cristea, D. Patroi and C. Moura, Coatings, 2021, 11, 370 CrossRef CAS.
- B. Tiss, Y. Moualhi, N. Bouguila, M. Erouel, M. Kraini, S. Alaya, S. Aouida, C. Vázquez-Vázquez, C. Moura and L. Cunha, J. Mater. Sci.: Mater. Electron., 2021, 32, 4568–4580 CrossRef CAS.
| This journal is © The Royal Society of Chemistry 2022 |