 Open Access Article
Smartphone-based surface plasmon resonance sensing platform for rapid detection of bacteria†
Junlin Wen *a,
Yufan Zhua,
Jianbo Liua and
Daigui He*b
aSchool of Environmental Science and Engineering, Guangdong University of Technology, Guangzhou 510006, P. R. China. E-mail: jlwen@gdut.edu.cn
bCollege of Artificial Intelligence, Guangdong Mechanical & Electrical Polytechnic, Guangzhou 510550, P. R. China. E-mail: hedaigui@gdmec.edu.cn; Fax: +86-20-36552429; Tel: +86-20-36552429
First published on 29th April 2022
Abstract
Bacterial infection poses severe threats to public health, and early rapid detection of the pathogen is critical for controlling bacterial infectious diseases. Current methods are commonly labor intensive, time consuming or dependent on lab-based equipment. In this study, we proposed a novel and practical method for bacterial detection based on smartphones using the surface plasmon resonance (SPR) phenomena of gold nanoparticles (AuNPs). The proposed smartphone-based SPR sensing method is achieved by utilizing color development that arises from the change in interparticle distance of AuNPs induced by bacterial lysate. The pictures of bacteria/AuNPs color development were captured, and their color signals were acquired through a commercial smartphone. The proposed method has a detection range between 2.44 × 10⁵ and 1.25 × 10⁸ cfu mL−1 and a detection limit of 8.81 × 10⁴ cfu mL−1. Furthermore, this method has acceptable recoveries (between 85.7% and 95.4%) when measuring spiked real waters. Combining smartphone-based signal reading with AuNP-dependent color development also offers the following advantages: easy-to-use, real-time detection, free of complex equipment and low cost. In view of these features, this sensing platform would have widespread applications in the fields of medical, food, and environmental sciences.
1. Introduction
The outbreak of pathogenic bacteria or other microbes not only contaminates food and the environment but also increases the probability of diseases in humans.1,2 According to WHO reports, bacterial infections affect approximately 10 million people, representing an increase of 32% per year,3,4 and cause approximately one-fifth of all annual deaths worldwide.5,6 Early rapid measurement of bacterial pathogens is the key guarantee to successfully control bacterial infectious diseases.Several assay methods have been developed to measure bacterial concentrations. Traditional methods, including plate counting and polymerase chain reaction, are the most commonly used tools but require several hours to days to obtain results.7,8 Enzyme-linked immunosorbent assays are frequently criticized for their dependence on tedious washing steps and false positive results.9–11 Electrochemical methods have high accuracy but rely heavily on non-commercial electrodes that require labor-intensive modifications.12,13 Fluorescent assays are commonly dependent on expensive specialized equipment, such as fluorescence spectrophotometers, laser scanning confocal microscopes, or flow cytometers.14–16 Therefore, there is an urgent need to develop a rapid, simple and low-cost method for bacterial detection.
Colorimetric assays based on gold nanoparticles (AuNPs) have widespread applications in environmental monitoring, food safety, medical diagnostics, and antibioterrorism because of their fast response, easy readout, and cost efficiency.17–19 These AuNP-based colorimetric assays are achieved by utilizing the color change (from red to blue) arising from interparticle surface plasmon coupling induced by the reduced distance of AuNPs.20,21 This instance-dependent color change has been exploited as an analytical signal to detect various analytes, including metal ions, proteins, DNA, and cancer cells.22–25 However, these methods rely on laboratory equipment, such as ultraviolet-visible spectrophotometers or microplate readers, to record the end-point signal. This has impeded their widespread applications in point-of-care (POC) detection of bacteria in resource-limited primary level units, especially in remote rural areas. Consequently, it is desirable to establish an equipment-free and AuNP-based method for POC bacterial detection.
Smartphones, which are equipped with a convenient operating system, internal data storage, and high-resolution cameras, are popularizing worldwide and are ready-to-use platforms to develop instrument-free POC systems.26–28 In this study, we proposed a novel and practical method to measure bacteria based on smartphone and surface plasmon resonance (SPR) of AuNPs. This method utilizes AuNPs SPR to recognize bacteria, in which the AuNPs develop different levels of color change due to their reduced interparticle distances induced by the bacterial lysates and sodium chloride. A commercial smartphone was used to capture the pictures of the color-developed AuNP/bacteria mixture and to read their color signal (RGB value). Based on these data, a regression model was established to describe the relationship between the color signal and bacterial concentration and to evaluate the bacterial concentration of water samples.
2. Results and discussion
2.1 Principle of the proposed method
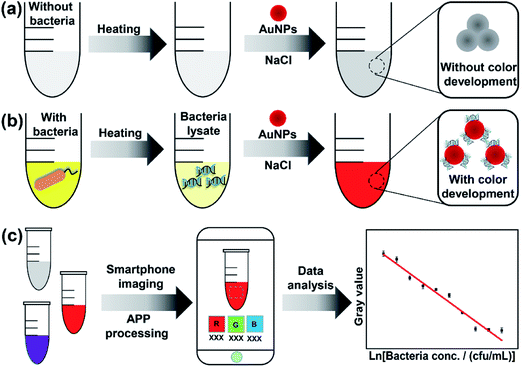
The proposed method is based on smartphone imaging and bacteria/AuNP color development, the principle of which is illustrated in Scheme 1. As shown, sodium chloride can induce the aggregation of AuNPs and results in a color change from wine-red to gray (Scheme 1a). However, in the presence of bacterial lysate, the AuNPs colloid remains characteristic wine-red (without color change) because the bacterial lysate can protect AuNPs from sodium chloride-induced aggregation (Scheme 1b). This color development was recorded with a commercial smartphone before the color signal (RGB value) was analyzed using a smartphone app (Scheme 1c). Then, the obtained RGB values were transformed into gray signals. Based on these data, a regression model is proposed to describe the relationship between the responsive color signal and bacterial concentration and to determine the bacterial concentration of samples.2.2 Method feasibility evaluation
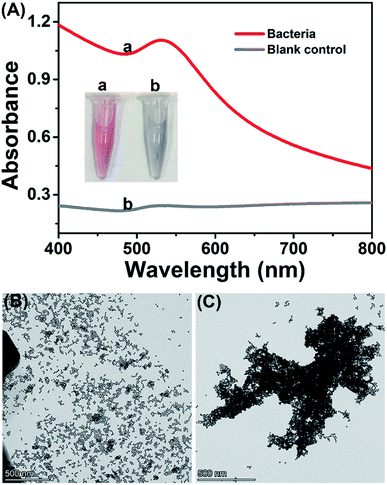
The feasibility of the proposed method was investigated with bacteria/AuNP color development. The synthesized AuNPs are wine-red and have strong absorbance at the wavelength of 519 nm (Fig. S1†), of which the concentration is calculated as 1.7 nmol L−1. As shown in Fig. 1A, the AuNP colloid that reacted with bacteria remained wine-red (inset picture, tube a), while the colloid that reacted with the blank control (ultrapure water) changed from wine-red to gray (inset picture, tube b). In the UV-Vis spectrogram, the AuNPs/bacteria mixture has strong absorbance at 530 nm, which was considered as the SPR absorbance of dispersed AuNPs.29,30 The red-shift of absorbance peak could be attributed to the decreased interparticle distance and the increased particle size of AuNPs caused by the binding of bacterial lysate on AuNPs, which resulted in the change of absorption frequency of the surface plasmon band of AuNPs. In contrast, there was only weak absorbance at 530 nm in the blank control and almost no obvious absorbance in the bacterial suspension (Fig. S2†). In TEM assay, the bacterial sample observed dispersed AuNPs while the blank control displayed significantly aggregated AuNPs. These results suggested the feasibility of the proposed method.2.3 Optimization of assay conditions
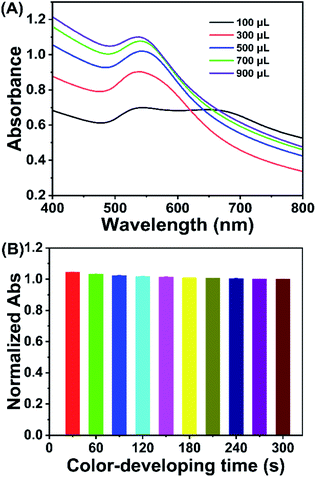
The proposed method is based on bacteria/AuNP color development, the performance of which could be affected by the bacteria/AuNP ratio, sodium chloride concentration, and color development time. To obtain an excellent assay performance, these factors were optimized by using 1.0 × 10⁹ cfu mL−1 E. coli as a model analyte.The bacteria/AuNPs ratio was investigated as it could affect the assay performance. Serial volumes of bacterial suspension (1.0 × 10⁹ cfu mL−1) were incubated with 700 μL of AuNPs to perform color development. As shown in Fig. 2A, the responsive signal (absorbance value at 530 nm) steps up gradually as the bacterial amount increases from 100 μL to 700 μL, after which the signal increases slowly. Therefore, the optimized ratio of bacteria/AuNPs was set at 700 μL/700 μL, where the final concentrations of bacteria and AuNPs were 5.0 × 10⁸ cfu mL−1 and 0.85 nmol L−1, respectively.
The concentration of sodium chloride is another factor that could influence the responsive color signal. As displayed in Fig. S3,† the responsive signal decreases gradually as the amount of NaCl solution (1.0 mol L−1) increases from 50 μL to 90 μL. The background signal (blank control) decreases as the NaCl solution is increased from 50 to 70 μL and then remains almost unchanged, indicating that the color development reaches a stable state. To obtain the optimal signal/noise ratio, the amount of NaCl was set at 70 μL (equal to 47.62 mM) for the following assays.
The color-developing time is a factor that could also affect the proposed method. To evaluate the effect of color development time, color development was conducted at 30, 60, 90, 120, 150, 180, 210, 240, 270, and 300 s when 700 μL/700 μL of bacteria/AuNPs and 70 μL of sodium chloride were employed in the assay. As shown in Fig. 2B, the responsive signal decreases gradually when the reaction time increases from 30 s to 180 s and then remains almost stable as the time is prolonged to 300 s. Therefore, the optimized color-developing time was 180 s.
2.4 Colorimetric assay performance
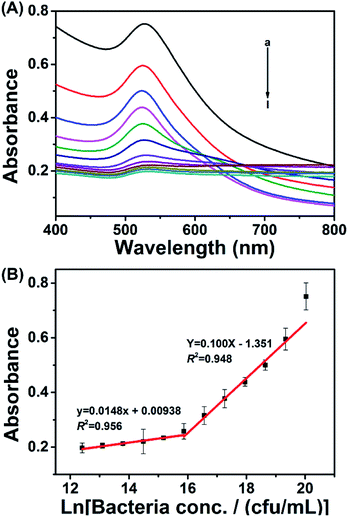
Based on the above optimized working conditions, the colorimetric assay was performed based on spectral analysis. As shown in Fig. 3A, the responsive signal (absorbance at 530 nm) decreased as the bacterial concentration decreased from 5.0 × 10⁸ to 2.4 × 10⁵ cfu mL−1. By plotting the responsive signal against bacterial concentration, there was a linear relationship between 5.0 × 10⁸ and 7.8 × 10⁶ cfu mL−1 and a linear relationship between 7.8 × 10⁶ and 2.4 × 10⁵ cfu mL−1. The linear relationships could be described using the equation Y = 0.100X − 1.351 and equation y = 0.0148x + 0.00938, with coefficients (R2) of 0.948 and 0.956, respectively. Y and y represent the absorbance value 530 nm, while X and x represent the natural logarithm of the bacterial concentration.2.5 Method generality assessment
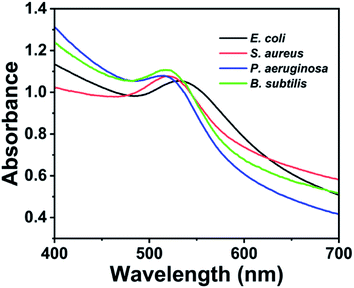
To assess the generality of the proposed detection system, other bacterial strains, including S. aureus, P. aeruginosa and B. subtilis, were detected. These bacteria were prepared at a concentration of 1.0 × 10⁹ cfu mL−1 and measured using the same detection procedure as the model bacteria E. coli. As shown in Fig. 4, the tested S. aureus, P. aeruginosa and B. subtilis have strong absorbance peak at 516–521 nm, which are similar to that of E. coli. This result demonstrated that the proposed method could be generally applied to detect other bacteria.2.6 Smartphone-based SPR sensing
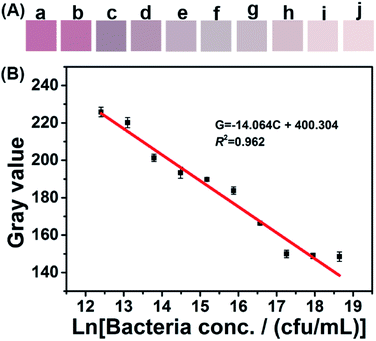
Smartphone-based SPR sensing was established based on the above-mentioned spectral assay. The color-developing step is similar to that of the spectral method. To obtain stable image resolution of the color-developed products, a light box with a size of 11 cm × 11 cm × 13 cm was constructed (Fig. S4†). During the imaging, a XIAOMI 6X smartphone was employed, and the parameters were set at automatic white balance, exposure time 1/263, aperture f/1.75, and focal length 4.07 mm. Fig. 5A shows the color signal obtained by the smartphone app. The detailed RGB value and their correlation with bacterial concentration were displayed in Fig. S5.† Both the color intensity and the RGB value decreased with the bacterial concentration. Based on these RGB data, the gray value was calculated according to the equation: gray value = R × 0.299 + G × 0.587 + B × 0.114.31,32 The calculated gray value was plotted against the natural logarithm of bacterial concentration, and a linear equation, G = −14.046C + 400.304, was demonstrated between 1.25 × 10⁸ and 2.44 × 10⁵ cfu mL−1 (R2 = 0.962), where G is the gray value and C is the natural logarithm of bacterial concentration. The limit of detection (LOD) was calculated as 8.81 × 10⁴ cfu mL−1 according to a signal/noise ratio equal to three.33,34 This LOD is comparable with those of electrochemical methods,35 microarrays and immunoassays.36,37 In addition, the LOD of this method is below the minimum infectious dose of bacteria commonly found in drinking water.38 More importantly, this proposed method requires less detection time and can operate without complex laboratory-based equipment. These advantages make the method suitable for POC detection of bacteria in resource-limited areas.Since the developed sensing device is still the prototype, there are some limitations such as image capturing and RGB data acquiring/calculating for commercial adaptability. In addition, the resolution for samples with close concentration change need to be further improved. Future work will be carried out on the design of a portable light-box for image capturing, and a smartphone APP for automatically and precisely acquire and calculate the RGB data.
2.7 Real sample measurement
The proposed smartphone-based SPR sensing method was challenged with E. coli-spiked real water samples to test its anti-interference capability. Tap water, drinking water, and lake water collected from the university campus were pre-treated by filtration with a 0.22 μm membrane and diluted 10 times with ultrapure water. After spiking with E. coli, the water samples were measured using the proposed sensing method. As summarized in Table S1,† the recovery of tap water is 95.4%, that of drinking water is 85.7%, and that of lake water is 86.2%. The standard deviation of all tested samples is less than 5.0%. The tap water sample has the highest recovery because it has lower ions concentration than that of drinking water and lake water. Drinking water used in assay was a mineral water that usually has high ions concentration, and thus could cause a strong color development and a low recovery. The lake water has abundant organic matters and inorganic ions and therefore has a strong color development and a low recovery. These results suggest that the proposed smartphone-based SPR sensing method has acceptable anti-interference capability and could be applied to measure real water samples.3. Experimental
3.1 Reagents and materials
Chloroauric acid was provided by Sangon Biotech (Shanghai) Co., Ltd. Trisodium citrate was obtained from Sigma-Aldrich Co. LLC. Luria-Bertani (L-B) broth power was purchased from Guangdong Huankai Microbial Sci. & Tech. Co., Ltd. All solutions were prepared using ultrapure water from a Milli-Q water purification system.3.2 Bacterial strain and culture
The bacterium E. coli was obtained in our lab and cultured with L-B broth.39,40 The obtained bacterial culture was washed with ultrapure water by centrifugation at 5000g. The collected bacterial cells were suspended in ultrapure water, and the bacterial concentration was adjusted to 1.0 × 10⁹ cfu mL−1 (an optical density at 600 nm (OD600) approximately equal to 1.0). The bacterial suspension was heated at 100 °C for 30 min and stored at 4 °C prior to use.3.3 Synthesis of AuNPs
The AuNPs were synthesized using citrate reduction according to previous reports.41,42 Briefly, 100 mL of 0.01% chloroauric acid solution was heated to boiling in a 250 mL round-bottomed flask. After adding 4 mL of 1% trisodium citrate, the mixed reactants were boiled for 30 min until the mixture turned wine-red. The prepared AuNP colloid was cooled at room temperature and then stored at 4 °C prior to use.3.4 TEM assay
In TEM imaging assay, the AuNPs reacted with bacterial lysate or ultrapure water were dropped onto a carbon-coated copper grid, and then dried at room temperature. TEM images were taken by using a FEI Talos F200S field emission transmission electron microscope.433.5 UV-Vis assay
In UV-Vis assay, bacterial suspension was first mixed with AuNPs colloid and appropriate amount of sodium chloride for color development. For UV-Vis spectral measurement, the color-developed bacteria/AuNP mixtures were measured using an UV2600 spectrophotometer (Shimadzu) and a 1 cm pathlength cuvette. For the optimization experiments of color-developing time and NaCl concentration, the responsive signal was monitored by determining the absorbance at 530 nm.3.6 Assay procedure
In a typical assay, seven hundred microliters of bacterial suspension were mixed with an equal volume of AuNPs colloid. The mixture was mixed with 70 μL of sodium chloride (1 mol L−1) for color development. For smartphone-based assay, the bacteria/AuNP mixtures were imaged with a XIAOMI 6X smartphone by means of a homemade light box. The captured images were analyzed using an Android application (APP) named CaiYu (Falou Technology) to acquire their R, G and B values. The obtained RGB data were transformed into gray values according to the following equation: gray value = R × 0.299 + G × 0.587 + B × 0.114.31,32 The calculated gray values were plotted against the natural logarithm of bacterial concentration and employed to evaluate the bacterial concentration of tested samples.4. Conclusions
In summary, we have successfully developed a simple and effective bacterial sensing platform based on smartphones and the SPR of AuNPs. The combination of the fast response of AuNP-based color development with the simple signal readout of smartphones offers several advantages: simple operation, real-time detection, equipment-free assay, and POC detection. Given these advantages, this smartphone-based SPR sensing platform would have widespread applications in the fields of medical diagnosis, food safety and environmental monitoring.Conflicts of interest
There are no conflicts to declare.Acknowledgements
This work was supported by the Guangdong Basic and Applied Basic Research Foundation (Grant No. 2021A1515010173) and the One-Hundred Young Talents of the Guangdong University of Technology (Grant No. 1143-220413696).References
- C. Shi, Q. Xu, Y. Ge, L. Jiang and H. Huang, Luciferase-Zinc-Finger System for the Rapid Detection of Pathogenic Bacteria, J. Agric. Food Chem., 2017,(65), 6674–6681 CrossRef CAS PubMed.
- World Health Organization, WHO estimates of the global burden of foodborne diseases: foodborne disease burden epidemiology reference group 2007–2015, https://apps.who.int/iris/bitstream/10665/199350/1/9789241565165_eng.pdf Search PubMed.
- B. Tornimbene, S. Eremin, M. Escher, J. Griskeviciene, S. Manglani and C. L. Pessoa-Silva, WHO Global Antimicrobial Resistance Surveillance System early implementation 2016–17, Lancet Infect. Dis., 2018,(18), 241–242 CrossRef.
- V. Vedarethinam, L. Huang, W. Xu, R. Zhang, D. D. Gurav, X. M. Sun, J. Yang, R. P. Chen and K. Qian, Detection and Inhibition of Bacteria on a Dual-Functional Silver Platform, Small, 2019,(15), 1803051 CrossRef PubMed.
- Y. Furuse, Analysis of research intensity on infectious disease by disease burden reveals which infectious diseases are neglected by researchers, Proc. Natl. Acad. Sci., 2019,(116), 478–483 CrossRef CAS PubMed.
- H. H. Yang, M. S. Xiao, W. Lai, Y. Wan, L. Li and H. Pei, Stochastic DNA Dual-Walkers for Ultrafast Colorimetric Bacteria Detection, Anal. Chem., 2020,(92), 4990–4995 CrossRef CAS PubMed.
- O. R. Miranda, X. N. Li, L. Garcia-Gonzalez, Z. J. Zhu, B. Yan, U. H. F. Bunz and V. M. Rotello, Colorimetric Bacteria Sensing Using a Supramolecular Enzyme-Nanoparticle Biosensor, J. Am. Chem. Soc., 2011,(133), 9650–9653 CrossRef CAS PubMed.
- P. Belgrader, W. Benett, D. Hadley, J. Richards, P. Stratton, R. Mariella and F. Milanovich, Infectious disease – PCR detection of bacteria in seven minutes, Science, 1999,(284), 449–450 CrossRef CAS PubMed.
- S. Lai, S. N. Wang, J. Luo, L. J. Lee, S. T. Yang and M. J. Madou, Design of a compact disk-like microfluidic platform for enzyme-linked immunosorbent assay, Anal. Chem., 2004,(76), 1832–1837 CrossRef CAS PubMed.
- Z. Wu, J. H. Lu, Q. Q. Fu, L. H. Sheng, B. C. Liu, C. Wang, C. Y. Li and T. T. Li, A smartphone-based enzyme-linked immunochromatographic sensor for rapid quantitative detection of carcinoembryonic antigen, Sens. Actuators, B, 2011,(329), 129163 Search PubMed.
- H. Z. Wang, K. J. Wan, Y. Zhou, X. X. He, D. G. He, H. Cheng, J. Huang, R. C. Jia and K. M. Wang, A three-dimensional multipedal DNA walker for the ultrasensitive detection of tumor exosomes, Chem. Commun., 2020,(56), 12949–12952 RSC.
- G. Y. Gao, D. C. Wang, R. Brocenschi, J. F. Zhi and M. V. Mirkin, Toward the Detection and Identification of Single Bacteria by Electrochemical Collision Technique, Anal. Chem., 2018,(90), 12123–12130 CrossRef CAS PubMed.
- J. A. Adkins, K. Boehle, C. Friend, B. Chamberlain, B. Bisha and C. S. Henry, Colorimetric and Electrochemical Bacteria Detection Using Printed Paper- and Transparency-Based Analytic Devices, Anal. Chem., 2017,(89), 3613–3621 CrossRef CAS PubMed.
- Y. Si, C. Grazon, G. Clavier, J. Rieger, Y. Y. Tian, J. F. Audibert, B. Sclavi and R. Meallet-Renault, Fluorescent Copolymers for Bacterial Bioimaging and Viability Detection, ACS Sens., 2020,(5), 2843–2851 CrossRef CAS PubMed.
- A. D. Cabral, N. Rafiei, E. D. de Araujo, T. B. Radu, K. Toutah, D. Nino, B. I. Murcar-Evans, J. N. Milstein, D. Kraskouskaya and P. T. Gunning, Sensitive Detection of Broad-Spectrum Bacteria with Small-Molecule Fluorescent Excimer Chemosensors, ACS Sens., 2020,(5), 2753–2762 CrossRef CAS PubMed.
- M. D. Disney, J. Zheng, T. M. Swager and P. H. Seeberger, Detection of bacteria with carbohydrate-functionalized fluorescent polymers, J. Am. Chem. Soc., 2004,(126), 13343–13346 CrossRef CAS PubMed.
- R. A. Sperling, P. Rivera gil, F. Zhang, M. Zanella and W. J. Parak, Biological applications of gold nanoparticles, Chem. Soc. Rev., 2008,(37), 1896–1908 RSC.
- H. Peng and I. A. Chen, Rapid Colorimetric Detection of Bacterial Species through the Capture of Gold Nanoparticles by Chimeric Phages, ACS Nano, 2019,(13), 1244–1252 CAS.
- H. Jans and Q. Huo, Gold nanoparticle-enabled biological and chemical detection and analysis, Chem. Soc. Rev., 2012,(41), 2849–2866 RSC.
- S. K. Ghosh and T. Pal, Interparticle coupling effect on the surface plasmon resonance of gold nanoparticles: From theory to applications, Chem. Rev., 2007,(107), 4797–4862 CrossRef CAS PubMed.
- K. H. Su, Q. H. Wei, X. Zhang, J. J. Mock, D. R. Smith and S. Schultz, Interparticle coupling effects on plasmon resonances of nanogold particles, Nano Lett., 2003,(3), 1087–1090 CrossRef CAS.
- Y. L. Hung, T. M. Hsiung, Y. Y. Chen, Y. F. Huang and C. C. Huang, Colorimetric Detection of Heavy Metal Ions Using Label-Free Gold Nanoparticles and Alkanethiols, J. Phys. Chem. C, 2010,(114), 16329–16334 CrossRef CAS.
- W. T. Lu, R. Arumugam, D. Senapati, A. K. Singh, T. Arbneshi, S. A. Khan, H. T. Yu and P. C. Ray, Multifunctional Oval-Shaped Gold-Nanoparticle-Based Selective Detection of Breast Cancer Cells Using Simple Colorimetric and Highly Sensitive Two-Photon Scattering Assay, ACS Nano, 2010,(4), 1739–1749 CrossRef CAS PubMed.
- R. Elghanian, J. J. Storhoff, R. C. Mucic, R. L. Letsinger and C. A. Mirkin, Selective colorimetric detection of polynucleotides based on the distance-dependent optical properties of gold nanoparticles, Science, 1997,(277), 1078–1081 CrossRef CAS PubMed.
- S. Xu, W. Ouyang, P. Xie, Y. Lin, B. Qiu, Z. Lin, G. Chen and L. Guo, Highly Uniform Gold Nanobipyramids for Ultrasensitive Colorimetric Detection of Influenza Virus, Anal. Chem., 2017,(89), 1617–1623 CrossRef CAS PubMed.
- Y. P. Hsu, N. S. Li, Y. T. Chen, H. H. Pang, K. C. Wei and H. W. Yang, A serological point-of-care test for Zika virus detection and infection surveillance using an enzyme-free vial immunosensor with a smartphone, Biosens. Bioelectron., 2020,(151), 111960 CrossRef CAS PubMed.
- X. F. Jin, C. H. Liu, T. L. Xu, L. Su and X. J. Zhang, Artificial intelligence biosensors: Challenges and prospects, Biosens. Bioelectron., 2020,(165), 112412 CrossRef CAS PubMed.
- X. W. Huang, D. D. Xu, J. Chen, J. X. Liu, Y. B. Li, J. Song, X. Ma and J. H. Guo, Smartphone-based analytical biosensors, Analyst, 2018,(143), 5339–5351 RSC.
- Y. He, F. Y. Tian, J. Zhou, Q. Y. Zhao, R. J. Fu and B. N. Jiao, Colorimetric aptasensor for ochratoxin A detection based on enzyme-induced gold nanoparticle aggregation, J. Hazard. Mater., 2020,(388), 121758 CrossRef CAS PubMed.
- R. Emmanuel, C. Karuppiah, S. M. Chen, S. Palanisamy, S. Padmavathy and P. Prakash, Green synthesis of gold nanoparticles for trace level detection of a hazardous pollutant (nitrobenzene) causing Methemoglobinemia, J. Hazard. Mater., 2014,(279), 117–124 CrossRef CAS PubMed.
- K. Q. Su, Q. C. Zou, J. Zhou, L. Zou, H. B. Li, T. X. Wang, N. Hu and P. Wang, High-sensitive and high-efficient biochemical analysis method using a bionic electronic eye in combination with a smartphone-based colorimetric reader system, Sens. Actuators, B, 2015,(216), 134–140 CrossRef CAS.
- Y. P. Xing, Q. Zhu, X. H. Zhou and P. S. Qi, A dual -functional smartphone-based sensor for colorimetric and chemiluminescent detection: A case study for fluoride concentration mapping, Sens. Actuators, B, 2020,(319), 128254 CrossRef CAS.
- S. S. Zhou, C. Lu, Y. Z. Li, L. Xue, C. Y. Zhao, G. F. Tian, Y. M. Bao, L. H. Tang, J. H. Lin and J. K. Zheng, Gold Nanobones Enhanced Ultrasensitive Surface-Enhanced Raman Scattering Aptasensor for Detecting Escherichia coil O157:H7, ACS Sens., 2020,(5), 588–596 CrossRef CAS PubMed.
- W.-C. Hu, J. Pang, S. Biswas, K. Wang, C. Wang and X.-H. Xia, Ultrasensitive Detection of Bacteria Using a 2D MOF Nanozyme-Amplified Electrochemical Detector, Anal. Chem., 2021,(93), 8544–8552 CrossRef CAS PubMed.
- S. Kuss, R. A. S. Couto, R. M. Evans, H. Lavender, C. C. Tang and R. G. Compton, Versatile Electrochemical Sensing Platform for Bacteria, Anal. Chem., 2019,(91), 4317–4322 CrossRef CAS PubMed.
- W. Chunglok, D. K. Wuragil, S. Oaew, M. Somasundrum and W. Surareungchai, Immunoassay based on carbon nanotubes-enhanced ELISA for Salmonella enterica serovar Typhimurium, Biosens. Bioelectron., 2011,(26), 3584–3589 CrossRef CAS PubMed.
- J. B. Delehanty and F. S. Ligler, A microarray immunoassay for simultaneous detection of proteins and bacteria, Anal. Chem., 2002,(74), 5681–5687 CrossRef CAS.
- J. Huang, J. H. Sun, A. R. Warden and X. T. Ding, Colorimetric and photographic detection of bacteria in drinking water by using 4-mercaptophenylboronic acid functionalized AuNPs, Food Control, 2020,(108), 106885 CrossRef CAS.
- J. L. Wen, D. G. He, Z. Yu and S. G. Zhou, In situ detection of microbial c-type cytochrome based on intrinsic peroxidase-like activity using screen-printed carbon electrode, Biosens. Bioelectron., 2018,(113), 52–57 CrossRef PubMed.
- S. G. Zhou, J. L. Wen, J. H. Chen and Q. Lu, Rapid Measurement of Microbial Extracellular Respiration Ability Using a High-Throughput Colorimetric Assay, Environ. Sci. Technol. Lett., 2015,(2), 26–30 CrossRef.
- H. X. Li and L. Rothberg, Colorimetric detection of DNA sequences based on electrostatic interactions with unmodified gold nanoparticles, Proc. Natl. Acad. Sci., 2004,(101), 14036–14039 CrossRef CAS PubMed.
- J. L. Wen, J. H. Chen, L. Zhuang and S. G. Zhou, Designed diblock hairpin probes for the nonenzymatic and label-free detection of nucleic acid, Biosens. Bioelectron., 2016,(79), 656–660 CrossRef CAS PubMed.
- J. L. Wen, J. B. Liu, J. L. Wu and D. G. He, Rapid measurement of waterborne bacterial viability based on difunctional gold nanoprobe, RSC Adv., 2022,(3), 1675–1681 RSC.
Footnote |
| † Electronic supplementary information (ESI) available. See https://doi.org/10.1039/d2ra01788a |
| This journal is © The Royal Society of Chemistry 2022 |

