 Open Access Article
Degradation of formaldehyde aqueous solution by Bi based catalyst and its activity evaluation
Runquan Wang ab,
Yuerong Zhangab,
Wanping Chenab,
Yuan Tianab,
Kai Songab,
Jiaxian Liab,
Guoying Wangab and
Gaofeng Shi*ab
aSchool of Petrochemical Technology, Lanzhou University of Technology, Lanzhou, 730100, China. E-mail: gaofengshi_lzh@163.com
bKey Laboratory of Low Carbon Energy and Chemical Engineering of Gansu Province, Lanzhou, 730100, China
First published on 29th April 2022
Abstract
Bi based catalysts have attracted continuous attention from the scientific community because of their excellent photochemical properties and wide application in photocatalytic treatment of environmental pollution. A series of Bi based catalysts with good crystallinity and high purity were prepared by calcination and hydrothermal synthesis. In the application of degrading formaldehyde aqueous solution in a mercury lamp and xenon lamp atmosphere, it was found that BiVO4 and Bi2WO6 showed excellent photochemical properties under ultraviolet and visible light. The tests of PL, UV-Vis and EIS confirmed their high activity. In the calculation based on density functional theory (DFT), through the analysis of the energy band structure, density of states (DOS) and partial wave density of states (PDOS), it is found that the d orbital of V and W elements has a great influence on the position and size of the energy band of the catalyst, which makes it have high activity and excellent electrochemical properties.
1. Introduction
Bismuth as a non noble metal, and has a wide range of sources, low price and high electron transfer rate.1,2 It has become an effective alternative metal element for noble metal catalysts.3 Bi based catalysts have many advantages over other metal catalysts.4,5 Firstly, when Bi participates in the formation of oxides, it often exists in the form of Bi3+. Its valence band is not composed of a single atomic orbital, but is formed by the hybridization of the 2p orbital of the O atom and the 6s orbital of the Bi atom.6 The lone pair electron distortion on the 6s orbital of the Bi atom makes the O 2p and Bi 6s orbitals overlap obviously,7,8 which is convenient for charge migration.9 It also changes the original band structure of the compound. At the same time, Bi series photocatalysts have been widely studied because of the special structure of alternating layers and more suitable band edges due to the surface plasmon resonance (SPR)10 effect, and can be used as cocatalysts to promote charge separation and improve the efficiency of photocatalysts.11 For example, Li et al.12 mentioned that Bi modification can improve the conversion efficiency of Co and g-C3N4 catalysts. Therefore, based on the particularity of Bi based photocatalyst materials,13 it is of certain value and significance to study the catalytic activity of bismuth compounds in photocatalysis.14,15Different Bi based metal catalysts, such as Bi2O3, BiVO4, Bi2WO6, BiOI, BiOBr and Bi2S3, were prepared by calcination and hydrothermal synthesis,16 and their structure, morphology and photoelectrochemical properties were analyzed.17 It was applied to the study of photocatalytic degradation of formaldehyde aqueous solution; the mechanism of photocatalytic degradation of formaldehyde aqueous solution18 was analyzed by studying the catalytic activities of different Bi based catalysts in the range of visible light and ultraviolet light.19,20 At the same time, based on the density functional theory (DFT),21,22 the energy band, density of states (DOS) and partial wave density of states (PDOS)23 of the catalyst material are calculated on the platform of Mede A. The catalytic activity of Bi based catalyst is evaluated through theoretical calculation, and the results are mutually verified24 and analyzed with the experimental results.
2. Experimental section
2.1 Materials and reagents
Bismuth nitrate pentahydrate, nitric acid (65–68%, wt), sodium hydroxide, anhydrous ethanol, citric acid, sodium tungstate, ethylene glycol monomethyl ether, potassium iodide, potassium bromide, thioacetamide, formaldehyde aqueous solution (36–38%, wt), potassium bromate, p-benzoquinone, ammonium oxalate, diphenylamine, acetopropione, glacial acetic acid, ammonium acetate. The above drugs are analytical pure.Preparation of Bi2O3: put 5.00 g Bi(NO3)3·5H2O crystal in muffle furnace and calcine at 450 °C for 4 h to obtain pure Bi2O3 crystal.
Preparation of BiVO4 solution A: dissolve 2 mmol of Bi(NO3)3·5H2O crystal in 13% nitric acid solution; liquid B: put 2 mmol Na3VO4·12H2O crystal into 10.00 mL deionized water and stir. Add liquid a to liquid B, adjust the pH of the solution to neutral with (NaOH/HNO3), stir for 30 min, add it to the hydrothermal synthesis kettle lined with polytetrafluoroethylene, and conduct hydrothermal synthesis at 120 °C for 12 h. First wash the synthesized solid with deionized water to neutral, then wash it with water-free ethanol for 3 times, and dry it in an oven at 100 °C for 8 h to obtain BiVO4 crystal.25
Preparation of Bi2WO6: place 5 mmol Bi (NO3)3·5H2O crystal and 2.00 g citric acid in 30.00 mL deionized water, stir for a certain time, add 2.5 mmol Na2WO4·2H2O crystal, stir for a certain time, place it in a hydrothermal synthesis kettle, react at 180 °C for 20 h, wash the obtained solid with deionized water and anhydrous ethanol for 3 times respectively, and dry at 80 °C for 12 h to obtain Bi2WO6 crystal.26
Preparation of BiOI: mix ethylene glycol monomethyl ether with water according to 1![[thin space (1/6-em)]](https://www.rsc.org/images/entities/char_2009.gif) :
:![[thin space (1/6-em)]](https://www.rsc.org/images/entities/char_2009.gif) 1 (volume ratio); solution A: add 2.5 mmol Bi (NO3)3·5H2O crystal into 25.00 mL mixed solution and stir; solution B: dissolve 2.5 mmol KI in 25.00 mL mixed solution and stir; add liquid B drop by drop into liquid a, stir it for a certain time, put it in a hydrothermal synthesis kettle, synthesize it at 160 °C for 6 h, use deionized water centrifugal lotion for 3 times, put it in an oven and dry it at 80 °C for 12 h to obtain BiOI crystal27(replace KI with KBr or thioacetamide to obtain BiOBr28,29 and Bi2S3 (ref. 30) crystals respectively).
1 (volume ratio); solution A: add 2.5 mmol Bi (NO3)3·5H2O crystal into 25.00 mL mixed solution and stir; solution B: dissolve 2.5 mmol KI in 25.00 mL mixed solution and stir; add liquid B drop by drop into liquid a, stir it for a certain time, put it in a hydrothermal synthesis kettle, synthesize it at 160 °C for 6 h, use deionized water centrifugal lotion for 3 times, put it in an oven and dry it at 80 °C for 12 h to obtain BiOI crystal27(replace KI with KBr or thioacetamide to obtain BiOBr28,29 and Bi2S3 (ref. 30) crystals respectively).
2.2 Characterization of materials
The materials were characterized by scanning electron microscopy (SEM), Fourier infrared spectroscopy (FT-IR), X-ray diffraction (XRD), Brunauer–Emmett–Teller (BET), X-ray photoelectron spectroscopy (XPS), photoluminescence spectroscopy (PL), Raman spectroscopy, UV-Vis diffuse reflectance spectroscopy and electrochemical analysis.2.3 Photocatalytic degradation of formaldehyde aqueous solution
The photocatalytic degradation experiment is to prepare 0.5 mg mL−1 aqueous formaldehyde solution as the reaction solution, and the amount of catalyst is 2.5 g L−1, which is radiated under mercury lamp and xenon lamp respectively.31 In the process of degradation, take out 0.50 mL of reaction solution sample according to the predetermined time gradient. After that, transfer it into the liquid sampling bottle and quantitatively analyze the formaldehyde in the reaction solution by acetylacetone ultraviolet spectrophotometer. The specific operations are as follows: accurately transfer 0.24 mL of the filtered reaction solution, add 1.00 mL of acetylacetone buffer (0.25%, wt) to it, fix the volume to 10.00 mL with deionized water, heat it in a water bath at 91 °C for 6 min, take it out, and measure the UV absorbance of the reaction solution after it is cooled to room temperature.2.4 Theoretical model and calculation method
Based on the first principle plane wave ultra soft pseudopotential method, the crystal supercell models of different Bi based catalysts are established,32 as shown in Fig. 1. The energy band structure, DOS and PDOS33 of different catalyst supercells are compared, and various influencing factors are analyzed to provide a theoretical basis for the activity evaluation of Bi based catalysts.34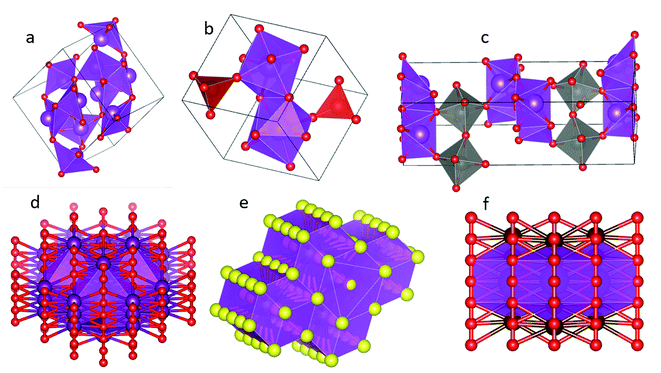 | ||
| Fig. 1 Supercell model diagram of Bi2O3 (a), BiVO4 (b), Bi2WO6 (c), BiOI (d), Bi2S3 (e), BiOBr (f) crystal. | ||
Based on DFT, the optical properties are calculated on Mede A platform. Considering the spin polarization effect, the pseudopotential of conservative norm is selected for structural optimization and electronic calculation.35 Taking BiVO4 as an example,36 in the process of energy band calculation, the optimized K point is set to 3 × 3 × 3. The cut-off energy is 571.40 eV and the electron energy is 1.0 × 10⁻⁶ eV, the maximum displacement is 0.001 A, the accuracy of interatomic interaction force is 0.03 eV nm−1, and the accuracy of crystal internal stress is 0.05 GPa.
3. Results and discussion
3.1 Material characterization
Fig. 2 shows the SEM of different Bi based catalysts. The specific analysis is as follows: Bi2O3 (a) is an irregular nano microsphere with rock like morphology and rich porous structure, and the diameter of micropores on the surface is about 50 nm; BiVO4 (b) catalyst is formed by the accumulation of irregular flake nanoparticles. The nanoparticles have a flake structure and uniform particle size, about 300 nm; Bi2WO6 (c) is flake particles with uniform morphology. After spatial overlap, it forms a nano flower structure with layer gap, which increases its specific surface area; BiOI (d) is a nanospherical structure formed by stacking rod-shaped particles with uniform morphology,37 and the diameter of the nanosphere is 2–3 μm; the diameter of nanorod particles is about 20 nm and the length is about 300 nm; Bi2S3 (e) presents a spherical nanostructure with uniform diameter,38 and the particle size is about 20–50 nm; BiOBr (f) is composed of relatively regular plate-like nanoparticles. By comparing the SEM of six catalysts, it is found that their morphology is representative, which provides a theoretical basis for better exploring the application of Bi based catalysts in photocatalytic degradation of formaldehyde solution.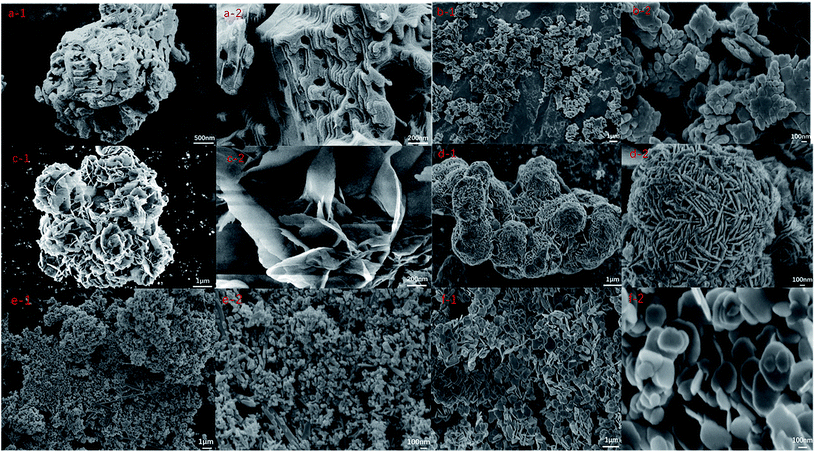 | ||
| Fig. 2 SEM of Bi2O3 (a-1,2), BiVO4 (b-1,2), Bi2WO6 (c-1,2), BiOI (d-1,2), Bi2S3 (e-1,2), BiOBr (f-1,2) crystals. | ||
The functional groups of chemical bonds in various Bi based catalyst crystals were analyzed by FT-IR (Fig. 3a). According to Fig. 3, wide absorption peaks appeared near 3342 cm−1 and 1623 cm−1, corresponding to the stretching vibration of H–O–H and O–H with strong hydrogen bond and the bending vibration of H–O–H, which may be caused by the physical adsorption of water in the air on the surface of nanocrystalline samples, The absorption peak near 1385 cm−1 is the C![[double bond, length as m-dash]](https://www.rsc.org/images/entities/char_e001.gif) O characteristic stretching vibration peak of CO2 adsorbed in the air on the sample surface. The strong absorption peak of Bi2O3 near 447 cm−1 is the characteristic absorption peak of Bi2O3;39 the absorption band of 540–850 cm−1 in the FT-IR of BiVO4 is caused by the stretching and bending vibration of V–O in Bi–O and VO43− tetrahedron; in Bi2WO6 crystal, the absorption of about 730 and 580 cm−1 corresponds to the stretching vibration of Bi–O and W–O, and the wide absorption peak at 734 cm−1 corresponds to the stretching vibration of W–O and the bridging stretching vibration of W–O–W; the characteristic absorption peak of BiOI crystal appeared at 486 cm−1; the absorption peak of Bi2S3 at 618 cm−1 is the characteristic absorption peak of Bi–S bond; the absorption peak of BiOBr at 642 cm−1 is the stretching vibration peak of Bi–O, and the peak near 585 cm−1 belongs to the characteristic peak of BiOBr material, the stretching vibration peak of Bi–O bond.
O characteristic stretching vibration peak of CO2 adsorbed in the air on the sample surface. The strong absorption peak of Bi2O3 near 447 cm−1 is the characteristic absorption peak of Bi2O3;39 the absorption band of 540–850 cm−1 in the FT-IR of BiVO4 is caused by the stretching and bending vibration of V–O in Bi–O and VO43− tetrahedron; in Bi2WO6 crystal, the absorption of about 730 and 580 cm−1 corresponds to the stretching vibration of Bi–O and W–O, and the wide absorption peak at 734 cm−1 corresponds to the stretching vibration of W–O and the bridging stretching vibration of W–O–W; the characteristic absorption peak of BiOI crystal appeared at 486 cm−1; the absorption peak of Bi2S3 at 618 cm−1 is the characteristic absorption peak of Bi–S bond; the absorption peak of BiOBr at 642 cm−1 is the stretching vibration peak of Bi–O, and the peak near 585 cm−1 belongs to the characteristic peak of BiOBr material, the stretching vibration peak of Bi–O bond.
 | ||
| Fig. 3 (a) FT-IR spectra of Bi-based catalysts; (b) N2 adsorption–desorption isotherms of Bi-based catalysts, (c) pore size distribution of Bi-based catalysts. | ||
The N2 adsorption desorption isothermal curve of Bi based catalyst is shown in Fig. 3b, and the pore size distribution is shown in Fig. 3c. As shown in Fig. 3b, the isotherms of all samples conform to type IV isotherms. At high relative pressure (P/P0), Bi based catalyst has H1 ring structure and particles gather uniformly. Among them, BiOI shows a high specific surface area of 25.93 m2 g−1. The other Bi based catalysts have little difference in Bi surface area; Table 1 shows the specific surface area, pore volume and pore diameter of Bi based catalyst. It can be seen from Table 1 and Fig. 3C that the pore volume of Bi based catalyst is, and the pore diameter is mainly about 20 nm. It is a mesoporous material. BiVO4 and Bi2WO6 have large pore diameters, 24.48 and 25.94 nm; in the experiment of photocatalytic degradation of formaldehyde, larger specific surface area can increase the effective loading of active ingredients, and the appropriate void volume and pore size distribution can make the formaldehyde molecules enter the pores of the catalyst more smoothly, provide more active sites for the degradation of formaldehyde and speed up the degradation rate.
| Bi2O3 | BiVO4 | Bi2WO6 | BiOI | Bi2S3 | BiOBr | |
|---|---|---|---|---|---|---|
| Surface area (m2 g−1) | 3.2949 | 5.4018 | 4.0925 | 25.9333 | 8.5987 | 11.48 |
| Pore volume (cm3 g−1) | 0.00963 | 0.01576 | 0.01493 | 0.12746 | 0.05179 | 0.03183 |
| Pore size (nm) | 16.0566 | 24.4777 | 25.5395 | 20.7095 | 11.8076 | 16.11 |
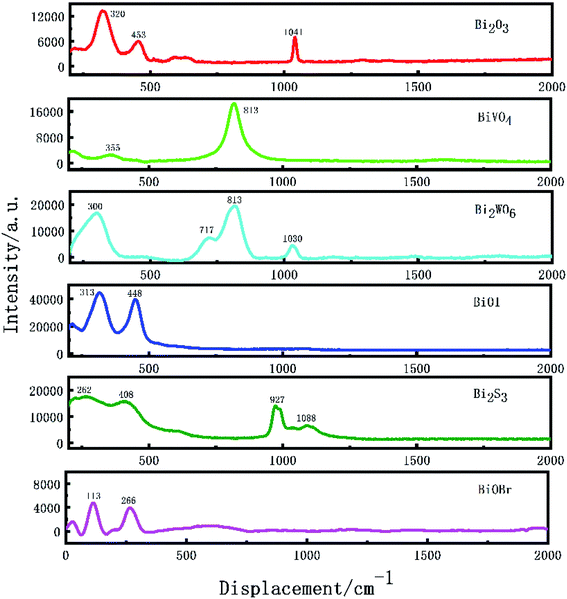
As the macroscopic embodiment of the third-order nonlinear optical effect of the crystal, Raman laser characteristics occupy a certain position in the study of the crystal. As shown in Fig. 4, some basic studies on the Raman characteristics of Bi based catalysts were carried out. During the determination, the central excitation wavelength of Bi2O3, BiVO4, Bi2WO6, BiOI and Bi2S3 was 532 nm and the central excitation wavelength of BiOBr was 540 nm. The peak centers observed by Bi2O3 were 320 and 453 cm−1 respectively; the peak centers observed by BiVO4 were 355 and 813 cm−1, respectively; the peak centers observed by Bi2WO6 were 300, 717 and 813 cm−1, respectively; the peak centers observed by BiOI were 313 and 448 cm−1, respectively; the peak centers observed by Bi2S3 are 262, 408 and 927 cm−1 respectively, and the peak centers observed by BiOBr are 113 and 266 cm−1 respectively. The Raman peaks of the above catalysts accord with the Raman characteristics of these substances. The Raman peaks of 1041 cm−1 (Bi2O3), 1031 cm−1 (Bi2WO6) and 1088 cm−1 (Bi2S3) may be the peak response signal caused by the anhydrous ethanol reagent selected when processing the sample.
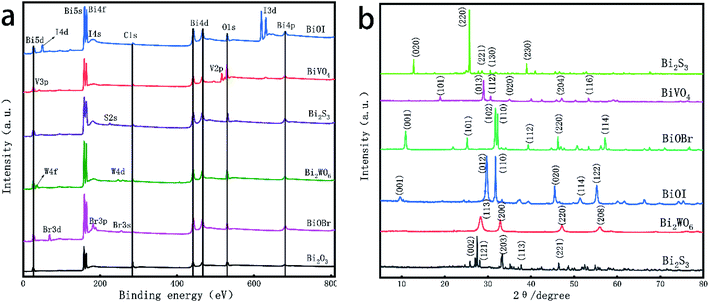
Fig. 5a shows the full XPS spectrum of Bi based catalyst. It can be seen from the figure that the elements contained in the catalyst include Bi, O, W, V, Br, I and S, and the response of 284.4 eV is the standard peak of C. For six different Bi based catalysts, Bi 5d, Bi 5s, Bi 4f, Bi 4d and Bi 4p appear at 24.0, 160.4, 162.3, 464.0 and 679.0 eV respectively. The two symmetrical peaks of Bi 4f7/5 and Bi 4d5/3 are located at 157.0, 162.3 eV and 440.0, 464.0 eV respectively, which belong to the surface of the catalyst. For O, the binding energy of O 1s is 544.9 eV; the standard peak binding energies of W 4f and W 4d were 32.3 eV and 243.1 eV, respectively; the binding energy of V 2p standard peak in catalyst BiVO4 is 519.0 eV; in the catalyst BiOI, the binding energies of 48.5, 185.5 and 619.2 eV correspond to 4d, 4s and 3d5/3 orbitals of I, respectively; the standard peak binding energies of 3d, 3p and 3s contained in the catalyst BiOBr were 68.5, 187.8 and 255.0 eV respectively; the binding energy of catalyst Bi2S3 at 229 eV corresponds to the S 2s orbital. By analyzing the XPS full spectrum of Bi based catalyst, a series of Bi based compounds were obtained by combining elements such as W, V, Br, I and S with O and Bi, which also provided the feasibility for the photocatalytic degradation experiment.
Fig. 5b shows the XRD diffraction pattern of Bi based catalyst. The obtained pattern is compared with the standard card by jade software (see Table 2 for the information of standard card and characteristic peak). It is found that the obtained Bi based catalyst shows good crystal form. Among them, Bi2O3 is in 2θ the diffraction peaks at 26.91°, 33.24° and 46.34° are sharp for (121), (203) and (221),40 respectively, indicating that the Bi2O3 crystal prepared by calcination has good crystallinity; the most exposed faces of BiVO4 crystal are (013) and (112), which correspond to 2θ it is 28.81° and 28.95°, and the diffraction peak at is attributed to the expansion and bending vibration of V–O,41 indicating that the prepared BiVO4 crystal has high crystallinity and no impurity peak, indicating that the purity of the product is high; similarly, for Bi2WO6 crystal, the crystal planes (113) and (200) exposed at the characteristic peaks of 28.31° and 32.93° belong to the stretching vibration of Bi–O and W–O, and some weak diffraction peaks indicate the process of forming Bi2WO6 nanocrystals; due to temperature and other reasons, the crystal structure growth is incomplete and the crystallinity is low; the main characteristic peaks of BiOI crystal are 29.74°, 31.74°, 45.49° and 55.30°, and the crystal planes represented are (012), (110), (220) and (122) respectively.42 The sharp peak type indicates that the synthesized BiOI has excellent crystallinity; in the XRD diffraction pattern of Bi2S3, 2θ the characteristic peak at 28.73° is sharp, indicating that the bending vibration of Bi–S bond has a great influence on the crystallinity of Bi2S3 crystal; BiOBr crystal has many characteristic peaks in 2θ the characteristic peaks at 10.91°, 31.72°, 33.12° and 46.24° are sharp and clear, indicating that the BiOBr prepared by hydrothermal method has high crystallinity.12
| JCPDS | 2-Theta (°) | |
|---|---|---|
| Bi2O3 | 71–0465 | 25.75, 26.91, 27.39, 33.03, 33.24, 37.61, 46.34, 52.37, 54.797 |
| BiVO4 | 83–1700 | 18.98, 18.67, 28.81, 28.95, 30.53, 35.21, 46.72, 53.28, 59.67 |
| Bi2WO6 | 73–1126 | 28.31, 32.80, 32.93, 46.98, 47.16, 55.68, 56.00 |
| BiOI | 73–2062 | 9.68, 29.74, 31.74, 45.49, 51.49, 55.30 |
| Bi2S3 | 75–1306 | 15.74, 17.658, 22.47, 25.04, 28.732, 31.92, 33.05, 35.755, 40.09, 46.65, 52.92, 59.31 |
| BiOBr | 78–0348 | 10.91, 31.72, 33.13, 39.32, 46.24, 50.66, 53.38, 57.16 |
3.2 Catalytic performance of catalyst
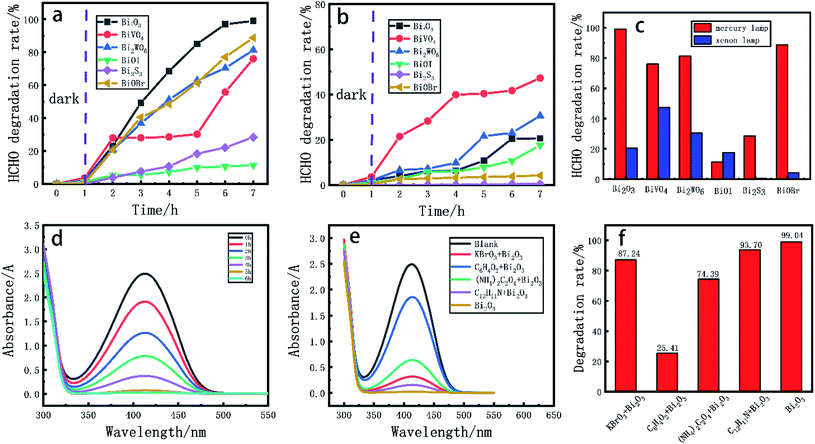
In the experiment of photocatalytic degradation of formaldehyde aqueous solution, the degradation effects of different Bi based catalysts on formaldehyde aqueous solution with mercury lamp and xenon lamp as light source were investigated.43 The prepared Bi based catalyst was ground to powder and evenly dispersed in 20.00 mL formaldehyde aqueous solution (0.5 mg mL−1), stir for 60 min under dark condition to reach the equilibrium of adsorption and desorption. The degradation experiment was carried out under the condition of sufficient light source. 0.50 mL sample was taken out from the reaction solution every 1 h, and the content of formaldehyde in the solution was determined by UV spectrophotometer.It can be seen from Fig. 6d that the UV absorbance value of the reaction solution at 413 nm decreases with the extension of time. As can be seen from Fig. 6a, in the dark reaction process, the adsorption capacity of catalyst for formaldehyde in the solution is very small, and the adsorption capacity of BiVO4 is the highest, reaching 3.61%. Six different catalysts showed good degradation under the irradiation of mercury lamp. The degradation rate can be obtained from formula (1-1) (where V is the degradation rate, A0 is the absorbance of the non degraded solution, and A is the absorbance of the degraded solution). Among them, the degradation efficiency of Bi2O3 and BiOBr reaches 99.04% and 88.80% respectively, and the degradation efficiency of BiVO4 and Bi2WO6 reaches 76.23% and 81.29% respectively; Fig. 6b shows the degradation effect of different catalysts on formaldehyde aqueous solution under xenon lamp. It can be seen from Fig. 6c that under xenon lamp atmosphere, the degradation rates of BiVO4 and Bi2WO6 to formaldehyde within 6 h reach 47.29% and 30.59% respectively, but the degradation effect of other Bi based catalysts under xenon lamp is not ideal.
 | (1-1) |
 | (2-2) |
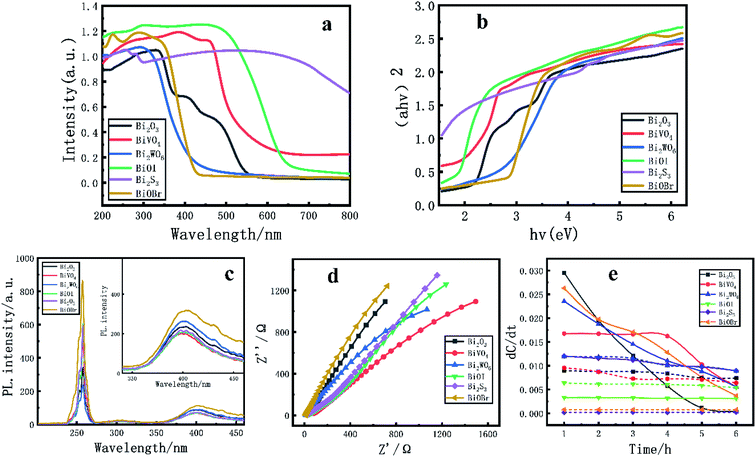
The apparent kinetic characteristics of photocatalytic degradation of formaldehyde aqueous solution were analyzed according to formula (2-2),44 where a* is the ratio of catalyst specific surface area to mass, m is catalyst mass/solution volume, and k is obtained from normalized concentration data. From Table 3, Fig. 8e, you can see that light in the experiments of catalyst to formaldehyde degradation rate affected by the molecular diffusion of formaldehyde, and the diffusion process is associated with the specific surface area of catalyst, the rate at which is suitable for the specific surface area of light catalysis have played an important role in promoting, formaldehyde concentration, the largest BiVO4 constant and reaction kinetics of the Bi2WO6 has the highest, 0.023, 0.029 min−1.
| Time/h | dC/dt | |||||||||||
|---|---|---|---|---|---|---|---|---|---|---|---|---|
| Xenon lamp | Mercury lamp | |||||||||||
| Bi2O3 | BiVO4 | Bi2WO6 | BiOI | Bi2S3 | BiOBr | Bi2O3 | BiVO4 | Bi2WO6 | BiOI | Bi2S3 | BiOBr | |
| 1 | 0.0090 | 0.0095 | 0.0120 | 0.0064 | 0.0002 | 0.0008 | 0.0296 | 0.0168 | 0.0236 | 0.0033 | 0.0120 | 0.0263 |
| 2 | 0.0088 | 0.0087 | 0.0119 | 0.0062 | 0.0002 | 0.0008 | 0.0195 | 0.0167 | 0.0188 | 0.0033 | 0.0116 | 0.0197 |
| 3 | 0.0088 | 0.0073 | 0.0116 | 0.0062 | 0.0002 | 0.0008 | 0.0121 | 0.0166 | 0.0145 | 0.0032 | 0.0112 | 0.0171 |
| 4 | 0.0083 | 0.0072 | 0.0100 | 0.0060 | 0.0002 | 0.0008 | 0.0057 | 0.0162 | 0.0111 | 0.0032 | 0.0102 | 0.0128 |
| 5 | 0.0074 | 0.0071 | 0.0098 | 0.0059 | 0.0002 | 0.0008 | 0.0011 | 0.0103 | 0.0088 | 0.0031 | 0.0097 | 0.0076 |
| 6 | 0.0074 | 0.0064 | 0.0089 | 0.0054 | 0.0002 | 0.0008 | 0.0004 | 0.0056 | 0.0056 | 0.0031 | 0.0089 | 0.0037 |
Bi2O3 is a semiconductor material with various forms and shows good light response performance. However, due to the problem of rapid recombination of light induced electron and hole pairs, Bi2O3 has poor photocatalytic decomposition efficiency of organic pollutants, and does not show better degradation efficiency in the process of degradation of formaldehyde aqueous solution by xenon lamp. BiVO4 can have an absorption band in the ultraviolet region and in the visible region (λ > 420 nm). This is due to the partial deformation of Bi–O caused by the lone pair electrons of Bi3+ in 6s2 orbit. The absorption in the visible region of BiVO4 is the transition of electrons from the Bi 6s orbit or the hybrid orbit of Bi 6s and O 2p to the V 2p orbit. The absorption in UV region mainly depends on the electronic transition from O 2p orbital to V 2p orbital. Therefore, BiVO4 can show better catalytic efficiency in both UV and visible regions; the same as BiVO4 crystal, Bi2WO6 crystal is easy to transition electrons from the hybrid orbital of Bi 6s and O 2p to the W 6s orbital under light conditions due to the existence of W element.
Which shows excellent catalytic performance in the visible and ultraviolet regions. For bismuth halide oxide, the absorption of BiOI can not cover the whole visible spectrum, and it has an anisotropic layered structure, which is easy to be photogenerated and carriers are easy to be combined, resulting in low photocatalytic efficiency; similarly, as a semiconductor material with narrow band gap, Bi2S3 is limited to a certain extent in the process of photocatalytic degradation of organic compounds;45 the energy band of BiOBr is mainly composed of hybrid orbitals of Br 4p, O 2p and Bi 6s orbitals. At the same time, the existence of Bi element will raise the low conduction band (CBM) position, increase the band gap, promote carrier transfer, and show excellent catalytic performance under ultraviolet light.
In order to further explore the mechanism of photocatalytic degradation of formaldehyde aqueous solution, we carried out free radical quenching experiments, as shown in Fig. 6-E. When Bi2O3 was used as catalyst and mercury lamp was used as light source, potassium bromate (KBrO3) was used as electron capture agent, p-benzoquinone (C6H4O2) was used as ·O2− capture agent ammonium oxalate ((NH4)2C2O4) was used as hole trapping agent and diphenylamine (C12H11N) was used as ·OH− trapping agent. According to Fig. 6f, it can be found that the degradation rate of formaldehyde decreased by 11.8%, 73.63%, 24.65% and 5.34% respectively after adding free radical capture agent. The above results show that ·O2− plays an important role in the photocatalytic degradation of formaldehyde aqueous solution. Similarly, holes also play a certain role in the degradation process. Based on this, We reasonably speculated the mechanism of photocatalytic degradation of formaldehyde aqueous solution,46 as shown in the Fig. 7.
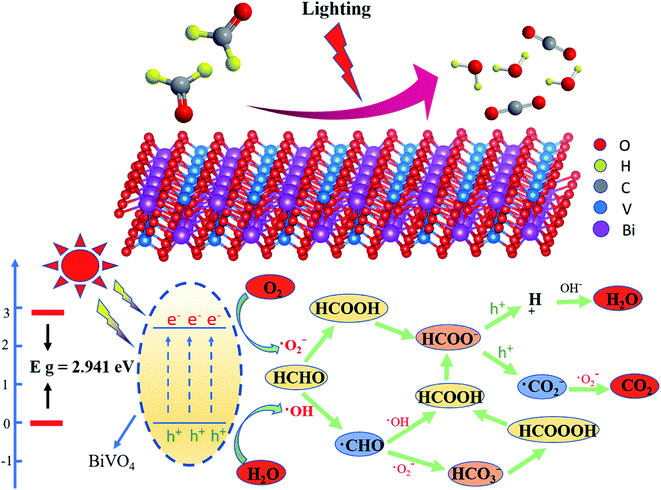 | ||
| Fig. 7 Mechanism of photocatalytic degradation of formaldehyde aqueous solution (taking BiVO4 as an example). | ||
The path and mechanism of photocatalytic degradation of formaldehyde aqueous solution were reasonably speculated;47 when the light source irradiates the semiconductor surface, electron transition will occur and electron hole pairs will be generated. Electrons and holes can oxidize and reduce H2O and O2 to ·OH and ·O2− the contact between HCHO molecule and ·OH will produce ·CHO. At the same time, ·CHO will produce HCOOH and HCO3− respectively under the action of ·OH and ·O2−. Among them, HCO3− ions will generate HCOOOH molecules after hydrogenation, this molecule interacts with HCHO to produce HCOOH; in addition, HCHO molecules are oxidized to HCOOH under the action of ·O2−. HCOO− produced by HCOOH molecule after losing H+ generates H+ and ·CO2− under the action of H+, and H+ and ·CO2− generate our final products H2O and CO2 under the action of OH− and ·O2− respectively. Based on the results of free radical quenching experiment, the mechanism of photocatalytic formaldehyde is more inclined to the path of HCHO directly generating HCOOH under the action of ·O2−, and then H2O and CO2 under the joint action of H+, OH− and ·O2−.
3.3 Activity evaluation of catalyst
The photocatalytic performance is closely related to the ability to absorb light. Therefore, the reflection and absorption characteristics of the catalyst are tested by UV-Vis DRS,48 and the results are shown in Fig. 8-a and b. Different Bi based catalysts have strong absorption in the visible and ultraviolet regions, and all catalysts have steep absorption boundary phenomena in the ultraviolet and visible spectra. BiVO4 and Bi2WO6 have long absorption edges in the visible region. Because the transition of the catalyst in the visible absorption is caused by the electronic transition of the energy band energy level structure. It shows that the above catalysts have relatively reasonable energy band structure and strong light absorption capacity.Fig. 8-c shows the PL spectra of different Bi based catalysts.49,50 When the atoms on the light-emitting substrate in Bi based catalyst particles are excited and collided by excited light particles with certain energy, the ionized free electrons will produce excitation ionization after colliding with other atoms. When the excited or ionized atoms return to the stable state, the fluorescence absorption peak will appear. The intensity of the fluorescence peak indicates the photogenerated electron hole recombination rate. The lower the intensity, the lower the recombination efficiency. When the excitation wavelength is 240 nm, it can be found that different catalysts have strong fluorescence absorption peaks at 405 nm. Through the spectrum, it is found that BiOBr shows strong fluorescence absorption, and the PL emission spectrum intensity of the other Bi based catalysts has little difference. Among them, BiVO4 has weak fluorescence absorption and shows high photogenerated charge separation efficiency.
The EIS of Bi based catalyst was determined under the conditions of visible light and 0.7 V vs. Ag/AgCl. In Fig. 8-d, Z′ represents the real part of the measured impedance, Z′ represents the negative number of the imaginary part of the measured impedance, and the radius of the arc reflects the charge transmission resistance between the semiconductor and electrolyte interface. In general, the smaller the radius means that the photogenerated electrons and holes are effectively separated and the photogenerated electrons migrate rapidly.51 It is found that BiOBr has a larger arc radius, while BiVO4 has a smaller arc radius and lower charge transfer resistance, that is, it has higher electric core separation efficiency and faster photogenerated electron migration rate, and its photochemical properties are enhanced.
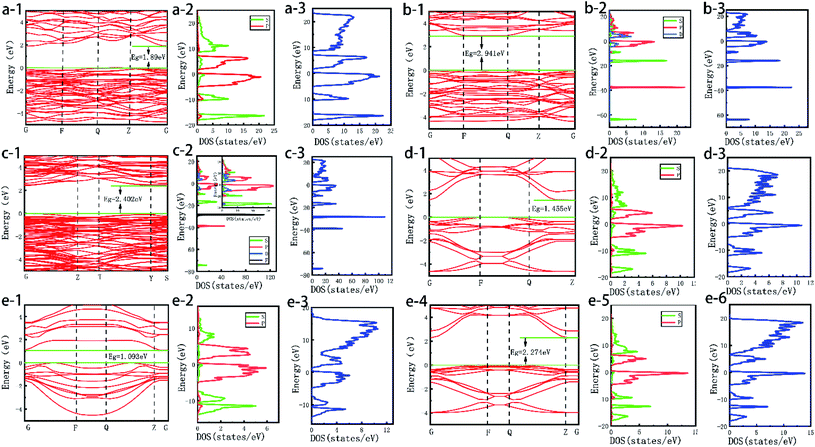
In order to further reveal the effect of the optical properties of Bi based catalyst on the activity of the catalyst, the energy band structure of the photocatalyst was calculated by DFT. The results are shown in Fig. 9a–f-1. The band gaps of Bi2O3, BiVO4, Bi2WO6, BiOI, Bi2S3 and BiOBr catalysts are 1.89, 2.941, 2.402, 1.455, 1.093 and 2.274 eV respectively.52 It can be found that the band gaps calculated by theory are roughly consistent with the experimental results. At the same time, most Bi based semiconductor photocatalysts not only have narrow band gap, but also have positive valence band position. That is, photogenerated holes have strong oxidation ability and are very suitable for photocatalytic reaction. Among them, Bi2O3, BiVO4, Bi2WO6 and BiOBr have appropriate energy band structures.32,34 At the same time, the DOS and PDOS of Bi based catalysts are calculated in Fig. 9a–f-2,3. The results show that the density of states of most Bi based catalysts are similar, which is mainly provided by the hybridization of s orbital and p orbital, the density of states at the top of the valence band (−25 eV to 0 eV) is mainly contributed by the 6s orbitals of O and Bi; the contribution of the DOS at the bottom of the conduction band (2 eV to 20 eV) mainly comes from the 6p orbital of Bi and the 2p orbital of O. However, for BiVO4 and Bi2WO6 crystals, in addition to the DOS contributed by the s and p orbitals of Bi and O, the d and f orbitals of V and W also contribute a certain DOS to the above two catalysts. The optical properties of BiVO4 and Bi2WO6 crystals play a key role. Thus, it shows excellent photocatalytic activity in the visible light range.53
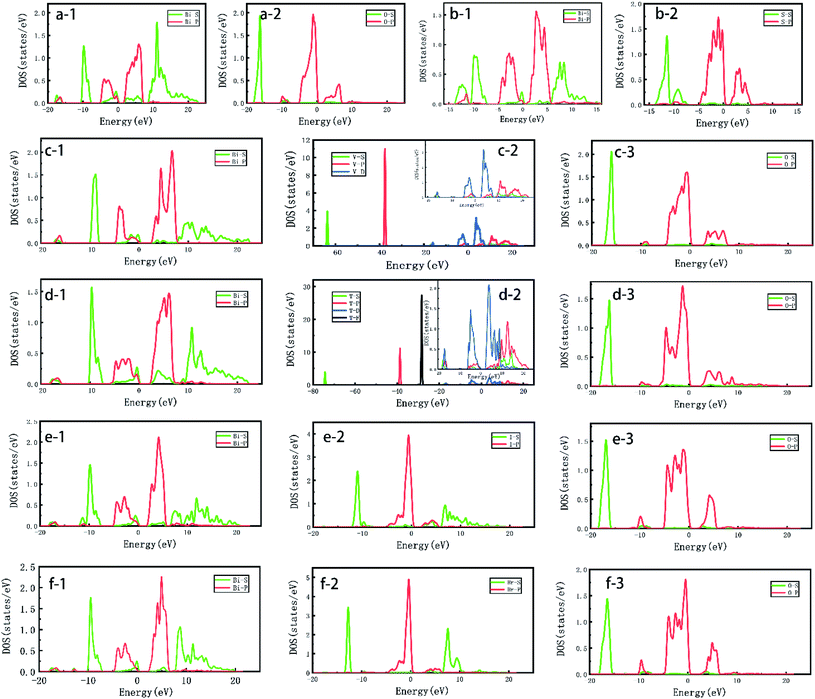
In order to further study the effect of hybrid orbitals of different elements in Bi based catalyst on crystal optical properties,54 the PDOS55 of different elements were calculated in the figure. In Fig. 10a-1 and a-2, Bi-PDOS and O-PDOS are shown respectively. It can be seen that the s and p orbitals of Bi element provide most of the DOS for Bi2O3. The s and p orbitals of O element are mainly located at −17.0 eV and −2.0 eV, belonging to the range of valence band top, that is, the participation of O element has a certain impact on the position and size of energy band of Bi2O3; the same as Bi2O3 is Bi2S3 crystal. The s and p orbitals of Bi element also increase most of the DOS for the catalyst. However, unlike Bi2O3, the p orbitals of S element provide a certain density of states for Bi2S3 at 1.0–6.0 eV, which affects the position of its low conduction band, resulting in a significant reduction of its band gap to 1.093 eV, which has a serious impact on the photochemical properties. In the study of bismuth oxyhalide, as shown in Fig. 10-e, f-1 is Bi-PDOS, Fig. 10-e, f-2 are I-PDOS and Br-PDOS respectively, and Fig. 10-e and f-3 are O-PDOS. Comparing the contribution of s and p orbitals of each element in the two catalysts to DOS, it can be found that the s orbitals of Bi element contribute more DOS to BiOBr at 6.0–12.0 eV, reaching 1.2 eV, which is 0.7 eV higher than that of BiOI at the same time. The DOS value of the s orbitals of the same Br element is higher than that of I element at 8.0 eV, which is nearly 1.7 eV higher. The above situation leads to the difference in the degradation of organic matter between the two bismuth halides under ultraviolet light, and BiOBr shows more excellent photochemical properties. BiVO4 and Bi2WO6 are Bi based catalysts with excellent performance in degrading organic matter under visible light. Fig. 10-d, e-1, 2 and 3 show Bi-PDOS, V-PDOS and O-PDOS of BiVO4 catalyst and Bi-PDOS, W-PDOS and O-PDOS of Bi2WO6 catalyst respectively. It can be seen from the figure that the conduction band region on the surface of BiVO4 crystal is contributed by the s and p orbitals of Bi, the s orbitals of O and the p and d orbitals of V. the bottom region of the conduction band is mainly occupied by the p orbitals of Bi and the d orbitals of V. the DOS contribution of the valence band region mainly comes from the s and p orbitals of Bi and the s and p orbitals of O. The s and p orbitals of V do not contribute much to the DOS of the valence band region. The above results show that, the introduction of V element has a great influence on the valence band region of BiVO4 crystal, which makes it have a more suitable energy band structure and optimizes its photochemical properties; the DOS contribution of Bi2WO6 crystal surface mainly comes from the s and p orbitals of Bi, the s and p orbitals of O and the p and d orbitals of W. the DOS in the conduction band bottom region mainly comes from the s orbitals of Bi and the d orbitals of W. At the same time, the DOS in the valence band top region is also largely occupied by the d orbitals of W, which indicates that w element dominates the energy band size and position of Bi2WO6 crystal, making its band gap reach 2.402 eV. Therefore, it shows more excellent electrochemical properties. However, compared with BiVO4 crystal, the hybridization of s and p orbitals of W makes its electron distribution more dispersed, which affects its photochemical properties to a certain extent.
4. Conclusions
Firstly, a series of Bi based catalysts were prepared by calcination and hydrothermal synthesis. XRD results showed that the prepared catalyst had sharp and clear characteristic peaks and no impurity peaks, which showed that the prepared catalyst had good crystallinity and high purity, which could be confirmed by XPS and Raman results. Subsequently, the unique morphologies of different catalysts were characterized by SEM, and BET also confirmed that the prepared catalysts had high specific surface area.In the experiment of photocatalytic degradation of formaldehyde aqueous solution, the degradation experiments were carried out under xenon lamp and mercury lamp respectively. The results showed that the experimental Bi based catalysts showed excellent degradation efficiency under ultraviolet light. At 6 h, Bi2O3, BiOBr, BiVO4 and Bi2WO6 catalysts showed extremely strong degradation efficiency, reaching 99.04%, 88.80%, 76.23% and 81.29% respectively; in the visible light range, BiVO4 and Bi2WO6 showed strong degradation effect, and the degradation rates of formaldehyde reached 47.29% and 30.59% respectively within 6 hours; at the same time, through the free radical quenching experiment, it can be found that when C6H4O2 is used as ·O2− capture agent, the degradation rate of formaldehyde decreases by 73.63%, indicating that ·O2− plays an important role in the photocatalytic degradation of formaldehyde aqueous solution. Subsequently, the tests of PL, UV Vis and EIS showed that BiVO4 and Bi2WO6 catalysts had excellent photochemical properties and showed strong activity under UV and visible light.
The energy bands, DOS and PDOS of Bi based catalysts were calculated based on DFT. Through the calculation of energy band structure, it is found that Bi2O3, BiVO4, Bi2WO6 and BiOBr have appropriate energy band structure, and their band gaps are 1.89, 2.941, 2.402 and 2.274 eV respectively, which can show excellent photochemical properties in the ultraviolet region; in the calculation of DOS and PDOS, it is found that in the composition of DOS in the conduction band region of BiVO4 and Bi2WO6, the d orbital of V and the d orbital of W occupy most positions, indicating that the of V and W have a great influence on the energy band position and size of the catalyst, making it have a more appropriate energy band structure and band gap, and show strong activity under ultraviolet and visible light. This result is also mutually confirmed with our experimental results.
Author contributions
Runquan Wang designs experiments, implements experiments, analyzes experimental data and writes papers; Yuerong Zhang data analysis, Wanping Chen catalytic degradation theory calculation; Yuan Tian, Kai Song, and Jiaxian Li provided assistance in sample delivery testing and experimental implementation.Conflicts of interest
There are no conflicts of interest to declare.References
- D.-H. Zhuo, Q.-S. Chen, X.-H. Zhao, Y.-L. Jiang, J. Lu, Z.-N. Xu and G.-C. Guo, J. Mater. Chem. C, 2021, 9, 7900–7904 RSC.
- Z. Zhou, J. Yang, Q. Jiang, Y. Luo, D. Zhang, Y. Ren, X. He and J. Xin, J. Mater. Chem. A, 2016, 4, 13171–13175 RSC.
- M. Arumugam and M. Y. Choi, J. Ind. Eng. Chem., 2020, 81, 237–268 CrossRef CAS.
- A. Kubacka, M. Fernandez-Garcia and G. Colon, Chem. Rev., 2012, 112, 1555–1614 CrossRef CAS PubMed.
- A. Benhmid, K. V. Narayana, A. Martin, B. Lucke and M. M. Pohl, Chem. Commun., 2004, 2416–2417, 10.1039/b410310f.
- X.-H. Zhao, Q.-S. Chen, D.-H. Zhuo, J. Lu, Z.-N. Xu, C.-M. Wang, J.-X. Tang, S.-G. Sun and G.-C. Guo, Electrochim. Acta, 2021, 367 Search PubMed.
- Y. Yuan, Y. Huang, F. Ma, Z. Zhang, X. Wei and G. Zhu, J. Mater. Sci., 2016, 51, 6662–6673 CrossRef CAS.
- W. Li, X.-y. Liu, X.-s. Chu, F. Wang, Y.-y. Dang, T.-h. Ma, J.-y. Li and C.-y. Wang, Environ. Sci., 2021, 8, 3655–3664 CAS.
- J. Wang, X. Xu, Y. Liu, Z. Wang, P. Wang, Z. Zheng, H. Cheng, Y. Dai and B. Huang, ChemSusChem, 2020, 13, 3488–3494 CrossRef CAS PubMed.
- Z. Cui, X. Dong, Y. Sun, Y. Zhou, Y. Zhang and F. Dong, Nanoscale, 2018, 10, 16928–16934 RSC.
- H. Bahruji, M. Bowker, P. R. Davies and F. Pedrono, Appl. Catal., B, 2011, 107, 205–209 CrossRef CAS.
- H. Li, J. Liu, T. Hu, N. Du, S. Song and W. Hou, Mater. Res. Bull., 2016, 77, 171–177 CrossRef CAS.
- L. Hao, H. Huang, Y. Zhang and T. Ma, Adv. Funct. Mater., 2021, 31 Search PubMed.
- W. Li, F. Wang, X.-s. Chu, Y.-y. Dang, X.-y. Liu, T. Ma, J.-y. Li and C.-y. Wang, Chem. Eng. J., 2022, 435 Search PubMed.
- W. Li, X.-s. Chu, F. Wang, Y.-y. Dang, X.-y. Liu, T.-h. Ma, J.-y. Li and C.-y. Wang, Appl. Catal., B, 2022, 304 CAS.
- Z. Chen, F. Lv, R. Li, Z. Sun and Y. Zhang, Mater. Res. Bull., 2019, 118, 110514 CrossRef CAS.
- X. Li, Y. Sun, T. Xiong, G. Jiang, Y. Zhang, Z. Wu and F. Dong, J. Catal., 2017, 352, 102–112 CrossRef CAS.
- Q. Guo, Z. Ma, C. Zhou, Z. Ren and X. Yang, Chem. Rev., 2019, 119, 11020–11041 CrossRef CAS PubMed.
- J. Yang, Q. Shi, R. Zhang, M. Xie, X. Jiang, F. Wang, X. Cheng and W. Han, Carbon, 2018, 138, 118–124 CrossRef CAS.
- M. T. Laciste, M. D. G. de Luna, N. C. Tolosa and M. C. Lu, Chemosphere, 2017, 182, 174–182 CrossRef CAS PubMed.
- Y. Feng, B.-J. Huang, S.-S. Li, B.-M. Zhang, W.-X. Ji, C.-W. Zhang and P.-J. Wang, J. Mater. Sci., 2015, 50, 6993–6999 CrossRef CAS.
- J. Deng and Z.-Y. Zhao, Comput. Mater. Sci., 2018, 142, 312–319 CrossRef CAS.
- M. Yang, Y. Z. Luo, M. G. Zeng, L. Shen, Y. H. Lu, J. Zhou, S. J. Wang, I. K. Sou and Y. P. Feng, Phys. Chem. Chem. Phys., 2017, 19, 29372–29380 RSC.
- C. Nguyen Van, T. H. Do, J.-W. Chen, W.-Y. Tzeng, K.-A. Tsai, H. Song, H.-J. Liu, Y.-C. Lin, Y.-C. Chen, C.-L. Wu, C.-W. Luo, W.-C. Chou, R. Huang, Y.-J. Hsu and Y.-H. Chu, NPG Asia Mater., 2017, 9, e357 CrossRef CAS.
- M. Choi, Appl. Phys. Lett., 2021, 118 Search PubMed.
- Z. Zhang, Y. Lin and F. Liu, Colloids Surf., A, 2020, 590 Search PubMed.
- X. Lou, J. Shang, L. Wang, H. Feng, W. Hao, T. Wang and Y. Du, J. Mater. Sci. Technol., 2017, 33, 281–284 CrossRef CAS.
- D. Wu, S. Yue, W. Wang, T. An, G. Li, L. Ye, H. Y. Yip and P. K. Wong, Appl. Surf. Sci., 2017, 391, 516–524 CrossRef CAS.
- S. S. Imam, R. Adnan and N. H. Mohd Kaus, J. Environ. Chem. Eng., 2021, 9 CAS.
- R. S. Lokhande, S. R. Thakur and P. A. Chate, Optik, 2020, 219 Search PubMed.
- Z. Wang, F. Xiong, Z. Zhang, G. Sun, H. Xu, P. Chai and W. Huang, J. Phys. Chem. C, 2017, 121, 25921–25929 CrossRef CAS.
- H. Ahmad, A. Rauf, A. Ahmad, A. Ulhaq and S. Muhammad, RSC Adv., 2021, 11, 32330–32338 RSC.
- W. Dan, K. Chang, Y. Zhang, Y. Wang, Q. Liu, Z. Wang, D. Ding, Y. Cui, C. Pan, Y. Lou, Y. Zhu and Y. Zhang, Appl. Catal., B, 2021, 299 Search PubMed.
- Y. Bi, Y. Yang, X.-L. Shi, L. Feng, X. Hou, X. Ye, L. Zhang, G. Suo, S. Lu and Z.-G. Chen, J. Mater. Sci. Technol., 2021, 83, 102–112 CrossRef.
- R. Z. Huang, Y. Y. Wei, T. F. Gao, C. M. Li and C. H. Jiang, Ceram. Int., 2021, 47, 205–213 CrossRef CAS.
- L. d. Olmo, M. Dommett, I. H. Oevreeide, A. Walsh, D. Di Tommaso and R. Crespo-Otero, J. Mater. Chem. A, 2018, 6, 24965–24970 RSC.
- A. C. Mera, C. A. Rodríguez, M. F. Meléndrez and H. Valdés, J. Mater. Sci., 2016, 52, 944–954 CrossRef.
- X. Li, Y. Wu, H. Ying, M. Xu, C. Jin, Z. He, Q. Zhang, W. Su and S. Zhao, J. Alloys Compd., 2019, 798, 628–634 CrossRef CAS.
- T. Hashimoto, H. Ohta, H. Nasu and A. Ishihara, Int. J. Hydrogen Energy, 2016, 41, 7388–7392 CrossRef CAS.
- L. D. Geoffrion, D. Medina-Cruz, M. Kusper, S. Elsaidi, F. Watanabe, P. Parajuli, A. Ponce, T. B. Hoang, T. Brintlinger, T. J. Webster and G. Guisbiers, Nanoscale Adv., 2021, 3, 4106–4118 RSC.
- W. Wang, P. J. Strohbeen, D. Lee, C. Zhou, J. K. Kawasaki, K.-S. Choi, M. Liu and G. Galli, Chem. Mater., 2020, 32, 2899–2909 CrossRef CAS.
- R. A. Jagt, T. N. Huq, K. M. Börsig, D. Sauven, L. C. Lee, J. L. MacManus-Driscoll and R. L. Z. Hoye, J. Mater. Chem. C, 2020, 8, 10791–10797 RSC.
- T. Cai, P. Zhang, X. Shen, E. Huang, X. Shen, J. Shi, Z. Wang and Q. Sun, ACS Appl. Mater. Interfaces, 2020, 12, 37147–37154 CrossRef CAS PubMed.
- A. P. Reverberi, P. S. Varbanov, M. Vocciante and B. Fabiano, Front. Chem. Sci. Eng., 2018, 12, 878–892 CrossRef CAS.
- N. Mahuli, D. Saha and S. K. Sarkar, J. Phys. Chem. C, 2017, 121, 8136–8144 CrossRef.
- X. Li, H. Li, Y. Huang, J. Cao, T. Huang, R. Li, Q. Zhang, S. C. Lee and W. Ho, J. Hazard. Mater., 2022, 424, 127217 CrossRef CAS PubMed.
- L. Buzzetti, G. E. M. Crisenza and P. Melchiorre, Angew. Chem., Int. Ed., 2019, 58, 3730–3747 CrossRef CAS PubMed.
- Z. Cai, J. Zhong, J. Li and H. Jin, Inorg. Chem. Commun., 2021, 126 Search PubMed.
- S. Zhong, B. Wang, H. Zhou, C. Li, X. Peng and S. Zhang, J. Alloys Compd., 2019, 806, 401–409 CrossRef CAS.
- Y. Geng, N. Li, J. Ma and Z. Sun, J. Energy Chem., 2017, 26, 416–421 CrossRef.
- C. Yan, Z. Zhang, W. Wang, T. Ju, H. She and Q. Wang, J. Mater. Sci.: Mater. Electron., 2018, 29, 18343–18351 CrossRef CAS.
- W. Zeng, L. Feng, Y. Yu, J. Wang and Z. Liu, J. Alloys Compd., 2021, 850 Search PubMed.
- J. Wiktor, F. Ambrosio and A. Pasquarello, ACS Energy Lett., 2018, 3, 1693–1697 CrossRef CAS.
- S. Ashwini, S. C. Prashantha, R. Naik, Y. V. Naik, H. Nagabhushana and K. N. Narasimhamurthy, J. Sci.: Adv. Mater. Devices, 2019, 4, 531–537 Search PubMed.
- X. Wang, L. Liu, H. An, Y. Zhong, D. Wang, C. Tang and C. Hu, Mater. Res. Bull., 2019, 118 Search PubMed.
| This journal is © The Royal Society of Chemistry 2022 |

