
 Open Access Article
 This Open Access Article is licensed under a Creative Commons Attribution-Non Commercial 3.0 Unported Licence
Facile synthesis of carbon and oxygen vacancy co-modified TiNb6O17 as an anode material for lithium-ion batteries†
Yunfan Shang a,
Suyang Lua,
Wei Zhengb,
Rui Wangb,
Zi Liangb,
Yushuo Huanga,
Jun Meia,
Ye Yanga,
Wenwen Zenga and
Haoran Zhan*a
a,
Suyang Lua,
Wei Zhengb,
Rui Wangb,
Zi Liangb,
Yushuo Huanga,
Jun Meia,
Ye Yanga,
Wenwen Zenga and
Haoran Zhan*a
aChengdu Development Center of Science and Technology, China Academy of Engineering Physics, Chengdu 610200, China. E-mail: zhanhenry20@163.com
bSichuan Global Creatives Corporation Battery Material CO., LTD, Meishan 620000, China
First published on 29th April 2022
Abstract
Titanium niobium oxides (TNOs), benefitting from their large specific capacity and Wadsley–Roth shear structure, are competitive anode materials for high-energy density and high-rate lithium-ion batteries. Herein, carbon and oxygen vacancy co-modified TiNb6O17 (A-TNO) was synthesized through a facile sol–gel reaction with subsequent heat treatment and ball-milling. Characterizations indicated that A-TNO is composed of nanosized primary particles, and the carbon content is about 0.7 wt%. The nanoparticles increase the contact area of the electrode and electrolyte and shorten the lithium-ion diffusion distance. The carbon and oxygen vacancies decrease the charge transfer resistance and enhance the Li-ion diffusion coefficient of the obtained anode material. As a result of these advantages, A-TNO exhibits excellent rate performance (208 and 177 mA h g−1 at 10C and 20C, respectively). This work reveals that A-TNO possesses good electrochemical performance and has a facile preparation process, thus A-TNO is believed to be a potential anode material for large-scale applications.
Introduction
In recent years, lithium-ion batteries (LIBs) have played a significant role in many fields especially for portable electronic equipment and electric vehicles.1–3 To meet the needs of practical applications including safety, high-energy density, high-rate charge/discharge and long-life cycling, various kinds of electrode materials have been widely studied. For anode materials, research mainly focuses on carbon materials,4–6 metallic oxide materials,7,8 alloy materials9,10 and silicon-based materials.11 To date, graphite is the most widely used commercial anode material due to its low price, decent theoretical specific capacity (372 mA h g−1) and excellent electrical conductivity.12 However, graphite suffers from safety hazards due to its low working potential (∼0.2 V versus Li+/Li) which makes it easy for the growth of lithium dendrites during charge/discharge processes.13 Lithium titanate (Li4Ti5O12, LTO), which has an operating voltage of about 1.55 V versus Li+/Li, has been considered as an anode material with high-level safety. The unique spinel structure of LTO provides supreme electrochemical and cycling stability,14,15 but its deficient theoretical specific capacity (175 mA h g−1) greatly limits its applications. Titanium-niobium oxides (TNOs), as a series of solid solutions of titanium dioxide and niobium oxide,16 have been one of the most competitive anode materials since they were proposed by Jian-Tao Han et al.17 in 2011. Based on the multiple redox couples (Ti4+/Ti3+, Nb5+/Nb4+ and Nb4+/Nb3+), the theoretical specific capacities of TNOs are two times higher than that of LTO (TiNb2O7, Ti2Nb10O29 and TiNb6O17 possess specific capacities of 388, 396 and 397 mA h g−1, respectively),18 which means their energy density per unit volume have absolutely advantage compared to LTO and graphite.19 Besides, TNOs show a crystal structure consisting of ReO3-type blocks where Ti4+ and Nb5+ ions are randomly arranged in octahedral sites.20,21 And the open Wadsley–Roth shear structure results in larger lithium-ion diffusion coefficient of TNOs than that of LTO.18 Moreover, TNOs have a high working potential (1.2–1.6 V versus Li+/Li) similar to that of LTO, effectively suppressing the growth of lithium dendrite. Hence TNOs also possess good safety performance.However, it's still a challenge for TNOs to be transformed from laboratory prototypes to industrial products,1 and finding superior synthetic method is the key to solve this problem. Common oxide synthesis methods include solid phase reaction method, sol–gel method, electrospinning method and hydrothermal/solvothermal method. Traditional solid phase reaction is the easiest route which possesses the advantages of low cost, easy accessibility, large-scale production and good crystalline.22–24 But the uneven reaction and micro-sized primary particle may lead to poor electrochemical performance. Hydrothermal and solvothermal methods are common routes to produce nano-sized materials,3,25,26 and TNOs produced by these methods generally show supreme rate performance and long cycling life.27 But the poor productive rate and complicated reaction conditions make it inappropriate for industrial production. Electrospinning is a facile method to produce fibers with nano/microscale size.28,29 The products display outstanding porosity, high surface area and homogeneous size, leading to fine electrochemistry performance. However, the low production efficiency and the use of toxic organic solvent make it unsuitable for industrial production. Sol–gel method is an effective way to prepare nanomaterial and the reaction condition is relatively moderate.30,31 The product can be even and nanostructured, guaranteeing good electrochemical performance. So sol–gel method is a promising method for industrial production of TNOs with excellent performance.32 At present, reported sol–gel synthesis of TNOs always use niobium chloride or niobium ethoxide as niobium source.17,19,33,34 The former has an extremely unstable chemical property and the introduction of Cl causes extra trouble in the synthesis process, and the latter is much too expensive to be applied in industrial production. Hence, it's necessary to develop a new sol–gel method for the industrial produce of TNOs with low cost and good electrochemistry performance.
Referring to the past studies, nanocrystallization of anode materials can efficiently promote the rate performance since the nanoparticles shorten the diffusion pathway of lithium ions.35,36 And the increase of specific surface area enhances the contact area between anodes and electrolyte, thus promoting electrochemical reaction.29 TNOs are a kind of materials with wide band gap,20 leading to low electrical conductivity and limiting their rate performance. Carbon coating has been considered as a useful method to improve the electrical conductivity of TNOs due to the signally enhancement of the electrochemical performance especially at high rate.34,37,38 Besides, introduction of oxygen vacancies is also an effective method to decrease the band gap and promote lithium-ion transport, thus increasing the electrical conductivity and lithium-ion diffusion coefficient.39–41
In this work, inspired by citrate method,30,42,43 we report an improved and facile sol–gel method to synthesize TiNb6O17 with nano-sized primary particles. On this basis, simple atmosphere sintering method is used to make carbon and oxygen vacancies co-modified TiNb6O17 (A-TNO) with excellent electrochemical performance. The raw materials are easily available and chemically stable, and the reaction condition is moderate without high pressure and highly toxic solvent. The product displays excellent electrochemical performance, which has an initial charge/discharge specific capacity of 274 and 269 mA h g−1 at the rate of 0.1C, and a reversible specific capacity of 177 mA h g−1 at the rate of 20C. This new approach to prepare TNOs is potential for industrial large-scale production.
Experimental
Material synthesis
The products in this work were synthesized through an improved and facile sol–gel reaction with subsequent sintering and ball-milling. The preparation process was depicted in Fig. S1.† In a typical synthesis procedure, 20 ml glycol used as solvent and reactant was heated to 90 °C. Then, according to the stoichiometric ratio of Ti and Nb in TiNb6O17, 0.002 mol titanium butoxide (C16H36O4Ti, 99%, Aladdin) and 0.012 mol niobium oxalates (C10H5NbO20, 98%, Aladdin) were respectively added into above solution with violent stirring. After that, the solution was heated at 150 °C for about 90 min in an oil bath. In this process, polymerization reaction happened and the solution became transparent. After sufficient reaction, semi-transparent sol–gel precursor was obtained. Dispense with washing or drying, the precursor was calcined in tube furnace at 500 °C for 2 h in air followed by 900 °C for 3 h in Ar atmosphere with a heating rate of 5 °C min−1, after which A-TNO was obtained. For comparation, another precursor was calcined at 900 °C for 3 h in air, in which carbon in the precursor was totally removed and pure TiNb6O17 (P-TNO) was obtained. Another contrast sample was synthesized through solid phase reaction method through mixing TiO2 and Nb2O5 at the ratio of 1![[thin space (1/6-em)]](https://www.rsc.org/images/entities/char_2009.gif) :6 and calculated at 1200 °C for 6 h, and the sample was marked as S-TNO. All the samples were ball-milled for 4 h into fine powder and dried before further tests.
:6 and calculated at 1200 °C for 6 h, and the sample was marked as S-TNO. All the samples were ball-milled for 4 h into fine powder and dried before further tests.
Material characterization
The crystal structures of the obtained samples were characterized by powder X-ray diffraction (XRD, PANalytical X'Pert PRO Empyrean) at the 2θ range from 10° to 80°. The morphology of the samples was studied by field emission scanning electron microscopy (FESEM, Thermo Fisher Apreo 2C). Chemical valences were confirmed by X-ray photoelectron spectrometry (XPS, Thermo Scientific K-Alpha). Elaborate crystal structures were investigated by high-resolution transmission electron microscopy (HRTEM, JEOL JEM-2800F) and selected area electron diffraction (SAED, JEOL JEM-2800F). The carbon was measured by Raman spectrum (Renishaw invia reflex). Thermogravimetric analysis (TG, Mettler TGA 2) was used to measure the carbon content of the A-TNO from 100 °C to 900 °C at a heating rate of 10 °C min−1 under air atmosphere. The specific surface area of the samples was measured by BET test (Micromeritics ASAP 2460).Electrochemical characterization
CR2032 coin-type half-cells were fabricated in the argon-filled glovebox (H2O, O2 < 0.2 ppm) to test the electrochemical performances of the obtained materials, in which Li disc was used as the counter electrode and Celgard2300 as separator. The electrolyte was 1.0 M LiPF6 dissolved in the solution composed of ethyl carbonate (EC), dimethyl carbonate (DMC) and diethyl carbonate (DEC) with a volume ratio of 1:1:1. The working electrode was prepared by the following steps. Firstly, active material, Super P and polyvinylidene fluoride (PVDF) were mixed with a weight ratio of 8:1:1 into moderate N-methylpyrrolidone (NMP) to form homogeneous slurry. Then the slurry was coated onto Cu foil with the help of coating machine. After that, the Cu foil coated with slurry was transferred to a vacuum oven and dried at 80 °C for 4 h. The mass loading of active materials was about 2 mg cm−2. Galvanostatic charge/discharge were measured by multi-channel battery testing system (LAND CT3001A) within the voltage range of 1.0–3.0 V vs. Li+/Li. Cyclic voltammogram (CV) and electrochemical impedance spectroscopy (EIS) tests were evaluated using an electrochemistry workstation (CHI760E, Chenhua Instrument). The CV sweep rate was from 0.1 to 1 mV s−1 between 0.8 and 2.5 V vs. Li+/Li. The EIS were measured in a frequency range of 105–10−2 Hz.
Results and discussion
The X-ray diffraction (XRD) patterns of A-TNO, P-TNO and S-TNO are shown in Fig. 1. It can be seen that the diffraction peaks of A-TNO and P-TNO fit well with standard pattern (JCPDS no. 09-0229) and previous study, and no peaks of impurities (i.e., TiO2, Nb2O5, and TiNb2O7) can be detected, demonstrating the pure phase of TiNb6O17. However, except the main peaks of TiNb6O17, there is still Nb2O5 phase existing in the XRD pattern of S-TNO, indicating the nonuniformity of solid phase reaction. Although the peaks of the samples fit well with the standard pattern, their relative intensity are different with each other such as the peak at 26.1°. According to the previous studies,18 the crystal data of TiNb6O17 is close to that of Ti2Nb10O29 which shows a classic Wadsley–Roth shear structure. In the lattice of TiNb6O17, all cations (Nb5+ and Ti4+ ions) are disordered in octahedral sites sharing corners and edges, leading to the relative peak intensity discrepancies between the samples and standard pattern.20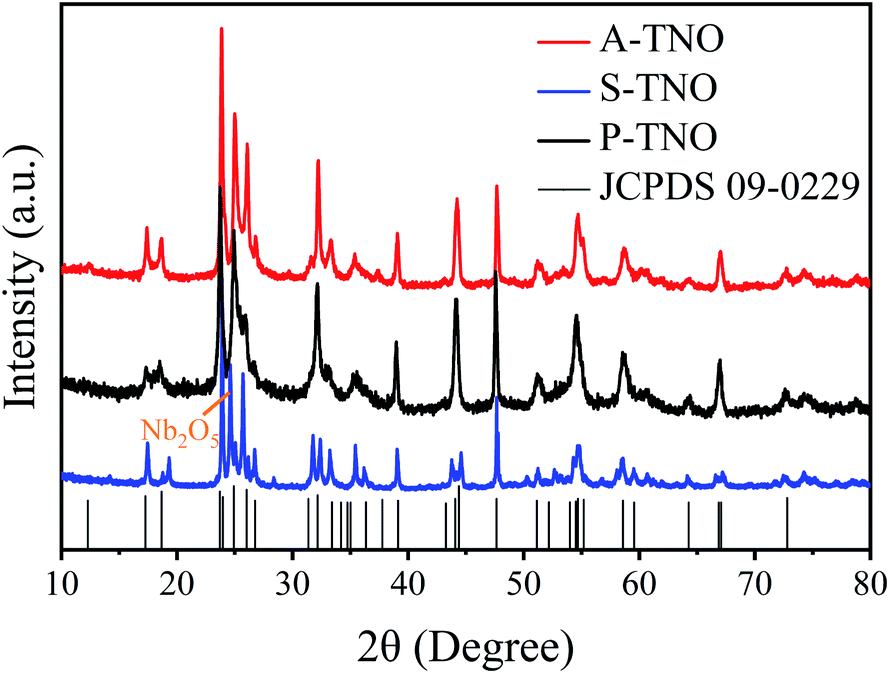 | ||
| Fig. 1 XRD spectra of A-TNO, P-TNO, S-TNO and standard pattern of TiNb6O17 (JCPDS no. 09-0229). | ||
The chemical valences of obtained TiNb6O17 were confirmed by X-ray photoelectron spectrometry (XPS) and the results are shown in Fig. 2. It's clear that all the peaks of A-TNO shift to lower binding energy direction, which can be ascribed to the existence of atoms with lower chemical valence44 (Nb4+ and Ti3+). Fig. 2a displays the O 1s spectra, in which A-TNO shows broader –OH peak at around 532 eV, suggesting the missing of lattice O and the existence of oxygen vacancies.40 Besides, P-TNO powder is white while A-TNO shows a blue-gray color (Fig. S2, ESI†), which indirectly proves the formation of oxygen vacancies on the surface of A-TNO.40,44 The oxygen vacancies can decrease the band gap and charge transfer resistance of TNOs, as well as provide more lithium-ion diffusion paths and increase the lithium-ion transfer coefficient, thus increasing the electrochemical performance. As shown in Fig. 2b, the binding energies at 464.6 eV and 458.8 eV can be assigned to Ti 2p1/2 and Ti 2p3/2 respectively, confirming the oxidation state of Ti4+. And the spectra of Nb 3d is shown in Fig. 2c, the binding energies at 210.1 eV and 207.3 eV can be assigned to Nb 3d3/2 and 3d5/2 respectively, confirming the oxidation state of Nb5+ ions.
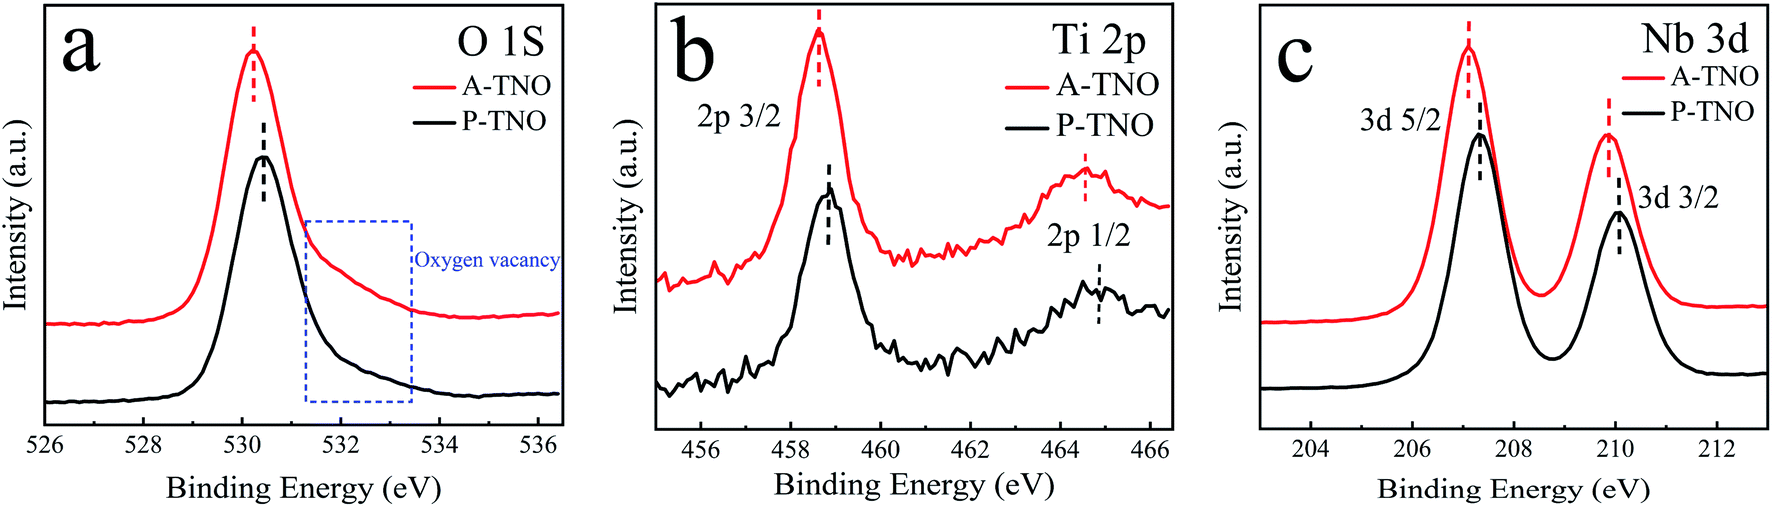 | ||
| Fig. 2 XPS spectra of O 1s (a), Ti 2p (b) and Nb 3d (c) in sample A-TNO and P-TNO. | ||
FESEM is used to characterize the morphology and nanostructure of obtained samples. The results are shown in Fig. 3. Fig. 3a and b is the photo of P-TNO, it can be seen that TNOs synthesized by our improved sol–gel methods are consist of plentiful primary irregular particles whose diameters are about 100–200 nm, and some primary particles may agglomerate together to form cluster. The morphology of A-TNO (Fig. 3c and d) is similar with that of P-TNO, only the agglomeration is less. As a contrast, the morphology of S-TNO is shown in Fig. 3e and f, the dimeters of most primary particles are above 1 μm, which is much bigger than the sol–gel products. Though the crystallinity of S-TNO is good, the uniformity of S-TNO is not as well as that of A-TNO and P-TNO. It is visually that the sol–gel method brings nanosized particles, which can be attributed to the abundant carbon skeletons formed in sol–gel precursor. These carbon skeletons restrain the crystal boundary migration in the progress of the crystal growth during the sinter process, leading to the small primary particles. The nanosized particles can increase the surface contact area between electrode and electrolyte, as well as shorten the diffusion length, thus enhancing the kinetics of lithiation.29 Besides, the EDS mappings (Fig. S3, ESI†) show that the that the Ti, Nb, O and C elements are uniform throughout the nanoparticles. BET tests were carried out to identify the surface areas and pore size distribution of the samples, and the results are shown in Fig. S4 and Table S1.† The specific surface area of A-TNO, P-TNO and S-TNO are 12.3 m2 g−1, 15.9 m2 g−1 and 0.709 m2 g−1, respectively. The A-TNO has a smaller surface area than P-TNO because additional sintering slightly increases the particle size and the carbon coating block some pores. And the BJH desorption average pore width of A-TNO, P-TNO and S-TNO are respectively 17.6 nm, 21.7 nm and 6.11 nm, which backings above conclusion. Besides, the BET results show that there are a large number of mesopores in A-TNO and P-TNO. The porous structure can facilitate fast mass transport and buffer the volume change during charge/discharge progress,45–48 resulting in enhanced kinetics of electrochemical reaction and cycling stability, respectively.
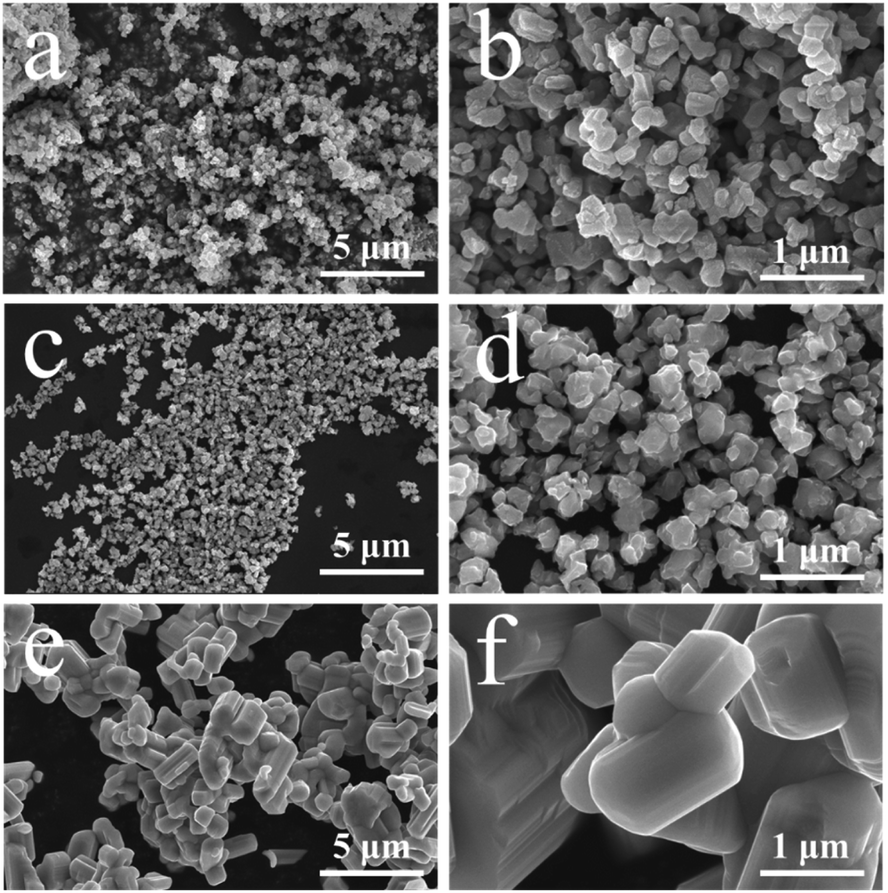 | ||
| Fig. 3 SEM image of P-TNO (a and b), A-TNO (c and d) and S-TNO (e and f). | ||
TEM and SAED are used to confirm the microstructure and phase of A-TNO, as shown in Fig. 4. In Fig. 4a, the irregular primary particles can be clearly distinguished. Fig. 4b and c show the high-resolution images, indicating amorphous substance adhere to the surface of regular crystal structure. The interplane distance of the crystal in Fig. 4b and 5c are 0.376 nm and 0.371 nm, which can be assigned to the (0 1 1) and (−1 1 1) crystal face of TiNb6O17. According to the prepare process, the amorphous substance is most likely to be residual carbon which can enhance interparticle electrical conductivity and improve the rate performance. Fig. 4d shows the SAED result of the crystal structure in A-TNO, in which the TiNb6O17 crystal face of (−1 1 3), (−2 0 6) and (−1 1 5) can be easily distinguished, proving the good crystallinity of the product.
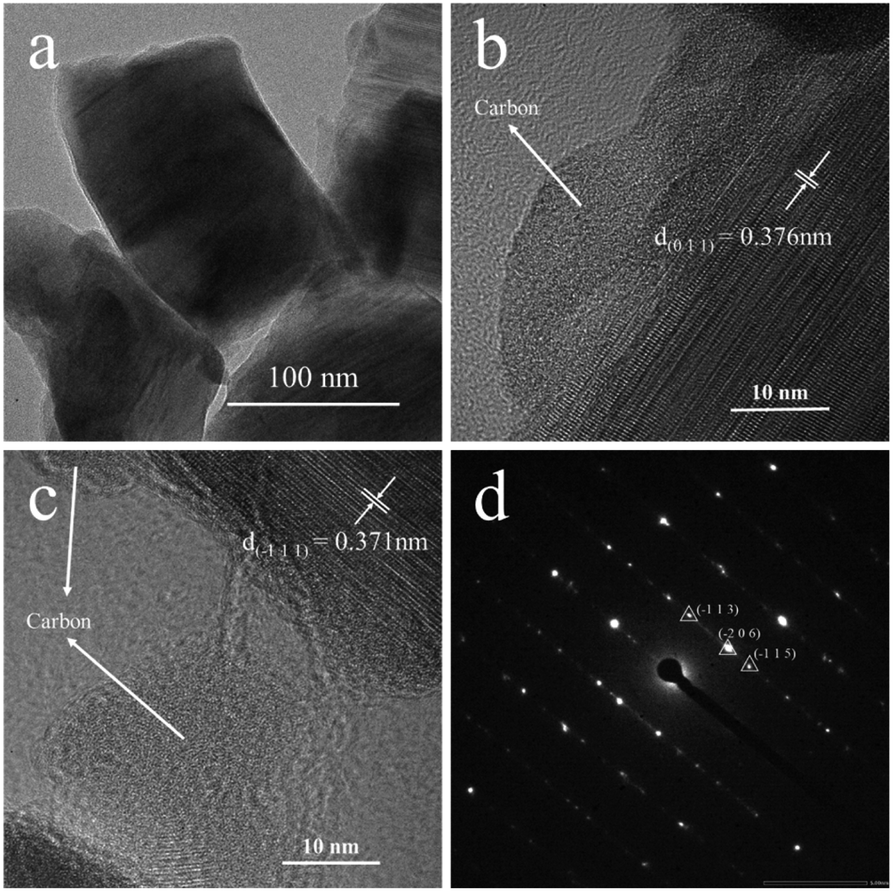 | ||
| Fig. 4 TEM image of A-TNO (a–c) and SAED image of A-TNO (d). | ||
 | ||
| Fig. 5 Raman spectrum of A-TNO and P-TNO. | ||
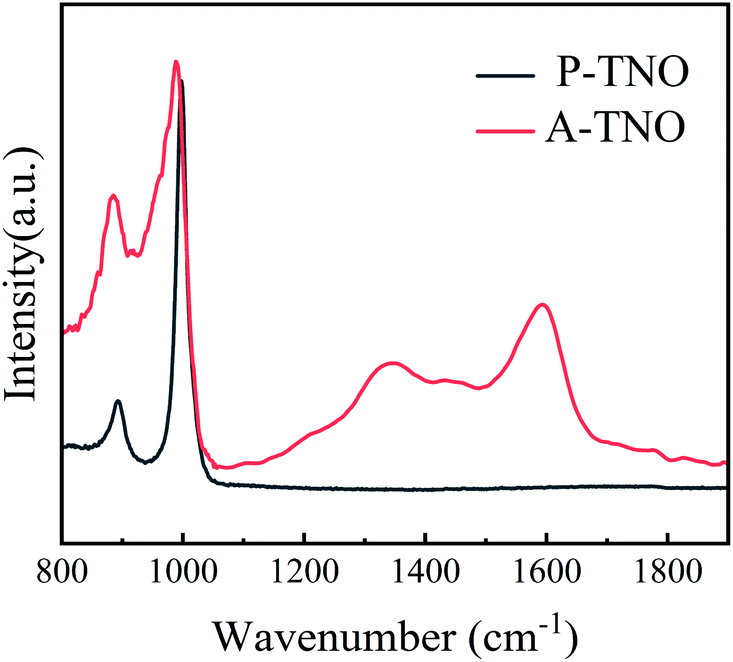
Raman spectrum is carried out to further confirm the existence of amorphous carbon in A-TNO, as shown in Fig. 5. It's clearly that P-TNO have two peaks at wavenumber of 890 and 1001 cm−1, which can be assigned to symmetric metal–oxygen stretching vibrations of corner/edge-shared NbO6 octahedra,34 and no peaks exist in the range of 1100–1800 cm−1. In contrast, the spectrum of A-TNO displays two broaden peaks at around 1335 and 1590 cm−1, which can prove the existence of amorphous carbon in A-TNO. Besides, the peak at around 1000 cm−1 of A-TNO is broadened compared with that of P-TNO. That may be attribute to the carbon coating on the surface of A-TNO which influences the scattering of the oxide.
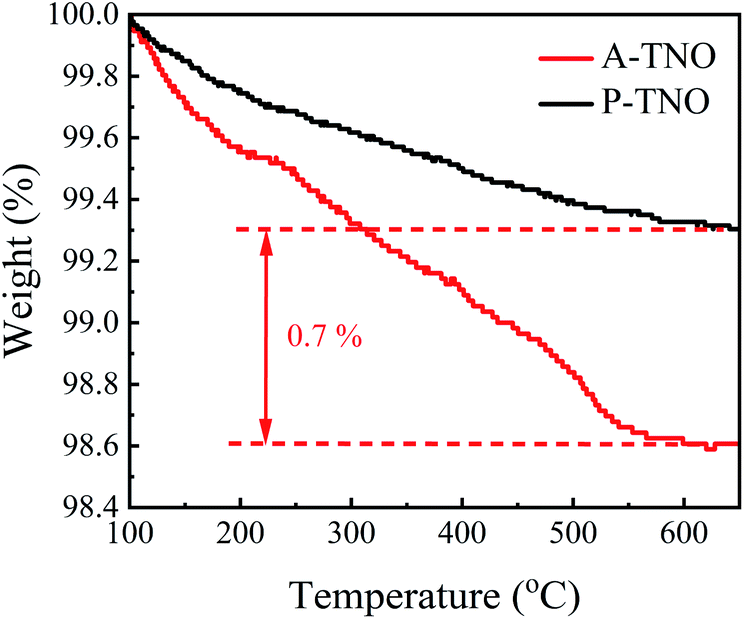
In order to confirm the content of carbon in A-TNO, TG analysis was conducted, the result is shown in Fig. 6. As the increase of heating temperature, the weights of both samples decrease gradually until about 600 °C. The weight decrease of P-TNO is mainly due to the desorption of adsorbed water and gases. Besides the reasons above, the oxidation of amorphous carbon in A-TNO also contributes to its weight decrease. The weight difference between two sample at 600 °C is about 0.7%, so we think the content of carbon in A-TNO is 0.7% in weight.
 | ||
| Fig. 6 TG analysis of A-TNO and P-TNO. | ||
CR2032 coin-type half-cells were fabricated to test the electrochemical performance of obtained TNOs. The results are shown in Fig. 7. Fig. 7a shows the charge/discharge curves of A-TNO at 0.1C in the voltage range of 1–3 V. The initial discharge and charge capacity reaches 274 and 269 mA h g−1, and the coulombic efficiency is 98.2%. The charge/discharge curves of the second and third cycle are almost consistent and very close to that of first cycle. Their coulombic efficiency is nearly 100%, showing wonderful reversibility. The charge/discharge curves of P-TNO are shown in Fig. 7b. The initial discharge and charge capacity reaches 276 and 266 mA h g−1, and the coulombic efficiency is 96.3%. The next two cycles are similar to that of A-TNO with only a little diminution in capacity. The high initial coulombic efficiency of TNOs is due to the absence of SEI film, since their applying voltage range is higher than the SEI formation voltage (∼0.8 V).17 Fig. 7c shows the rate performance of A-TNO, P-TNO and S-TNO. The capacities of the samples decrease gradually as the rate increases from 0.5C to 20C. When the rate returns back to 0.5C, the charge capacities of the three TNOs recover to previous level, indicating the good electrochemical reversibility of TiNb6O17. Apparently, the capacity of A-TNO is much higher than that of P-TNO and S-TNO at all rates. The charge capacities of A-TNO are 256, 251, 236, 220, 208, 177 mA h g−1 at 0.5, 1, 2, 5, 10 and 20C, respectively. By contrast, the capacities of P-TNO and S-TNO at 0.5C and 20C are 247, 154 mA h g−1 and 208, 79 mA h g−1, respectively. It's distinctly that TiNb6O17 synthesized by our improved sol–gel method shows much better rate performance than traditional solid-state reaction products. This can be attributed to three reasons as follows. Firstly, nanocrystallization of primary particles of sol–gel products can increase the contact area with electrolyte and shorten the diffusion length, thus enhancing the diffusion of lithium-ion. Secondly, the carbon coating effectively increases the electrical conductivity of A-TNO, thus improving its rate performance. Thirdly, oxygen vacancies in A-TNO improve the lithium-ion diffusion coefficient, thus enhancing the electrochemical kinetics in the progress of electrode reaction. Compared with previous researches in Table 1, A-TNO in this work has excellent rate performance as well as simple preparation process. Cycling stability of the samples at the rate of 10C is shown in Fig. 7d. The initial charge capacity of the A-TNO at 10C is about 206 mA h g−1. The capacity gradually decreases to 155 mA h g−1 after 500 cycles, and the capacity retention is 75%. By contrast, the charge capacity of the P-TNO decreases from about 174 mA h g−1 to 122 mA h g−1 after 500 cycles, and the capacity retention is 70%. The charge capacity of the S-TNO decreases from about 113 mA h g−1 to 80 mA h g−1 after 500 cycles, and the capacity retention is 71%.
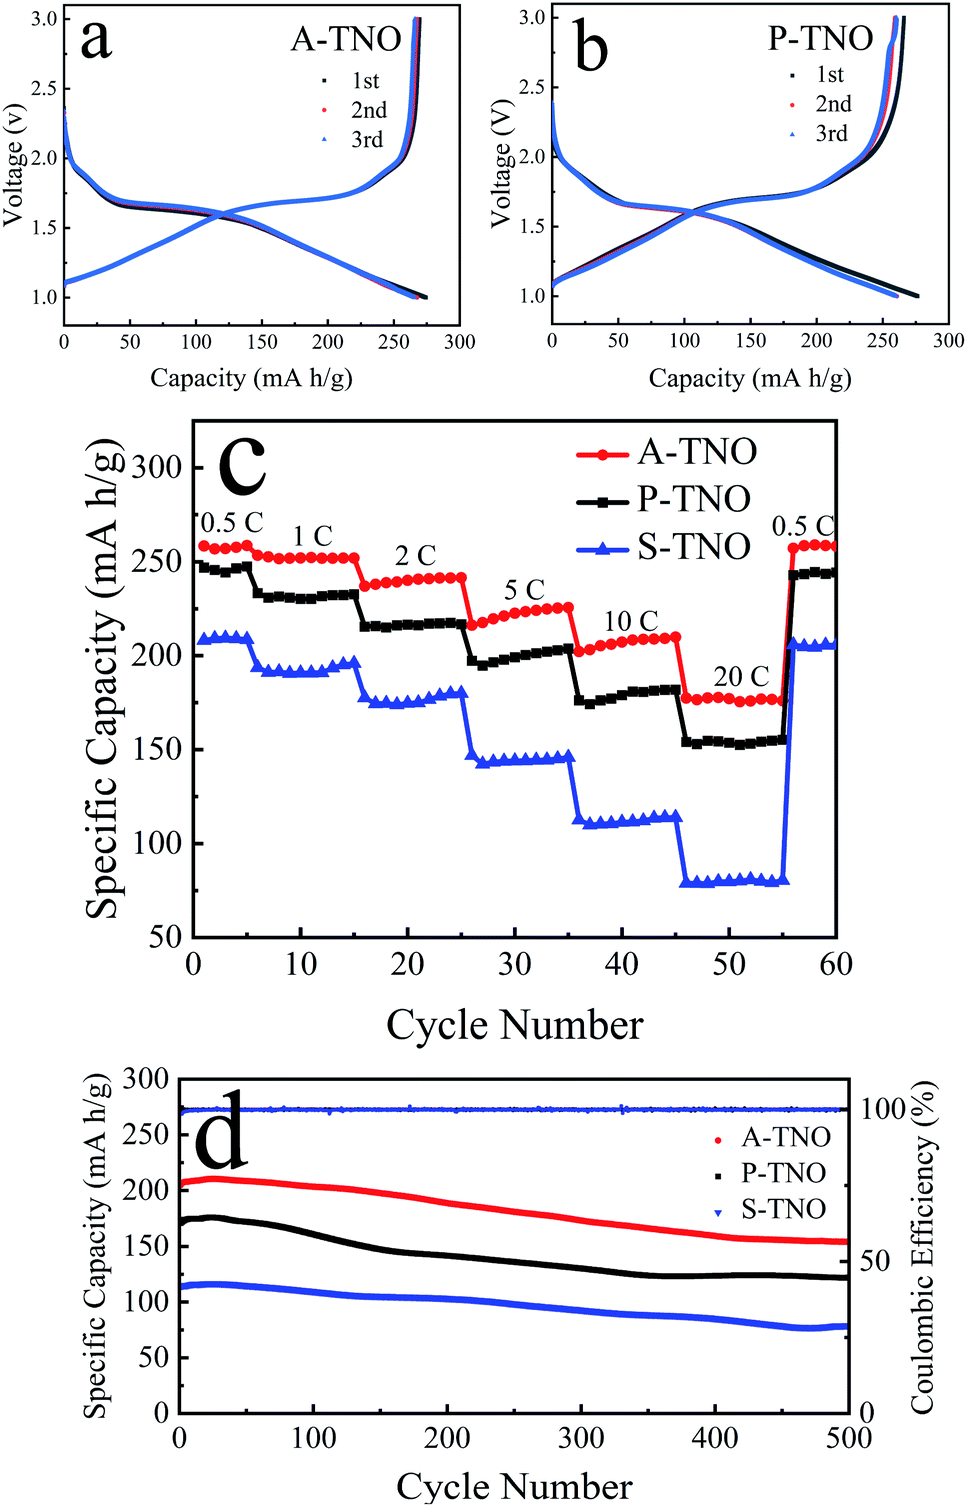 | ||
| Fig. 7 Initial charge/discharge curve of A-TNO (a) and P-TNO (b) at the rate of 0.1C; rate performance of A-TNO, P-TNO and S-TNO (c); cycling stability of A-TNO, P-TNO and S-TNO for 500 cycles at the rate of 10C (d). | ||
| TNOs type | References | Synthetic method | Active material:conductive agent:binder |
Specific capacity at different rate (mA h g−1) | |||
|---|---|---|---|---|---|---|---|
| 1C | 5C | 10C | 20C | ||||
| TiNb6O17 | This study | Sol–gel | 8:1:1 |
251 | 220 | 208 | 177 |
| TiNb6O17 | 34 | Sol–gel | 7:2:1 |
275 | 221 | 194 | 161 |
| TiNb6O17 | 26 | Electrostatic spraying | 8:1:1 |
175 | 151 | 127 | — |
| TiNb6O17 | 37 | Solid-state reaction | 7:2:1 |
239 | 225 | 200 | — |
| TiNb2O7 | 32 | Sol–gel (self-assembly) | 7:2:1 |
260 | 215 | 190 | 162 |
| TiNb2O7 | 17 | Sol–gel | 7.5:2:0.5 |
170 | — | — | — |
| Ti2Nb10O29 | 24 | Solid-state reaction | 6.5:2.5:1 |
280 | 232 | 206 | — |
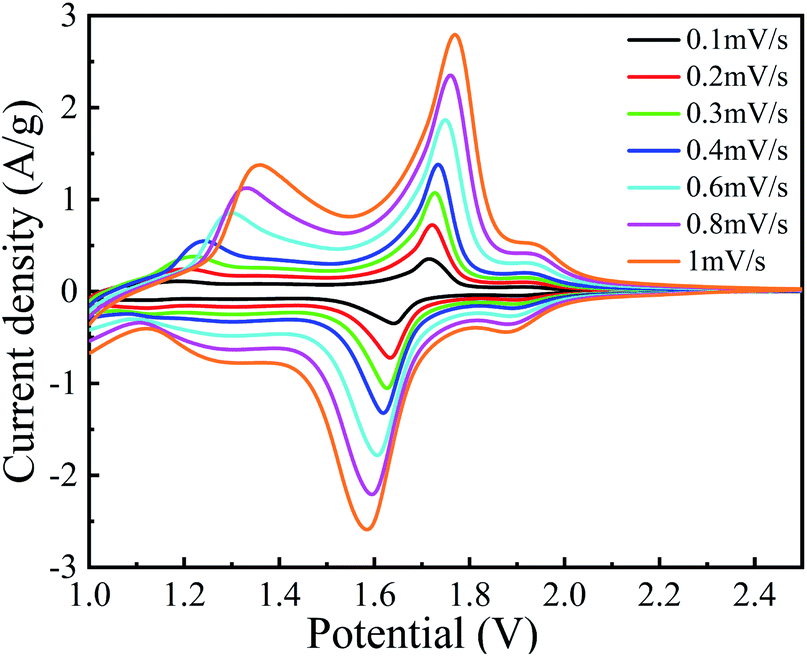
Fig. 8 depicts the C–V curves of A-TNO at the scan speed ranging from 0.1 mV s−1 to 1 mV s−1 and the voltage ranges from 1.0 V to 2.5 V. As the scan rate increases, the gaps between redox peaks slightly increase due to the increased polarization at higher rates. There are three couples of redox peaks can be distinguished. For the curve measured at 0.1 mV s−1, the peak located at 2.1–1.9 V can be assigned to Ti4+/Ti3+ redox couple. Based on the characteristic of multivalent states of Nb, the redox peak located at 1.85–1.65 V can be assigned to Nb5+/Nb4+ redox couple and the wide peak within the range from 1.45–1.1 V can be assigned to Nb4+/Nb3+ redox couple, which is in good agreement with previous literatures.
 | ||
| Fig. 8 C–V curves of A-TNO at different scan speeds. | ||
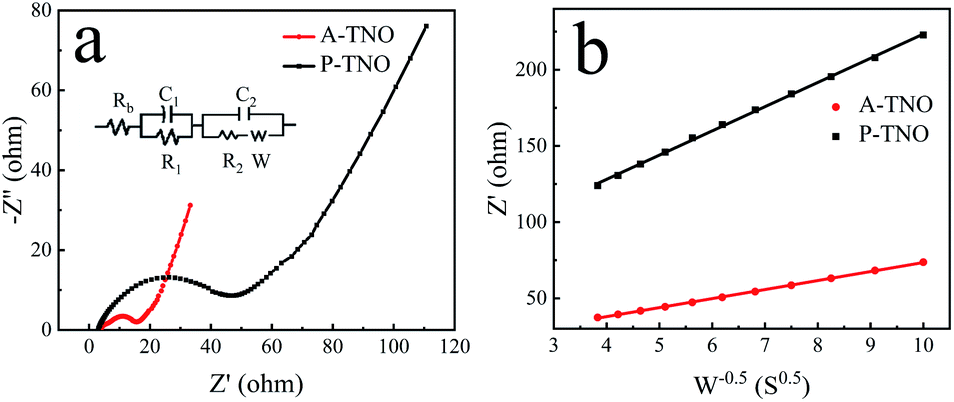
Nyquist plots and equivalent circuit of A-TNO and P-TNO based on EIS measurements are shown in Fig. 9a. In the equivalent circuit, Rb represents the ohmic resistance of the cell; R1 and C1 represent the interface parameters of the electrode, R2 and C2 represent the charge-transfer resistance at the electrode–electrolyte interface; W is the Warburg resistance, reflecting lithium-ion diffusion within bulk crystals. The fitting results of the equivalent circuit are shown in Table S2.† Rb of A-TNO (4.19 Ω) and P-TNO (3.64 Ω) is approximately equal, derived from their same cell structure and electrolyte. The interface parameters affected resistance (R1) of A-TNO (2.92 Ω) is lower than that of P-TNO (9.16 Ω) because the carbon coating and oxygen vacancy on the surface of A-TNO promote lithium-ion adsorption and desolvation process, thus enhancing the electrochemical kinetics on the surface of the anode.27,49,50 The charge-transfer resistance (R2) of A-TNO (6.92 Ω) is significantly smaller than that of P-TNO (29.3 Ω). On account of the carbon coating connects the nanoparticles and enhances the conductivity effectively. Furthermore, the relationship between Z′ and w−1/2 (Fig. 9b) was plotted to determine the lithium-ion diffusion coefficient. The results of the fitted line show that the slope of A-TNO (δA-TNO = 5.9) is much smaller than that of P-TNO (δP-TNO = 15.9). The lithium-ion diffusion coefficient can be calculated by eqn (1) and (2):51
| Z′ = Rb + R1 + R2 + δw−1/2 | (1) |
| D = R2T2/(2C2F4S2δ2) | (2) |
 | ||
| Fig. 9 Nyquist curves of A-TNO and P-TNO at the open-circuit voltage (a); relationship between Z′ and w−0.5 at low frequency of A-TNO and P-TNO (b). | ||
Conclusions
In conclusion, carbon and oxygen vacancy co-modified A-TNO was synthesized through a facile sol–gel reaction with subsequent heat treatment and ball-milling. The primary particle size of A-TNO is 100–200 nm and the carbon content is about 0.7 wt%. A-TNO displays an excellent electrochemical performance. It has an initial charge/discharge specific capacity of 274/269 mA h g−1 with coulombic efficiency of 98.2% at the rate of 0.1C. And it shows a reversible specific capacity of 208 and 177 mA h g−1 at the rate of 10C and 20C respectively. Excellent electrochemical performance of A-TNO can be ascribed to the porous morphology and co-modify effect of carbon and oxygen vacancy. The nanosized primary particles increase the contact area of electrode and electrolyte as well as shorten the diffusion distance of lithium-ion. The existence of carbon fraction and oxygen vacancies in A-TNO efficiently decrease the charge-transfer resistance and enhance the lithium-ion diffusion coefficient. Clearly, this work provides a facile and efficient method which is potential for large-scale production of TNOs. And A-TNO is believed to be a promising anode material for high-rate and secure LIBs.Conflicts of interest
There are no conflicts to declare.Acknowledgements
The financial support from National Natural Science Foundation of China (U20A2072) is greatly acknowledged.References
- K. J. Griffith, Y. Harada, S. Egusa, R. M. Ribas, R. S. Monteiro, R. B. Von Dreele, A. K. Cheetham, R. J. Cava, C. P. Grey and J. B. Goodenough, Chem. Mater., 2020, 33, 4–18 CrossRef.
- Y. Tang, S. Deng, S. Shi, L. Wu, G. Wang, G. Pan, S. Lin and X. Xia, Electrochim. Acta, 2020, 332, 135433 CrossRef CAS.
- Q. Cheng, J. Liang, N. Lin, C. Guo, Y. Zhu and Y. Qian, Electrochim. Acta, 2015, 176, 456–462 CrossRef CAS.
- B. Fang, J. H. Kim, M.-S. Kim and J.-S. Yu, Acc. Chem. Res., 2013, 46, 1397–1406 CrossRef CAS PubMed.
- Y. Xing, Y. Wang, C. Zhou, S. Zhang and B. Fang, ACS Appl. Mater. Interfaces, 2014, 6, 2561–2567 CrossRef CAS PubMed.
- W. Long, B. Fang, A. Ignaszak, Z. Wu, Y.-J. Wang and D. Wilkinson, Chem. Soc. Rev., 2017, 46, 7176–7190 RSC.
- Y. Xing, S. Wang, B. Fang, G. Song, D. P. Wilkinson and S. Zhang, J. Power Sources, 2018, 385, 10–17 CrossRef CAS.
- C. Wang, Y. Zhou, M. Ge, X. Xu, Z. Zhang and J. Z. Jiang, J. Am. Chem. Soc., 2010, 132, 46–47 CrossRef CAS PubMed.
- Y. Xing, S. Wang, B. Fang, Y. Feng and S. Zhang, Microporous Mesoporous Mater., 2018, 261, 237–243 CrossRef CAS.
- C. K. Chan, X. F. Zhang and Y. Cui, Nano Lett., 2008, 8, 307–309 CrossRef CAS PubMed.
- Y.-D. Li, S.-X. Zhao, C.-W. Nan and B.-H. Li, J. Alloys Compd., 2011, 509, 957–960 CrossRef CAS.
- T.-F. Yi, J.-Z. Wu, J. Yuan, Y.-R. Zhu and P.-F. Wang, ACS Sustainable Chem. Eng., 2015, 3, 3062–3069 CrossRef CAS.
- W. Chen, H. Jiang, Y. Hu, Y. Dai and C. Li, Chem. Commun., 2014, 50, 8856–8859 RSC.
- L. Shen, C. Yuan, H. Luo, X. Zhang, K. Xu and Y. Xia, J. Mater. Chem., 2010, 20, 6998–7004 RSC.
- L. Zhao, Y. S. Hu, H. Li, Z. Wang and L. Chen, Adv. Mater., 2011, 23, 1385–1388 CrossRef CAS PubMed.
- R. S. Roth and L. W. Coughanour, J. Res. Natl. Bur. Stand., 1955, 2621 Search PubMed.
- J.-T. Han, Y.-H. Huang and J. B. Goodenough, Chem. Mater., 2011, 23, 2027–2029 CrossRef CAS.
- C. Lin, G. Wang, S. Lin, J. Li and L. Lu, Chem. Commun., 2015, 51, 8970–8973 RSC.
- B. Guo, X. Yu, X.-G. Sun, M. Chi, Z.-A. Qiao, J. Liu, Y.-S. Hu, X.-Q. Yang, J. B. Goodenough and S. Dai, Energy Environ. Sci., 2014, 7, 2220–2226 RSC.
- X. Lu, Z. Jian, Z. Fang, L. Gu, Y.-S. Hu, W. Chen, Z. Wang and L. Chen, Energy Environ. Sci., 2011, 4, 2638–2644 RSC.
- X. Wu, J. Miao, W. Han, Y.-S. Hu, D. Chen, J.-S. Lee, J. Kim and L. Chen, Electrochem. Commun., 2012, 25, 39–42 CrossRef CAS.
- C. Lin, S. Yu, S. Wu, S. Lin, Z.-Z. Zhu, J. Li and L. Lu, J. Mater. Chem. A, 2015, 3, 8627–8635 RSC.
- J. Gao, X. Cheng, S. Lou, Y. Ma, P. Zuo, C. Du, Y. Gao and G. Yin, J. Alloys Compd., 2017, 728, 534–540 CrossRef CAS.
- C. Yang, S. Yu, Y. Ma, C. Lin, Z. Xu, H. Zhao, S. Wu, P. Zheng, Z.-Z. Zhu, J. Li and N. Wang, J. Power Sources, 2017, 360, 470–479 CrossRef CAS.
- N. Luo, G. Chen, Y. Shang, S. Lu, J. Mei, C. Tang, Z. He, W. Zeng and H. Zhan, Nano, 2020, 15, 2050095 CrossRef CAS.
- X. Liu, G. Liu, M. Liu, M. Hu, Y. Hu and J. Ma, J. Alloys Compd., 2019, 787, 344–351 CrossRef CAS.
- S. Deng, Z. Luo, Y. Liu, X. Lou, C. Lin, C. Yang, H. Zhao, P. Zheng, Z. Sun, J. Li, N. Wang and H. Wu, J. Power Sources, 2017, 362, 250–257 CrossRef CAS.
- M. Im, W.-H. Lee, S.-H. Kweon, C.-Y. Kang and S. Nahm, J. Eur. Ceram. Soc., 2019, 39, 1149–1155 CrossRef CAS.
- Y. Yuan, H. Yu, X. Cheng, R. Zheng, T. Liu, N. Peng, N. Long, M. Shui and J. Shu, Chem. Eng. J., 2019, 374, 937–946 CrossRef CAS.
- I. A. Farbun, I. V. Romanova and S. A. Kirillov, J. Sol-Gel Sci. Technol., 2013, 68, 411–422 CrossRef CAS.
- X. Wang, A. Sumboja, E. Khoo, C. Yan and P. S. Lee, J. Phys. Chem. C, 2012, 116, 4930–4935 CrossRef CAS.
- C. Jo, Y. Kim, J. Hwang, J. Shim, J. Chun and J. Lee, Chem. Mater., 2014, 26, 3508–3514 CrossRef CAS.
- S. Lou, Y. Ma, X. Cheng, J. Gao, Y. Gao, P. Zuo, C. Du and G. Yin, Chem. Commun., 2015, 51, 17293–17296 RSC.
- R. Sun, Y. Tao, H. Sun, W. Chen, G. Liu, Y. Yue, M. Hu and M. Liu, J. Mater. Sci., 2019, 54, 14825–14833 CrossRef CAS.
- H. Li, L. Shen, G. Pang, S. Fang, H. Luo, K. Yang and X. Zhang, Nanoscale, 2015, 7, 619–624 RSC.
- X. Xia, S. Deng, S. Feng, J. Wu and J. Tu, J. Mater. Chem. A, 2017, 5, 21134–21139 RSC.
- W. Mao, K. Bao, L. Wang, G. Liu, H. Xie, R. Zhang, S. Zheng, J. Guo, B. Li and W. Wang, Ceram. Int., 2016, 42, 16935–16940 CrossRef CAS.
- N. Takami, K. Ise, Y. Harada, T. Iwasaki, T. Kishi and K. Hoshina, J. Power Sources, 2018, 396, 429–436 CrossRef CAS.
- X. Zhang, S. Deng, Y. Zeng, M. Yu, Y. Zhong, X. Xia, Y. Tong and X. Lu, Adv. Funct. Mater., 2018, 28, 1805618 CrossRef.
- Y. Zhang, M. Zhang, Y. Liu, H. Zhu, L. Wang, Y. Liu, M. Xue, B. Li and X. Tao, Electrochim. Acta, 2020, 330, 135299 CrossRef CAS.
- S. Deng, Y. Zhang, D. Xie, L. Yang, G. Wang, X. Zheng, J. Zhu, X. Wang, Y. Yu and G. Pan, Nano Energy, 2019, 58, 355–364 CrossRef CAS.
- A. V. Potapenko, S. I. Chernukhin, I. V. Romanova, K. S. Rabadanov, M. M. Gafurov and S. A. Kirillov, Electrochim. Acta, 2014, 134, 442–449 CrossRef CAS.
- A. V. Potapenko and S. A. Kirillov, J. Energy Chem., 2014, 23, 543–558 CrossRef.
- H. Song and Y. T. Kim, Chem. Commun., 2015, 51, 9849–9852 RSC.
- Y. Zhang, X. Wang, F. Luo, Y. Tan, L. Zeng, B. Fang and A. Liu, Appl. Catal., B, 2019, 256, 117852 CrossRef CAS.
- S. Yu, S. Song, R. Li and B. Fang, Nanoscale, 2020, 12, 19536–19556 RSC.
- B. Fang, L. Daniel, A. Bonakdarpour, R. Govindarajan, J. Sharman and D. P. Wilkinson, Small, 2021, 17, 2102288 CrossRef CAS PubMed.
- L. Lu, B. Wang, D. Wu, S. Zou and B. Fang, Nanoscale, 2021, 13, 3709–3722 RSC.
- S. Li, X. Cao, C. N. Schmidt, Q. Xu, E. Uchaker, Y. Pei and G. Cao, J. Mater. Chem. A, 2016, 4, 4242–4251 RSC.
- C. Yang, C. Lin, S. Lin, Y. Chen and J. Li, J. Power Sources, 2016, 328, 336–344 CrossRef CAS.
- T.-F. Yi, Y. Xie, Q. Wu, H. Liu, L. Jiang, M. Ye and R. Zhu, J. Power Sources, 2012, 214, 220–226 CrossRef CAS.
Footnote |
| † Electronic supplementary information (ESI) available. See https://doi.org/10.1039/d2ra01757a |
| This journal is © The Royal Society of Chemistry 2022 |