 Open Access Article
Synthesis and characterization of novel dicarbohydrazide derivatives with electrochemical and theoretical approaches as potential corrosion inhibitors for N80 steel in a 3.5% NaCl solution†
Y. M. Abdallah *a,
Ola. A. El-Gammalb,
Hany M. Abd El-Lateefcd and
K. Shalabi
 *b
*b
aDepartment of Dental Biomaterials, Faculty of Oral and Dental Medicine, Delta University for Science and Technology, Gamasa, Egypt. E-mail: dr.ymostafa8@gmail.com; Yasser.Mostafa@deltauniv.edu.eg
bChemistry Department, Faculty of Science, Mansoura University, P.O. Box 70, Mansoura, Egypt. E-mail: dr-kamal@mans.edu.eg
cDepartment of Chemistry, College of Science, King Faisal University, Al-Ahsa 31982, Saudi Arabia. E-mail: hmahmed@kfu.edu.sa
dDepartment of Chemistry, Faculty of Science, Sohag University, Sohag 82524, Egypt
First published on 16th May 2022
Abstract
Two novel ethanoanthracene-11,12-dicarbohydrazide derivatives N′11,N′12-bis((Z)-4-hydroxybenzylidene)-9,10-dihydro-9,10-ethanoanthracene-11,12-dicarbohydrazide (H2HEH) and N′11,N′12-bis((Z)-4-methoxybenzylidene)-9,10-dihydro-9,10-ethanoanthracene-11,12-dicarbohydrazide (H2MEH) were synthesized and characterized by FT-IR spectroscopy, electronic spectra, and NMR spectroscopy. These two derivatives as novel anticorrosion inhibitors for N80 steel in a 3.5% NaCl solution were studied using electrochemical techniques including potentiodynamic polarization (PP), electrochemical impedance spectroscopy (EIS), and electrochemical frequency modulation (EFM). Corrosion parameters and adsorption isotherms were determined from current–potential diagrams (i.e., Tafel slopes). The impact of temperature and inhibitor concentration on the corrosion performance was studied using the PP method. The PP results suggested mixed-type inhibitors. The inhibition prohibition increased and decreased when the dose was increased and the temperature was increased, respectively. The adsorption of the hydrazides on the N80 exterior followed the Langmuir isotherm. The maximum inhibition proficiency for H2MEH and H2HEH were 93.3% and 92.2%, respectively, at 1 × 10⁻⁴ M. Moreover, the investigated surface was studied with the synthesized compounds through X-ray photoelectron spectroscopy (XPS) to confirm the construction of an adsorbed shielding barrier. An evident association was established between the corrosion inhibition proficiency and theoretical variables acquired using the density functional theory (DFT) method and Monte Carlo (MC) simulations. The experimental data were in good agreement with the theoretical results.
1. Introduction
Energy becomes increasingly important as industries, population, and living standards rise. As a result, governments must model and forecast their energy consumption. The variables used in the literature for estimating energy consumption are grouped according to the three primary elements of sustainability: social, economic, and environmental issues. Advancements in corrosion science research are important for the protection of alloys and metals and in the discipline of economics. Particularly, the inhibition of N80 steel corrosion is of interest since this type of steel has been thoroughly applied as the construction material in various industries including chemical, electrochemical, medicinal, nuclear power, petroleum, control, and food manufacturing. The corrosion of steel in oil pipelines is a multifaceted progression that represents significant difficulties. This is because of the confined corrosion, which results from the aggression of certain media. The corrosion is typically minimized by the addition of inhibitors in small concentrations. The most profitable inhibitors are the organic components that include heteroatoms such as sulfur, nitrogen and oxygen.1–3Moreover, various studies have recommended the use of heteroatom-containing organic components with functional groups such as –OH, –NH2, –OCH3, –COOH, –SO3H and benzene rings. These compounds have been found to be potential inhibitors since they can react with a metal or alloy to produce a protective film coating on a tested surface.4–7
Quantum chemical computations have been extensively exploited to survey the mechanisms of corrosion and to explain the experimental data.6 They have been used to elucidate vague chemical results and are found suitable for the understanding of corrosion mechanisms in examined particles on a metal exterior.7 The variables in the preparation and electronics of inhibitor components could be explained by the concepts of theoretical estimation using the computerized approaches of quantum chemistry.8
An appropriate approach to corrosion protection on metals and composites is the addition of organic derivatives to corrosive media.9,10
Furthermore, organic inhibitors that include electron-donating heteroatoms such as –N, –O, –S and π-electrons associated with heterocyclic bonds are strong metals and composite inhibitors in corrosive solutions.11–17 An issue with the utilization of corrosion inhibitors is the adsorption of an inhibitor on the external surfaces of metals and composites from a solution. Consequently, the examinations of organic compounds on corroded carbon steel in acidic corrosive media showed many indentations; thus, they are mostly insufficient.18–20
Carbon steel has been examined using different corrosive media, including: hydrazones,21 anti-tuberculosis drugs,22 Stachys byzantina extracts,23 interfacial assembled mesoporous polydopamine nanoparticles,24 Zn(II)-metal–organic networks using lemon verbena leaf extract,25 2-aminopyridine derivatives,26 and benzodiazepine derivatives.27
The environmental significance of hydrazide derivatives is due to their biocompatibility. Hydrazides have been explored for their corrosion mitigating properties.28 In this study, the effectiveness of hydrazide derivatives as corrosion inhibitors were on the basis of the fact that they have a wide spectrum of medicinal chemistry use due to their biological features such as analgesic and anti-inflammatory effects, which have been well documented in numerous studies.29,30 Isonicotinic acid hydrazide is unquestionably effective in tuberculosis treatment, whereas fatty acid hydrazides have been applied as fabric processing agents.31
In acidic and neutral environments, hydrazide derivatives have been approved as corrosion inhibitors. The corrosion inhibitors, including salicylic acid, anthranilic acid, and benzoic acid hydrazides with AOH, ANH2, and AH as characteristic substituents, have been investigated. The potentiodynamic polarization (PP) technique revealed that they showed a mixed-type inhibitory activity for mild steel corrosion.32 Kumari et al.33 investigated the aromatic hydrazide derivative of 2-(3,4,5-trimethoxybenzylidene) hydrazinecarbothioamide as a mixed-type inhibitor with prohibition efficacy that increased in both cathodic and anodic directions. Ferrocene carboxaldehyde propanoylhydrazone and ferrocene carboxaldehyde furoylhydrazone that were derived from hydrazides,34 aromatic sulfonohydrazides, hydroxy phenyl hydrazide,35 N-[4-(diethylamino)benzylidine]-3-{[8-(trifluoromethyl) quinolin-4-yl]thio}propano hydrazide36 and 2-(2-hydrazinyl-1,6-dihydro-6-oxopyrimidin-4-yl)acetohydrazide,37 have been tested as potential corrosion inhibitors. Here, dicarbohydrazide compounds were chosen as inhibitors since it was clear from the literature that hydrazides efficiently decreased corrosion.
Hence, in this study, we report the synthesis of some novel dicarbohydrazide derivatives and evaluate them as effective corrosion inhibitors for N80 carbon steel in neutral corrosive media (i.e., 3.5% NaCl solution).
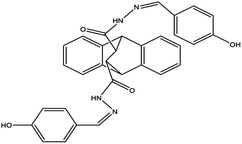
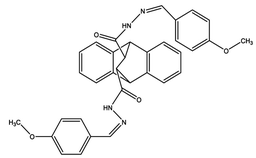
We investigated the synthesis and characterization of two novel hydrazides derivatives including ethanoanthracene-11,12-dicarbohydrazide derivatives N′11,N′12-bis((Z)-4-hydroxybenzylidene)-9,10-dihydro-9,10-ethanoanthracene-11,12-dicarbohydrazide (H2HEH) and N′11,N′12-bis((Z)-4-methoxybenzylidene)-9,10-dihydro-9,10-ethanoanthracene-11,12-dicarbohydrazide (H2MEH). They were tested as corrosion inhibitors of N80 steel in a 3.5% NaCl solution. Characterization methods used include potentiodynamic polarization (PP), electrochemical frequency modulation, EFM, and electrochemical impedance spectroscopy (EIS). In addition, X-ray photoelectron spectroscopy (XPS) was employed to verify the creation of an adsorbed protective film, discuss the mechanism of corrosion, and match the experimental data with the theoretical outcomes achieved from the density functional theory (DFT) calculations and Monte Carlo (MC) simulations.
2. Materials and methods
2.1. Synthesis of the inhibitors
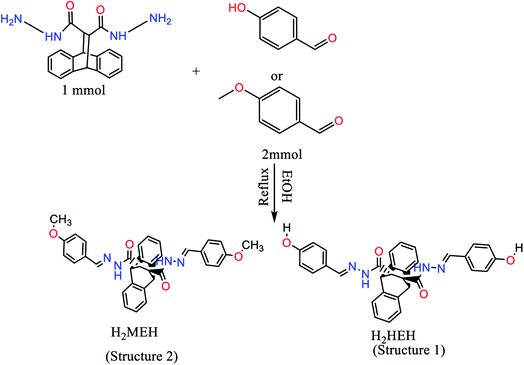
The hydrazides, namely H2HEH and H2MEH (Scheme 1), were synthesized by the dropwise addition of an ethanolic solution of p-methoxybezaldehyde or p-hydroxybenzaldehyde to an ethanolic solution of hydrazide, with 9,10-dihydro-9,10-ethanoanthracene-11,12-dicarbohydrazide in a 2![[thin space (1/6-em)]](https://www.rsc.org/images/entities/char_2009.gif) :
:![[thin space (1/6-em)]](https://www.rsc.org/images/entities/char_2009.gif) 1 molar ratio.38 The reaction mixture was refluxed for 4 h until a white precipitate was obtained. The precipitate was filtered, then rinsed with ethanol, dried and finally, preserved in a vacuum desiccator with anhydrous CaCl2 (m.p. = 260 °C and 280 °C for H2HEH and H2MEH, respectively). Our novel hydrazides were synthesized using ultrapure reagents acquired from the Aldrich-sigma company.
1 molar ratio.38 The reaction mixture was refluxed for 4 h until a white precipitate was obtained. The precipitate was filtered, then rinsed with ethanol, dried and finally, preserved in a vacuum desiccator with anhydrous CaCl2 (m.p. = 260 °C and 280 °C for H2HEH and H2MEH, respectively). Our novel hydrazides were synthesized using ultrapure reagents acquired from the Aldrich-sigma company.
![[double bond, length as m-dash]](https://www.rsc.org/images/entities/char_e001.gif) O)free; 1708 ν(C
O)free; 1708 ν(C![[double bond, length as m-dash]](https://www.rsc.org/images/entities/char_e001.gif) O)bonded; 1565, 1246 and 637 ν(amide I–III); 1322 δ(C–H); 916 δ(N–H); 1608 ν(C
O)bonded; 1565, 1246 and 637 ν(amide I–III); 1322 δ(C–H); 916 δ(N–H); 1608 ν(C![[double bond, length as m-dash]](https://www.rsc.org/images/entities/char_e001.gif) C)phenyl; 1045 ν (N–N); UV-vis in DMF (33
C)phenyl; 1045 ν (N–N); UV-vis in DMF (33![[thin space (1/6-em)]](https://www.rsc.org/images/entities/char_2009.gif) 222, 25
222, 25![[thin space (1/6-em)]](https://www.rsc.org/images/entities/char_2009.gif) 062); 1H NMR (δ, ppm): 3.24 (dd, J = 3.6 Hz, 2H), 4.11, 4.24 (m, 2H), OCH3 3.48 (s, 3H), 3.65 (s, 3H), 7.31 (d, J = 9.0 Hz, 4H), 7.20–7.65 (m, 12H), 8.40 (s, 2H), OH 11.25 (s, 2H); NH 11.25 (s, 1H); azomethine H δ = 8. 75 ppm (s, 2H).
062); 1H NMR (δ, ppm): 3.24 (dd, J = 3.6 Hz, 2H), 4.11, 4.24 (m, 2H), OCH3 3.48 (s, 3H), 3.65 (s, 3H), 7.31 (d, J = 9.0 Hz, 4H), 7.20–7.65 (m, 12H), 8.40 (s, 2H), OH 11.25 (s, 2H); NH 11.25 (s, 1H); azomethine H δ = 8. 75 ppm (s, 2H).![[double bond, length as m-dash]](https://www.rsc.org/images/entities/char_e001.gif) O)free; 1703 ν(C
O)free; 1703 ν(C![[double bond, length as m-dash]](https://www.rsc.org/images/entities/char_e001.gif) O)bonded; 1575, 1266 and 625 ν(amide I–III); 1322 δ(C–H); 918 δ(N–H); 1605 ν(C
O)bonded; 1575, 1266 and 625 ν(amide I–III); 1322 δ(C–H); 918 δ(N–H); 1605 ν(C![[double bond, length as m-dash]](https://www.rsc.org/images/entities/char_e001.gif) C)phenyl; 1040 ν (N–N); UV-vis in DMF (33
C)phenyl; 1040 ν (N–N); UV-vis in DMF (33![[thin space (1/6-em)]](https://www.rsc.org/images/entities/char_2009.gif) 003, 25
003, 25![[thin space (1/6-em)]](https://www.rsc.org/images/entities/char_2009.gif) 308); 1H NMR (δ, ppm): 3.24 (dd, J = 3.6 Hz, 2H), 3.40–3.53 (m, 2H), 3.75 (s, 3H), 3.91 (s, 3H), 6.85 (d, J = 9.0 Hz, 4H), 7.19–7.66 (m, 12H), 8.41, 8.47 (s, 2H, azomethine), NH 11.44 (s, 1H).
308); 1H NMR (δ, ppm): 3.24 (dd, J = 3.6 Hz, 2H), 3.40–3.53 (m, 2H), 3.75 (s, 3H), 3.91 (s, 3H), 6.85 (d, J = 9.0 Hz, 4H), 7.19–7.66 (m, 12H), 8.41, 8.47 (s, 2H, azomethine), NH 11.44 (s, 1H).2.2. Materials and reagents
An N80 steel specimen with a composition (weight%) of C (0.31%), S (0.008%), P (0.01%), Si (0.19%), Mn (0.92%), Cr (0.20%) and Fe (remaining) was used to make a working electrode, which had a rectangular design having a surface area of 1 cm2. The specimen was scraped by applying various grades (up to 1000 grade) of emery papers. It was degreased within propanone solution, purified with double distilled water, and dehydrated with soft tissues. The experiments were conducted in 3.5% NaCl solution before and after adding altered doses of the hydrazide derivatives. The concentrations of the inhibitors used were between 1 × 10⁻⁶ M and 1 × 10⁻⁴ M. Per investigation (Table 1), a new solution that had been freshly prepared was employed.2.3. Electrochemical measurements
Electrochemical trials were performed utilizing a standard three-electrode cell (S4), which included an N80 steel sample as the working electrode and enclosed in an epoxy resin of polytetrafluoroethylene. A saturated calomel electrode (SCE) and a Pt sheet (1 cm2) were used as the reference and auxiliary electrodes, respectively. An SCE was associated with a Luggin capillary where the crown of this capillary was located near the tested electrode to diminish the IR drop. The reaction chamber was opened to the atmosphere and measurements were performed at 25 ± 1 °C. All potential standards were noted vs. SCE. Before each trial, the N80 steel surface was grazed with various grades of emery papers, degreased with a basic solution (15 g Na2CO3 + 15 g Na3PO4 per liter)39 scrubbed in double distilled water, and finally desiccated.Tafel polarization diagrams (PP) were achieved by modifying the potential values between 1100 to −200 mV SCE at a scan rate of 1 mV s−1. The Stern–Geary approach40 was employed for determining the corrosion current and was executed through the inferences of anodic and cathodic Tafel shapes of the charge transfer in the two directions. This was done to give a value that provides (log![[thin space (1/6-em)]](https://www.rsc.org/images/entities/char_2009.gif) icorr) and equivalent corrosion potential (Ecorr) for the blank solution and each dose of the tested compounds. The icorr was applied to calculate the inhibition potency (η%) and surface covering (θ) by the equation below:
icorr) and equivalent corrosion potential (Ecorr) for the blank solution and each dose of the tested compounds. The icorr was applied to calculate the inhibition potency (η%) and surface covering (θ) by the equation below:
 | (1) |
Impedance measurements with an amplitude of 5 mV were carried out in the frequency range of 10 kHz to 0.1 Hz (peak-to-peak through ac signals at OCP).
The impedances were examined and constructed from the corresponding circuits (Fig. 5). The calculated variables from Nyquist plots were the charge transfer resistance (Rct) and the capacity of the double layer (Cdl). The inhibition prohibition (η%) and the surface coverage (θ) data were achieved utilizing the EIS technique and the values were determined according to the equation below:
 | (2) |
 are the charge transfer resistances in the absence and presence of the inhibitor”, accordingly.
At frequencies of 2 and 5 Hz, EFM measurements were performed. Because the base frequency was 0.1 Hz, a wave was replicated in 1 second. The current responses, which were assigned to harmonious and intermodulation current peaks, were included in the intermodulation spectra. The icorr, Tafel slopes (βc and βa), and causality factors were estimated using stronger peaks (CF-2 and CF-3).40
Each electrochemical test was repeated 3 times to emphasize data duplicability.
The electrode potential was stabilized for 30 min prior to each trial. All trials were performed at 25 ± 1 °C. All evaluations were conducted on a Gamry Instrument Potentiostat/Galvanostat/ZRA. This comprised a Gamry framework system that was predicated on the ESA 400. Gamry techniques contained a DC105 for DC corrosion calculations, EIS 300 for EIS, and EFM 140 for EFM calculations. The instrument was connected to a computer for data gathering. The Echem analyst 6.25 software was applied for designing and fitting our data.
2.4. XPS analysis
A high-resolution XPS model K-ALPHA (Thermo Fisher Scientific, USA) with a monochromatic X-ray Al K-alpha radiation was used to study the treated N80 carbon steel (inhibited) in 3.5% NaCl with 1 × 10⁻⁴ M of H2MEH at 25 ± 1 °C.2.5. DFT calculations and MC simulations
Theoretical surveys were achieved using the DMol3 module for DFT estimations. The MC simulations were carried out using an adsorption locator module via the Materials Studio software V.7.0 from Accelrys Inc. USA. In the DFT computations, the forms of the hydrazide derivatives were optimized by applying a B3LYP functional with a DNP base set and COSMO solvation controls. These inputs were described in our earlier work, where numerous quantum parameters for hydrazide derivatives were calculated.41,42For MC simulations, the adsorption locator disclosed the proper adsorption formations of the protonated forms of the hydrazide derivatives by Monte Carlo investigations on Fe (1 1 0) exterior.43 This was to estimate the inhibition efficiency of the hydrazide derivatives. The adsorption of the hydrazide derivatives, water particles, and Fe (1 1 0) exterior was achieved in a simulation box (32.27 Å × 32.27 Å × 50.18 Å) within a periodic boundary tuning. Forcite classical simulation engine was applied to improve the particle energy of the hydrazides.44 The specifics of the relevant computations have been reported recently.41,44
3. Results and discussion
3.1. Characterization of the synthesized hydrazides derivatives
![[double bond, length as m-dash]](https://www.rsc.org/images/entities/char_e001.gif) C) phenyl and ν(C
C) phenyl and ν(C![[double bond, length as m-dash]](https://www.rsc.org/images/entities/char_e001.gif) N), respectively. The strongest band was at 1658 cm−1, which was assigned to a ν(C
N), respectively. The strongest band was at 1658 cm−1, which was assigned to a ν(C![[double bond, length as m-dash]](https://www.rsc.org/images/entities/char_e001.gif) O) mode. The ν(C
O) mode. The ν(C![[double bond, length as m-dash]](https://www.rsc.org/images/entities/char_e001.gif) N)azome was revealed at 1572 cm−1. Finally, the band at 1043 cm−1 was most likely from a to ν(N–N) mode.45 On the other hand, the spectrum (B) of H2MEH (structure 2) shows bands of medium intensity at 3321 and 1613 cm−1 assignable to ν(NH) and ν(C
N)azome was revealed at 1572 cm−1. Finally, the band at 1043 cm−1 was most likely from a to ν(N–N) mode.45 On the other hand, the spectrum (B) of H2MEH (structure 2) shows bands of medium intensity at 3321 and 1613 cm−1 assignable to ν(NH) and ν(C![[double bond, length as m-dash]](https://www.rsc.org/images/entities/char_e001.gif) C)phenyl, respectively.46 The bands appearing as a doublet band at 1662 and 1625 cm−1 due to ν(C
C)phenyl, respectively.46 The bands appearing as a doublet band at 1662 and 1625 cm−1 due to ν(C![[double bond, length as m-dash]](https://www.rsc.org/images/entities/char_e001.gif) O) suggested the presence of the compound in syn and anti-conforms. This assumption is affirmed from the 1H NMR spectrum of this hydrazide (S2) as the signals of all hydrogens were doubled. Additionally, this was further affirmed by the molecular modeling of the title hydrazide, where the two isomers consumed similar binding energies (4043.32, 4043.48 kcal mol−1 for anti and syn isomers, respectively). The bands noted at 1542 and 1353 cm−1 are assigned to the imine group, ν(C
O) suggested the presence of the compound in syn and anti-conforms. This assumption is affirmed from the 1H NMR spectrum of this hydrazide (S2) as the signals of all hydrogens were doubled. Additionally, this was further affirmed by the molecular modeling of the title hydrazide, where the two isomers consumed similar binding energies (4043.32, 4043.48 kcal mol−1 for anti and syn isomers, respectively). The bands noted at 1542 and 1353 cm−1 are assigned to the imine group, ν(C![[double bond, length as m-dash]](https://www.rsc.org/images/entities/char_e001.gif) N)azome and ν(OCH3) vibrational modes while that at 1043 cm−1 refers to the ν(N–N) mode.47 In both hydrazides, the bands due to amide I–III are noted at (1565, 1246 and 637 cm−1) and (1536, 1259 and 643 cm−1) H2MEH and H2HEH, respectively.48
N)azome and ν(OCH3) vibrational modes while that at 1043 cm−1 refers to the ν(N–N) mode.47 In both hydrazides, the bands due to amide I–III are noted at (1565, 1246 and 637 cm−1) and (1536, 1259 and 643 cm−1) H2MEH and H2HEH, respectively.48![[double bond, length as m-dash]](https://www.rsc.org/images/entities/char_e001.gif) N), respectively. The multiplets at δH (ppm) {(6.99–7.04); (7.06–7.16), (7.18–7.34)} and (7.50–7.95), are due to protons of condensed and free aromatic rings of the hydrazide, respectively. Again, the protons of CH groups (CH13, CH14) (structures 1 and 2) appeared at δH 3.10; 3.46 (brs, 2H) and (CH15–CH19) at 4.51; 4.82 ppm (brs, 2H). On the other hand, the spectrum of H2MEH in d6-DMSO (S2) showed signals at 11.73, 11.20 and (9.16, 8.23 ppm) referring to the protons of NH and azomethine groups of syn and anti-isomers (Scheme 2). These signals disappeared upon adding D2O. The signals due to the protons of the condensed and free aromatic rings of the hydrazide moiety are duplicated and revealed the presence of 18 protons, which were observed as multiplets at δH (ppm): {(7.01–7.16); (7.17–7.38), (7.49–7.51)} and (7.54–7.98), respectively. The protons of CH groups (CH13, CH14) (structures 1 and 2) appear at δH 3.32; 3.34 (brs, 2H) and (CH15–CH19) at 4.54; 4.88 ppm (brs, 2H), respectively. The configuration of the only two stereogenic centers C15 and C19 occurred as 15S and 19S, respectively, as a result of the appearance of the two broad singlets for H15 and H19 instead of the two doublets. The signals observed at δH 1.03–1.08 ppm are assignable to the protons of the OCH3 group of the syn and anti-isomers.
N), respectively. The multiplets at δH (ppm) {(6.99–7.04); (7.06–7.16), (7.18–7.34)} and (7.50–7.95), are due to protons of condensed and free aromatic rings of the hydrazide, respectively. Again, the protons of CH groups (CH13, CH14) (structures 1 and 2) appeared at δH 3.10; 3.46 (brs, 2H) and (CH15–CH19) at 4.51; 4.82 ppm (brs, 2H). On the other hand, the spectrum of H2MEH in d6-DMSO (S2) showed signals at 11.73, 11.20 and (9.16, 8.23 ppm) referring to the protons of NH and azomethine groups of syn and anti-isomers (Scheme 2). These signals disappeared upon adding D2O. The signals due to the protons of the condensed and free aromatic rings of the hydrazide moiety are duplicated and revealed the presence of 18 protons, which were observed as multiplets at δH (ppm): {(7.01–7.16); (7.17–7.38), (7.49–7.51)} and (7.54–7.98), respectively. The protons of CH groups (CH13, CH14) (structures 1 and 2) appear at δH 3.32; 3.34 (brs, 2H) and (CH15–CH19) at 4.54; 4.88 ppm (brs, 2H), respectively. The configuration of the only two stereogenic centers C15 and C19 occurred as 15S and 19S, respectively, as a result of the appearance of the two broad singlets for H15 and H19 instead of the two doublets. The signals observed at δH 1.03–1.08 ppm are assignable to the protons of the OCH3 group of the syn and anti-isomers.
(S3) shows the C13-NMR spectrum of H2MEH in d6-DMSO that supported the existence of the investigated hydrazide in tautomeric forms, as all signals are duplicated, revealing the existence of 34 carbon atoms, including two methylene groups at 38.60–40.33, four aliphatic methine groups at 44.90–47.41, four aliphatic methine groups at 45.3 and 46.6, two amidic carbon atoms (C![[double bond, length as m-dash]](https://www.rsc.org/images/entities/char_e001.gif) O) at 171.60,170.60, two azomethine (C
O) at 171.60,170.60, two azomethine (C![[double bond, length as m-dash]](https://www.rsc.org/images/entities/char_e001.gif) N) groups at 169.1, 167.87 and eight aromatic methine groups from 123.20 to 143.34 ppm, respectively.
N) groups at 169.1, 167.87 and eight aromatic methine groups from 123.20 to 143.34 ppm, respectively.
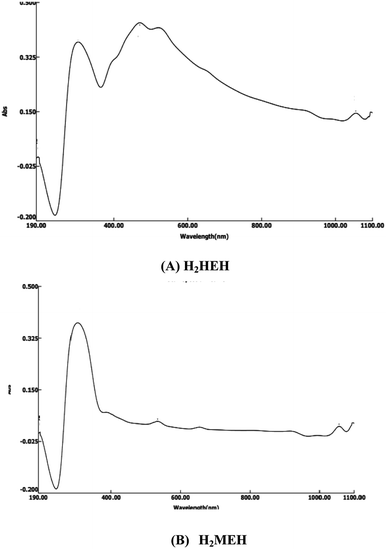
![[thin space (1/6-em)]](https://www.rsc.org/images/entities/char_2009.gif) 003 and 33
003 and 33![[thin space (1/6-em)]](https://www.rsc.org/images/entities/char_2009.gif) 222 cm−1, respectively, equivalent to the π → π* transitions of the benzene rings in the two hydrazides. The bands that appeared as shoulders at 23
222 cm−1, respectively, equivalent to the π → π* transitions of the benzene rings in the two hydrazides. The bands that appeared as shoulders at 23![[thin space (1/6-em)]](https://www.rsc.org/images/entities/char_2009.gif) 154, 21
154, 21![[thin space (1/6-em)]](https://www.rsc.org/images/entities/char_2009.gif) 270 and 19
270 and 19![[thin space (1/6-em)]](https://www.rsc.org/images/entities/char_2009.gif) 047 cm−1 corresponded to π → π* and n → π* transitions. These are characteristics of the carbonyl and azomethine groups.48
047 cm−1 corresponded to π → π* and n → π* transitions. These are characteristics of the carbonyl and azomethine groups.48
3.2. Potentiodynamic polarization curves (PP)
Fig. 2a and b show the change in EOCP vs. time for the inhibited and uninhibited N80 steel in 3.5% NaCl solutions through 30 min. As shown in Fig. 2a and b, the N80 steel in the uninhibited and inhibited systems reach a steady state after dipping for ≈900 s and the values of EOCP exhibit a small modification (<0.001 V vs. SCE). For the inhibited samples with hydrazide derivatives, the values of EOCP altered by less than 85 mV compared with the uninhibited samples for the period of the immersion designating that hydrazide derivatives operate as mixed-type inhibitors. The values of EOCP slightly diminished with an immersion period up to ≈900 s. The unstable period could be known as the dynamic route of desorption and adsorption of the hydrazide derivatives at the interface of N80 steel/NaCl. After an exposure period ≈900s, the EOCP values inclined to a steady-state, demonstrating that the adsorption and desorption of hydrazide's derivatives had touched a stable equilibrium.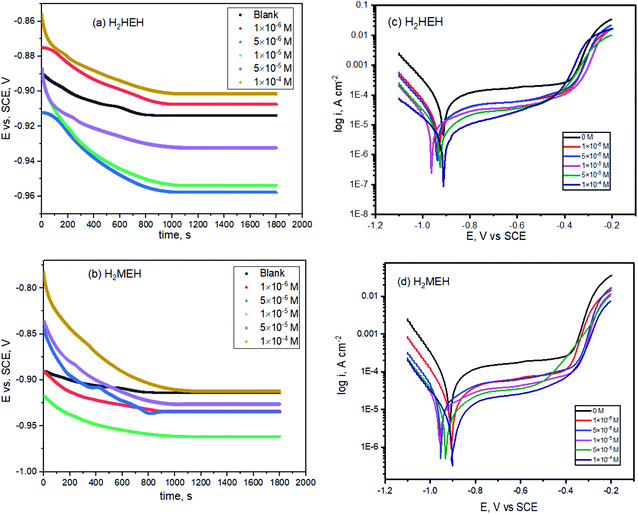 | ||
| Fig. 2 Open circuit diagrams (a, b) and Tafel plots (c, d) for the corrosion of N80 steel in 3.5% NaCl solution in the lack and existence of diverse concentrations of the synthesized hydrazides. | ||
Tafel curves are generally accepted to ensure suitable data on the kinetics of electrochemical corrosion variables. The presence of different concentrations of the prepared hydrazides changed each anodic plot and cathodic plot, as shown in Fig. 2c and d. These diminished the corrosion current density values, thereby creating a notable lowering in the corrosion rate values.
The anodic and cathodic current responses were reduced in the presence of compound I, as shown in Fig. 2. This influenced the expansions with the increase in the concentrations of H2HEH and H2MEH. The addition of H2HEH and H2MEH lowered the anodic dissolution of N80 specimens and delayed the cathodic oxygen reduction processes. The cathodic reaction in neutral solution (3.5% NaCl) consists of the reduction of oxygen into OH− ions:
This performance was assigned to the adsorption of the H2HEH and H2MEH inhibitors on the active spots of the studied N80 steel sample.
The corrosion kinetic variables, including the corrosion potential (Ecorr), anodic Tafel slope (βa), cathodic Tafel slope (βc) and corrosion current density (icorr) were acquired from the PP figures and the data indicated in Table 2. The inhibition proficiency (η%) was considered by eqn (1).49
| Comp | Conc, M | −Ecorr, mV | icorr, μA cm−2 | βa, mV dec−1 | βc, mV dec−1 | C.R. mmy−1 | θ | η% |
|---|---|---|---|---|---|---|---|---|
| Blank | 0.00 | 915 | 113.0 ± 5.65 | 1512 | 152 | 51.46 | — | — |
| H2HEH | 1 × 10⁻⁶ | 906 | 33.1 ± 2.31 | 999 | 142 | 15.12 | 0.707 | 70.7 |
| 5 × 10⁻⁶ | 954 | 30.4 ± 3.04 | 1026 | 139 | 13.87 | 0.731 | 73.1 | |
| 1 × 10⁻⁵ | 958 | 21.0 ± 1.95 | 1042 | 138 | 9.61 | 0.814 | 81.4 | |
| 5 × 10⁻⁵ | 931 | 15.4 ± 1.50 | 844 | 142 | 7.04 | 0.864 | 86.4 | |
| 1 × 10⁻⁴ | 902 | 8.8 ± 0.08 | 613 | 150 | 4.02 | 0.922 | 92.2 | |
| H2MEH | 1 × 10⁻⁶ | 933 | 30.1 ± 2.65 | 1025 | 135 | 13.74 | 0.734 | 73.4 |
| 5 × 10⁻⁶ | 939 | 27.0 ± 2.70 | 883 | 133 | 12.32 | 0.761 | 76.1 | |
| 1 × 10⁻⁵ | 962 | 18.4 ± 1.20 | 956 | 127 | 8.39 | 0.837 | 83.7 | |
| 5 × 10⁻⁵ | 928 | 14.0 ± 0.96 | 757 | 144 | 6.41 | 0.876 | 87.6 | |
| 1 × 10⁻⁴ | 911 | 7.6 ± 0.07 | 524 | 182 | 3.45 | 0.933 | 93.3 |
In the presence of H2HEH and H2MEH, the corrosion rate reduced, as exhibited in Fig. 2. The compounds also inhibit the cathodic hydrogen evolution and anodic metal dissolution reactions.50–52 The changes in the values of βa and βc in the attendance of the compounds suggested the occurrence of the anodic metal dissolution and cathodic oxygen reduction processes. In the cathodic reaction, the inhibitor molecules were chemically adsorbed and retarded the O2 reduction, while in the anodic reaction, the inhibitor molecules were physically adsorbed and hindered the dissolution of N80 metal. Furthermore, the high value of the anodic Tafel slope (βa) is attributed to the oxide layer (passive layer) as a result of the oxygen existence in the solution that is more stabilized by the existence of inhibitors.53 The reactions were enhanced by the increase in the concentration of the compounds. A shift in the values of Ecorr at about 62 mV implied that the H2HEH and H2MEH compounds acted as mixed-type inhibitors.54 The values of icorr decreased from 113.0 to 7.6 mA cm−2 with the increase in the concentration of the compound. The inhibition efficacy was augmented to 93.3% owing to the adsorption of the inhibitors, which hindered the active sites on the N80 steel exterior. Additionally, the surface area that was accessible for Cl− ions was reduced.55
3.3. EIS measurements
EIS extents were used to examine the components of the inhibition effect and the kinetics of the corrosion reactions. The surface characteristics, N80 steel kinetics and mechanical properties were obtained from the impedance plots. Fig. 3 was delineated from the Nyquist diagrams for the N80 steel in 3.5% NaCl in the presence and absence of diverse concentrations of (a) H2HEH and (b) H2MEH. Fig. 4 delineated from the Bode diagrams of the N80 steel in 3.5% NaCl with and without different concentrations of (a) H2HEH and (b) H2MEH acquired at the OCP.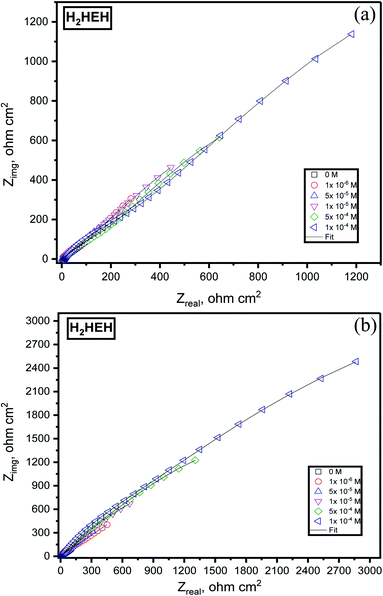 | ||
| Fig. 3 Nyquist plots for the corrosion of N80 steel in 3.5% NaCl solution without and with various diverse synthesized hydrazides (a) H2HEH and (b) H2MEH. | ||
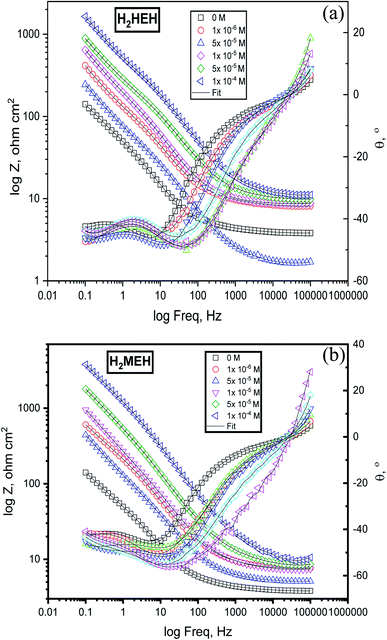 | ||
| Fig. 4 Bode diagrams for the corrosion of N80 steel in 3.5% NaCl solution before and after adding altered doses of the synthesized hydrazides (a) H2HEH and (b) H2MEH. | ||
The Nyquist diagrams were examined to be single capacitive loops suited with a one-time constant (i.e., that seemed to be a single capacitive loop).56 The capacitive loop at the high-frequency area is assigned to the corrosion product/inhibitor film, and the capacitive loop at the middle-frequency area is assigned to the charge transfer reaction at the electrode/solution interface.57 The size of the capacitive loop was found to rise with concentrations of the H2HEH and H2MEH. This was ascribed to the enlargement in the surface that was covered by the examined inhibitors on the N80 steel sample exterior.58 To elucidate the frequency-independent phase change within the used alternating potential and current response, a constant phase element (CPE) was replaced by a double layer capacitance (Cdl). Additionally, phase angle vs. log frequency in Bode diagrams presenting two-phase crests are associated with the relaxation process of the electrical double layer capacitor and adsorbed H2HEH and H2MEH.59 Furthermore, an incessant increase in the phase angle at high frequencies with rising the H2HEH and H2MEH concentrations indicates the growth of the adsorbed layer on the N80 steel surface.60
The EIS measurements of the examined components were assayed through the corresponding model shown in Fig. 5, which provided a single charge transfer reaction. The model was discovered to be in fit accordance with the obtained experimental data. The CPE was included in this model as opposed to a Cdl to provide a more appropriate fitting.61 The Cdl that comprised a CPE exponent (Y0 and n) were used in the formula below:62
| Cdl = Y0(ωmax)n−1 | (3) |
Table 3 provides the impedance evidence. The value of Rct increased with the increase in the concentrations of H2HEH and H2MEH, suggesting an upturn in the inhibition efficacy (η%).
| Comp | Conc., M | Rf, Ω cm2 | Rct, Ω cm2 | CPE1 | CPE2 | Cdl, μF | θ | η% | ||
|---|---|---|---|---|---|---|---|---|---|---|
| Y0, μΩ−1 s cm−2 | n | Y0, μΩ−1 s cm−2 | n | |||||||
| Blank | 0.00 | 130 | 565.5 ± 28.27 | 2.48 | 0.660 | 4.26 | 0.903 | 2.23 | — | — |
| H2HEH | 1 × 10⁻⁶ | 223 | 1436 ± 71.8 | 1.17 | 0.653 | 2.08 | 0.917 | 1.23 | 0.606 | 60.6 |
| 5 × 10⁻⁶ | 254 | 1785 ± 124.9 | 1.64 | 0.669 | 1.60 | 0.710 | 0.15 | 0.683 | 68.3 | |
| 1 × 10⁻⁵ | 352 | 2705 ± 135.2 | 0.83 | 0.679 | 0.64 | 0.796 | 0.13 | 0.791 | 79.1 | |
| 5 × 10⁻⁵ | 466 | 3238 ± 226.6 | 0.48 | 0.664 | 0.50 | 0.804 | 0.10 | 0.825 | 82.5 | |
| 1 × 10⁻⁴ | 472 | 6745 ± 337.2 | 0.20 | 0.668 | 0.26 | 0.810 | 0.06 | 0.916 | 91.6 | |
| H2MEH | 1 × 10⁻⁶ | 282 | 1889 ± 151.1 | 1.63 | 0.650 | 2.04 | 0.806 | 0.54 | 0.701 | 70.1 |
| 5 × 10⁻⁶ | 271 | 2012 ± 201.2 | 1.82 | 0.689 | 4.05 | 0.611 | 0.19 | 0.719 | 71.9 | |
| 1 × 10⁻⁵ | 368 | 3055 ± 183.3 | 0.92 | 0.700 | 1.40 | 0.689 | 0.12 | 0.815 | 81.5 | |
| 5 × 10⁻⁵ | 396 | 3875 ± 232.5 | 0.50 | 0.680 | 1.10 | 0.669 | 0.07 | 0.854 | 85.4 | |
| 1 × 10⁻⁴ | 560 | 7285 ± 364.3 | 0.27 | 0.681 | 0.60 | 0.666 | 0.04 | 0.922 | 92.2 | |
The values of Cdl and Y0 diminished in the presence of the H2HEH and H2MEH, as can be seen from Table 3 and this reduction in the CPE/Cdl values was accompanied by a decrease in the local dielectric constants. The current situation is due to the exchange of water particles by H2HEH or H2MEH inhibitors by the adsorption process at the metal/acid interface, impeding the N80 steel corrosion.66,67
3.4. EFM measurements
EFM is a non-destructive method that measures the corrosion rate immediately in a short time. It can accurately provide values without having any prior knowledge of the corrosion current of the Tafel constants. Usually, the corrosion rates decided from the EFM technique are greater than the values obtained from other methods that show low corrosion rates.68The intermodulation spectra acquired from EFM of the N80 steel corrosion in a 3.5% NaCl medium in the absence and presence of H2HEH and H2MEH are demonstrated in Fig. 6 and 7, respectively.
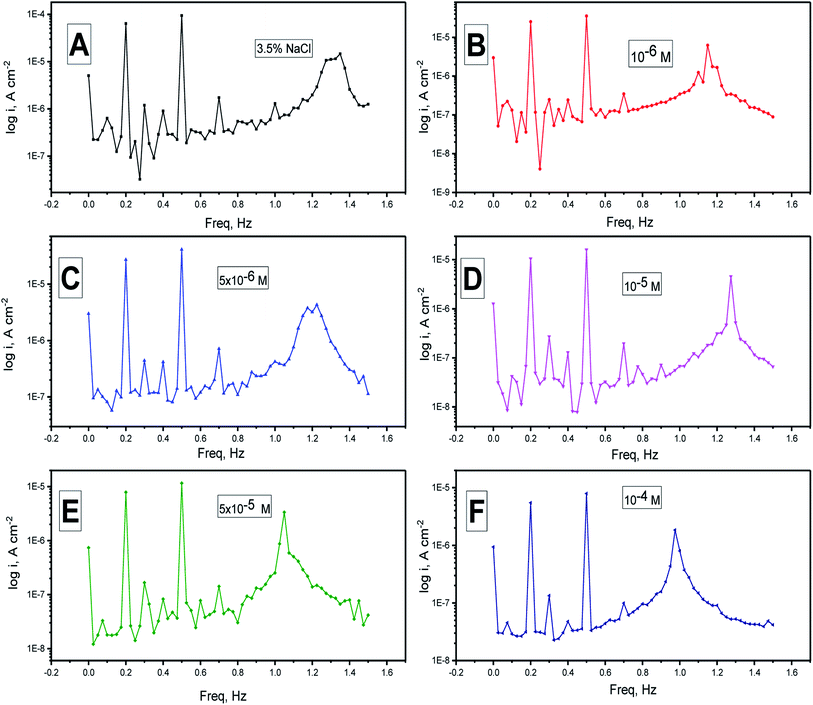 | ||
| Fig. 6 (A–F) Electrochemical frequency modulation spectra for the corrosion of N80 steel in a 3.5% NaCl medium in the lack and presence of different doses of the H2HEH at 25 °C. | ||
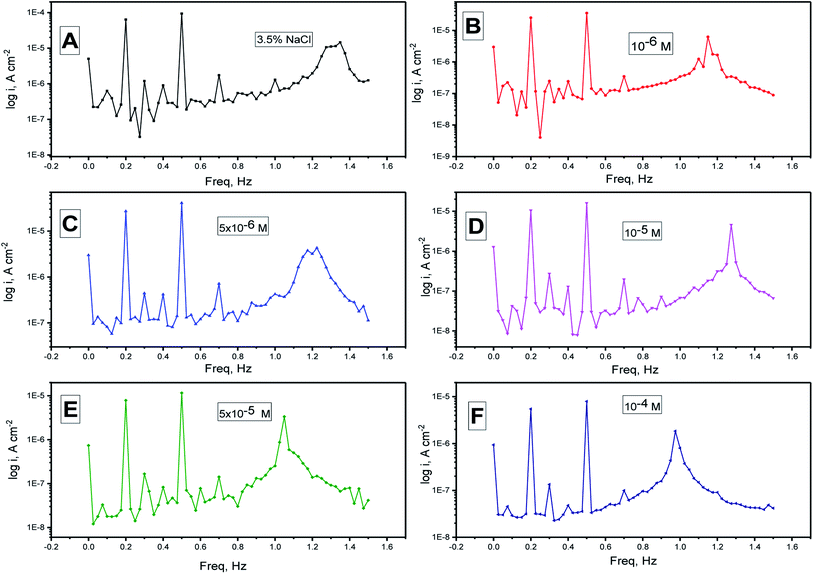 | ||
| Fig. 7 (A–F) Electrochemical frequency modulation spectra for the corrosion of N80 steel in a 3.5% NaCl medium in the absence and presence of altered doses of the H2MEH at 25 °C. | ||
Table 4 summarizes the values for the corrosion kinetic variables under study at various concentrations of H2HEH and H2MEH in 3.5% NaCl solution at 25 ± 1 °C (icorr, βa, βc, CF-2, CF-3, and η% calculated from eqn (1)). The corrosion current densities were reduced with the increase in the concentrations of the inhibitors. The inhibition prohibition was high at high concentrations of the H2HEH and H2MEH.
| Comp | Conc, M | icorr, μA | βa (mV dec−1) | βc (mV dec−1) | C.R (mpy) | CF-2 | CF-3 | θ | η% |
|---|---|---|---|---|---|---|---|---|---|
| Blank | 0.00 | 132.4 ± 7.94 | 803 | 117 | 60.46 | 2.32 | 3.13 | — | — |
| H2HEH | 1 × 10⁻⁶ | 40.2 ± 3.87 | 814 | 109 | 18.34 | 2.01 | 2.13 | 0.696 | 69.6 |
| 5 × 10⁻⁶ | 36.2 ± 2.87 | 868 | 103 | 16.83 | 2.37 | 2.74 | 0.727 | 72.7 | |
| 1 × 10⁻⁵ | 25.0 ± 2.14 | 815 | 131 | 11.42 | 2.39 | 3.41 | 0.811 | 81.1 | |
| 5 × 10⁻⁵ | 18.9 ± 1.32 | 820 | 136 | 8.670 | 1.89 | 3.33 | 0.857 | 85.7 | |
| 1 × 10⁻⁴ | 10.1 ± 1.01 | 893 | 103 | 4.596 | 1.70 | 3.18 | 0.924 | 92.4 | |
| H2MEH | 1 × 10⁻⁶ | 36.7 ± 2.86 | 834 | 178 | 16.75 | 2.25 | 2.88 | 0.723 | 72.3 |
| 5 × 10⁻⁶ | 33.6 ± 3.36 | 821 | 132 | 15.32 | 2.26 | 3.19 | 0.746 | 74.6 | |
| 1 × 10⁻⁵ | 23.3 ± 1.89 | 829 | 142 | 10.66 | 1.87 | 3.12 | 0.824 | 82.4 | |
| 5 × 10⁻⁵ | 17.2 ± 1.32 | 816 | 128 | 7.856 | 2.40 | 2.85 | 0.870 | 87.0 | |
| 1 × 10⁻⁴ | 8.4 ± 0.84 | 824 | 139 | 3.828 | 2.23 | 2.45 | 0.937 | 93.7 |
The CF-2, CF-3 values are provided in Table 4. These values were not far from the expected values that were consistent with the EFM theory.69 The values coincided with the power of the Tafel slopes and the corrosion current densities. The CF-2 and CF-3 values in Table 4 show that the evaluated values were well attributed. The regular values for CF-2 and CF-3 were 2 and 3, accordingly. The diversion of causality factors from its perfect values was most likely a result of the disturbance amplitude, which was insufficient, or the frequency spectrum resolution was low. Additionally, the inhibition was not carried out appropriately. The inhibition efficiency assessed from PP, EIS and EFM was acceptable.
3.5. Adsorption isotherm
The adsorption isotherm model was used with the assumption that the inhibition potency was mostly because of the adsorption of the inhibitor at the metal/solution interface. Adsorption isotherms for H2HEH and H2MEH were measured on the N80 steel surface. To achieve an isotherm model, the small surface covering values (θ) as a function of H2HEH and H2MEH concentration was acquired. The values of θ were obtained from PP measurements using the equation below :70
 | (4) |
 are the corrosion current density values without and with H2HEH or H2MEH”, respectively.
Experiments were conducted to appropriate the experimental results to different isotherms involving Freundlich (R2 = 0.718, for H2HEH and R2 = 0.798 for H2MEH), Frumkin (R2 = 0.368, for H2HEH and R2 = 0.464 for H2HEH), Temkin (R2 = 0.799, for H2HEH and R2 = 0.789 for H2MEH) and Flory–Huggins (R2 = 0.842 for H2HEH and R2 = 0.889 for H2MEH). Most of the data followed the Langmuir adsorption isotherm as evidenced in Fig. 8.71
 | (5) |
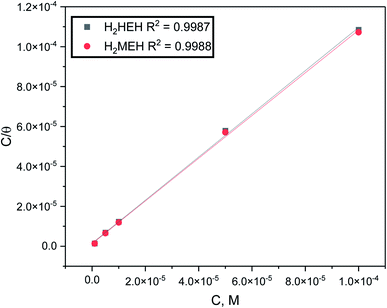 | ||
| Fig. 8 Langmuir isotherm curve for N80 steel corrosion in 3.5% NaCl medium with different doses of the synthesized hydrazides at 25 °C. | ||
As shown in Fig. 8, the plot of C/θ against C showed a straight line with an adjusted coefficient of R2, nearly equal to unity. This revealed that H2HEH and H2MEH followed a Langmuir isotherm and there is a small connection within the adsorbed particles. Additionally, the  , or free energy of adsorption, were assessed using the equation below:72
 | (6) |
 .
.
The higher values of the adsorption constant suggested strong adsorption between H2HEH or H2MEH and the N80 steel surface. Moreover,  values of −36.87 and −37.14 kJ mol−1 demonstrated the spontaneous adsorption of the synthesized hydrazides; thus, the adsorption types on the N80 steel exterior were physisorption and chemisorption.73
3.6. Effect of temperature (kinetic-thermodynamic corrosion parameters)
The PP technique was used at various temperatures from 25 °C to 50 °C with 1 × 10⁻⁴ M of H2HEH or H2MEH (Fig. 9). The corrosion rates increased with the upsurge in temperature (Table 6). The corrosion rate of N80 steel without the compounds under study increased sharply from 25 °C to 50 °C. In the occurrence of the inhibitors, the corrosion rates reduced gradually. The prohibition potency was reduced by the increase in temperature indicating the physisorption of the additives on the N80 steel surface. Table 6 summarizes the corrosion parameters with and without the inhibitors in the temperature region of 25–50 °C. The inhibition prohibition was reduced with the increment in the temperature. The activation energy for the dissolution of the N80 steel in a 3.5% NaCl corrosive medium was studied using the slope of the diagrams by the Arrhenius equation below.
 | (7) |
 is the activation energy, R is the universal gas constant, T is the absolute temperature and A is the Arrhenius pre-exponential element”.
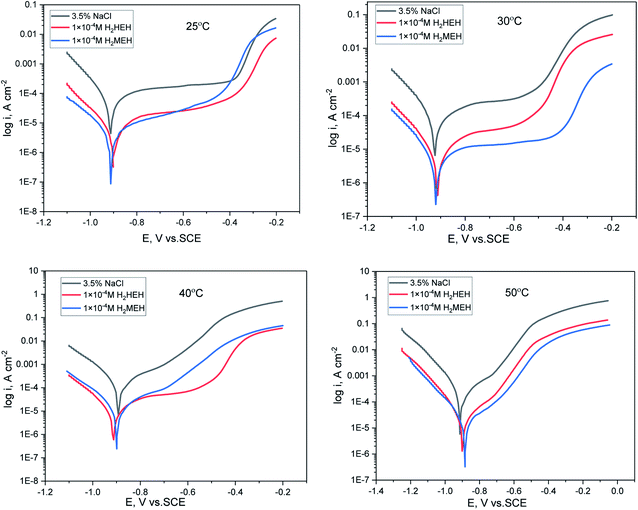 | ||
| Fig. 9 Anodic and cathodic polarization plots for the corrosion of N80 steel in 3.5% NaCl solution in the lack and existence of 1 × 10⁻⁴ M concentration of the synthesized hydrazides. | ||
| Temp, C° | Compound | −Ecorr, mV | icorr, μAcm−2 | βa, mV dec−1 | βc, V dec−1 | C.R. mmy−1 | θ | η% |
|---|---|---|---|---|---|---|---|---|
| 25 | Blank | 915 | 113.0 | 1512 | 152 | 51.46 | — | — |
| H2HEH | 902.0 | 8.8 | 613 | 150 | 4.02 | 0.877 | 87.7 | |
| H2MEH | 911.0 | 7.6 | 524 | 182 | 3.45 | 0.922 | 92.2 | |
| 30 | Blank | 925.0 | 126.0 | 700 | 134 | 57.33 | — | — |
| H2HEH | 914.0 | 14.1 | 536 | 154 | 6.44 | 0.788 | 78.8 | |
| H2MEH | 919.0 | 10.6 | 1858 | 158 | 4.86 | 0.841 | 84.1 | |
| 40 | Blank | 893.0 | 161.0 | 233 | 123 | 73.42 | — | — |
| H2HEH | 914.0 | 18.6 | 511 | 149 | 8.49 | 0.729 | 72.9 | |
| H2MEH | 900.0 | 13.6 | 210 | 130 | 6.19 | 0.790 | 79.0 | |
| 50 | Blank | 915.0 | 189.0 | 244 | 115 | 86.33 | — | — |
| H2HEH | 899.0 | 20.4 | 177 | 117 | 9.32 | 0.729 | 72.9 | |
| H2MEH | 885.0 | 15.8 | 196 | 129 | 7.23 | 0.790 | 79.0 |
By designing (log![[thin space (1/6-em)]](https://www.rsc.org/images/entities/char_2009.gif) k) versus (1/T), the values of
k) versus (1/T), the values of  were acquired from the previous equation:
  (Fig. 10). The activation energy for the corrosion of N80 C-steel in 3.5% NaCl corrosive solution increased in the attendance of H2HEH and H2MEH (Table 7). The increase in
  suggested a structure of energy obstruction. The rate augments in the existence of the inhibitors were higher than those in the absence of corrosive media. Thus, the prohibition tendency of H2HEH and H2MEH lessened with a rise in the temperature.
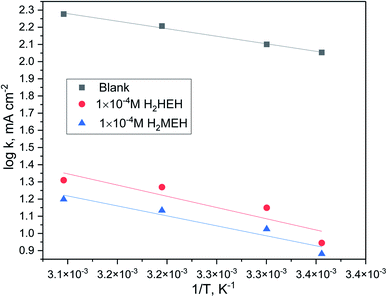 | ||
Fig. 10 log![[thin space (1/6-em)]](https://www.rsc.org/images/entities/char_2009.gif) k (corrosion rate) vs. 1/T plot for N80 steel in 3.5% NaCl medium in the lack and existence of 1 × 10⁻⁴ M concentration of the investigated hydrazides. k (corrosion rate) vs. 1/T plot for N80 steel in 3.5% NaCl medium in the lack and existence of 1 × 10⁻⁴ M concentration of the investigated hydrazides. | ||
The above outcomes supported the physical nature of the adsorption of H2HEH and H2MEH on an N80 steel surface. The rise in the temperature decreased the number of adsorbed particles, thus, decreasing the inhibition efficiency. The inhibitors prevent the corrosion process by increasing the activation energy. The adsorption process on the N80 steel exterior was by a charge transfer mechanism. These inhibitors also serve as building blocks for mass. Furthermore, the rather small activation energy values for H2HEH and H2MEH implied a physical adsorption mechanism.
The change of entropy (ΔS*) and change of enthalpy (ΔH*) were calculated utilizing the equation below:
 | (8) |
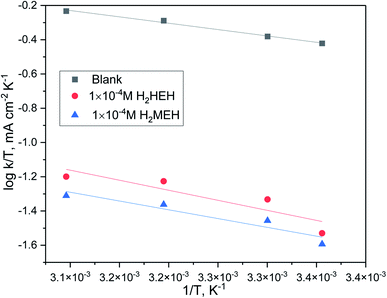 | ||
Fig. 11 log![[thin space (1/6-em)]](https://www.rsc.org/images/entities/char_2009.gif) k (corrosion rate)/T vs. 1/T plot for N80 steel in 3.5% NaCl medium and including 1 × 10⁻⁴ M concentration of the investigated hydrazides. k (corrosion rate)/T vs. 1/T plot for N80 steel in 3.5% NaCl medium and including 1 × 10⁻⁴ M concentration of the investigated hydrazides. | ||
3.7. XPS studies
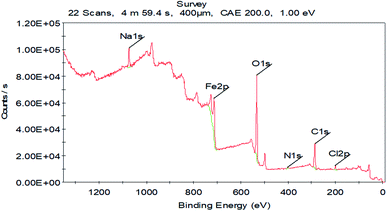
The XPS investigation was used to distinguish the chemical composition and bonding in an H2MEH molecule. It was used to ascertain the adsorption of the H2MEH compound on an N80 steel surface and clarify the corrosion inhibition mechanism. The XPS results obtained for treating the N80 steel surface with 1 × 10⁻⁴ M H2MEH and corroded in 3.5% NaCl are shown in Fig. 12. Meanwhile, Fig. 13 shows the XPS of C 1s, Fe 2p, O 1s, N 1s, and Na 1s for the treated N80 steel sample. Table 8 shows the binding energies (BE) (eV) and the equivalent designation for any peak component.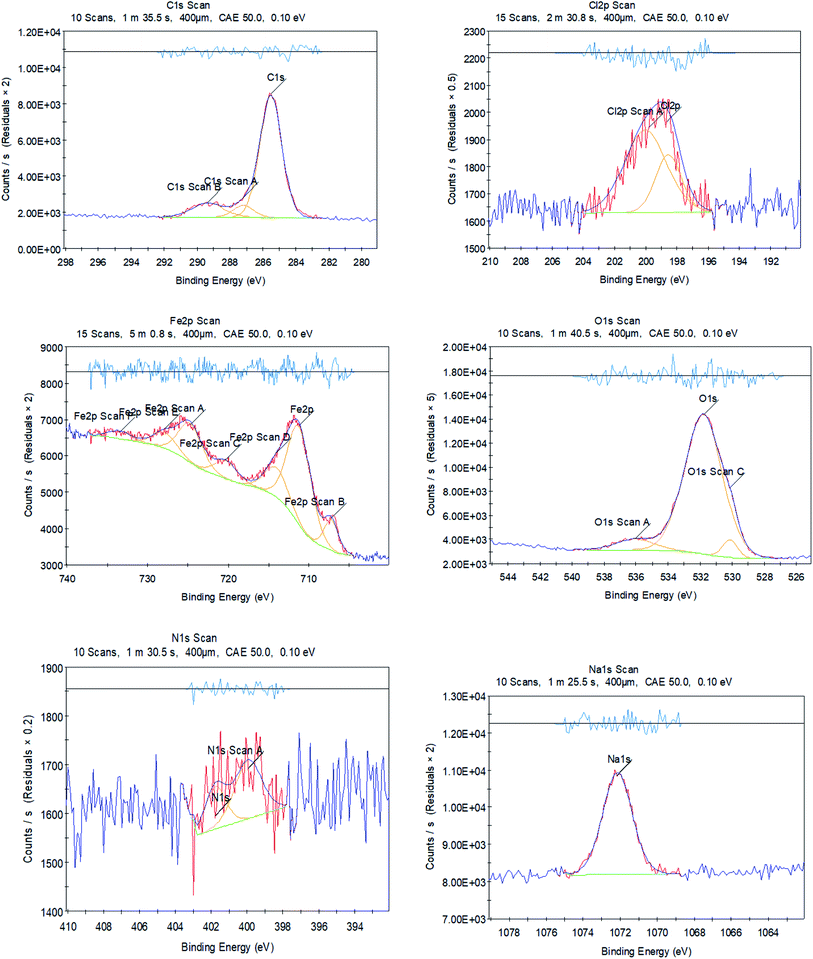 | ||
| Fig. 13 XPS outlines of C 1s, Cl 2p, Fe 2p, O 1s, N 1s, and Na 1s for N80 steel in 3.5% NaCl treated with 1 × 10⁻⁴ M of H2MEH. | ||
| N80 steel in 3.5% NaCl treated with 1 × 10⁻⁴ M H2MEH | ||
|---|---|---|
| Core element | BE, eV | Assignments |
| C 1s | 285.51 | –C–H, –C–C–, –C![[double bond, length as m-dash]](https://www.rsc.org/images/entities/char_e001.gif) C– C– |
| 287.55 | –C–O | |
| 289.36 | –C![[double bond, length as m-dash]](https://www.rsc.org/images/entities/char_e001.gif) N+ N+ |
|
| Cl 2p | 198.66 | Cl 2p3/2 |
| 199.78 | Cl 2p1/2 | |
| Fe 2p | 707.23 | Fe 2p3/2 of Fe0 |
| 711.20 | Fe 2p3/2 of Fe2+ in FeO, FeCl2 | |
| 714.06 | Fe 2p3/2 of Fe3+ in Fe2O3, Fe3O4, FeOOH | |
| 720.26 | Satellite Fe 2p3/2 of Fe2+ in FeO | |
| 724.71 | Fe 2p1/2 of Fe2+ in FeO | |
| 727.91 | Fe 2p1/2 of Fe3+ in Fe2O3 | |
| 733.48 | Satellite Fe 2p1/2 of Fe2+ in Fe2O3, Fe3O4 | |
| O 1s | 530.14 | FeO, Fe2O3 |
| 531.80 | FeOOH | |
| 536.03 | Adsorbed water molecules | |
| N 1s | 399.94 | –C![[double bond, length as m-dash]](https://www.rsc.org/images/entities/char_e001.gif) N N |
| 401.07 | –C![[double bond, length as m-dash]](https://www.rsc.org/images/entities/char_e001.gif) N+ N+ |
|
| Na 1s | 1072.15 | Na in NaCl |
The involved spectra of C 1s displayed three peaks (Fig. 13), including that for the inhibited N80 steel at 285.51, which was assigned to –C–C–, –C![[double bond, length as m-dash]](https://www.rsc.org/images/entities/char_e001.gif) C–, and C–H bonds. The 287.19 eV and 289.36 eV peaks are ascribed to –C–O, and –C
C–, and C–H bonds. The 287.19 eV and 289.36 eV peaks are ascribed to –C–O, and –C![[double bond, length as m-dash]](https://www.rsc.org/images/entities/char_e001.gif) N+ bonds, respectively.75,76 The deconvolution of the Cl 2p spectra divulged into two peaks (Fig. 13) at 198.6 and 199.78 eV, which were assigned to Cl 2p3/2 and Cl 2p1/2, respectively.77 The XPS spectra of Fe 2p showed seven peaks (Fig. 13) at 707.23 eV for Fe 2p3/2 of Fe0, 711.20 eV for Fe 2p3/2 of Fe2+, 714.06 eV for Fe 2p3/2 of Fe3+,77 720.01 eV for Fe 2p3/2 satellites of Fe2+,78 724.36 eV for Fe 2p1/2 of Fe2+, 727.91 eV for Fe 2p1/2 of Fe2+, and 733.48 eV for Fe 2p1/2 satellites of Fe2+.79,80 Furthermore, the high-resolution O 1s spectrum showed three peaks (Fig. 13), including 530.14 eV for O2− that interacted with Fe2+and Fe3+ to form FeO and Fe2O3 oxides.81,82 The 531.80 and 536.03 eV were for the OH− that interacted with Fe3+ to form FeOOH and adsorbed water molecules, respectively.83,84
N+ bonds, respectively.75,76 The deconvolution of the Cl 2p spectra divulged into two peaks (Fig. 13) at 198.6 and 199.78 eV, which were assigned to Cl 2p3/2 and Cl 2p1/2, respectively.77 The XPS spectra of Fe 2p showed seven peaks (Fig. 13) at 707.23 eV for Fe 2p3/2 of Fe0, 711.20 eV for Fe 2p3/2 of Fe2+, 714.06 eV for Fe 2p3/2 of Fe3+,77 720.01 eV for Fe 2p3/2 satellites of Fe2+,78 724.36 eV for Fe 2p1/2 of Fe2+, 727.91 eV for Fe 2p1/2 of Fe2+, and 733.48 eV for Fe 2p1/2 satellites of Fe2+.79,80 Furthermore, the high-resolution O 1s spectrum showed three peaks (Fig. 13), including 530.14 eV for O2− that interacted with Fe2+and Fe3+ to form FeO and Fe2O3 oxides.81,82 The 531.80 and 536.03 eV were for the OH− that interacted with Fe3+ to form FeOOH and adsorbed water molecules, respectively.83,84
The N80 steel treated with H2MEH in 3.5% NaCl exhibited two N 1s peaks (Fig. 13) at 399.94 and 401.75 eV, which were ascribed to –C![[double bond, length as m-dash]](https://www.rsc.org/images/entities/char_e001.gif) N and –C
N and –C![[double bond, length as m-dash]](https://www.rsc.org/images/entities/char_e001.gif) N+ bonds, respectively. These were due to the H2MEH molecules.85,86 Finally, a distinctive Na 1s peak (Fig. 13) observed at 1072.15 eV was assigned to Na in the NaCl solution.87 These results verified the adsorption of H2MEH on the N80 steel exterior. These compound created a durable shielding layer.
N+ bonds, respectively. These were due to the H2MEH molecules.85,86 Finally, a distinctive Na 1s peak (Fig. 13) observed at 1072.15 eV was assigned to Na in the NaCl solution.87 These results verified the adsorption of H2MEH on the N80 steel exterior. These compound created a durable shielding layer.
3.8. DFT studies
Fig. 14 shows the optimized structures, including the HOMO and LUMO distributions for the hydrazide derivatives. Table 9 presents the corresponding quantum chemical descriptors. As suggested by the frontier orbital theory, the donor or acceptor interactions at the interface between the inhibitor compound and metal exterior are described by the HOMO and LUMO energies.88 Thus, high and low values for EHOMO and ELUMO, respectively, suggest a corrosion prohibition, which is enhanced by the presence of the compounds under study. In Table 9, H2MEH has a higher HOMO value of −4.86 eV when compared with H2HEH (−5.26 eV). As shown in Fig. 14, the HOMO levels for hydrazide were located at the methoxy, hydroxy, carbonyl and phenyl rings, suggesting that the nitrogen and oxygen atoms were the favored positions for electrophilic attacks on the metal exterior. This could enhance the prohibition caused by the hydrazide derivatives by the adsorption on the N80 exterior, thus, enhancing the prohibition potency. This concurred with the data observed. In contrast, the ELUMO value was −2.95 eV for H2MEH (Table 9), which was less than −0.68 eV for H2HEH. This also agreed with the experimental results, where better protection power was observed for H2MEH.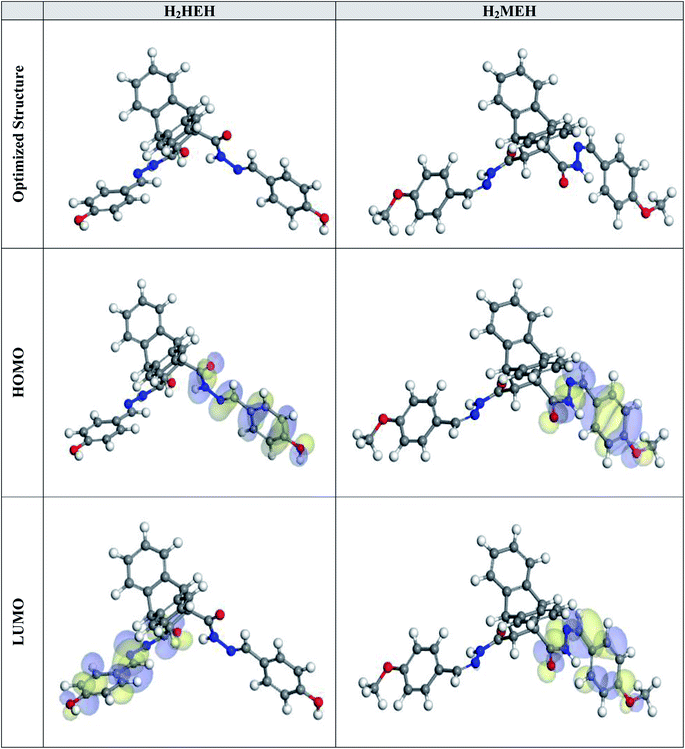 | ||
| Fig. 14 The optimized molecular constructions, HOMO and LUMO for the synthesized hydrazides via the DMol3 module. | ||
| Compound | H2HEH | H2MEH |
|---|---|---|
| EHOMO, eV | −5.26 | −4.86 |
| ELUMO, eV | −2.68 | −2.95 |
| ΔE, eV | 2.58 | 1.91 |
| I | 5.26 | 4.86 |
| A | 2.68 | 2.95 |
| χ | 3.97 | 3.91 |
| η | 1.29 | 0.96 |
| σ | 0.78 | 1.05 |
| ΔN | 1.18 | 1.21 |
| Dipole moment, debye | 7.04 | 7.20 |
| Molecular surface area, Å2 | 498.89 | 553.87 |
The energy gap (ΔE) is an essential element to assist the inhibition potency of the hydrazides for corrosion. Lower ΔE values suggested better inhibition potencies.89 As evidenced in Table 9, H2MEH has a lower ΔE value (1.91 eV) than H2HEH (2.58 eV). This implied a higher tendency for H2MEH adsorption on a C-steel exterior. The smaller values of electronegativity (χ) for H2MEH suggested the stronger ability of H2MEH than H2HEH to provide electrons to the metal.90 The stability and reactivity of a compound could also be used to evaluate its hardness (η) and softness (σ). Soft compounds are highly reactive than hard compounds and they effortlessly provide electrons to an N80 sample during the adsorption. Thus, they work as effective corrosion inhibitors.91 As shown in Table 9, the H2MEH has a higher σ value (1.05) and H2HEH has a lower η value (0.96). This indicated the ability of H2MEH to easily provide electrons to the examined sample. This produced a high prohibition potency.
The ΔN values showed the tendency of a particle to donate electrons to the surface. A high ΔN value, suggests a larger electron-donating ability of an inhibitor. It has been found that when ΔN < 3.6, the prohibition performance was enhanced because of the high electron-contributing ability.92 Table 9 lists the calculated values of ΔN. The higher ΔN values for H2MEH (1.21) than for H2HEH (1.18) suggested that H2MEH had a higher tendency to donate electrons to the examined sample.
The dipole moment is a vigorous element that confirms a corrosion prohibition.93 A rise in a dipole moment suggests an improvement in the deformation energy and enhancement in the adsorption of an inhibitor on the steel surface. Thus, a rise in the dipole moment will increase the prohibition efficacy.94 As shown in Table 9, the dipole moment of H2MEH (7.20 debye) is higher than H2HEH (7.04 debye). This verified the higher tendency for H2MEH adsorption on the N80 surface, causing an improved prohibition potency.
Additionally, a visible correlation was found between the molecular surface area of the hydrazides and their tendency to protect the N80 surface in a 3.5% NaCl medium. A larger surface area improves the prohibition potency since the contact area on the N80 surface becomes larger for the hydrazides.95 As shown in Table 9, H2MEH showed a larger molecular surface area (553.87 Å2), thus, it provided a better prohibition potency than H2HEH.
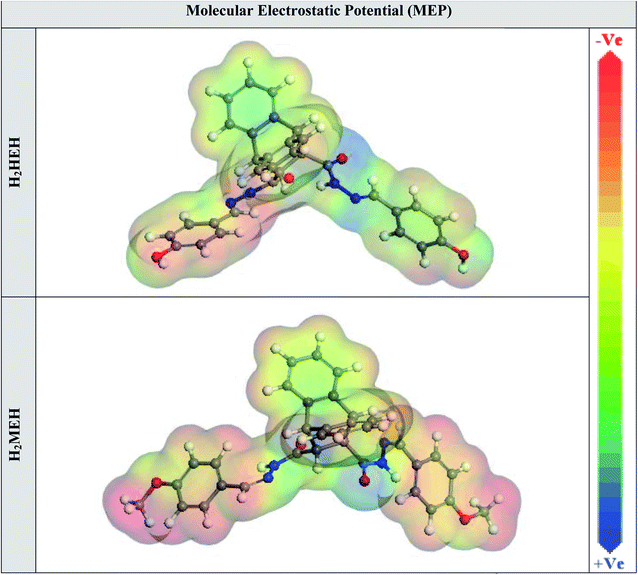
The MEP mapping in a 3D visual device is designed to recognize the optimum electrostatic result, which is calculated over a particle from the total charge dispersion.96 In the MEP maps shown in Fig. 15, the red regions delineated the greatest electron density, where MEP is the most negative (nucleophilic reaction). Meanwhile, the blue regions delineate from the highest positive area (electrophilic reaction).97 The photograph in Fig. 15 shows the most negative areas were from hydrazide at the methoxy, hydroxy and carbonyl rings. Nevertheless, a lower density at the phenyl rings was observed. The red spots with high electron density in the hydrazides were the suitable connections on the N80 surface for building an adsorbed protective film.
3.9. MC simulations
MC simulations were used to perceive the interactions between the hydrazides and the C-steel surface and the mechanism of adsorption. Fig. 16 shows the most likely adsorption configurations for the hydrazides on the N80 sample. This was achieved by the adsorption locator module that presents the smooth disposition, and suggests an improvement in the adsorption with the highest surface coverage.98 Moreover, Table 10 summarizes the calculations from the Monte Carlo simulations. The table lists the adsorption energies for relaxed adsorbate compounds, rigid adsorption energies for unrelaxed adsorbate compounds, and deformation energies for relaxed adsorbate compounds.99 The H2MEH showed a more negative value for adsorption energy (−2649.11 kcal mol−1) compared with H2HEH (−2636.23 kcal mol−1). This proved the stronger adsorption of H2MEH on the C-steel surface, making a steady adsorbed barrier that prevents the C-steel corrosion. These results agree with the practical data. The values for adsorption energy for H2MEH at pre-and post-geometry optimization stages i.e., unrelaxed and relaxed were −2771.19 and 122.08 kcal mol−1, respectively. These values were more negative than H2HEH, suggesting a greater prohibition tendency for H2MEH than for H2HEH.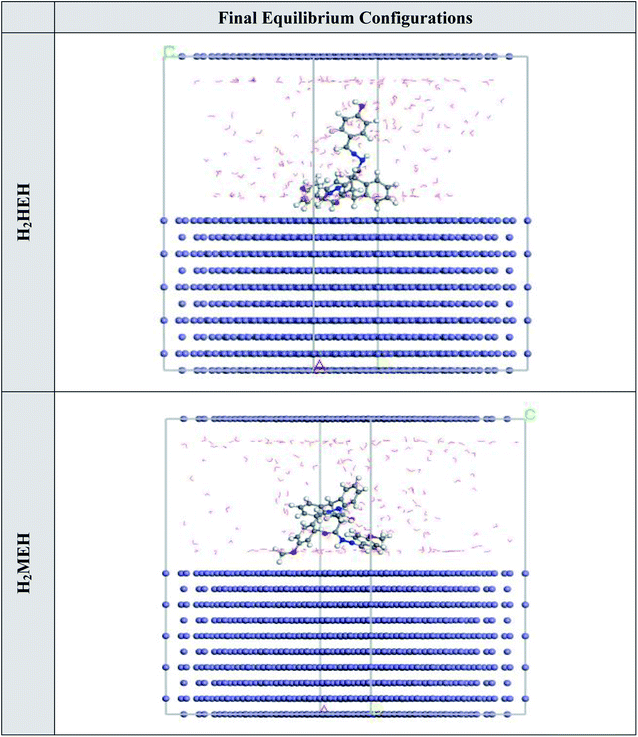 | ||
| Fig. 16 The adsorption locator module achieved the maximal suitable conformation for the adsorption of the synthesized hydrazides on Fe (1 1 0) substrate. | ||
| Structures | Adsorption energy/kcal mol−1 | Rigid adsorption energy/kcal mol−1 | Deformation energy/kcal mol−1 | dEads/dNi:inhibitor/kcal mol−1 | dEads/dNi:water/kcal mol−1 |
|---|---|---|---|---|---|
| a The energy of the metal adsorbate arrangement, where the energy of the adsorbates was neglected is elucidated by dEads/dNi values.100 The dEads/dNi values for H2MEH was −194.77 kcal mol−1, which was higher than the value for H2HEH molecules of −178.65 kcal mol−1, which affirmed stronger adsorption of H2MEH than H2HEH. Besides, the dEads/dNi value for water molecules is 13.81 kcal mol−1, suggesting the stronger adsorption of hydrazides than water. Hence, the hydrazides were conclusively adsorbed on the N80 surface and formed an effective protective barrier. | |||||
| Fe (1 1 0) | −2636.23 | −2756.00 | 119.77 | −178.65 | −13.73 |
| H2HEH | |||||
| Water | |||||
| Fe (1 1 0) | −2649.11 | −2771.19 | 122.08 | −194.77 | −13.88 |
| H2MEH | |||||
| Water | |||||
3.10. Mechanism of inhibition of hydrazide derivatives and comparison of the inhibition efficiencies of our study derivatives with those of previous studies
The mechanism of corrosion inhibition has several parts mechanism and is linked to the construction of a preventive/adsorbed layer on the examined metal. The procedure of adsorption was monitored by various variables, which are stated below:101(a) There were interactions between H2HEH or H2MEH and the substrate.
(b) The investigated molecules combined on the metal layer.
(c) There were chemical processes involved.
(d) The electrode potentials were relevant.
(e) The doses of the examined inhibitors were relevant.
(f) The temperature of the system was important.
(g) The characteristics of the metal exterior were important.
The adsorption of the synthesized H2HEH and H2MEH on the N80 steel metal can occur instantly by virtue of donor–acceptor correlations with N or O atoms of the compounds and the presence of free d- orbitals in N80 steel particles.
The H2HEH and H2MEH, including their electronegative atoms, were frequently reported to have a large ability to contribute electrons to an N80 steel surface.49 Thus, the interaction between H2HEH and H2MEH and the exterior of the N80 steel involved the electronegative atoms of the inhibitors. The localities of higher electron density are common spots for electrophiles attack. Therefore, N and O atoms with energetic sites, have the greatest capability to bond with the N80 steel exterior.
The prohibition tendency of H2MEH was better than that of H2HEH.
H2MEH provided a higher inhibition efficiency percentage, which was a result of the existence of p-OCH3, which is an electron-contributing group in its structure. This group increased the electron charge density on the inhibitor. The lower efficiency in H2HEH was due to the H-atom in the p-position, which has no purpose in the charge density of the compound.
In conclusion, the sites with electron-donating groups (–N and –O atoms) were the most likely spots for bonding of H2HEH and H2MEH on the metal surface. Additionally, the findings from quantum chemical calculations provided excellent matching with the collected data from the electrochemical techniques and adsorption of the synthesized compounds. These findings were mostly focused on the relevance of nitrogen and oxygen atoms.
Finally, Table 11 demonstrates a comparison between our results and previously the published studies on corrosion inhibition utilizing hydrazide derivatives in different corrosive mediums.
| Inhibitor used | Examined metal | Corrosive media | Inhibition efficiency | Reference |
|---|---|---|---|---|
| Ferrocene Schiff bases derived from hydrazides | Mild steel | In 0.5 M, H2SO4 | 91.1% EIS | 102 |
| Sulfonohydrazide derivatives | XC38 carbon steel | 1 M HCl | 91.9% polarization, 93.1% EIS | 34 |
| Hydroxy phenyl hydrazides | Mild steel | 1 M HCl solution | 92.41% EIS, 92.4% weight loss | 35 |
| Cationic Gemini surfactant | X-65 steel | 1.0 M HCl | 91.44% EIS, 94.73% EIS | 103 |
| Organic acid hydrazides | Mild steel | 1.0 M HCl | 93.8% weight loss, 81.3% polarization | 32 |
| 2-(2-Hydrazinyl-1,6-dihydro-6-oxopyrimidin-4-yl) acetohydrazide | Mild steel | M HCl and 0.5 M H2SO4 | 89.8% polarization in HCl, 88.5% polarization in H2SO4 | 37 |
| Polymeric hydrazide derivatives | Mild steel | 1 M HCl | 93.97% polarization | 104 |
| Novel dicarbohydrazide derivatives | N80 steel | 3.5% NaCl solution | 93.3% polarization, 92.2% EIS | Our current study |
4. Conclusions
In this work, we synthesized and characterized novel H2HEH and H2MEH hydrazide derivatives. The molecular composition of the compounds was determined using FT-IR, NMR spectroscopy, and electronic spectra. The corrosion prohibition on N80 steel using the hydrazides was studied by electrochemical techniques of PP, EIS and EFM and theoretical calculations. The following are the highlights of the study.(1) Data collected from the electrochemical methods and theoretical calculations indicated that the synthesized hydrazides served as powerful compounds for N80 carbon steel corrosion in a 3.5% NaCl solution.
(2) Prohibition tendency enhanced with the rise in the concentration of the examined hydrazides. It decreased with an increase in the temperature.
(3) The prohibition efficiency, which was measured using PP, EIS and EFM was in a respectable arrangement.
(4) PP measurements showed that the synthesized hydrazides behaved as a mixed-type inhibitor.
(5) XPS studies affirmed the formation and creation of a durable shielding layer, which protected the exterior of the N80 carbon steel from corrosion.
(6) The synthesized hydrazides were adsorbed on the N80 carbon steel surface in a 3.5% NaCl corrosive medium. The adsorption was an exothermic process, which indicated both physisorption and chemisorption, and followed the Langmuir adsorption isotherm.
(7) These findings demonstrate the superior performance of the prepared H2HEH and H2MEH hydrazide derivatives as inhibitors for N80 carbon steel corrosion and accordingly prove their favorability for the protection of steel in aggressive chloride solutions. Due to the unique structure of these compounds, they can be applied as effective inhibitors during the acid pickling process.
Conflicts of interest
The authors declare that they have no known competing financial interests or personal relationships that could have appeared to influence the work reported in this paper.Acknowledgements
This work was supported through the Annual Funding track by the Deanship of Scientific Research, Vice Presidency for Graduate Studies and Scientific Research, King Faisal University, Saudi Arabia [GRANT-609].References
- X. Li, S. Deng and H. Fu, Corros. Sci., 2011, 53, 302–309 CrossRef CAS.
- B. Labriti, N. Dkhireche, R. Touir, M. Ebn Touhami, M. Sfaira, A. El Hallaoui, B. Hammouti and A. Alami, Arab. J. Sci. Eng., 2012, 37, 1293–1303 CrossRef CAS.
- S. Javadian, A. Yousefi and J. Neshati, Appl. Surf. Sci., 2013, 285, 674–681 CrossRef CAS.
- A. A. Gurten, E. Bayol, K. Kayakirilmaz and M. Erbil, Steel Compos. Struct., 2009, 9, 77–87 CrossRef.
- M. Raupach, B. Elsener, R. Polder and J. Mietz, Corrosion of Reinforcement in Concrete: Monitoring, Prevention and Rehabilitation Techniques, A volume in European Federation of Corrosion (EFC) Series, 2007 Search PubMed.
- T. A. Söylev and M. G. Richardson, Construct. Build. Mater., 2008, 22, 609–622 CrossRef.
- H. E. Jamil, M. F. Montemor, R. Boulif, A. Shriri and M. G. S. Ferreira, Electrochim. Acta, 2003, 48, 3509–3518 CrossRef CAS.
- A. H. Tantawy, K. A. Soliman and H. M. Abd El-Lateef, J. Clean. Prod., 2020, 250, 119510 CrossRef CAS.
- M. Behpour, S. M. Ghoreishi, N. Soltani and M. Salavati-Niasari, Corros. Sci., 2009, 51, 1073–1082 CrossRef CAS.
- A. Y. Yassin, A. M. Abdelghany, M. M. Shaban and Y. M. Abdallah, Colloids Surf. A Physicochem. Eng. Asp., 2022, 635, 128115 CrossRef CAS.
- M. Behpour, S. M. Ghoreishi, N. Soltani, M. Salavati-Niasari, M. Hamadanian and A. Gandomi, Corros. Sci., 2008, 50, 2172–2181 CrossRef CAS.
- A. K. Singh, B. Chugh, S. Thakur, B. Pani, H. Lgaz, I.-M. Chung, S. Pal and R. Prakash, Colloids Surf. A Physicochem. Eng. Asp., 2020, 599, 124824 CrossRef CAS.
- B. Chugh, A. K. Singh, S. Thakur, B. Pani, A. K. Pandey, H. Lgaz, I.-M. Chung and E. E. Ebenso, J. Phys. Chem. C, 2019, 123, 22897–22917 CrossRef CAS.
- B. Chugh, A. K. Singh, D. Poddar, S. Thakur, B. Pani and P. Jain, Carbohydr. Polym., 2020, 234, 115945 CrossRef PubMed.
- R. Wang, G. Qin and E. Zhang, J. Mater. Sci. Technol., 2020, 52, 127–135 CrossRef.
- S. Wan, X.-Z. Ma, C.-H. Miao, X.-X. Zhang and Z.-H. Dong, Corros. Sci., 2020, 170, 108692 CrossRef CAS.
- H. Huang and X. Guo, Colloids Surf. A Physicochem. Eng. Asp., 2020, 598, 124809 CrossRef CAS.
- S. Rangelov and V. Mircheva, Corros. Sci., 1996, 38, 301–306 CrossRef CAS.
- K. F. Khaled, Appl. Surf. Sci., 2006, 252, 4120–4128 CrossRef CAS.
- M. Nasr-Esfahani, M. Zendehdel and B. Jafari, Prot. Met. Phys. Chem. Surf., 2015, 51, 285–294 CrossRef CAS.
- A. Singh, K. R. Ansari, D. S. Chauhan, M. A. Quraishi, H. Lgaz and I.-M. Chung, J. Colloid Interface Sci., 2020, 560, 225–236 CrossRef CAS PubMed.
- A. K. Singh, A. K. Pandey, P. Banerjee, S. K. Saha, B. Chugh, S. Thakur, B. Pani, P. Chaubey and G. Singh, J. Environ. Chem. Eng., 2019, 7, 102971 CrossRef CAS.
- P. Molaeipour, M. Ramezanzadeh and B. Ramezanzadeh, Bioelectrochemistry, 2022, 143, 107970 CrossRef CAS PubMed.
- L. Cheng, C. Liu, H. Wu, H. Zhao and L. Wang, J. Colloid Interface Sci., 2022, 606, 1572–1585 CrossRef CAS PubMed.
- A. H. J. Mofidabadi, A. Dehghani and B. Ramezanzadeh, Colloids Surf. A Physicochem. Eng. Asp., 2021, 630, 127561 CrossRef CAS.
- T. Attar, F. Nouali, Z. Kibou, A. Benchadli, B. Messaoudi, E. Choukchou-Braham and N. Choukchou-Braham, J. Chem. Sci., 2021, 133, 109 CrossRef CAS.
- T. Laabaissi, M. Rbaa, F. Benhiba, Z. Rouifi, U. P. Kumar, F. Bentiss, H. Oudda, B. Lakhrissi, I. Warad and A. Zarrouk, Colloids Surf. A Physicochem. Eng. Asp., 2021, 629, 127428 CrossRef CAS.
- K. O. Sulaiman and A. T. Onawole, Comput. Theor. Chem., 2016, 1093, 73–80 CrossRef CAS.
- R. Schliebs, Angew. Chem., Int. Ed., 1985, 24, 1006–1007 CrossRef.
- M. Nassiri Koopaei, M. J. Assarzadeh, A. L. I. Almasirad, S. F. Ghasemi Niri, M. Amini, A. Kebriaeezadeh, N. Nassiri Koopaei, M. Ghadimi and A. Tabei, Iran. J. Pharm. Res., 2013, 12, 721–727 Search PubMed.
- E. F. Rothgery, Hydrazine and Its Derivatives., Kirk-Othmer Encycl. Chem. Technol., 2004 DOI:10.1002/0471238961.0825041819030809.a01.pub2.
- M. A. Quraishi, R. Sardar and D. Jamal, Mater. Chem. Phys., 2001, 71, 309–313 CrossRef CAS.
- P. Preethi Kumari, P. Shetty and S. A. Rao, Arab. J. Chem., 2017, 10, 653–663 CrossRef CAS.
- I. Ichchou, L. Larabi, H. Rouabhi, Y. Harek and A. Fellah, J. Mol. Struct., 2019, 1198, 126898 CrossRef CAS.
- A. K. Singh, B. Chugh, M. Singh, S. Thakur, B. Pani, L. Guo, S. Kaya and G. Serdaroglu, J. Mol. Liq., 2021, 330, 115605 CrossRef CAS.
- S. V Ramesh and A. V. Adhikari, Mater. Chem. Phys., 2009, 115, 618–627 CrossRef.
- Z. A. Abdallah, M. S. Mohamed Ahmed and M. M. Saleh, Mater. Chem. Phys., 2016, 174, 91–99 CrossRef CAS.
- K. I. Aly, A.-E.-W. A. Sarhan and T. I. El-Emary, Arab. J. Chem., 2010, 3, 61–68 CrossRef CAS.
- S. S. Abdel-Rehim, K. F. Khaled and N. S. Abd-Elshafi, Electrochim. Acta, 2006, 51, 3269–3277 CrossRef CAS.
- R. W. Bosch, Corrosion, 2001, 57, 60–70 CrossRef CAS.
- A. M. Eid, S. Shaaban and K. Shalabi, J. Mol. Liq., 2020, 298, 111980 CrossRef CAS.
- H. M. A. El-Lateef, Z. A. Abdallah and M. S. M. Ahmed, J. Mol. Liq., 2019, 296, 111800 CrossRef CAS.
- G. Gao and C. Liang, Electrochim. Acta, 2007, 52, 4554–4559 CrossRef CAS.
- H. M. Abd El-Lateef, K. Shalabi and A. A. Abdelhamid, J. Mol. Liq., 2021, 334, 116081 CrossRef CAS.
- O. A. El-Gammal, Inorg. Chim. Acta., 2015, 435, 73–81 CrossRef CAS.
- O. A. El-Gammal, I. M. Abd Al-Gader and A. A. El-Asmy, Spectrochim. Acta Mol. Biomol. Spectrosc., 2014, 128, 759–772 CrossRef CAS PubMed.
- O. A. El-Gammal, Spectrochim. Acta Mol. Biomol. Spectrosc., 2010, 75, 533–542 CrossRef PubMed.
- O. A. El-Gammal, Spectrochim. Acta Mol. Biomol. Spectrosc., 2010, 75, 533–542 CrossRef PubMed.
- M. H. M. Hussein, M. F. El-Hady, H. A. H. Shehata, M. A. Hegazy and H. H. H. Hefni, J. Surfactants Deterg., 2013, 16, 233–242 CAS.
- Y. M. Abdallah and H. Elzanaty, Mater. Chem. Phys., 2019, 238, 121925 CrossRef CAS.
- A. Singh, K. R. Ansari, M. A. Quraishi and S. Kaya, J. Mol. Struct., 2020, 1206, 127685 CrossRef CAS.
- M. Tourabi, K. Nohair, M. Traisnel, C. Jama and F. Bentiss, Corros. Sci., 2013, 75, 123–133 CrossRef CAS.
- A. S. Fouda, G. Y. Elewady, K. Shalabi and H. K. Abd El-Aziz, RSC Adv., 2015, 5, 36957–36968 RSC.
- K. Shalabi, E. Abdel-Galil, A. H. El-Askalany and Y. M. Abdallah, J. Mol. Liq., 2022, 348, 118420 CrossRef CAS.
- K. F. Khaled, Electrochim. Acta, 2003, 48, 2493–2503 CrossRef CAS.
- Y. M. Abdallah and K. Shalabi, Prot. Met. Phys. Chem. Surf., 2015, 51, 275–284 CrossRef CAS.
- H. Boudellioua, Y. Hamlaoui, L. Tifouti and F. Pedraza, Appl. Surf. Sci., 2019, 473, 449–460 CrossRef CAS.
- W. J. Lorenz and F. Mansfeld, Electrochim. Acta, 1986, 31, 467–476 CrossRef CAS.
- Y. Yu, D. Yang, D. Zhang, Y. Wang and L. Gao, Appl. Surf. Sci., 2017, 392, 768–776 CrossRef CAS.
- M. A. Migahed, A. elgendy, M. M. EL-Rabiei, H. Nady and E. G. Zaki, J. Mol. Struct., 2018, 1159, 10–22 CrossRef CAS.
- D. D. Macdonald and M. C. H. McKubre, Mod. Aspect. Electrochem., 1982, 61–150 CAS.
- F. Mansfeld, Corrosion, 1981, 37, 301–307 CrossRef CAS.
- K. Shalabi, O. A. El-Gammal and Y. M. Abdallah, Colloids Surf. A Physicochem. Eng. Asp., 2021, 609, 125653 CrossRef CAS.
- J. Haque, V. Srivastava, D. S. Chauhan, M. A. Quraishi, A. Madhan Kumar and H. Lgaz, Sustain. Chem. Pharm., 2020, 16, 100260 CrossRef.
- S. A. Umoren, M. M. Solomon, U. M. Eduok, I. B. Obot and A. U. Israel, J. Environ. Chem. Eng., 2014, 2, 1048–1060 CrossRef CAS.
- M. M. Saleh, M. G. Mahmoud and H. M. Abd El-Lateef, Corros. Sci., 2019, 154, 70–79 CrossRef CAS.
- S. F. Mertens, C. Xhoffer, B. C. De Cooman and E. Temmerman, Corrosion, 1997, 53, 381–388 CrossRef CAS.
- E. McCafferty and N. Hackerman, J. Electrochem. Soc., 1972, 119, 146 CrossRef CAS.
- E. Kuş and F. Mansfeld, Corros. Sci., 2006, 48, 965–979 CrossRef.
- F. M. Reis, H. G. de Melo and I. Costa, Electrochim. Acta, 2006, 51, 1780–1788 CrossRef CAS.
- M. Lagrenée, B. Mernari, M. Bouanis, M. Traisnel and F. Bentiss, Corros. Sci., 2002, 44, 573–588 CrossRef.
- G. Trabanelli, C. Monticelli, V. Grassi and A. Frignani, Cem. Concr. Res., 2005, 35, 1804–1813 CrossRef CAS.
- K. Shalabi, A. M. Helmy, A. H. El-Askalany and M. M. Shahba, J. Mol. Liq., 2019, 293, 111480 CrossRef CAS.
- A. S. Fouda, K. Shalabi and A. A. Idress, Green Chem. Lett. Rev., 2015, 8, 17–29 CrossRef CAS.
- H. Ouici, M. Tourabi, O. Benali, C. Selles, C. Jama, A. Zarrouk and F. Bentiss, J. Electroanal. Chem., 2017, 803, 125–134 CrossRef CAS.
- G. Fan, H. Liu, B. Fan, Y. Ma, H. Hao and B. Yang, J. Mol. Liq., 2020, 311, 113302 CrossRef CAS.
- M. Bouanis, M. Tourabi, A. Nyassi, A. Zarrouk, C. Jama and F. Bentiss, Appl. Surf. Sci., 2016, 389, 952–966 CrossRef CAS.
- M. M. Solomon, S. A. Umoren, M. A. Quraishi and M. Salman, J. Colloid Interface Sci., 2019, 551, 47–60 CrossRef CAS PubMed.
- N. Z. N. Hashim, E. H. Anouar, K. Kassim, H. M. Zaki, A. I. Alharthi and Z. Embong, Appl. Surf. Sci., 2019, 476, 861–877 CrossRef CAS.
- P. Bommersbach, C. Alemany-Dumont, J. P. Millet and B. Normand, Electrochim. Acta, 2005, 51, 1076–1084 CrossRef CAS.
- W. Temesghen and P. Sherwood, Anal. Bioanal. Chem., 2002, 373, 601–608 CrossRef CAS PubMed.
- A. Zarrouk, B. Hammouti, T. Lakhlifi, M. Traisnel, H. Vezin and F. Bentiss, Corros. Sci., 2015, 90, 572–584 CrossRef CAS.
- P. Mourya, P. Singh, R. B. Rastogi and M. M. Singh, Appl. Surf. Sci., 2016, 380, 141–150 CrossRef CAS.
- Y. Kharbach, F. Z. Qachchachi, A. Haoudi, M. Tourabi, A. Zarrouk, C. Jama, L. O. Olasunkanmi, E. E. Ebenso and F. Bentiss, J. Mol. Liq., 2017, 246, 302–316 CrossRef CAS.
- M. Zhao, Y. Cao, X. Liu, J. Deng, D. Li and H. Gu, Nanoscale Res. Lett., 2014, 9, 142 CrossRef PubMed.
- T. G. A. A. Harris, R. Götz, P. Wrzolek, V. Davis, C. E. Knapp, K. Ly, P. Hildebrandt, M. Schwalbe, I. Weidinger, I. Zebger and A. Fischer, J. Mater. Chem. A, 2018, 6, 15200–15212 RSC.
- I. Moeez, H. D. Lim, J. H. Park, H. G. Jung and K. Y. Chung, ACS Energy Lett., 2019, 4, 2060–2068 CrossRef CAS.
- H. M. Abd El-Lateef, K. Shalabi and A. H. Tantawy, New J. Chem., 2020, 44, 17791–17814 RSC.
- Y. Ma, F. Han, Z. Li and C. Xia, ACS Sustain. Chem. Eng., 2016, 4, 5046–5052 CrossRef CAS.
- N. Palaniappan, I. S. Cole and A. E. Kuznetsov, RSC Adv., 2020, 10, 11426–11434 RSC.
- Y. Sasikumar, A. S. Adekunle, L. O. Olasunkanmi, I. Bahadur, R. Baskar, M. M. Kabanda, I. B. Obot and E. E. Ebenso, J. Mol. Liq., 2015, 211, 105–118 CrossRef CAS.
- I. Lukovits, E. Kálmán and F. Zucchi, Corrosion, 2001, 57, 3–8 CrossRef CAS.
- H. M. Abd El-Lateef, S. Shaaban, M. M. Khalaf, A. Toghan and K. Shalabi, Colloids Surf. A Physicochem. Eng. Asp., 2021, 625, 126894 CrossRef CAS.
- A. K. Oyebamiji and B. B. Adeleke, Int. J. Corros. Scale Inhib., 2018, 7, 498–508 CAS.
- Y. S. Mary, C. Y. Panicker, M. Sapnakumari, B. Narayana, B. K. Sarojini, A. A. Al-Saadi, C. Van Alsenoy and J. A. War, Spectrochim. Acta Mol. Biomol. Spectrosc., 2015, 136, 483–493 CrossRef CAS PubMed.
- L. H. Madkour, S. Kaya and I. B. Obot, J. Mol. Liq., 2018, 260, 351–374 CrossRef CAS.
- R. Hasanov, S. Bilge, S. Bilgiç, G. Gece and Z. Kiliç, Corros. Sci., 2010, 52, 984–990 CrossRef CAS.
- E. E. El-Katori, M. I. Nessim, M. A. Deyab and K. Shalabi, J. Mol. Liq., 2021, 337, 116467 CrossRef CAS.
- M. Özcan, I. Dehri and M. Erbil, Appl. Surf. Sci., 2004, 236, 155–164 CrossRef.
- A. Dehghani, A. H. Mostafatabar, G. Bahlakeh and B. Ramezanzadeh, J. Mol. Liq., 2020, 113914 CrossRef CAS.
- A. S. El-Tabei and M. A. Hegazy, Chem. Eng. Commun., 2015, 202, 851–863 CrossRef CAS.
- S. R. Gupta, P. Mourya, M. M. Singh and V. P. Singh, J. Organomet. Chem., 2014, 767, 136–143 CrossRef CAS.
- N. M. El Basiony, E. E. Badr, S. A. Baker and A. S. El-Tabei, Appl. Surf. Sci., 2021, 539, 148246 CrossRef CAS.
- Z. R. Farag, M. E. Moustapha, E. H. Anouar and G. M. Abd El-Hafeez, J. Mater. Res. Technol., 2022, 16, 1422–1434 CrossRef CAS.
Footnote |
| † Electronic supplementary information (ESI) available. See https://doi.org/10.1039/d2ra01751b |
| This journal is © The Royal Society of Chemistry 2022 |

