DOI:
10.1039/D2RA01749K
(Paper)
RSC Adv., 2022,
12, 15427-15434
Novel gamma-irradiated chitosan-doped reduced graphene-CuInS2 composites as counter electrodes for dye-sensitized solar cells†
Received
17th March 2022
, Accepted 13th May 2022
First published on 20th May 2022
Abstract
To address the issues associated with traditional counter electrodes, a novel gamma-irradiated chitosan-doped reduced graphene-CuInS2 composite (Chi@RGO-CIS) was used as the counter electrode (CE). The system was fabricated following a simple hydrothermal method. The prepared Chi@RGO-CIS was characterized by various spectroscopic and microscopic techniques. The synergistic effect between chitosan, CuInS2, and reduced graphene oxide can help in producing a large surface area. It can also help in the generation of catalytic sites toward I-/I3-redox electrolytes. We used a composite (based on electrical considerations) to study the effect of the amount of graphene on the characteristics and photovoltaic efficiency of the Chi@RGO-CIS composites. The solar cell assembled with 1.5% Chi@RGO-CIS exhibited an efficiency of 12.21%. The efficiency was higher than that of a Pt-based device (9.96%) fabricated under the same conditions. Hence, Chi@RGO-CIS can be potentially used as the CE of dye-sensitized solar cells (DSSCs). It can be used as a substitute for Pt in DSSCs.
1 Introduction
Dye-sensitized solar cells (DSSCs) are promising inexpensive photovoltaic devices that can be used for converting solar energy to electrical energy. They are easy to fabricate and cost-effective. Thus, their use is preferred over traditional silicon-based solar cells.1 Typically, the components of a DSSC include a TiO2 mesoporous thin film sensitized (Photoanode, PE) with N719 dye molecules, an electrolyte of iodide/triiodide (I−/I3−), and a counter electrode (CE).2 When the DSSCs are irradiated with light, the dye molecules reach their excited state. The electrons in the excited state immediately move toward the semiconductor conduction band (CB) from the lowest-unoccupied-molecular-orbital (LUMO) of the dye molecules. Electrons from the surface of the mesoporous (TiO2) semiconductor move toward the CE through an external circuit. After excitation, the dye molecules become electron deficient.
The electrolyte then transfers electrons to the photosensitizer and diffuses toward the CE, where the reduction reaction occurs.3,4 The most used CE material is platinum (Pt), as it is characterized by good conductivity, chemical stability, inertness, and excellent catalytic activity.5 However, a significant amount of Pt is required to fabricate DSSCs on a commercial scale, and this limits the practical application of the process as Pt is not readily available. There are several other drawbacks of using Pt. This metal is expensive, corrodes in the presence of an electrolyte, and is ineffective for function in the electrolyte of the iodine-free redox couple.6 As a result, other CEs are considered alternatives to Pt for carrying out the reduction reactions.
Recently, there have been several interesting studies on the application of quantum dots owing to their many outstanding properties. CuInS2 (CIS) is a ternary metal sulfide and belongs to a group of nanomaterials known as semiconductor fluorescent nanoparticles or quantum dots (QDs).7 It has unique advantages, such as high quantum yield, good photochemical stability, a long fluorescence lifetime, a wide absorption spectrum and a narrow emission spectrum, tunable size, resistance to photobleaching, large surface area, and low cost. Moreover, it can absorb light in the visible spectrum, showing fluorescence emissions in the visible and near-infrared region and a direct bandwidth of about 4.5 eV. However, it has many QDs that can be used for DSSC cells. The main materials used in QDs are CdS, CdSe, CdTe, ZnSe, PbS, PbSe, and InP. In 2019, U. Mehmood and A. Haq Khan8 used a simple fabrication method of low-cost lead sulfide (PbS) as a counter electrode in DSSC. PbS showed a power-conversion-efficiency (PCE) of 4.71%, which is still low for DSSC applications. Therefore, CIS QDs have attracted considerable attention in the field of materials for DSSC cells.
Chitosan, a natural biopolymer composed of β-1,4-linked 2-acetamido-D-glucose and β-1,4-linked 2-amino-D-glucose, is the deacetylated derivative of chitin. Chitosan has attracted immense attention as a functional biopolymer as it is widely used in the food, agriculture, and medical industry. It is also attributed to its good biodegradability, film-forming properties, inexpensive, and environmentally friendly.9,10 The physicochemical and functional properties of chitosan are usually dependent on molecular weight (Mw). It has been reported that the solubility, growth-promoting properties, and electrical properties of low-Mw chitosan are substantially better than those of high-Mw chitosan.11 Normally, chitosan can be degraded under conditions of acidic and alkaline hydrolysis. It can also be degraded under conditions of enzymatic treatment. The Mw can be effectively reduced under these conditions. However, the major problems associated with these reactions include long processing time, high processing cost, low yield, and generation of toxic chemical waste. To address these problems, the process of irradiation is used. It is an eco-friendly approach and is thus preferred over conventional techniques. Gamma irradiation has been productively used to degrade polysaccharides such as starch, cellulose, and chitosan.12 Gamma irradiation reduces the Mw of chitosan and improves the physicochemical, electrical properties, and structure of the system via chain scission, crosslinking, and breaking of bonds. The interactions of the hydroxyl and the amino groups in chitosan play important roles in enhancing the electrical properties of the system under study.13
Graphene, a two-dimensional carbon nanomaterial, has attracted immense interest as it can be used to fabricate photocatalysts and sensors. It can also be used for energy conversion and storage as it exhibits low resistance, excellent optical transmittance, high mechanical stability, and high chemical stability.14 Furthermore, the hybrid nanocomposite materials based on graphene can be used to improve the power conversion efficiency of the DSSC cells significantly. This can be attributed to the synergistic relationship between graphene and other metal oxide nanostructures.15 Recently, graphene (based on composite materials) has been used to improve the efficiency of the DSSC cells. Tamilselvi and co-workers16 designed a NiSe2/graphene hybrid following a facile one-step hydrothermal method. The power conversion efficiency (PCE) reported by them was approximately 10.6% for a NiSe2/graphene CE, and it was higher than that achieved using bare NiSe2 CE (6.04%) under the same conditions.
As a result, to improve the DSSC cell efficiency, we created a novel gamma-irradiated chitosan-doped reduced graphene-CuInS2 composite (Chi@RGO-CIS) that can function as a CE. This nanomaterial was created using a straightforward hydrothermal method. The optimum proportion of graphene in the composite was determined to improve the PCE. This also helped in fabricating a good electro-catalyst. The charge transfer efficiency and stability could also be increased. The device fabricated with 1% Chi@RGO-CIS exhibited a PCE of 12.21%. The efficiency was comparable to the efficiency of conventional Pt-based DSSCs.
2 Experimental procedures
2.1 Chemicals and materials
Graphite flakes, sodium nitrate (NaNO3), potassium permanganate (KMnO4), sulfuric acid (H2SO4, 98%), and hydrogen peroxide (H2O2, 30%) were purchased from Sigma Aldrich, Thailand. Ethylene glycol, In(NO3)·6H2O (>99%), Cu(NO3)·3H2O (>99%), iodine, N719 dye, and fluorine-doped tin oxide (FTO)-coated glass slides sheet resistance ∼7 Ω sq−1 were purchased from Sigma Aldrich. All the other chemicals used in the experiments were of analytical grade.
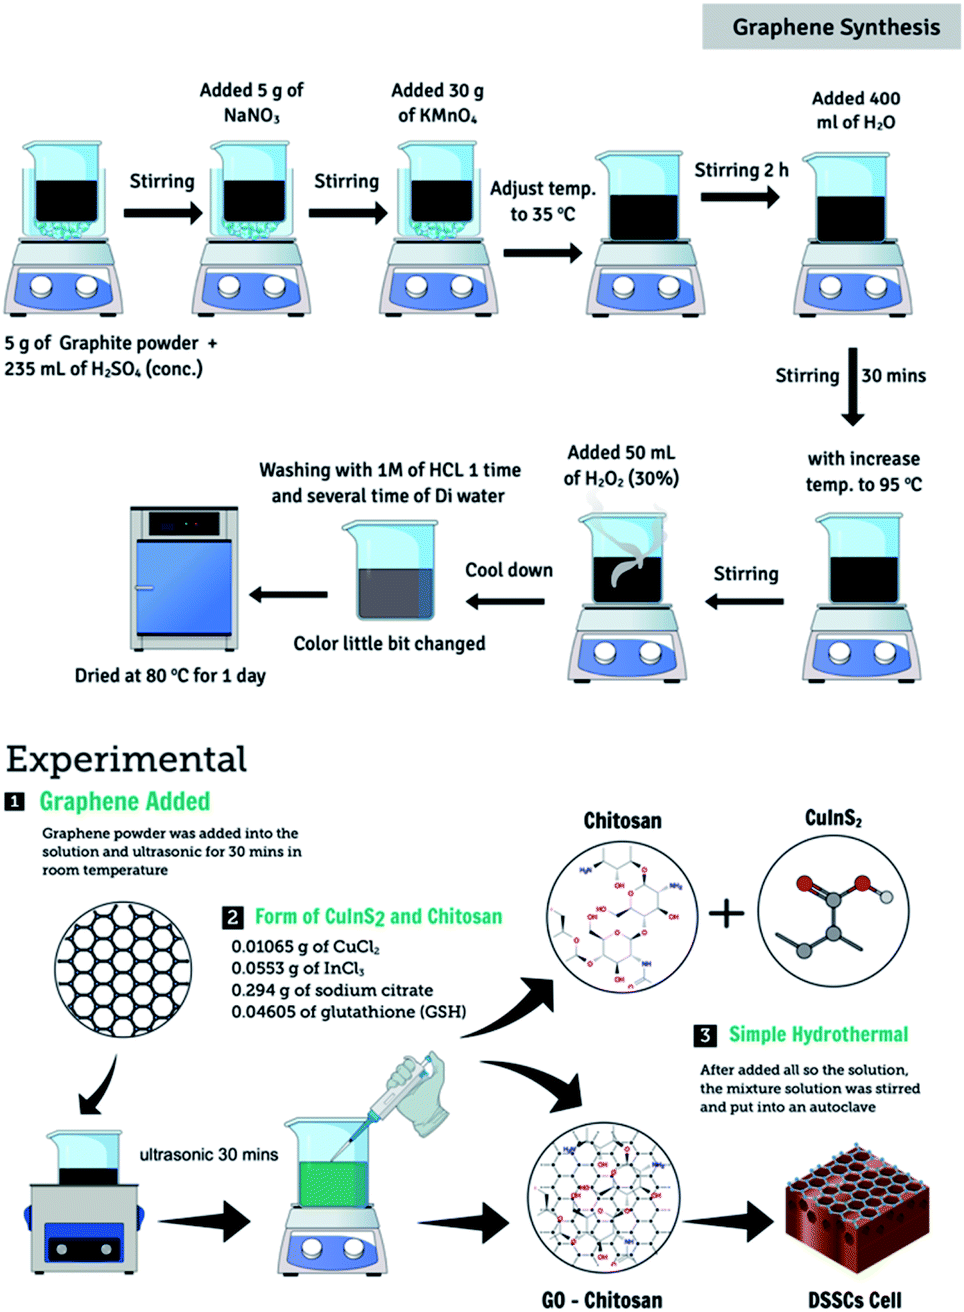
2.2 Synthesis of gamma-irradiated chitosan doped graphene-CuInS2 composites
Graphene oxide (GO) was synthesized following a modified Hummer's method.17 Graphite powder (10 g) was added to 100 mL of concentrated H2SO4 under magnetic stirring conditions. The mixture was stirred continuously for 1 h at 0 °C. Following this, 30 g of KMnO4 was added to the graphite solution. The resulting mixture was stirred at 25 °C for 2 h. Following the addition of the reagent, the solution was heated to 100 °C. Subsequently, 50 mL of H2O2 solution was added dropwise to the above solution under magnetic stirring conditions. The reagent was added for 3 h. Finally, the solution was subjected to conditions of suction filtration, and the powder thus obtained was washed repeatedly with absolute ethanol and deionized water. Following this, the powder was placed in an oven at 80 °C and dried for 2 h to obtain graphene.
The CuInS2 catalyst was synthesized following a simple hydrothermal.18 Equimolar solutions of copper chloride (0.01065 g) and indium chloride (0.0553 g) were mixed with sodium citrate and glutathione in ethylene glycol under conditions of stirring (30 min). Following this, 0.5 g of graphene powder and 1.0 g of gamma-irradiated chitosan were added to the solution. This mixed solution was transferred to a 150 mL Teflon-coated stainless-steel autoclave and heated at 180 °C for 8 h in an air oven. The catalyst obtained after the reaction was washed five times using pure ethanol and DI water. To obtain the gamma-irradiated chitosan-doped graphene-CuInS2 composites, the catalyst was placed in an air oven at 80 °C overnight (CGCs). Fig. 1 depicts the schematic diagram of the synthetic process.
 |
| | Fig. 1 Schematic diagram of the CGC synthesis procedure. | |
2.3 DSSC assembly
The Chi@RGO-CIS composite-based CE and TiO2 photoanode (with I−/I3− pairs of liquid electrolytes) were sandwiched following the doctor blade method. The RGO content in Chi@RGO-CIS was varied as 1%, 1.5%, and 2%. Two layers were used to prepare the TiO2 paste on the FTO substrates. Following this, the samples were annealed at a temperature of 450 °C for 30 min. Following this, the TiO2 paste on the FTO glass was soaked in a ruthenium (N719) solution (soaking time: 24 h). The Chi@RGO-CIS catalyst-based CE was deposited following a spin coating technique using the FTO substrate. Surlyn film (approximately 30 μm) was used to clip the TiO2 photoanode and the Chi@RGO-CIS catalyst-based CE with each other. This helped form a sandwich-type cell. The Pt-based DSSCs were manufactured to equate the electrodes formed by the replacement of Chi@RGO-CIS with the Pt-based CE.
2.4 Characterization
The X-ray diffraction (XRD) technique was used to determine the phase composition of the developed palladium oxide. The experiments were conducted using a Rigaku, SmartLab Model. The field emission scanning electron microscopy (FE-SEM, Apreo 2, Thermo Fisher Scientific, Germany) technique was used to record the scanning electron microscopy images. The images were analyzed to determine the morphology of the Chi@RGO-CIS composites. Photocurrent–voltage (J–V) characterization of the DSSCs were carried out under one sun conditions (100 mW cm−2, AM 1.5 G) using a source meter (Keithley 2440) and a class AAA solar simulator. The electrochemical impedance spectroscopy (EIS) technique characterized the samples in the frequency range of 0.01–100 kHz at 0 V bias.
3 Results and discussion
3.1 Structural properties and morphology
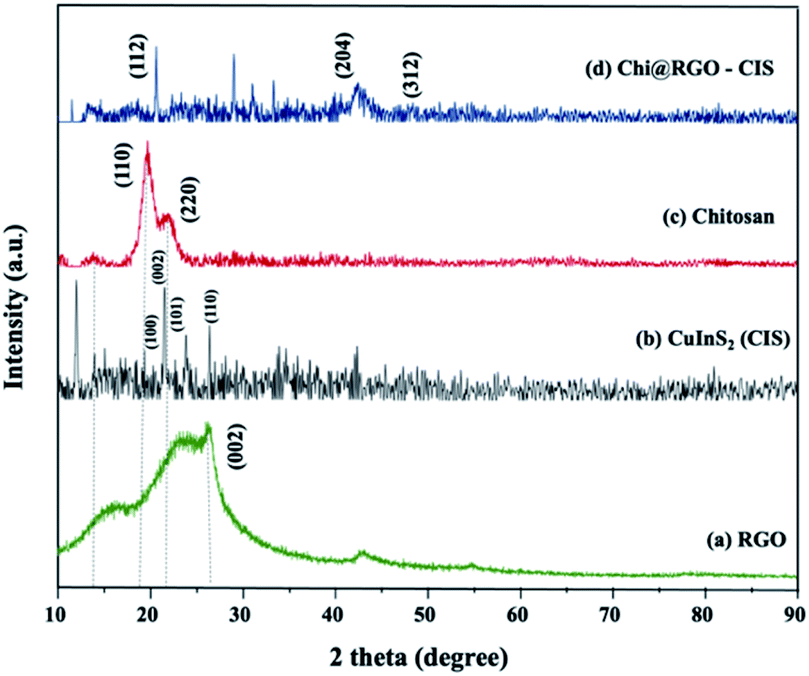
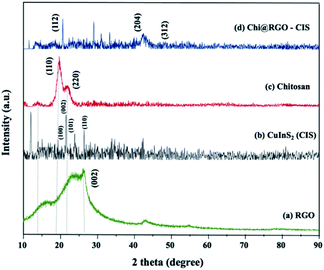
3.1.1 XRD analysis. The crystallographic phases of the synthesized Chi@RGO-CIS catalysts were analyzed using the XRD technique. Fig. 2 presents the XRD patterns of (a) RGO, (b) chitosan after gamma irradiation, and (c) Chi@RGO-CIS. The board diffraction peak at 26.02° corresponds to the crystalline (002) plane associated with RGO.19 For the CuInS2 (CIS) spectra indicated the diffraction peaks at 18.02°, 22.21°, 24.38° and 26.11° which can be indexed to the (100), (002), (101) and (110) planes of CuInS2 (JCPDS card file no. 85-1575) respectively. The diffraction peaks corresponding to the chitosan after irradiation-based nanocomposite appeared at approximately 14.11° and 18.72°. This indicated a hydrated crystalline structure. The broad peak at approximately 22.15° indicates an amorphous structure of chitosan.20 The peaks corresponding to CuInS2 appeared at 29.1°, 31.4°,1–32 42.5°, and 49.1° for the planes (112), (200), (204), and (312), respectively. This indicated the complete conversion of In2S3 into CuInS2. Analysis of the XRD patterns also reveals that the resulting CuInS2 is characterized by a tetragonal crystal structure (JCPDS card no. 75-0106). Under gamma-irradiation, the intensity of the peaks increased, the specific peaks narrowed, and the peaks became sharper in the case of the Chi@RGO-CIS nanocomposite.
 |
| | Fig. 2 X-ray diffraction (XRD) patterns recorded for (a) RGO, (b) irradiated chitosan, and (c) Chi@RGO-CIS. | |
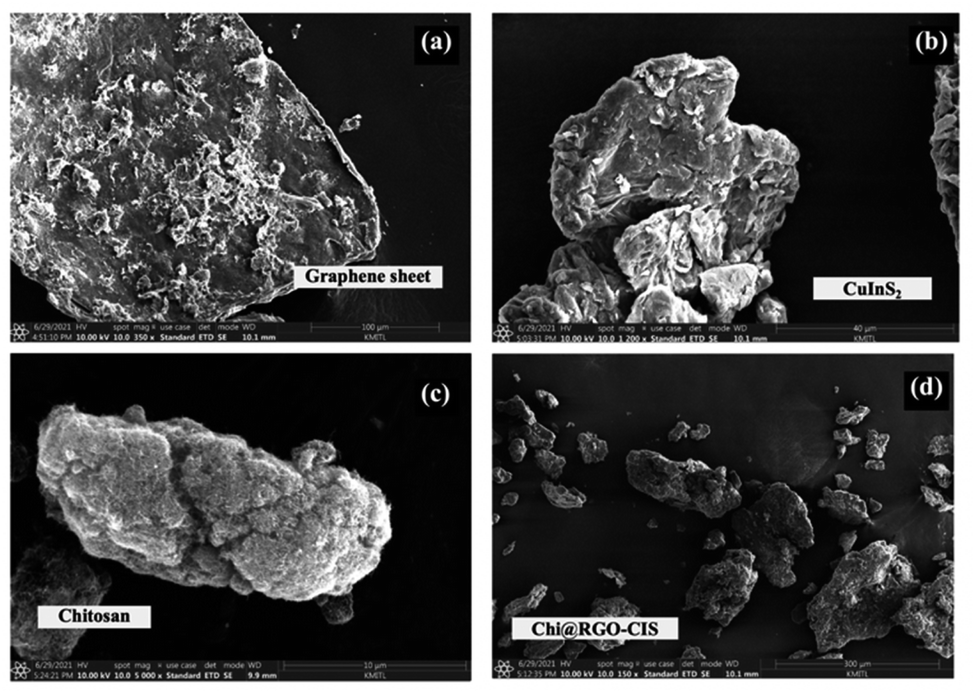
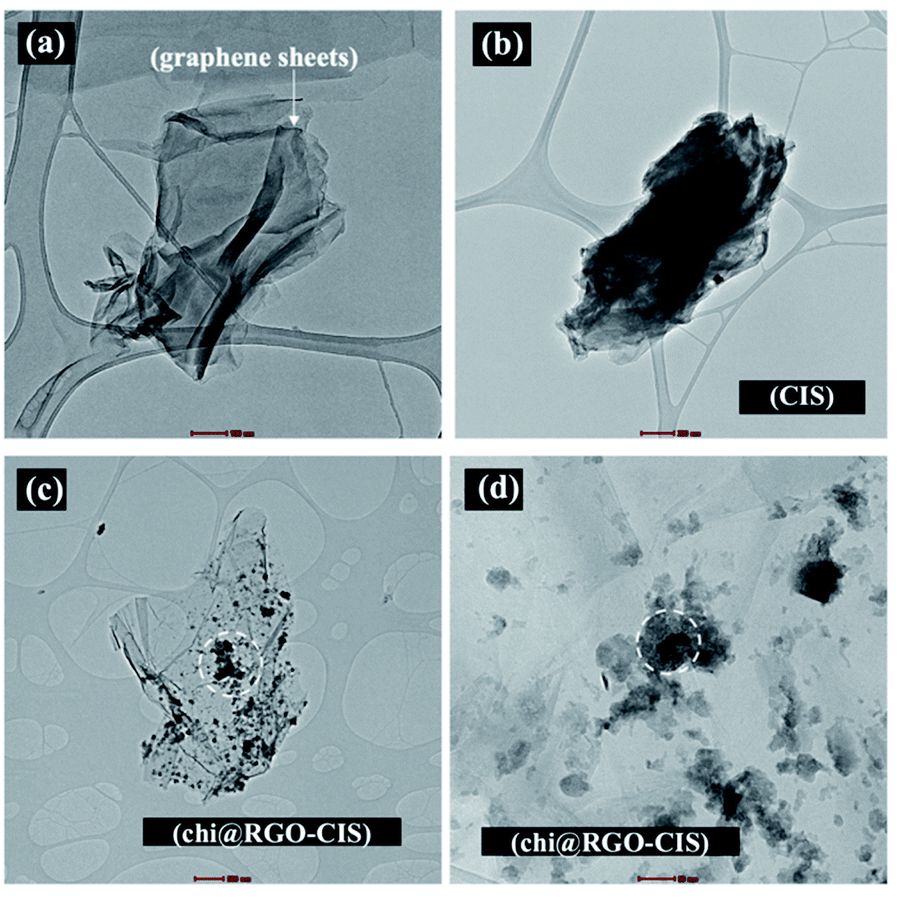
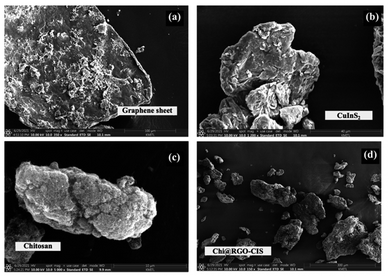
3.1.2 Morphology of the composite. The morphology and microstructure of the prepared Chi@RGO-CIS composite were characterized using the TEM and FE-SEM techniques. The results are shown in Fig. 3 and 4. The graphene sheet, CuInS2 (CIS), chitosan, and Chi@RGO-CIS were analyzed using the FE-SEM technique, as shown in Fig. 3(a–d). The FE-SEM image of graphene shows the presence of 2D ultrathin nanosheets (Fig. 3(a)). The images reveal that the CuInS2 composite exhibited irregular shape and rough surface. It was observed that these exhibited unique 3D micro-spherical structures and were characterized by a rough surface (Fig. 3(b)). The average diameter of the CIS structures was estimated to be approximately 40 μm. The chitosan appears fluffy and is characterized by a rough texture. The average diameter was approximately 10 μm (Fig. 2(c)). The Chi@RGO-CIS composite appeared as a combination of particles and amorphous structures. The diameter was approximately 300 μm. The special structure integrates the advantages of nanostructures and microstructures, resulting in increased surface area of the composite.
 |
| | Fig. 3 SEM images recorded for (a) RGO sheets and (b and c) Chi@RGO-CIS. | |
 |
| | Fig. 4 TEM images recorded for (a) RGO sheets and (b and c) Chi@RGO-CIS. | |
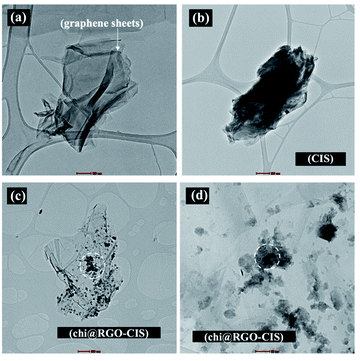
Chi@RGO-CIS TEM images were captured to study the morphology of the RGO sheets. The TEM images of the RGO sheets are shown in Fig. 4(a). The thicknesses of the sheets are depicted in the figures. The black dots observed in the images recorded for Chi@RGO-CIS represented chitosan and CIS (average size: approximately 10–20 nm). These were present on the surface of graphene sheets. The results confirmed the good crystallinity of the novel composite.21
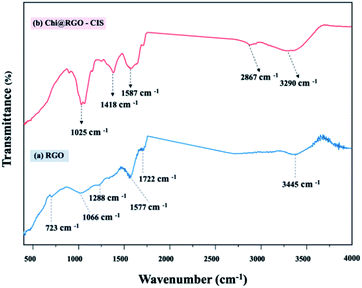
3.1.3 FTIR and Raman spectra. The FTIR spectral profiles of RGO and Chi@RGO-CIS are presented in Fig. 5. The spectral profile recorded for GO shows the presence of peaks at approximately 1066 cm−1. This peak was attributed to C–O stretching. The peak at 1288 cm−1 was attributed to C–O–C bending. The peak corresponding to C–OH bending appeared at 1577 cm−1. The peak at 1720 cm−1 corresponded to the C![[double bond, length as m-dash]](https://www.rsc.org/images/entities/char_e001.gif) O stretching vibration. The broad peak at 3445 cm−1 was attributed to the stretching vibrations of the O–H group present in the C–OH groups and water. The broadband at approximately 3290 cm−1 was attributed to the overlap of the peak corresponding to the axial stretching vibrations of the hydroxyl groups (O–H) and the peaks corresponding to the asymmetric/symmetric stretching of the amine bonds (N–H). The band observed at 2867 cm−1 was attributed to axial stretching of the –C–H group in the chitosan chain. The band centered at 1587 cm−1 corresponds to the bending vibration of the primary amine (NH2) in the polymeric chitosan chain. Peaks corresponding to other functional moieties (polysaccharide ring or end groups) in chitosan were also observed. The peak corresponding to C–N stretching appeared at 1418 cm−1, the peak corresponding to CH3 bending appeared at 1372 cm−1, and the peak corresponding to C–OH stretching appeared at 1025 cm−1. Analysis of the FTIR spectral profile indicated the successful modification of chitosan in the Chi@RGO-CIS composite.22–25
O stretching vibration. The broad peak at 3445 cm−1 was attributed to the stretching vibrations of the O–H group present in the C–OH groups and water. The broadband at approximately 3290 cm−1 was attributed to the overlap of the peak corresponding to the axial stretching vibrations of the hydroxyl groups (O–H) and the peaks corresponding to the asymmetric/symmetric stretching of the amine bonds (N–H). The band observed at 2867 cm−1 was attributed to axial stretching of the –C–H group in the chitosan chain. The band centered at 1587 cm−1 corresponds to the bending vibration of the primary amine (NH2) in the polymeric chitosan chain. Peaks corresponding to other functional moieties (polysaccharide ring or end groups) in chitosan were also observed. The peak corresponding to C–N stretching appeared at 1418 cm−1, the peak corresponding to CH3 bending appeared at 1372 cm−1, and the peak corresponding to C–OH stretching appeared at 1025 cm−1. Analysis of the FTIR spectral profile indicated the successful modification of chitosan in the Chi@RGO-CIS composite.22–25
 |
| | Fig. 5 FTIR spectral profiles recorded for (a) RGO and (b) Chi@RGO-CIS. | |
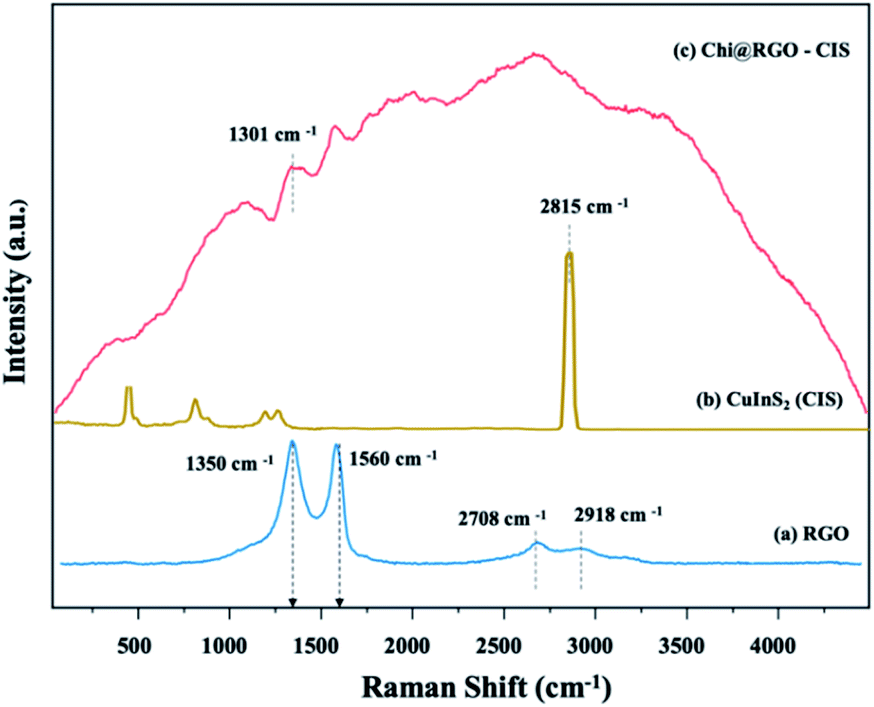
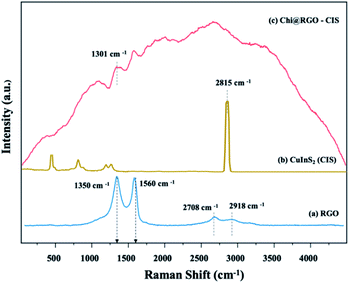
Using Raman spectroscopy, the structural quality of RGO and Chi@RGO-CIS was investigated (Fig. 6). The two peaks at around 1350 cm−1 were assigned to the D band (A1 g breathing mode), and the peak at 1560 cm−1 was assigned to the G band (symmetric E2g of sp2 carbon atoms) of graphene (blue line).26 Moreover, the chitosan polymer matrix depicts peaks at 1150 cm−1, 1250 cm−1 can be assigned as the following: the C–C stretching region and the main peak at 2815 cm−1. Which are related to the stretching vibration of activated hydrogen and C–H saturated methylene, respectively. While the profile corresponding to powdered Chi@RGO-CIS is shown in Fig. 6 (red line). Five peaks appear at 240, 263, 291, 319, and 340 cm−1, and these were assigned to the E, B2, A1, E, and B2 modes of the chalcopyrite phase of CuInS2. The strong peak appearing at 291 cm−1 can be potentially assigned to the A1 mode, while the peak at 340 cm−1 can be assigned to the B2 mode. Overall, an almost similar spectrum trend was observed in chitosan/graphene oxide (Chi/GO) nanohybrid with some shifts in bands position. It consists of the vibrations of chitosan and RGO, which confirms the blending of chitosan with RGO. The peak at 1301 cm−1 between chitosan and RGO through hydrogen bonding. Moreover, the peaks of chitosan decreased, which means less active hydrogen and more methylene groups after crosslinking. Chitosan also states that the reason for the decrease in peak at 2815 cm−1.
 |
| | Fig. 6 Raman spectral profiles recorded for (a) RGO and (b) Chi@RGO-CIS. | |
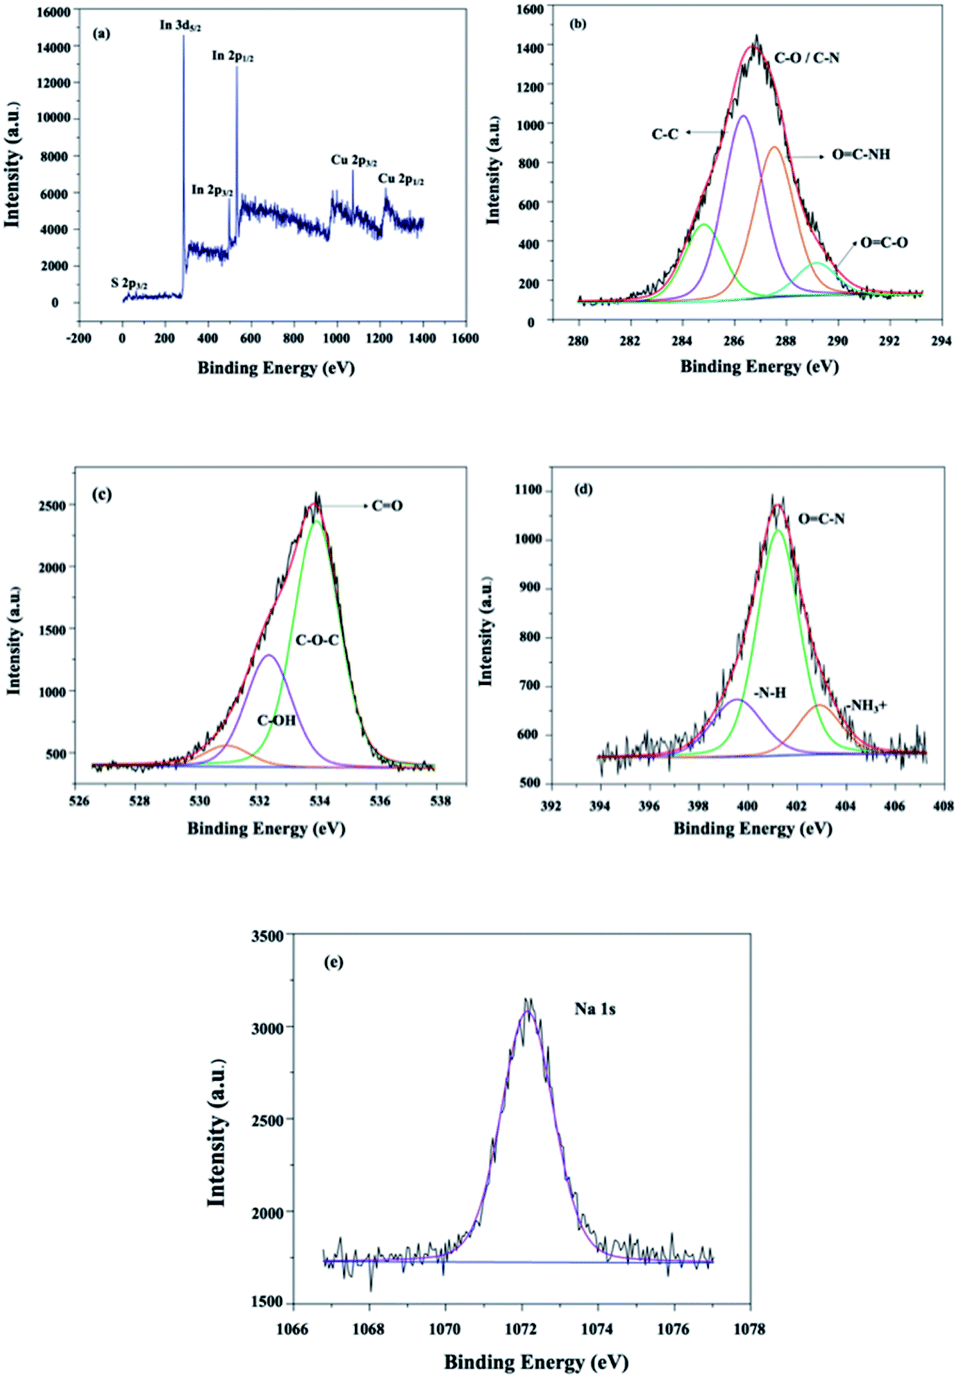
3.1.4 Chemical states of Chi@RGO-CIS. The X-ray photoelectron spectroscopy (XPS) technique was used to investigate further the chemical composition of the prepared Chi@RGO-CIS Fig. 7(a–e). Analysis of the XPS profiles presented in Fig. 7(a) confirms the presence of Cu, In, and S (for CIS) in the resulting Chi@RGO-CIS composites. The peak at 284.6 eV was ascribed to the sp2 hybridized C–C bond, while the peak at 285.7 eV corresponded to the sp3 hybridized C–C bond. The peak at 286.6 eV was attributed to the C–O bond, and the peak at 289.0 eV was ascribed to the O–C =O bond (Fig. 7(b)). The high-resolution O 1s spectrum, presented in Fig. 7(c), shows the presence of three intense peaks at 529.5, 531.2, and 533.1 eV. These peaks were ascribed to the lattice oxygen in RGO.27 The characteristic peaks of N 2p at the binding energies of 399.0 eV, 401.2 eV, and 403.2 eV, correspond to the –N–H, OC–N, and –NH3+ units (Fig. 7(d)). The sodium functionalities could be identified by analyzing the Na 1s profiles. The peak at a binding energy of 1072.0 eV confirmed the oxidation state of the chitosan unit after gamma irradiation.28
 |
| | Fig. 7 XPS profiles recorded (a) under conditions of high-resolution, (b) for C 1s, (c) for O 1s, (d) for N 2p, and (e) for Na 1s. | |
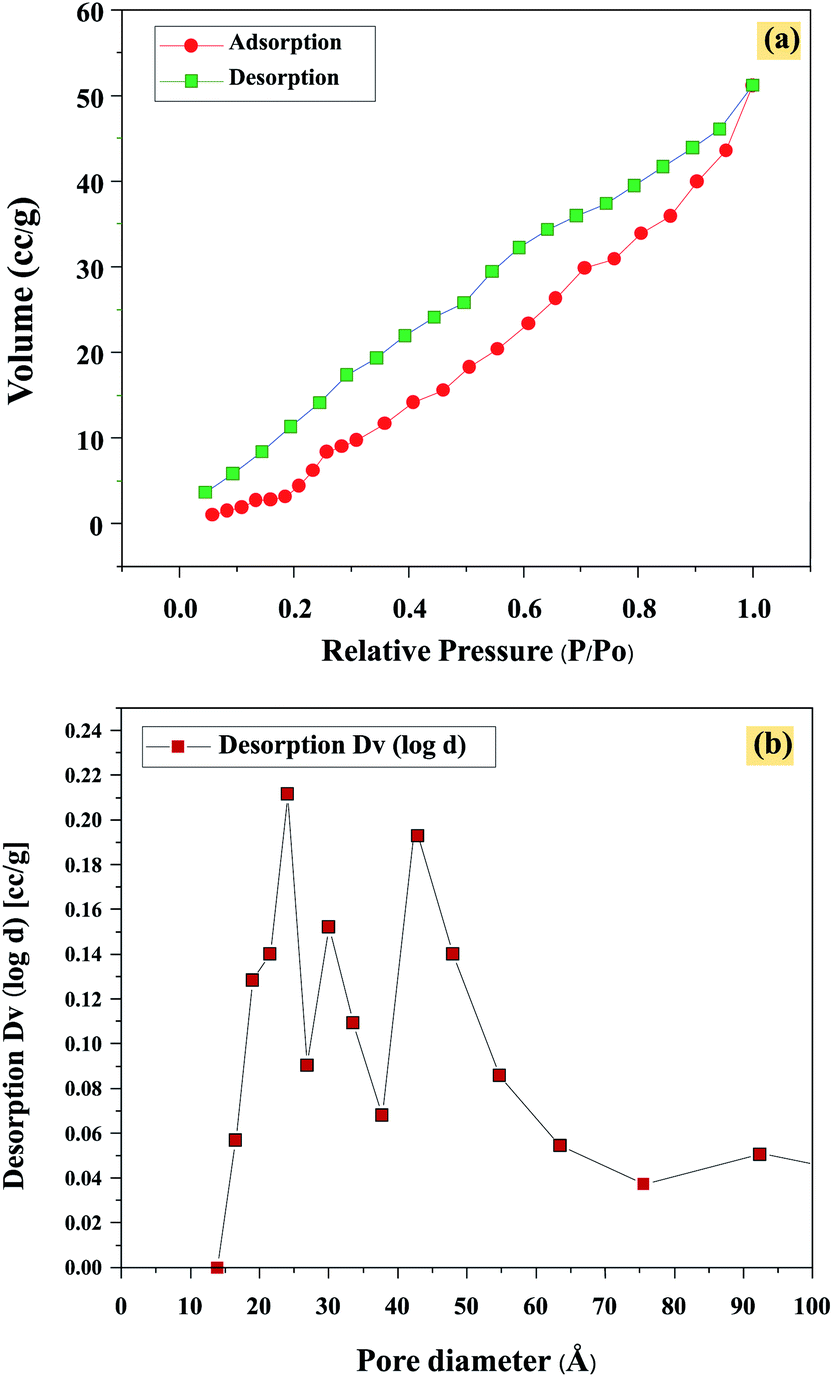
3.1.5 N2 adsorption–desorption properties. The N2 adsorption–desorption isotherms, pore size distribution, and specific area of Chi@RGO-CIS are presented in Fig. 8(a). The Chi@RGO-CIS samples present a mode of type I, suggesting that they are primarily characterized by a micro-porous structure. The high BET surface area (3.41 m2 g−1; pore volume: 0.0127 mL g−1) could be attributed to the high surface area of chitosan and RGO coated on CIS. In addition, the average pore size of Chi@RGO-CIS was in the range of 20–50 nm (Fig. 8(b)). The highly porous nanostructures and large BET surface area impart the Chi@RGO-CIS electrode with excellent reactivity in the presence of electrolytes and active materials. It also allows the establishment of rapid charge transfer kinetics.28
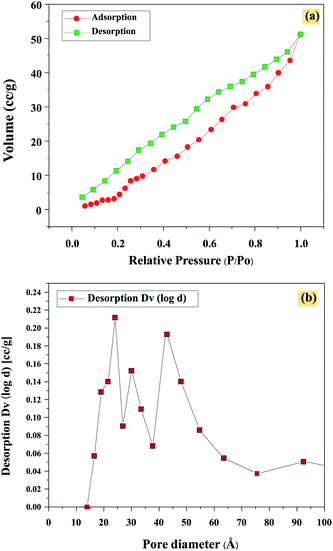 |
| | Fig. 8 (a) Isotherm and (b) pore size of Chi@RGO-CIS. | |
3.2 Electrochemical measurements
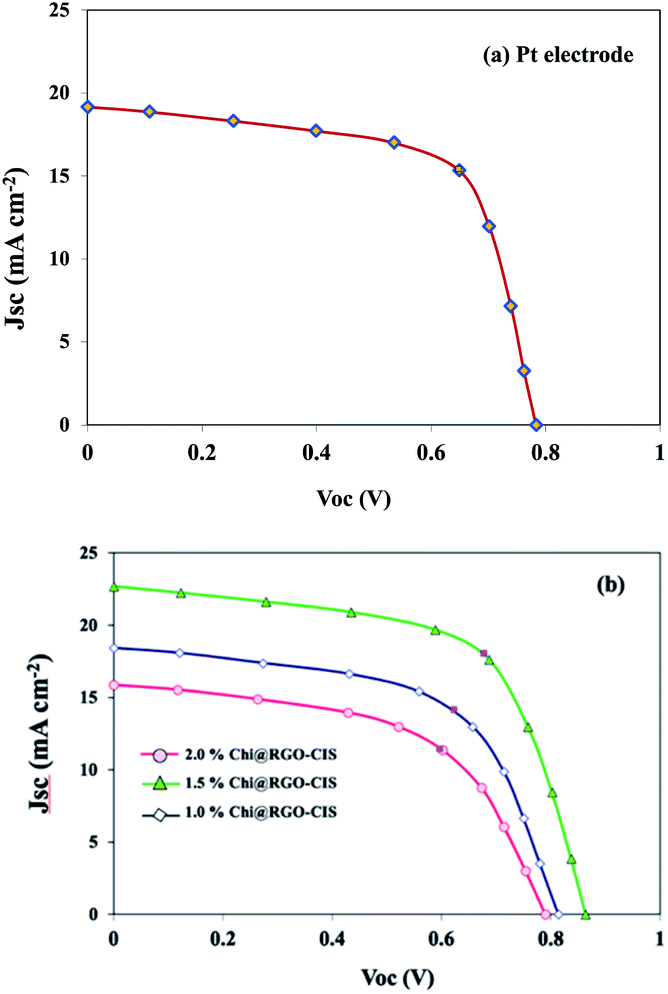
3.2.1 Photovoltaic (PV) study with DSSCs. The PV characteristics of each cell were measured under AM 1.5 G simulated sunlight. The current density–voltage (J–V) characteristics of DSSCs are shown in Fig. 9. The obtained photovoltaic parameters are presented in Table 1, and the overall efficiencies were calculated as follows:| | |
η = (JSC × VOC × FF)/PLight
| (1) |
 |
| | Fig. 9 Current–voltage characteristics of DSSCs fabricated using Pt, 1.0% Chi@RGO-CIS, 1.5% Chi@RGO-CIS, and 2% Chi@RGO-CIS. | |
Table 1 Photovoltaic performance of Chi@RGO-CIS CE under conditions of varying RGO contents
| Sample |
Voc (V) |
Jsc (A cm−2) |
FF |
PCE (%) |
Rs (Ω) |
Rct (Ω) |
| Pt electrode |
0.78 |
19.16 |
0.66 |
9.96 |
10.78 |
71.43 |
| 1.0% Chi@RGO-CIS |
0.81 |
18.43 |
0.58 |
8.82 |
10.32 |
40.32 |
| 1.5% Chi@RGO-CIS |
0.86 |
22.70 |
0.62 |
12.21 |
10.21 |
31.12 |
| 2.0% Chi@RGO-CIS |
0.79 |
14.90 |
0.54 |
6.83 |
10.88 |
128.7 |
As the photon-to-current conversion efficiency (η) depends on the open-circuit photovoltage (VOC), short circuit photocurrent density (JSC), and fill factor (FF). The Pt-based CE exhibited a PCE of approximately 9.96% (VOC = 0.78 V, JSC = 19.16 mA cm−2, FF = 0.66). The maximum PCE recorded for the 1.5% Chi@RGO-CIS system was 12.21% (under similar conditions). The enhanced performance can be attributed to the synergism between the increased surface area available for electrolyte reduction and the increased conductive path between the chitosan CIS nanoparticles realized following the addition of RGO. However, the PCE recorded for 2% Chi@RGO-CIS (6.83%) decreased with an increase in the concentration of RGO. This may be attributed to the formation of impure crystals or the presence of an excess of precursor materials with CIS crystals. These impurities act as trapping sites and severely block the movement of electrons. Under these conditions, the current density (JSC) decreases at higher contents.29
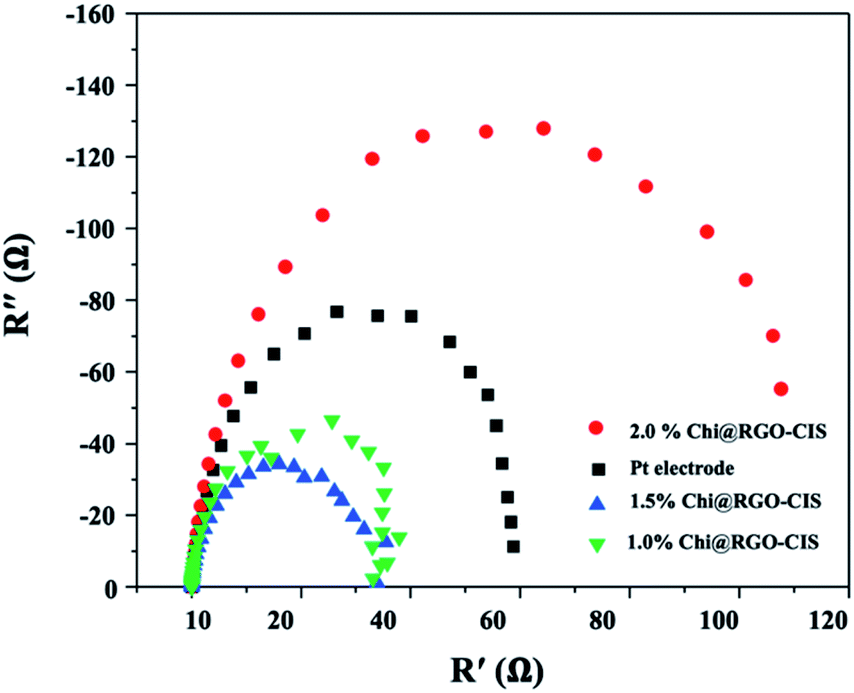
3.2.2 EIS analysis. The EIS technique was used to determine the interface resistance and study the kinetics of charge transport for Chi@RGO-CIS at the CEs/electrolyte interface.30 The Nyquist plots generated for the Pt-based DSSC Pt electrode, 1% Chi@RGO-CIS, 1.5% Chi@RGO-CIS, and 2% Chi@RGO-CIS CEs are presented in Fig. 10, and the results are listed in Table 1. It normally comprises of three semicircles. The first semicircle denotes the charge transfer resistance (Rct) at the interface of CE and the electrolyte. The charge transfer resistance (Rs) at the interface of the electrolyte and the photoanode is represented by the second arc. The third arc shows the diffusion of the redox couple in the electrolyte (Zw). The magnitude of interface resistance depends on the diameter of the semicircles. The results reveal that the DSSCs fabricated with 1.5% Chi@RGO-CIS CE exhibit slightly lower Rct (value: 32.04 Ω) than the DSSCs fabricated using Pt-based cells (value: 72.33 Ω). This indicates that an increased electrocatalytic ability for I3 reduction can be achieved using 1.5% of Chi@RGO-CIS. The increase in activity can be attributed to the occurrence of the rapid charge-transfer process.31,32
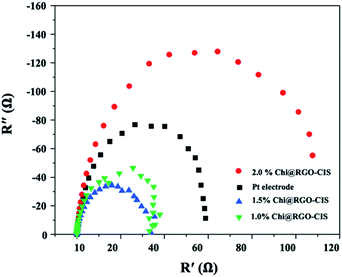 |
| | Fig. 10 Nyquist plots generated using the electrochemical impedance spectroscopy (EIS) technique for Pt, 1.0% Chi@RGO-CIS, 1.5% Chi@RGO-CIS, and 2% Chi@RGO-CIS. | |
4 Conclusions
By optimizing the amounts of RGO, we were able to successfully fabricate the Chi@RGO-CIS composite-based CE for the fabrication of DSSCs. The synthesized Chi@RGO-CIS composite is electrochemically stable, exhibits high catalytic activity, possesses a large surface area, and contains a large number of electrocatalytic sites that are utilized for reduction reactions taking place at counter electrodes. The maximum PCE recorded for DSSCs fabricated using 1.5% Chi@RGO-CIS was 12.21%. This was higher than the PCE (recorded under the same conditions) of Pt-based DSSCs (9.96%). The excellent performance achieved using Chi@RGO-CIS could be attributed to the excellent electrocatalytic activity of the system toward the I−/I3− redox reaction. The conditions of gamma irradiation help in obtaining a large surface area. Many electrocatalytic sites (for CIS) are also generated under these conditions. These results suggested that cubical Chi@RGO-CIS nanocrystals could be the best alternative catalyst for Pt-free DSSCs.
Author contributions
Y. Areerob, C. Hamontree and S. Laksee conceived and planned the experiments. Y. Areerob and C. Hamontree carried out the experiment. Y. Areerob wrote the manuscript with support from K. Pattarith and W.C. Oh. P. Sricharoen and N. Limchoowong verified the analytical methods. All authors discussed the results and contributed to the final manuscript.
Conflicts of interest
There are no conflicts to declare.
Acknowledgements
This work is supported by King Mongkut's Institute of Technology Ladkrabang (2564-02-01-001). We are grateful for the support received from the FE-SEM center, School of Engineering, King Mongkut's Institute of Technology Ladkrabang, Bangkok.
Notes and references
- D. K. Shah, D. KC, T. G. Kim, M. S. Akhtar, C. Y. Kim and O. B. Yang, Opt. Mater., 2021, 121, 111500 CrossRef CAS.
- D. S. Patil, K. C. Avhad and N. Sekar, Comput. Theor. Chem., 2018, 1138, 75–83 CrossRef CAS.
- E. Demir, A. Savk, B. Sen and F. Sen, Nano-Struct. Nano-Objects, 2017, 12, 41–45 CrossRef CAS.
- K. Ahmad, A. Mohammad and S. M. Mobin, Electrochim. Acta, 2017, 252, 549–557 CrossRef CAS.
- B. S. Arslan, S. N. Ülüş, M. Gezgin, B. Arkan, E. Güzel, D. Avcı, M. Nebioğlu and İ. Şişman, Opt. Mater., 2020, 106, 109974 CrossRef CAS.
- R. Singh, N. Kaur, Navjyoti and A. Mahajan, Sol. Energy, 2021, 226, 31–39 CrossRef CAS.
- F. Gao, K. Liu, C. Ruzhou and Y. Zhang, Appl. Surf. Sci., 2020, 528, 146560 CrossRef CAS.
- U. Mehmood and A. Khan, Sol. Energy, 2019, 193, 1–5 CrossRef CAS.
- Z. Jiang, K. Zhang, L. Du, Z. Cheng, T. Zhang, J. Ding, W. Li, B. Xu and M. Zhu, Mater. Sci. Eng., C, 2021, 126, 112178 CrossRef CAS PubMed.
- V. C. Dumont, H. S. Mansur, A. A. P. Mansur, S. M. Carvalho, N. S. V. Capanema and B. R. Barrioni, Int. J. Biol. Macromol., 2016, 93, 1465–1478 CrossRef CAS PubMed.
- A. A. Varghese, E. Kuriakose, J. Jose, S. Aryal, R. Khanal and E. Anila, Appl. Surf. Sci., 2022, 579, 152162 CrossRef CAS.
- N. G. Madian and N. Mohamed, J. Mater. Res. Technol., 2020, 9(6), 12970–12975 CrossRef.
- T. A. Dar, M. Uddin, M. Masroor, A. Khan, A. Ali, S. R. Mir and L. Varshney, J. Radiat. Res. Appl. Sci., 2015, 8(3), 446–458 CrossRef.
- I. Bano, M. A. Ghauri, T. Yasin, Q. Huang and A. D. Palaparthi, Int. J. Biol. Macromol., 2014, 65, 81–88 CrossRef CAS PubMed.
- K. Olszowska, J. Pang, P. S. Wrobel, L. Zhao, H. Q. Ta, Z. Liu, B. Trzebicka, A. Bachmatiuk and M. H. Rummeli, Synth. Met., 2017, 234, 53–85 CrossRef CAS.
- R. Kaur, K. H. Kim and A. Deep, Appl. Surf. Sci., 2017, 396, 1303–1309 CrossRef CAS.
- C. Tamilselvi, P. Duraisamy and N. Subathra, Diamond Relat. Mater., 2021, 116, 108396 CrossRef CAS.
- A. Alkhouzaam, H. Qiblawey, M. Khraisheh and M. Atieh, Ceram. Int., 2020, 46(15), 23997–24007 CrossRef CAS.
- M. Ali, J. E. Nady, S. Ebrahim and M. Soliman, Opt. Mater., 2018, 86, 545–549 CrossRef CAS.
- T. Soltani, A. Tayyebi and B. K. Lee, Sol. Energy Mater. Sol. Cells, 2018, 185, 325–332 CrossRef CAS.
- A. M. Zardkhoshoui and S. S. H. Davarani, J. Electroanal. Chem., 2018, 827, 221–229 CrossRef CAS.
- Z. Luan, Y. Tian, L. Gai, H. Jiang, X. Guo and Y. Yang, J. Alloys Compd., 2017, 729, 9–18 CrossRef CAS.
- H. Alijani, M. Abdouss and H. Khataei, Diamond Relat. Mater., 2022, 122, 108817 CrossRef CAS.
- J. Singh and A. S. Dhaliwal, J. Phys. Chem. Solids, 2022, 160, 110358 CrossRef CAS.
- O. C. Olatunde and D. C. Onwudiwe, Results Chem., 2022, 100273 CrossRef CAS.
- W. Wei, L. Wang, Q. Huang and T. Li, J. Alloys Compd., 2019, 783, 37–43 CrossRef CAS.
- L. Sun, J. Sun, K. Zhang, X. Sun, S. Bai, Y. Zhao, R. Luo, D. Li and A. Chen, Sens. Actuators, B, 2022, 354, 131194 CrossRef CAS.
- B. Huang, Z. Zhang, N. Ding, Y. Zhuang, G. Zhang and P. Fei, Int. J. Biol. Macromol., 2022, 194, 246–253 CrossRef CAS PubMed.
- M. Alhaddad and A. Shawky, J. Mol. Liq., 2020, 318, 114377 CrossRef CAS.
- A. Das, R. R. Wary and R. G. Nair, Solid State Sci., 2020, 104, 106290 CrossRef CAS.
- S. Shital, S. K. Swami, P. Barnes, V. Dutta and M. Carlo, Sol. Energy, 2018, 161, 64–73 CrossRef CAS.
- H. Y. Chen, B. Y. Huang, H. S. Koo and M. T. Huang, Optik, 2020, 220, 164899 CrossRef CAS.
|
| This journal is © The Royal Society of Chemistry 2022 |
Click here to see how this site uses Cookies. View our privacy policy here. 
 Open Access Article
 This Open Access Article is licensed under a Creative Commons Attribution-Non Commercial 3.0 Unported Licence
 b,
Nunticha Limchoowong
b,
Nunticha Limchoowong