 Open Access Article
Creative Commons Attribution 3.0 Unported Licence
5-N-Arylaminothiazoles with pyridyl groups and their first-row transition metal complexes: synthesis, photophysical properties, and Zn sensing†
Khurnia Krisna Puji Pamungkas,
Toshifumi Maruyama and
Toshiaki Murai *
*
Department of Chemistry and Biomolecular Science, Faculty of Engineering, Gifu University, Yanagido, Gifu 501-1193, Japan. E-mail: mtoshi@gifu-u.ac.jp
First published on 16th May 2022
Abstract
A series of 5-N-arylaminothiazoles were synthesized with facile diversity-oriented synthesis from readily available starting materials via the reaction of thioamide dianions and thioformamides. The introduction of various substituents at the 2-position of a thiazole ring (i.e., 2-pyridyl, 4-methylpyridyl, and phenyl groups) and on the nitrogen atom (i.e., p-tolyl and phenyl groups) significantly influenced the absorption and emission spectra of the isolated compounds. X-ray analysis confirmed that the substituents at the amino site were twisted from a thiazole ring, while the formation of its nickel complex showed dinuclear metal complexes bridged with chlorine atoms. Moreover, the formation of zinc–thiazole complexes showed enhanced emission properties in solution and noticeable emission in a solid state. In addition, thiazole-bridged dypyrromethene type ligands showed high selectivity toward Zn+2, which make them good candidates for zinc sensing.
Introduction
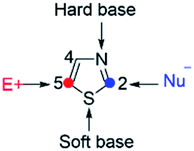
Thiazoles are five-membered heteroaromatics that contain sulfur and nitrogen atoms in a cyclic ring system (Fig. 1). One of the distinctive features of thiazoles is that they have a sulfur atom, which is a soft base, and a nitrogen atom, which is a hard base. This implies that thiazoles can coordinate to a range of soft and hard metals. Moreover, the calculated π-electron densities of thiazoles suggest that C5 is the most favorable site for electrophilic substitutions, followed by C4, while C2 is a preferable site for nucleophilic substitutions.1Many thiazole-based compounds are now in clinical use, such as the anticancer drug dasatinib,2 and the anti-HIV drug ritonavir.3 Additionally, thiazoles have three carbon atoms at the 2-, 4-, and 5-positions, to which a wide variety of substituents can be principally introduced. Therefore, a wide range of thiazole derivatives have been developed. On the other hand, the chemistry of thiazoles has been extended to the development of thiazole-based fluorescent materials. These fluorescent compounds exhibit unique photophysical properties such as aggregation induced emission (AIE),4,5 thermochromism,4 mechanochromism,6 and large Stokes shifts,7 and some of them are acid-responsive fluorescent compounds (Fig. 2).8
Thiazole can connect to several electron donor-containing fragments which exhibit coordination ability such as a pyridyl group. Due to this modification, several thiazoles coordinated to a boron atom have been reported to show acid-responsive properties9 and aggregation induced emission (AIE) with high quantum yields of up to 95% in the solid state.10 Moreover, thiazoles are also suitable as organic ligands to various metal. In fact, the presence of a metal surface closest to the fluorescent molecule can manipulate the decay rate of the fluorophore and produce drastic spectral changes.11 Moreover, interactions between a metallic surface with fluorophores have a beneficial effect on photophysical properties such as an increased quantum yield, improved photostability and a reduced lifetime of fluorophores.12
Intense studies on thiazole-based ligands coordinated to a transition metal have increased over the past several years. A considerable number of metal–thiazole complexes have been discovered to be catalytically13,14 and biologically active compounds for medical applications.15,16 In addition, the most commonly reported thiazoles coordinated to transition metals that show luminescence properties are complexes with ruthenium,17–19 iridium,20 rhenium,21 platinum,22 and lanthanoid elements (Fig. 3).23–25
Those works have mainly focused on the second- and third-row transition metals, while the uses of the first-row transition metals (Fe, Co, Ni, Co, and Zn) are less favorable due to their exceptionally short CT lifetimes arising from deactivation through low-lying ligand-field excited states.26 Nevertheless, the coexistence of nitrogen and sulfur atoms in a thiazole ring could promote the stabilization of Ni(II) complexes.27 Some of the first-row transition metals such as nickel and zinc are widely used as complexing agents for various purposes. For example, zinc metal complexes with thiazole pyridine-based ligands are biologically active as anti-microbial and anti-tumor agents.16 Meanwhile, nickel coordinated to thiazole-4-carboxylic acid exhibited polymorphism properties.28 However, there have been only a few reports on first-row transition metal–thiazole complexes.29,30 (Fig. 4).
Recently, several fluorescent molecules have been used for the molecular recognition of zinc ions. However, due to its closed shell electron configuration (3d10), zinc ion is silent with respect to spectroscopic or magnetic signals.31,32 Therefore, a reliable technique for the detection of zinc ion is highly desirable. The most promising method for detecting zinc ion is by using fluorescence. Besides, fluorescence detection is fast, efficient, and simple.33,34 For example, imidazole-based compounds showed an increase in emission intensity in the presence of zinc ions.35 Meanwhile, zinc sensing based on thiazole compounds showed turn on–off emission properties36 and a strong emission response and a high quantum yield on addition of zinc ions (Fig. 5).37
Our group has been interested in the chemistry of 5-N-arylaminothizoles for many years. Therefore, a considerable number of these compounds have been developed.38–44 5-N-Arylaminothiazoles are a class of fluorescent compounds bearing a flexible conformational geometry with non-planar carbon skeletons.38 These compounds are synthesized by reacting secondary thioamide and thioformamides via thioamide dianions and thiazolines. This synthetic protocol allows us to access a wide range of unprecedented 5-N-arylaminothiazoles with various substituents at the 2- and 4-positions of a thiazole ring.
Herein we report a series of 5-N-arylaminothiazole having pyridyl groups and their first-row transition metal complexes. The synthesis, structural elucidation, and photophysical properties both in a solid state and in solution are discussed.
Results and discussion
Synthesis of 5-aminothiazolines and 5-N-arylaminothiazoles
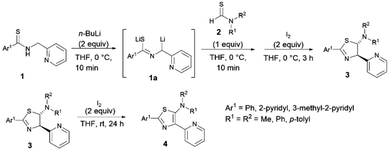
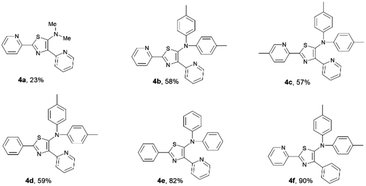
The synthesis of ligands is depicted in Scheme 1. The new thiazole ligands were synthesized by deprotonation of secondary thioamides 1 with 2 equivalents of organolithium (n-BuLi) at low temperature to generate thioamide dianions 1a. Addition of thioformamides 2 and iodine to the reaction mixture gave 5-aminothiazolines 3 as major products.44 Further oxidation of 5-aminothiazolines 3 with 2 equivalents of iodine resulted in the formation of the corresponding 5-aminothiazole ligand 4 in low to good yields. Following this reaction, a wide range of substituents possessing electron-donating and -withdrawing properties could be introduced to the 2-, 4-, and 5- positions of the thiazole ring.As a result, the introduction of pyridyl groups at the 2- and 4-positions gave 4a in 23% yield. Replacement of a methyl group with other functional groups at the 5-position of a thiazole ring led to an increase in the yield of the product. Incorporation of a tolyl group significantly improved the yield of the product 4b to 58%. In addition, the introduction of a methyl group at the para position of a pyridyl moiety gave 4c in 57% yield. Furthermore, the incorporation of pyridyl groups only at the 2- or 4-positions of a thiazole ring afforded thiazole products 4d, 4e, and 4f in yields of 59%, 82% and 90%, respectively (Fig. 6).
In addition, we also synthesized dipyrromethene-type ligands 6 following the protocol reported previously by our group.9 Initially, the 5-H thiazoles 5 undergo bromination reaction followed by Buchwald–Hartwig amination to give the corresponding thiazole ligands 6a and 6b in yields of 60% and 49%, respectively (Scheme 2).
Synthesis of first-row transition metal–thiazole complexes
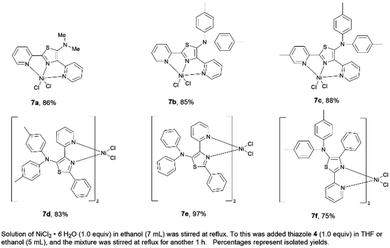
A series of nickel–thiazole complexes 7 were prepared in two steps: (i) reflux of the metal source in ethanol under an inert atmosphere, (ii) synthesis of the desired final products by reacting the corresponding ligand 4 with nickel chlorides under reflux. As a result, all of the metal complexes were isolated in moderate to high yields (Fig. 7). ESI-mass analysis suggested two sets of nickel complex formations such as [Ni(L)X2] for nickel complex having a tridentate ligand (7a, 7b, and 7c) and [Ni(L2)X2] for nickel complex having a bidentate ligand (7d, 7e, and 7f).Having succeeded in the synthesis of nickel–thiazole complexes, we then turned our attention to the synthesis of metal–thiazole complexes using other first-row transition metal atoms such as zinc. A series of zinc–thiazole metal complexes were synthesized by simply mixing the corresponding thiazoles 4f with zinc halides at room temperature. Following this procedure, new zinc thiazole complexes 7 with different halides were synthesized in moderate to high yields (Fig. 8). To our delight, these complexes showed good solubility in most organic solvents. ESI-mass analysis suggested that the zinc atom is coordinated to two bidentate thiazole ligands to form 2![[thin space (1/6-em)]](https://www.rsc.org/images/entities/char_2009.gif) :
:![[thin space (1/6-em)]](https://www.rsc.org/images/entities/char_2009.gif) 1 metal complexes [Zn(L2)X2].44
1 metal complexes [Zn(L2)X2].44
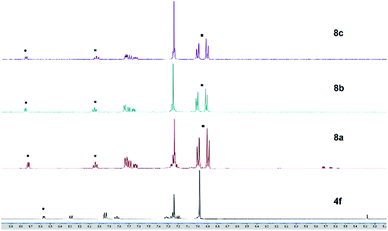
Solutions of these zinc complexes in deuterated chloroform were prepared for NMR analyses. With the addition of 1 equivalent of zinc ion, the signals of protons of the thiazole ligand at 8.57 ppm and 7.83 ppm were shifted downfield to at 8.75 ppm and 8.04 ppm, respectively. Furthermore, in the formation of zinc complexes, two new doublet peaks integrated for 8 protons assigned to phenyl rings in the tolyl groups appeared at 7.00 ppm and 6.90 ppm, respectively. However, the proton signal and chemical shift of the complexes are almost identical despite having different halogens at the zinc center (Fig. 9). These results indicate the zinc–thiazole complexes 8 are formed on the addition of zinc halides.
X-ray crystallography analyses
High-quality single green crystals of thiazoles 4c were isolated in the triclinic space group P![[1 with combining macron]](https://www.rsc.org/images/entities/char_0031_0304.gif) (Fig. 10). X-ray crystallography of 4c confirmed the twisted conformation geometry of amino groups at the 5-position of a thiazole ring with torsion of 108.0° (S1–C3–N2–C11). Meanwhile, two pyridyl groups attached at the thiazole ring were located almost in the same plane as the thiazole ring. Moreover, a green crystal of 7c showed the formation of dinuclear nickel complexes with a trans configuration in a distorted octahedral geometry (Fig. 9). Two bridging Cl atoms connect two central nickel atoms between two dimers with a distance of 3.620 Å between Ni1–Ni2 (inset: Fig. 10). The distance of bridging Ni1–Cl2 was 2.600 Å, which is longer than that of Ni1–Cl3 2.363 Å. The atoms Cl1–Ni1–Cl2 were oriented almost linearly with a bond angle of 177.55 (4)°, while the atoms Cl2–Ni1–N2 were oriented almost perpendicularly with a bond angle of 89.15°. The torsion angle of the amino groups in complex 7c (S1–C2–N4–C15) were 43.31°. Moreover, the distances of Ni1–N1 (thiazole ring) and Ni1–N3 (pyridyl group) was found to be 1.970 and 2.198 Å, respectively.
(Fig. 10). X-ray crystallography of 4c confirmed the twisted conformation geometry of amino groups at the 5-position of a thiazole ring with torsion of 108.0° (S1–C3–N2–C11). Meanwhile, two pyridyl groups attached at the thiazole ring were located almost in the same plane as the thiazole ring. Moreover, a green crystal of 7c showed the formation of dinuclear nickel complexes with a trans configuration in a distorted octahedral geometry (Fig. 9). Two bridging Cl atoms connect two central nickel atoms between two dimers with a distance of 3.620 Å between Ni1–Ni2 (inset: Fig. 10). The distance of bridging Ni1–Cl2 was 2.600 Å, which is longer than that of Ni1–Cl3 2.363 Å. The atoms Cl1–Ni1–Cl2 were oriented almost linearly with a bond angle of 177.55 (4)°, while the atoms Cl2–Ni1–N2 were oriented almost perpendicularly with a bond angle of 89.15°. The torsion angle of the amino groups in complex 7c (S1–C2–N4–C15) were 43.31°. Moreover, the distances of Ni1–N1 (thiazole ring) and Ni1–N3 (pyridyl group) was found to be 1.970 and 2.198 Å, respectively.
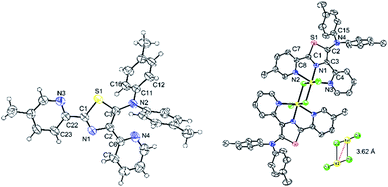 | ||
| Fig. 10 X-ray structure of thiazole 4c (left) and nickel–thiazole complex 7c (right). Hydrogen atoms are omitted for clarity. | ||
Photophysical properties of 5-N-arylaminothiazoles and their complexes in solution
The absorption and emission spectra of isolated 5-aminothiazole derivatives in chloroform are shown in Fig. 11 and Table 1. The absorption maxima range from 349 to 398 nm. That of thiazole 4a was in the shortest absorption region, and gradually shifted to longer wavelengths with introduction of a tolyl group to the nitrogen atom at the 5-position of a thiazole ring, such as 4b. Interestingly, the incorporation of a methyl group at the para position of a pyridyl group slightly shifted the absorption maxima to a shorter wavelength, such as in 4c. Further blue-shift absorption was observed by replacing a tolyl group with a phenyl group at the 2-position of the thiazole ring of 4d. In addition, when a phenyl group was placed at the 2-position and the nitrogen atom at the 5-position of a thiazole ring for 4e, the absorption maxima shifted to 374 nm, while the introduction of a phenyl group at the 4-position of a thiazole ring for 4f shifted the absorption maxima to 396 nm. Furthermore, the emission maxima of 5-N-arylaminothiazoles varied from 467–525 nm depending on the substituents. These results showed that the photophysical properties of 5-N-arylaminothiazoles could be finely tuned simply by introducing different substituents at the thiazole ring. In addition, the emission maxima of 6a and 6b were observed at 371 nm and 372 nm, respectively. However, these dipyrromethene-type ligands did not show emission properties.| Thiazole | λabs (nm) | log![[thin space (1/6-em)]](https://www.rsc.org/images/entities/char_2009.gif) ε ε |
λex (nm) | λemb (nm) | νss [cm−1] (nm) | φFc |
|---|---|---|---|---|---|---|
| a In chloroform [conc. = 10−5 M].b Excited in λmax.c Absolute quantum yield of fluorescence. | ||||||
| 4a | 349 | 4.14 | 359 | 467 | [7240] (118) | 0.04 |
| 4b | 398 | 3.90 | 397 | 525 | [60781] (127) | 0.13 |
| 4c | 391 | 4.05 | 395 | 514 | [61201] (123) | 0.16 |
| 4d | 381 | 4.03 | 377 | 486 | [56701] (113) | 0.2 |
| 4e | 374 | 3.92 | 376 | 476 | [5729] (102) | 0.31 |
| 4f | 396 | 3.72 | 392 | 505 | [5450] (109) | 0.42 |
| 6a | 371 | 4.44 | — | — | — | — |
| 6b | 372 | 4.50 | — | — | — | — |
We next examined the spectroscopic properties of nickel–thiazole complexes 7 in dilute chloroform (Fig. 12 and Table 2). The longest absorption spectra of nickel complexes 5 ranged from 278 to 424 nm. The absorption maxima of 7a were observed at 388 nm and were significantly red-shifted for a thiazole complex having a tolyl group on the nitrogen atom at the 5-position of a thiazole ring such as 7b. The presence of a methyl group at the para position of the pyridyl group slightly shifted the absorption maxima to a shorter wavelength of 7c. The absorption maxima of 7d were blue-shifted to 370 nm with the introduction of a phenyl substituent at the 2-position of a thiazole ring. Meanwhile, replacement of a tolyl group by adding a phenyl group at the 2-position and on the nitrogen atom attached to a thiazole ring shifted the absorption maxima to 364 nm, such as in 7e. Moreover, a nickel–thiazole complex having a phenyl group at the 4-position instead of pyridyl and tolyl groups on the nitrogen atom 7f was observed at 424 nm. In addition, the formation of a nickel–thiazole complex turned the emission properties off, as in 7a, 7b, and 7c. No emission was observed in either in a solid state or in solution. In contrast, the formation of nickel complexes 7d, 7e and 7f had no effect on emission, and they are still emissive in a solution to some extent under UV illumination.
 | ||
| Fig. 12 Absorption (right) and emission spectra of nickel–thiazole complexes in chloroform [10−5 M]. | ||
| Thiazole | λabs (nm) | log![[thin space (1/6-em)]](https://www.rsc.org/images/entities/char_2009.gif) ε ε |
λex (nm) | λemb (nm) | νss [cm−1] (nm) | φFc |
|---|---|---|---|---|---|---|
| a In chloroform [conc. = 10−5 M].b Excited in λmax.c Absolute quantum yield of fluorescence. | ||||||
| 7a | 388 | 4.06 | 359 | — | — | — |
| 7b | 419 | 3.85 | 397 | — | — | — |
| 7c | 413 | 3 96 | 395 | — | — | — |
| 7d | 370 | 3.91 | 377 | 487 | [6493] (117) | 0.04 |
| 7e | 364 | 4.07 | 376 | 474 | [6375] (110) | 0.03 |
| 7f | 424 | 3.79 | 392 | 507 | [3861] (83) | 0.02 |
The photophysical properties of a series of zinc–thiazole complexes investigated in a THF solution are shown in Fig. 13. The absorption maxima of zinc complexes 8a–c in THF were observed at 390 nm in all cases, while that of zinc thiazole having an iodine 8c was slightly blue-shifted to 384 nm. Meanwhile, their emission maxima showed no significant change even when we introduced different halogens on the zinc center. Interestingly, zinc–thiazole complex containing a bromide 8b showed a high quantum yield of up to 75%. Fluorescence lifetime decay of thiazole ligand 4f and zinc-complexes 8 in THF was in the range 4.43–4.94 ns. The thiazole 4f exhibited fluorescence lifetimes about 4.93 ns. Introduction of dichloride and zinc dibromide to the zinc center shortened the fluorescence lifetime such as 8a and 8b. Interestingly, zinc–thiazole complex having an iodine atom in the metal center 8c possessed the longest average fluorescence lifetimes (Table 3).
| Thiazole | λabs (nm) | log![[thin space (1/6-em)]](https://www.rsc.org/images/entities/char_2009.gif) ε ε |
λex (nm) | λemb (nm) | νss [cm−1] (nm) | φFc | χ2d | τd (ns) |
|---|---|---|---|---|---|---|---|---|
| a Measured in THF.b Excited in λmax.c Absolute quantum yield of fluorescence.d Excited at 365 nm. | ||||||||
| 4f | 390 | 3.92 | 385 | 495 | [5504] (105) | 0.5 | 1.8 | 4.93 |
| 8a | 390 | 3.64 | 384 | 497 | [5520] (107) | 0.4 | 2.7 | 4.86 |
| 8b | 390 | 4.1 | 384 | 495 | [5504] (105) | 0.8 | 2.1 | 4.43 |
| 8c | 384 | 4.22 | 386 | 494 | [5798] (110) | 0.4 | 2 | 4.94 |
Solvatochromism properties of 5-N-arylaminothiazoles and their complexes
The emission color of the isolated 5-N-arylaminothiazoles varied with the solution polarity exhibited a tunable emission wavelength in the range of 397–505 nm.44 The emission maxima of 4f strongly depended on the solvent polarity, and thus their peak emissions were greatly affected. Large red shifts in the emission maxima (Fig. 14) were observed upon changing from a nonpolar (cyclohexane) to a polar (MeOH) solvent and cover blue to green color with low quantum yield. In addition, zinc–thiazole complex 8a also showed solvatochromism properties and transitioned from a blue to green color. Uniquely, the emission maxima of 8a in halogenated solvents (dichloromethane and chloroform) were more red-shifted compared to its emission maxima in non-halogenated (THF and MeOH) solvents (Fig. 14). To our delight, zinc–thiazole complex 8a showed comparable quantum yields with the free ligand 4f.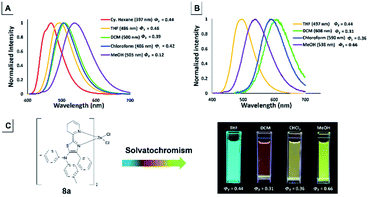 | ||
| Fig. 14 Emission spectra of 5-aminothiazole 4f (A) and zinc–thiazole complex 8a (B) [10−5 M]. Change in the color of emission for 8a in solvent with different polarities (C). | ||
Photophysical properties of 5-N-arylaminothiazoles and their complexes in a solid state
In addition to showing bright emission in solution, 5-N-arylaminothiazoles 4 and their zinc–thiazole complexes 8 also exhibited emission in a solid state. However, thiazole 4a and the formation of nickel–thiazole complexes 7 did not show any noticeable emission properties in a solid state. Thiazoles 4b–f showed emission in a solid state with a quantum yield (φF) reaching up to 52%. The absorption maxima of 4b–d were observed in almost the same absorption region, while of those 4e and 4f were slightly blue-shifted to 427 nm and 404 nm, respectively. Their longest emission maxima appeared from 469 nm to 542 nm with low to moderate quantum yields.The absorption and emission maxima of zinc–thiazole complexes 8 in a solid state were significantly different than those of the free ligands (Table 4). While the longest absorption maxima ranged from 440 nm to 452 nm, while their emission maxima varied depending on the halogens on the zinc center. The zinc thiazole complex with chlorine atoms at the zinc center 8a showed a significant red-shift to 611 nm compared to that of the free ligand 4f at 475 nm. Furthermore, the introduction of bromine (8b) and iodine atoms (8c) to the zinc center shifted the emission maxima to a shorter emission wavelength at 550 nm and 548 nm, respectively. The emission decay analysis showed significant decreasing of fluorescence lifetimes of zinc–thiazole complexes 8 compared to its free ligand 4f (Table 4). Moreover, the quantum yield of the complexes dropped significantly in a solid state. However, the difference in emission color under UV irradiation at 365 nm was still easily visible with the naked eye (Fig. 15).
| Thiazole | λabs (nm) | λex (nm) | λema (nm) | νss [cm−1] (nm) | φFb | χ2c | τc (ns) |
|---|---|---|---|---|---|---|---|
| a Excited in λmax.b Absolute fluorescence of quantum yield.c Excited at 365 nm. | |||||||
| 4b | 442 | 439 | 495 | [2411] (53) | 0.21 | 1.66 | 2.53 |
| 4c | 444 | 437 | 542 | [3438] (80) | 0.06 | 3.5 | 2.47 |
| 4d | 444 | 437 | 475 | [1469] (31) | 0.21 | 1.56 | 2.77 |
| 4e | 427 | 428 | 469 | [2097] (42) | 0.15 | 1.36 | 1.91 |
| 41 | 404 | 431 | 475 | [3609] (71) | 0.52 | 1.54 | 3.03 |
| 8a | 440 | 370 | 611 | [6360] (171) | 0.02 | 3.21 | 121 |
| 8b | 440 | 365 | 550 | [4545] (110) | 0.05 | 2.41 | 1.99 |
| 8c | 452 | 492 | 548 | [3875] (96) | 0.02 | 2.66 | 0.23 |
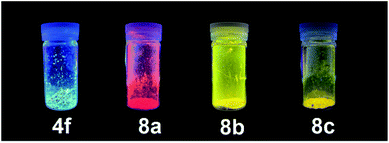 | ||
| Fig. 15 Emission color in a solid state of 5-aminothiazole 4f and zinc–thiazole complexes 8a–c under UV radiation at 365 nm. | ||
Use of 5-N-arylaminothiazoles as a fluorescence probe for detection of zinc ion
Coordination of Zn2+ with dipyrromethene-type ligands 6 turned on the emission properties for 6b. Considering this unexpected result, we then investigated the possibility of using 6b for Zn2+ sensing. We initially titrated of various metal cations such as Cu2+, Ca2+, Fe3+, and Zn2+ into a THF solution of dipyrromethene-type ligand 6b. As a result, compound 6b showed high selectivity for Zn2+ ions. With the addition of Zn2+, the emission intensity at 533 nm continued to increase with the appearance of a green emission with a low quantum yield (φF) of 0.02 under UV irradiation at 365 nm (Fig. 16).In contrast, the emission properties of 6b towards cations other than Zn2+ did not show any change in emission intensity even after the addition of 1 equivalent of cation. These results imply that 6b has excellent potential as a candidate for Zn2+ fluorescence sensing (Fig. 17).
Conclusions
In summary, a series of 5-N-arylaminothiazole derivatives having pyridyl groups were successfully synthesized and systematically characterized. The absorption and emission properties of isolated 5-N-arylaminothiazoles were finely tuned simply by varying the substituents attached to the thiazole ring and the nitrogen atom at the 5-position. The longest absorption spectra ranged from 349 to 396 nm. They also showed solvatochromism properties in solvent with different solvent polarities. X-ray analyses revealed that the isolated 5-N-arylaminothiazole adopts a highly twisted conformation, wherein the diarylamino group deviates from the thiazole ring. The crystal structure of nickel–thiazole complex 7c confirmed the formation of dinuclear metal complexes with chlorine atom acting as a bridge between two nickel complexes. However, the formation of nickel complexes turned off the emission properties of some complexes. In contrast, the formation of zinc–thiazole complexes showed emission both in solution and in a solid state. Moreover, dipyrromethene-type ligands showed consistent enhancement of emission intensity upon the addition of Zn2+. Therefore, these ligands can be used for zinc sensing. Further applications of 5-N-arylaminothiazoles as chemosensors and biosensors will be reported in due course.Experimental section
General procedure A: preparation of thiazoles
To a solution of thiazolines (1 equiv.) in THF was added iodine (2 equiv.) at room temperature, and the mixture was stirred for 24 h. The resulting mixture was poured into a saturated aqueous solution of Na2S2O3 and extracted with Et2O. The organic layer was dried over MgSO4 and concentrated in vacuo. The residue was purified by column chromatography (SiO2) to give the corresponding thiazoles.General procedure B: preparation of dipyrromethene type ligands
Pd(OAc)2 (10 mol%) and xantphos (20 mol%) were weighted into Schlenk tube that was sealed with a septum and purged with argon (3 times). Toluene (6 mL) then injected, and the reaction was continued for 15 min at 130 °C. 5-Bromothiazole (1 equiv.) in 4 mL toluene was then injected via syringe followed by the amine (10 equiv.) and LiHMDS (2 equiv.). The reaction mixture was filtered through a bed of Celite and washed with CH2Cl2. The filtrate was concentrated in vacuo and purified via silica gel flash column chromatography (SiO2, hexane![[thin space (1/6-em)]](https://www.rsc.org/images/entities/char_2009.gif) :
:![[thin space (1/6-em)]](https://www.rsc.org/images/entities/char_2009.gif) EtOAc) to give the corresponding thiazoles.
EtOAc) to give the corresponding thiazoles.
General procedure C: preparation of nickel thiazole complexes
NiCl2·6H2O (1 equiv.) was taken in ethanol and was heated to reflux. The 5-N-arylaminothiazoles (1 equiv.) in a EtOH solution was added dropwise to the refluxing solution and was further refluxed for another 1 h. The final mixture was concentrated in vacuo. The obtained participate product was then washed by ethanol and diethyl ether. To give pure nickel–thiazole complexes.General procedure D: preparation of zinc thiazole complexes
To a solution of thiazoles (1 equiv.) in THF was added zinc halides (1 equiv.) at room temperature, and the mixture was stirred for 24 h. The precipitate was then washed with hexane and Et2O to give pure zinc–thiazole complexes.Fluorescence lifetime analysis
All zinc complexes were analyzed in dilute THF [10−5 M] using the Fluorescence Lifetime Spectrometer Quantaurus-Tau® C16361 Series with a measurement time range of 50 ns and frequencies at 5 MHz.N,N-Dimethyl-2,4-di(pyridin-2-yl)thiazol-5-amine (4a)
2,4-Di(pyridin-2-yl)-N,N-di-p-tolylthiazol-5-amine (4b)
2-(5-Methylpyridin-2-yl)-4-(pyridin-2-yl)-N,N-di-p-tolylthiazol-5-amine (4c)
2-Phenyl-4-(pyridin-2-yl)-N,N-di-p-tolylthiazol-5-amine (4d)
N,N,2-Triphenyl-4-(pyridin-2-yl)thiazol-5-amine (4e)
4-Phenyl-2-(pyridin-2-yl)-N,N-di-p-tolylthiazol-5-amine (4f)
![[thin space (1/6-em)]](https://www.rsc.org/images/entities/char_2009.gif) 990, 1002, 811, 508 cm−1; 1H NMR (400 MHz, CDCl3) δ 2.24 (s, 6H), 6.96–7.04 (m, 8H), 7.18–7.22 (tt, 1H), 7.24–7.25 (m, 1H), 7.26–7.28, (dd, 1H), 7.31–7.34 (td, 1H), 7.81–7.85 (td, 1H), 7.93–7.96 (dd, 2H), 8.29 (d, J = 7.79 Hz, 1H) 8.56 (d, J = 4.58 Hz, 1H); 13C NMR (400 MHz, CDCl3) δ 20.7, 119.6, 121.75, 124.4, 127.4, 127.9, 128.2, 129.8, 132.7, 133.5, 137.5, 143.8, 144.54, 148.4, 148.8, 151.2; MS (EI) m/z 433 (M+); HRMS (EI) calcd for C28H23N3S, 433.1613; found, 433.1621.
990, 1002, 811, 508 cm−1; 1H NMR (400 MHz, CDCl3) δ 2.24 (s, 6H), 6.96–7.04 (m, 8H), 7.18–7.22 (tt, 1H), 7.24–7.25 (m, 1H), 7.26–7.28, (dd, 1H), 7.31–7.34 (td, 1H), 7.81–7.85 (td, 1H), 7.93–7.96 (dd, 2H), 8.29 (d, J = 7.79 Hz, 1H) 8.56 (d, J = 4.58 Hz, 1H); 13C NMR (400 MHz, CDCl3) δ 20.7, 119.6, 121.75, 124.4, 127.4, 127.9, 128.2, 129.8, 132.7, 133.5, 137.5, 143.8, 144.54, 148.4, 148.8, 151.2; MS (EI) m/z 433 (M+); HRMS (EI) calcd for C28H23N3S, 433.1613; found, 433.1621.2-(4-Methoxyphenyl)-4-(pyridin-2-yl)-N-(p-tolyl)thiazol-5-amine (6a)
N-(4-(Tert-butyl)phenyl)-2-(4-methoxyphenyl)-4-(pyridin-2-yl)thiazol-5-amine (6b)
Complex [Ni(4a)Cl] (7a)
Complex [Ni(4b)Cl] (7b)
Complex [Ni(4c)Cl] (7c)
Complex [Ni(4d)Cl] (7d)
Complex [Ni(4e)Cl] (7e)
Complex [Ni(4f)Cl] (7f)
Complex [Zn(4f)2Cl2] (8a)
Complex [Zn(4f)2Br2] (8b)
Complex [Zn(4f)2I2] (8c)
Author contributions
Khurnia Krisna Puji Pamungkas synthesized compounds, studied their photophysical properties and wrote the manuscript, Toshifumi Maruyama performed and determined X-ray structure, and Toshiaki Murai, supervised the project and wrote the manuscript.Conflicts of interest
There are no conflicts to declare.Acknowledgements
This research was partly supported by Koshiyama Science & Technology Foundation and a Grant-in-Aid for Scientific Research (B) (19H02712) and (C) (22K05109) from MEXT.Notes and references
- V. Ji Ram, A. Sethi, M. Nath and R. Pratap, in The Chemistry of Heterocycles, Elsevier, 2019, pp. 149–478 Search PubMed.
- P. C. Sharma, K. K. Bansal, A. Sharma, D. Sharma and A. Deep, Eur. J. Med. Chem., 2020, 188, 112016 CrossRef CAS PubMed.
- H. Liu, L. Xu, H. Hui, R. Vivian, C. Callebaut, B. P. Murray, A. Hong, M. S. Lee, L. K. Tsai, J. K. Chau, K. M. Stray, C. Cannizzaro, Y. C. Choi, G. R. Rhodes and M. C. Desai, Bioorg. Med. Chem. Lett., 2014, 24, 989–994 CrossRef CAS PubMed.
- M. R. Shreykar and N. Sekar, Dyes Pigm., 2017, 142, 121–125 CrossRef CAS.
- K. I. Lugovik, A. V. Popova, A. K. Eltyshev, E. Benassi and N. P. Belskaya, Eur. J. Org. Chem., 2017, 4175–4187 CrossRef CAS.
- P. Gayathri, K. Kanagajothi, P. Nag, N. Anand, V. S. Reddy, D. Moon, S. P. Anthony and V. Madhu, CrystEngComm, 2021, 23, 6769–6777 RSC.
- P. O. Suntsova, A. K. Eltyshev, T. A. Pospelova, P. A. Slepukhin, E. Benassi and N. P. Belskaya, Dyes Pigm., 2019, 166, 60–71 CrossRef CAS.
- H. Sun, W.-H. Sun, Y. Jiang, J.-H. Wei, Y. Zhao, R. Zhang and Z.-H. Ni, Dyes Pigm., 2020, 173, 107938 CrossRef CAS.
- K. K. Puji Pamungkas, T. Maruyama and T. Murai, Org. Biomol. Chem., 2021, 19, 6804–6811 RSC.
- M. A. Potopnyk, R. Lytvyn, Y. Danyliv, M. Ceborska, O. Bezvikonnyi, D. Volyniuk and J. V. Gražulevičius, J. Org. Chem., 2018, 83, 1095–1105 CrossRef CAS PubMed.
- J. R. Lakowicz, Anal. Biochem., 2001, 298, 1–24 CrossRef CAS PubMed.
- Y. Jeong, Y.-M. Kook, K. Lee and W.-G. Koh, Biosens. Bioelectron., 2018, 111, 102–116 CrossRef CAS PubMed.
- M. Abd El Aleem Ali Ali El-Remaily, T. El-Dabea, M. Alsawat, M. H. H. Mahmoud, A. Abdulaziz Alfi, N. El-Metwaly and A. M. Abu-Dief, ACS Omega, 2021, 6, 21071–21086 CrossRef PubMed.
- M. A. E. A. A. A. El-Remaily, A. M. M. Soliman, M. E. Khalifa, N. M. El-Metwaly, A. Alsoliemy, T. El-Dabea and A. M. Abu-Dief, Appl. Organomet. Chem., 2022, 36, e6320 CrossRef CAS.
- X. Zou, P. Shi, A. Feng, M. Mei and Y. Li, Transition Met. Chem., 2021, 46, 263–272 CrossRef CAS.
- X.-Z. Zou, A.-S. Feng, Y.-Z. Liao, X.-Y. Xu, H.-Y. Wen, A. You, M. Mei and Y. Li, Inorg. Chem. Commun., 2020, 118, 108030 CrossRef CAS.
- R. Menzel, S. Kupfer, R. Mede, D. Weiß, H. Görls, L. González and R. Beckert, Eur. J. Org. Chem., 2012, 5231–5247 CrossRef CAS.
- S. E. Huffman, G. K. Yawson, S. S. Fisher, P. J. Bothwell, D. C. Platt, M. A. Jones, C. G. Hamaker and M. I. Webb, Metallomics, 2020, 12, 491–503 CrossRef CAS PubMed.
- T. D. Thangadurai and S.-K. Ihm, Synth. React. Inorg., Met.-Org., Nano-Met. Chem., 2005, 35, 499–507 CrossRef CAS.
- Y. Liu, X. Sun, Y. Wang and Z. Wu, Synth. Met., 2014, 198, 67–75 CrossRef CAS.
- A. J. Hallett, E. Placet, R. Prieux, D. McCafferty, J. A. Platts, D. Lloyd, M. Isaacs, A. J. Hayes, S. J. Coles, M. B. Pitak, S. Marchant, S. N. Marriott, R. K. Allemann, A. Dervisi and I. A. Fallis, Dalton Trans., 2018, 47, 14241–14253 RSC.
- H. Leopold, A. Tronnier, G. Wagenblast, I. Münster and T. Strassner, Organometallics, 2016, 35, 959–971 CrossRef CAS.
- T. Y. Chikineva, D. S. Koshelev, A. V. Medved'ko, A. A. Vashchenko, L. S. Lepnev, A. S. Goloveshkin and V. V. Utochnikova, Russ. J. Inorg. Chem., 2021, 66, 170–178 CrossRef CAS.
- N. Dannenbauer, P. R. Matthes, T. P. Scheller, J. Nitsch, S. H. Zottnick, M. S. Gernert, A. Steffen, C. Lambert and K. Müller-Buschbaum, Inorg. Chem., 2016, 55, 7396–7406 CrossRef CAS PubMed.
- L. Luconi, D. M. Lyubov, A. Rossin, T. A. Glukhova, A. V. Cherkasov, G. Tuci, G. K. Fukin, A. A. Trifonov and G. Giambastiani, Organometallics, 2014, 33, 7125–7134 CrossRef CAS.
- L. A. Büldt, C. B. Larsen and O. S. Wenger, Chem.–Eur. J., 2017, 23, 8541 CrossRef.
- C. Núñez, R. Bastida, A. MacÍas, L. Valencia, J. Ribas, J. L. Capelo and C. Lodeiro, Dalton Trans., 2010, 39, 7673–7683 RSC.
- N. Meundaeng, A. Rujiwatra and T. J. Prior, Transition Met. Chem., 2016, 41, 783–793 CrossRef CAS.
- A. Rossin, B. Di Credico, G. Giambastiani, L. Gonsalvi, M. Peruzzini and G. Reginato, Eur. J. Inorg. Chem., 2011, 2, 539–548 CrossRef.
- A. Helal and H. S. Kim, Tetrahedron, 2010, 66, 7097–7103 CrossRef CAS.
- E. Ergun, Ü. Ergun, Ö. İleri and M. F. Küçükmüzevir, Spectrochim. Acta, Part A, 2018, 203, 273–286 CrossRef CAS PubMed.
- Y. Mikata, A. Takekoshi, M. Kaneda, H. Konno, K. Yasuda, M. Aoyama and S. Tamotsu, Dalton Trans., 2017, 46, 632–637 RSC.
- P. K. Mehta, E. T. Oh, H. J. Park and K. H. Lee, Spectrochim. Acta, Part B, 2017, 245, 996–1003 CAS.
- F. Yu, X. Guo, X. Tian and L. Jia, J. Fluoresc., 2017, 27, 723–728 CrossRef CAS PubMed.
- J. Y. Yun, A. Kim, S. M. Hwang, D. Yun, H. Lee, K.-T. Kim and C. Kim, Bull. Chem. Soc. Jpn., 2019, 92, 961–966 CrossRef CAS.
- D. Aydin, S. N. Karuk Elmas, T. Savran, F. N. Arslan, G. Sadi and I. Yilmaz, J. Photochem. Photobiol., A, 2021, 419, 113459 CrossRef CAS.
- Y. Watanabe, W. Sungnoi, A. O. Sartorio, M. Zeller and A. Wei, Mater. Chem. Front., 2020, 4, 899–904 RSC.
- K. Yamaguchi, T. Murai, S. Hasegawa, Y. Miwa, S. Kutsumizu, T. Maruyama, T. Sasamori and N. Tokitoh, J. Org. Chem., 2015, 80, 10742–10756 CrossRef CAS PubMed.
- K. Yamaguchi, T. Murai, J. D. Guo, T. Sasamori and N. Tokitoh, ChemistryOpen, 2016, 5, 396 CrossRef CAS.
- K. Yamaguchi, T. Murai, Y. Tsuchiya, Y. Miwa, S. Kutsumizu, T. Sasamori and N. Tokitoh, RSC Adv., 2017, 7, 18132–18135 RSC.
- T. Murai, H. Furukawa and K. Yamaguchi, Heterocycles, 2018, 97, 409–421 CrossRef.
- T. Murai, M. Yoshihara, K. Yamaguchi and M. Minoura, Asian J. Org. Chem., 2019, 8, 1102–1106 CrossRef CAS.
- T. Murai, Y. Nakatsu, Y. Tsuchiya, K. Yamaguchi, T. Maruyama, Y. Miwa and S. Kutsumizu, Heterocycles, 2020, 101, 611–620 CrossRef CAS.
- Y. Tsuchiya, K. Yamaguchi, Y. Miwa, S. Kutsumizu, M. Minoura and T. Murai, Bull. Chem. Soc. Jpn., 2020, 93, 927–935 CrossRef CAS.
Footnote |
| † Electronic supplementary information (ESI) available. CCDC 2155547 and 2155549. For ESI and crystallographic data in CIF or other electronic format see https://doi.org/10.1039/d2ra01694j |
| This journal is © The Royal Society of Chemistry 2022 |

