 Open Access Article
Tuning polymorphs of precipitated calcium carbonate from discarded eggshells: effects of polyelectrolyte and salt concentration
Mohammad Hossein Azarian a and
Wimonlak Sutapun
 *ab
*ab
aResearch Centre for Biocomposite Materials for Medical, Agricultural and Food Industry, Suranaree University of Technology, Nakhon Ratchasima, 30000, Thailand. E-mail: wimonlak@sut.ac.th
bSchool of Polymer Engineering, Suranaree University of Technology, Nakhon Ratchasima, 30000, Thailand
First published on 16th May 2022
Abstract
Biowaste eggshells are a valuable source of calcium carbonate suitable for various applications. In this study, spherical vaterite and calcite calcium carbonate polymorphs have been synthesised from discarded eggshells by the precipitation technique at ambient temperature. The influence of initial salt concentration with different polyelectrolytes such as ethylene glycol (EG), polyethylene glycol (PEG, 600 and 6000), and poly(sodium 4-styrenesulfonate) (PSS) at various w/v% concentrations on the polymorph crystal formation of precipitated calcium carbonate (PCC) particles was studied. The results indicated that PCC crystals with spherical, star-shaped and yarn shaped morphologies can be obtained based on the concentration of calcium ions and the presence of different polyelectrolyte solution. At low salt molar concentration, PEG-6000 and PSS polyelectrolytes were found to promote the formation of spherical vaterite calcium carbonate particles with particle mean diameters of 5.05 μm and 2.17 μm, respectively. Furthermore, silver nanoparticles were also loaded into the PCC particles in situ, and the surface area significantly increased from 2.2813 m2 g−1 in untreated ground eggshells to 30.4632 m2 g−1 in PCC particles in the presence of PSS and silver colloid solution. The EDS mapping revealed the average wt% of silver atoms loaded in PCC particles in the presence of PSS polyelectrolyte was lower (1.44 wt%) than in the presence of PEG-6000 (4.27 wt%) due to the silver encapsulation possibility during the core–shell formation, as confirmed by SEM images. The silver nanoparticle-loaded PCC particles in this study can be incorporated into the polymer matrix and employed for antimicrobial food packaging or wound dressing application.
Introduction
Humans discard a massive quantity of biogenic waste into nature daily, even though this waste is recyclable and considered a valuable source of inorganic and organic compounds. Eggshell biogenic waste, of which thousands of tonnes are disposed daily, contains more than 97 wt% calcium carbonate crystals with potential usage in various advanced material applications. The outer layer of the eggshell comprises calcite calcium carbonate, while the inner layer consists of an organic protein membrane.1 Although the discarded eggshells alone are not toxic or dangerous for the environment, the decomposition of their organic membrane in landfills enables the eggshells to be colonised by various pathogens such as Escherichia coli and Salmonella.2 Consequently, the European Union (EU) regulations categorised and considered industrial eggshells as hazardous biogenic waste.3 Due to environmental concerns coupled with the abundance of eggshells as a widely available renewable source of biobased calcium carbonate, it is essential to develop and optimise new methods for reusing and reprocessing eggshells accordingly. The repurposed eggshells can be employed in advanced material applications, including water treatment, bio-fillers, and reinforcements in polymer composites, energy applications, and pharmaceutical, biomedical, and drug delivery applications.Calcium carbonate exists naturally in three primary anhydrous polymorphs of calcite, vaterite, and aragonite. For instance, calcite in eggshells, vaterite in fish otoliths and aragonite in mollusc shells.4–7 The application of eggshell particles processed by simple mechanochemical methods has been extensively studied so far in different fields such as filler in polymers,8–10 wastewater purification,11–13 drug delivery and biomedical application.14,15 The mechanochemical methods refer to the process of obtaining microparticles by applying mechanical energy at ambient temperature, such as grinding, ball milling, or mortar and pestle techniques. The disadvantage of the mechanochemical methods is obtaining impure irregular calcium carbonate particles with minimal control on crystal polymorphs formation, size, and morphology during the process. However, the calcite polymorph calcium carbonate derived from eggshell can be converted to other polymorphs structures or precipitated to precisely control the size and morphology by techniques such as carbonation,16–20 hydrothermal,21,22 and wet precipitation technique.23,24 In the precipitation technique proposed in this research, the eggshell wastes are digested in acid first and precipitated in highly controlled conditions. The advantage of this technique is the possibility of controlling the size and obtaining pure calcium carbonate, since the eggshell membrane residues are not digestible in nitric acid and can be easily removed by simple filtration.
Moreover, the desired polymorph crystal structures of vaterite, aragonite, or calcite can be induced by tuning the precipitation reaction conditions. Calcium carbonate of various polymorphs with different physical properties, such as morphology and surface area, make it beneficial for multiple applications. In a study published by Lin et al., oyster shells were digested in hydrochloric acid to obtain calcium chloride, which further reacted with sodium carbonate to precipitate the vaterite calcium carbonate particles.25 The vaterite calcium carbonate is extensively used as a vehicle for encapsulation of drugs or nanoparticles carriers due to its spherical structures. In another study published by our group,26 discarded eggshell particles were digested in hydrochloric acid, and a mixture of calcite and vaterite particles were obtained after reaction with sodium carbonate. However, no polyelectrolyte was used in those previous studies to stabilise the precipitated particles. To the best of our knowledge, there is scarcely any report in the literature regarding the precipitation of calcium carbonate from discarded eggshell biogenic wastes particles in the presence of different polyelectrolytes for silver nanoparticle carriers. Dulgosz et al. reported the preparation of PCC particles from synthetic calcium nitrate solution in the presence of silver colloid and poly(sodium 4-styrene sulfonate) (PSS) as polyelectrolyte solution.27 The authors found that the obtained spherical microparticles of calcium carbonates served as carriers for silver nanoparticles (50 nm) and enabled sustained release.
Despite the vast numbers of published research in the literature devoted to precipitation and synthesis of various polymorphs of calcium carbonate, they mostly used synthetic salts as starting materials, such as calcium chloride or calcium nitrate. For instance, Trushina et al. have reported the precipitation of vaterite calcium carbonate by mixing CaCl2 and Na2CO3 water solutions with equivalent molar concentrations ranging from 0.1–1 M.28 In another study published by Xu et al. PCC obtained from synthetic origins with different phases and morphologies in the presence of polyethylene glycol (PEG) with different molecular weight and concentrations.29 The results showed that aragonite polymorphs were the only phase in the absence of PEG, while calcite polymorphs dominated using PEG as the polyelectrolyte. The authors concluded that PEG could effectively control the growth of PCC crystals under experimental conditions.
The polyelectrolytes can promote vaterite formation and block its conversion to other polymorphs by creating three-dimensional networks of intermolecular bonded molecules around the calcium nuclei and delaying the growth rate to more stable calcite polymorph.30,31 Several studies revealed the effects of various polyelectrolytes with different molecular weights and proportions on the morphology, polymorphs, and size of precipitated calcium carbonate particles synthesised from synthetic salts origin.29,32,33 In the present research, non-ionic polyelectrolyte (EG and PEG, 600 and PEG 6000) and ionic polyelectrolyte (PSS) effects on vaterite crystal formation in different salt molar concentrations were systematically studied.
The present work explores the feasibility of using discarded eggshells as a primary source to obtain PCC particles with controlled size and morphology. The calcium nitrate salt solution was obtained from the digestion of discarded eggshells in nitric acid. The effects of various polyelectrolytes with different concentrations on PCC morphology and crystal structures were studied and characterised by scanning electron microscopy (SEM), X-ray diffraction (XRD), attenuated total reflection (ATR), and Raman spectroscopy. The results were discussed and compared with ground eggshell particles in the absence of polyelectrolytes. Furthermore, to illustrate the possibility of PCC particles as nanoparticles carriers, the optimal PCC particles were loaded with silver nanoparticles. Finally, the obtained particles were characterised by Brunauer, Emmett, and Teller (BET) and atomic force microscopy (AFM) analysis. The current research presents a significant advance over the existing literature in terms of using discarded eggshells as a source of calcium which is cost-effective and contributes to reducing environmental pollution.
Experimental details
Materials
All chemicals were of analytical grade and used without further purification. Chicken eggshell wastes were obtained from a local bakery shop near Suranaree University of Technology (SUT) in Thailand, Nakhon Ratchasima. The eggshells were washed with water and boiled for 6 h at 100 °C to remove the eggshell membranes and organic residues. The eggshells were ground to a fine powder after drying at 60 °C for 24 h. Silver nitrate (99.0%, ACS reagent), sodium carbonate (powder, 99.5%, ACS reagent), ethylene glycol, polyethylene glycol (average Mw 600 and 6000 g mol−1) (99.0%, ACS reagent). Sodium carboxymethyl cellulose (CMC, average Mw 90![[thin space (1/6-em)]](https://www.rsc.org/images/entities/char_2009.gif) 000 g mol−1, powder) and poly(sodium 4-styrene sulfonate) (PSS, average Mw 70
000 g mol−1, powder) and poly(sodium 4-styrene sulfonate) (PSS, average Mw 70![[thin space (1/6-em)]](https://www.rsc.org/images/entities/char_2009.gif) 000 g mol−1, powder) were obtained from Sigma Aldrich. Nitric acid 65% (Grade AR, Mw = 63.01 g mol−1) was purchased from ANaPURE.
000 g mol−1, powder) were obtained from Sigma Aldrich. Nitric acid 65% (Grade AR, Mw = 63.01 g mol−1) was purchased from ANaPURE.
Precipitation of calcium carbonate from aqueous solution
Eggshell calcium carbonate particles were precipitated by rapid mixing of calcium nitrate solution and sodium carbonate solution in the presence and absence of polyelectrolyte solution. The calcium nitrate solution is primarily obtained by digestion of 50 g ground eggshell particles with 2 M of nitric acid solution. After digestion, the calcium nitrate solution was filtered to remove the undigested materials like organic membrane or eggshell brown pigments. The pH was adjusted to neutral by adding 0.1 M sodium hydroxide. Afterwards, an equivalent molar ratio of a sodium carbonate solution was prepared in DI water. Then polyelectrolyte powder with desired concentration was added to the sodium carbonate solution and stirred until fully dissolved. Equivalent volumes of calcium nitrate and sodium carbonate water solutions (with equivalent molarity taken in the range of 0.03–0.5 M) were mixed rapidly under vigorous stirring for 30 s at ambient temperature (25 °C). The suspension was centrifuged at 5000 rpm for 5 min to remove the polyelectrolyte solution. The obtained particles were further washed and centrifuged three times again. The precipitated calcium carbonate particles were dried under a vacuum at 40 °C overnight.Precipitation of calcium carbonate in silver colloid
0.01 M solution of silver nitrate was prepared in 5 mL of DI water. Alternatively, 85 mg CMC was dissolved in 20 mL of DI water. The silver colloid was obtained by adding silver nitrate solution to the CMC solution under stirring. Besides, 7 w/v% of PEG-6000 and 1.5 w/v% of PSS solution was prepared separately in sodium carbonate solution with a desired molar concentration equivalent to calcium nitrate molar concentration. The prepared sodium carbonate solution and digested eggshell solution (calcium nitrate) were simultaneously added to the silver colloid suspension at ambient temperature and stirred for 30 s. The suspension was centrifuged at 5000 rpm for 5 min to remove polyelectrolyte, excess silver, and unreacted silver nitrate solution. The obtained particles were further washed and centrifuged three times again. The synthesised silver/calcium carbonate particles were dried under a vacuum at 40 °C overnight.Characterisation
The morphology and size of PCC particles were observed through Field Emission Scanning Electron Microscope (FE-SEM) (JEOL JSM 7800F Tokyo, Japan) coupled with energy dispersive X-ray spectroscopy (EDX). The samples were coated with gold before SEM measurements. The statistical image processing was performed in three stages: (1) the particle dimensions were measured through Digi Mizer software (Media Cybernetics, Rockville, MD, USA), (2) size distribution (PSD) determination using software Minitab 17.2.0 (Minitab Ltd., Coventry, UK) to obtain mean diameter (Dm) and their respective histograms, and (3) the elemental composition of the PCC particles by ESD in the mapping mode.The structural phase study of the PCC particles was carried out by powder X-ray diffraction (XRD) analyser in 2θ range of 5–80° using XRD (Model: Bruker D8 ADVANCE, MA, US) at the voltage of 40 kV, a current of 40 mA, and Cu Kα (1.5606 Å) radiation source. Attenuated total reflection (ATR) spectra of PCC particles were recorded from Bruker Tensor 27 spectrophotometer at ambient temperature. The samples were scanned over the wavenumbers ranging from 4000 to 650 cm−1 with a resolution of 4 cm−1. All the spectra were collected after an average of 16 scans for each specimen. The Raman spectra were collected on Bruker VERTEX 70/FT-Raman Module RAM II spectrometer with OPUS software controls equipped with an Nd:YAG laser (1064 nm) as excitation source, over 60–2000 cm−1 at 10% laser power and 100 seconds scan time. The three-dimensional images and root mean square values (Sq) was measured using an Atomic Force Microscope (AFM) Park Systems AFM XE 120, Korea. The PCC particles were dispersed in water/PSS solution and coated on a glass slide by drop-casting method, and the surface was analysed by a non-contact mode with a scan area of 40 × 40 μm2.
Furthermore, the three-dimensional images and root mean square (RMS) roughness were obtained from XEI-Image Processing and Analysis software. The Brunauer, Emmett, and Teller (BET) surface area measurements and porosity analysis were carried out by Micromeritics 3Flex BET analyser. All samples were degassed at 40 °C for 24 h in a vacuum before the examination.
Results and discussion
Influence of salt molar concentration
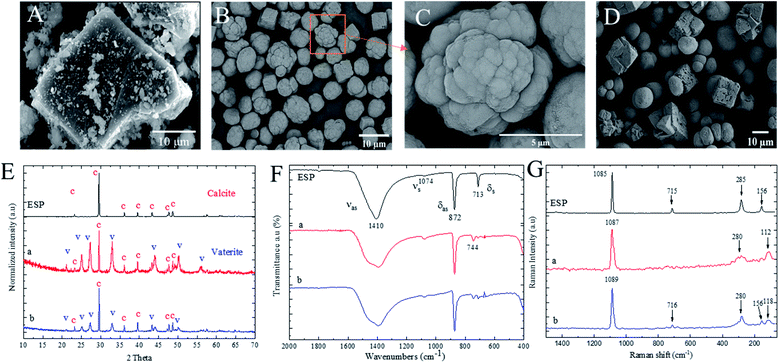
The calcium carbonates were precipitated without polyelectrolytes with two different salt ions concentrations. The morphology and chemical structures of ground ESP and PCC from calcium nitrate (obtained from the digestion of eggshells) and sodium carbonate with equivalent molar concentrations as high as 0.5 M and as low as 0.03 M are shown in Fig. 1. Fig. 1A indicates that the untreated ground eggshell particles (ESP) do not contain any specific morphology patterns and size homogeneity. However, Fig. 1B shows that the PCC particles from 0.5 M salt concentration are aggregated sphere particles of which multimolecular colloids with relatively spherical shapes were formed. Moreover, some cubic particles are observed due to the partial formation of calcite polymorph structures. Based on XRD results shown in Fig. 1E, the fingerprint of ESP shows distinct peaks at two theta values of 23.17°, 29.52°, 36.09°, 39.53°, 43.28°, 47.28°, and 48.65° confirming the complete calcite polymorph crystal structures, corresponding well with JCPDS# 47-1743 databases for calcite calcium carbonate. However, with PCC from 0.5 M salt concentration (Fig. 1E-a), the additional new XRD peaks appear at 2 theta of 21.07°, 25.05°, 27.20°, 32.94°, 43.33°, 50.15°, and 57.53°, corresponding to the presence and formation of vaterite polymorph crystal structure.34Therefore, the XRD results can confirm the coexistence of vaterite and calcite polymorphs after the precipitation of calcium carbonate particles. However, the intensities of vaterite peaks are relatively lower in 0.03 M (Fig. 1E-b) salt concentration than 0.5 M (Fig. 1E-a), indicating the lower formation of vaterite polymorphs. As shown in Fig. 1D, at a lower salt molar concentration (0.03 M), different morphologies and crystal structures were obtained with non-aggregated spherical and cubic particles with a slightly larger size as compared to 0.5 M salt concentration. According to the ATR-IR results, as shown in Fig. 1F, the ESP spectra possess four fundamental vibrational modes of carbonate ions at 1410 cm−1 assigned to asymmetric stretching (νas), at 1074 cm−1 attributed to symmetric stretching (νs), at 872 cm−1 assigned to out-of-plane bending (δas), and at 713 cm−1 ascribed to in-plane bending (δs) vibrations. The symmetric stretching band is relatively weak as it is an infrared-forbidden isolated carbonate ion.35 As shown in Fig. 1F-a, the in-plane bending band at 713 cm−1 dispersed after precipitation of calcium carbonate from 0.5 M salt concentration, and the new band appeared at 744 cm−1 due to the polymorphs transformation from calcite to vaterite structure. In Fig. 1F-b, however, the intensity of the band at 744 cm−1 relatively decreased, comparing to that band from ESP spectrum. Furthermore, the asymmetric stretching vibration band at 1410 cm−1 becomes broader after precipitation with both 0.5 and 0.03 M salts concentration, indicating the transformation of calcite to vaterite polymorph structures.
The Raman spectra of ESP (Fig. 1G-ESP) demonstrate a strong peak at 1085 cm−1 due to symmetric stretching of C–O bonds. This peak was the weak forbidden band in ATR-IR spectroscopy, which is Raman active, relatively strong, and distinctive. On the other hand, the in-plane bending at 715 cm−1 is weaker than the ATR-IR mode and represents the calcite polymorphs. These two bands are called “internal modes” due to their vibrations between the C and O of carbonate ions.36 Furthermore, the Raman spectrum of ESP calcium carbonates contains “lattice modes” in the range of 100 cm−1 to 300 cm−1 derived from vibrations among calcium carbonate molecules in the lattice. The sharp and distinct peaks in lattice mode are characteristics of calcite polymorph structure. Raman spectroscopy considers a robust analysis for identifying a mixture of calcium carbonate polymorphs due to its excellent differentiation determined by each polymorphs structure.37 As shown in Fig. 1G-a, with precipitation of calcium carbonate from 0.5 M salt concentration, the symmetric stretching of C–O band at 1087 cm−1 becomes broader and in-plane bending of calcite calcium carbonate vibration at 715 cm−1 disappears. This is accompanied by broadening the “lattice modes” peaks, indicating the formation of vaterite calcium carbonate polymorphs.
On the other hand, Fig. 1G-b shows the insignificant change of calcite characteristic peaks, indicating the coexistence of both calcite and vaterite polymorphs mixture. The polymorphs aggregation in higher salt concentrations might be due to the increased numbers of ions available during the polymorph nucleation, leading to the growing crystals instead of forming new nuclei. Therefore, the aggregation would be tentatively higher with more ions in the solution, by which polyelectrolytes would prevent, accordingly.
Influence of polyelectrolytes in high salt concentration
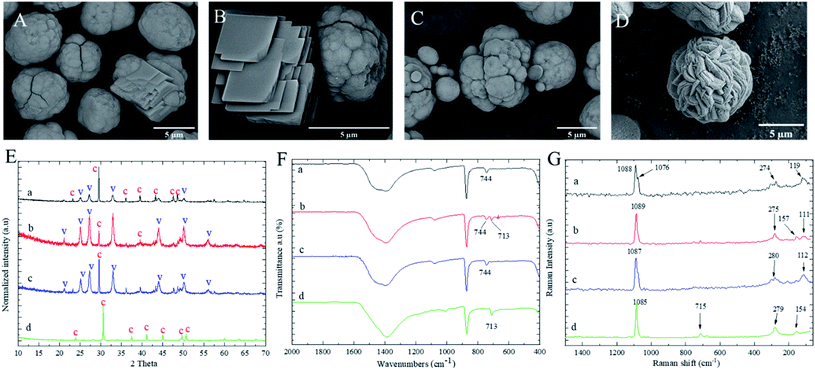
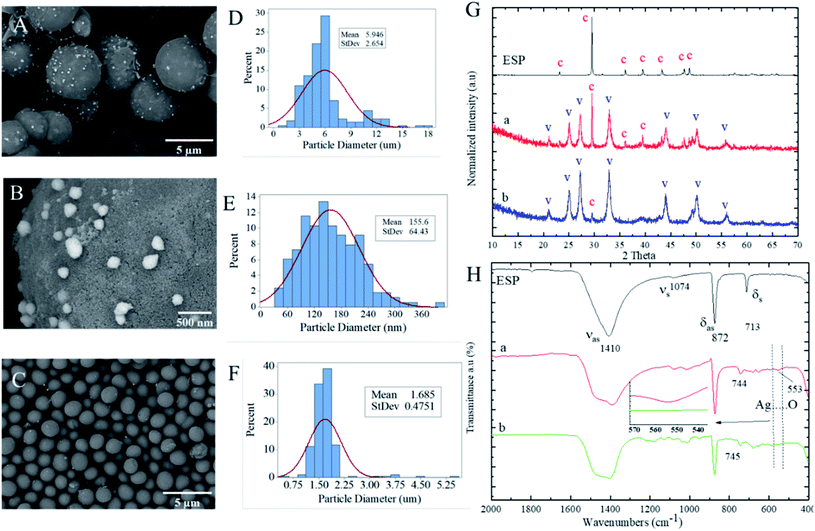
PCC crystals with different morphologies are obtained in the presence of EG, PEG-600, PEG-6000, and PSS. The morphology of PCC particles obtained from 0.5 M salt solution with the addition of 2 w/v% PEG-600 is shown in Fig. 2A. Irregular PCC particles can be seen with intermediate cubic and spherical shapes. In contrast, as shown in Fig. 2B, in the presence of higher molecular weight PEG-6000, lamellar calcite calcium carbonate was obtained together with framboids vaterite calcium carbonate crystals. The formation of lamellar calcium carbonate was also reported by Liu et al. reported precipitation from calcium chloride and sodium carbonate solution in the presence of polysaccharides obtained from sticky rice.38 As shown in Fig. 2C, non-uniform aggregated particles were observed using EG. However, spherical yarn shape PCC particles were observed by switching from EG to anionic PSS polyelectrolyte. A similar yarn-ball-like morphology of calcium carbonate has been reported by the precipitation method from carbide lime sludge waste and ammonium chloride as starting materials to obtain biobased calcium chloride solution.39The various PCC crystal morphologies are derived from the high concentration of calcium ions and their interaction with different polyelectrolyte molecular chains. After mixing the calcium and carbonate ions in the polyelectrolyte solution, amorphous calcium carbonate (ACC) is quickly formed as a kinetic product.40 The intermolecular interactions such as electrostatic or van der Waals forces among ACC and the hydroxyl groups of the polyelectrolyte chains control the growth of metaphase vaterite or calcite polymorph formation. Based on the XRD results shown in Fig. 2A, calcite is a preferred polymorph in the presence of a lower molecular weight PEG, PEG-600. However, vaterite is a preferred polymorph using EG and PEG-6000. The intensity of the most characteristic peak of calcite polymorph at 2θ of 29.52°, observed in Fig. 2E-b, was slightly lower (in the presence of PEG-6000). Despite the vaterite predominance, the calcite polymorph also coexists with vaterite polymorph. The result is in accordance with the morphology image shown in Fig. 2B. Unlike non-ionic polyelectrolytes, the inclusion of anionic PSS resulted in calcite polymorph exclusively in high salt molar concentration (Fig. 2E-d). As shown in Fig. 2F-b and G-b, the appearance of both in-plane bending bands at 713 cm−1 and 744 cm−1 in ATR spectra and absorption at 157 cm−1 in Raman spectra indicate the coexistence of vaterite and calcite formation in the presence of PEG-6000. Those results suggest that PEG with higher molecular weight has a higher impact on the shape and stabilisation of vaterite formation during the precipitation process from high salt molar concentration. The reason might be due to the larger chains entanglement of PEG-6000 than PEG-600, which resulted in a more corporative link to calcium ions nucleation. Therefore, the effect of higher percentage of EG and PEG on formation of PCC polymorph was presented in the following section.
Influence of higher polyelectrolyte proportion in high salt concentration
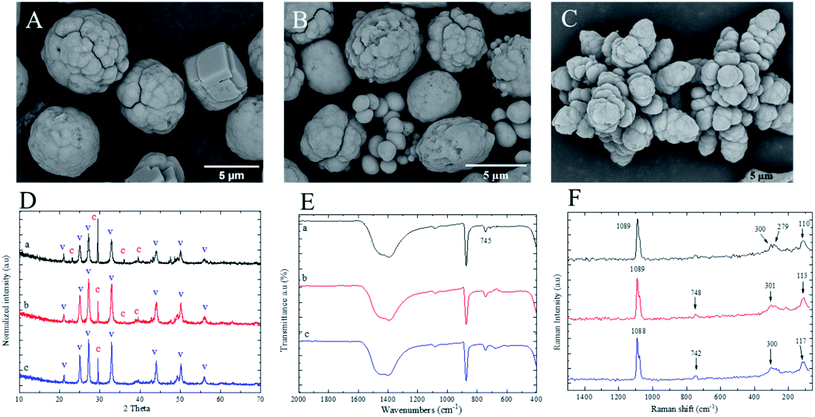
The concentration of polyelectrolytes was increased to study their higher proportion effects on formation of PCC polymorph. As shown in Fig. 3A, sphere-shaped complex aggregated vaterite calcium carbonate was observed as well as cubic calcium carbonate in the presence of 4 w/v% of EG. However, with 4 w/v% of PEG-6000, the individual spherical particles were observed in the scan area (Fig. 3B). Further increasing the concentration of PEG-6000 to 7 w/v%, the star-shaped vaterite calcium carbonate was observed. The formation of star-shaped vaterite PCC particles might be due to the aggregation of vaterite polymorphs on a common nucleus in the nucleation processes.41 The aspect of star-shaped PCC particles is their higher surface area than spherical or cubic particles. The star-shaped vaterite of calcium carbonate was also reported by Trushina et al.28 Based on SEM results, it can be concluded that PEG has a better influence on morphology of PCC than EG in terms of spherical star-shaped vaterite formation. This might be related to a 3D chain entanglement formation of PEG with more spatial functional groups to effectively stabilise the PCC particles. However, the moving feasibility of calcium and carbonate ions was affected by their high salt concentration in the presence of a more viscous polyelectrolyte. Hence, individually primary PCC particles were not observed. According to the XRD results shown in Fig. 3D, all three sample mixtures gave rise to a mixture of calcite and vaterite polymorph structures. However, as can be also observed in Fig. 3D, the intensity of the peaks related to calcite are lower than that related vaterite PCC particles. Therefore, vaterite is the dominant polymorph in the presence of 7 w/v% PEG-6000. The crystalline polymorph structure of PCC particles was also investigated by ATR and Raman spectroscopy (Fig. 3E and F). From the ATR, the in-plane bending at 745 cm−1 in all three samples attributed to the characteristic peaks for the vaterite phase. Furthermore, from Raman spectra, the presence of a broad lattice peak in the range of 100 cm−1 to 300 cm−1 indicated the vaterite polymorph structure of calcium carbonates for all samples.Influence of polyelectrolytes in low salt concentration
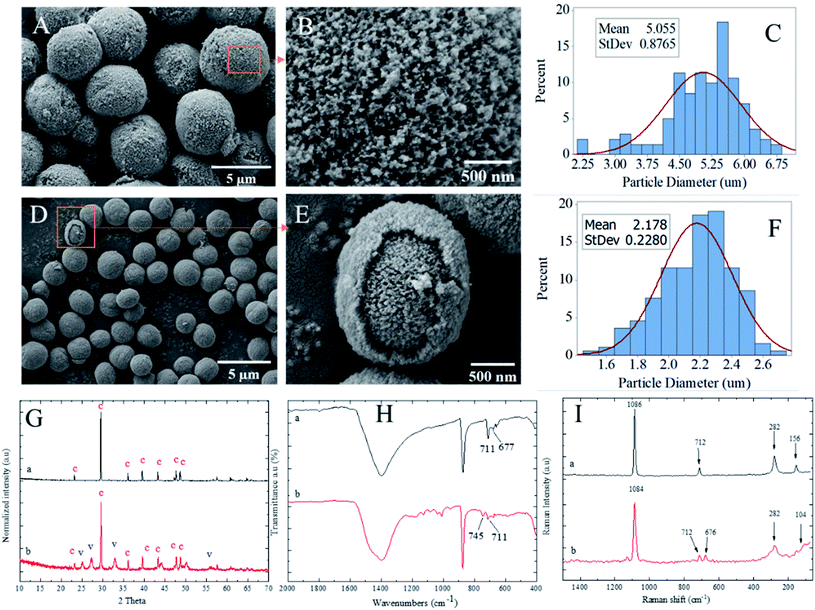
In this section, calcium carbonates were precipitated from lower initial calcium nitrate and sodium carbonate molar concentrations. The morphology results obtained from 0.03 M concentration in the presence of 7 w/v% PEG-6000 and 1.5 w/v% PSS indicated the PCC particles formation with porous surface structure and spherical shapes. This is shown how significant it is to adjust the salt molar concentration besides polyelectrolyte (MW and concentration), in order to make control of the stability, polymorph's structure, and size of PCC particles. The smaller PCC particles with relatively lower average diameter were obtained in the presence of PSS polyelectrolyte compared to PEG-6000 due to the more efficient complexation of calcium ions by the anionic groups of PSS.42 The particle size distribution (PSD) can be measured by counting the number of PCC particles to determine diameters with respect to size ranges. Particle diameters vs. percentages are plotted as histograms and shown in Fig. 4. The histogram of PCC particles in the presence of PEG-6000 shows that the maximum PSD is in the range of 4.5–6 μm with a mean diameter (Dm) of 5.05 ± 0.87 μm. However, lower values of max PSD (1.9–2.4 μm) and Dm were observed for PCC particles obtained with presence of PSS compared to PCC particles obtained with the presence of PEG-6000. The observed reduction in particle size upon precipitation in the presence of PSS is most likely related to the anionic nature of PSS, resulting in increased surface tension of the calcium carbonate at the initial stage of growth and thus giving rise to smaller particles.Based on the XRD results shown in Fig. 4G, only calcite polymorph exists in PCC in the presence of PEG-6000. Moreover, the existence of calcite polymorph was confirmed by the presence and absence of in-plane bending at 713 cm−1 and 745 cm−1, respectively as shown in ATR spectrum of Fig. 4H-a. The “lattice mode” in Raman spectra of Fig. 4I-a also presents the sharp peaks representing the entire calcite polymorph structure. However, calcite and vaterite coexistence polymorphs were confirmed by XRD in the presence of PSS. Based on the core–shell formation of PCC particles, there would be a possibility of having core as vaterite stabilised by PSS and growing shell as calcite, which grows afterwards. The phase of two polymorphs' core–shell formation can be observed in the higher magnification of the SEM image in Fig. 4E. The obtained information confirmed the role of salt molar concentration to decrease the size of spherical PCC particles with vaterite-calcite polymorph's structure using PSS or increase the size of spherical PCC with calcite polymorph dominant structure using PEG-6000.
Loading of silver nanoparticles on vaterite calcium carbonate
Spherical calcium carbonate particles can be employed as drug or nanoparticles carriers due to their high biocompatibility and biodegradability. The precipitation of calcium carbonate in a silver colloid can lead to loading the silver nanoparticles in calcium carbonate particles in situ while the crystals grow. The role of CMC polyelectrolyte was first as a reducing agent to reduce the Ag+ to silver nanoparticles (Ag0) and secondly as a stabilizer to stabilize the Ag0 nanoparticles after their formation and prevent their agglomeration in silver colloid solution before in situ precipitation of calcium carbonate. The SEM analysis was performed to observe the morphological characteristics of the PCC particles and silver nanoparticles with different polyelectrolytes. As illustrated in Fig. 5A, spherical PCC particles were deposited by silver nanoparticles.Moreover, as shown in Fig. 5B, the spherical silver nanoparticles on the outer layer of PCC particles were observed at a higher magnification SEM image. However, the silver nanoparticles were not observed on the outer layer of PCC particles using PSS due to the core–shell structure formation (Fig. 4E) as well as concurrent the silver nanoparticles encapsulation within the core–shell structure. This assumption was further proved by ATR analysis (Fig. 5H). The Ag⋯O absorption band at 553 cm−1 was observed in PCC particles loaded silver nanoparticles in the presence of PEG-6000 and not in the presence of PSS. The absence of Ag⋯O absorption in PCC particles in PSS presence could indicate the encapsulation of silver nanoparticles. The EDS results were also further performed to prove the above assumption.
Fig. 5D–F show the histogram plots of particle diameters vs. percentages for PCC loaded silver nanoparticles using PEG-6000 and PSS polyelectrolytes. The histogram of PCC loaded with silver nanoparticles using PEG-6000 shows that the maximum PSD is in the range of 3–7 μm with a mean value Dm of 5.9 ± 2.6 μm. The PSD histogram of silver on PCC particles (Fig. 5E) shows that the maximum PSD of silver nanoparticles is in the range of 70–240 nm with Dm of 155.6 ± 64 nm. The maximum PSD of PCC particles loaded with silver nanoparticles decreased significantly to 1–2 μm with a Dm value of 1.68 ± 0.47 μm utilising PSS as polyelectrolyte solution instead of PEG-6000. As shown in Fig. 5G-a, the XRD analysis indicates the mixture formation of vaterite and calcite with dominant vaterite polymorphs structures. However, Fig. 5G-b shows that vaterite polymorph is the sole crystal structure in the presence of PSS polyelectrolyte.
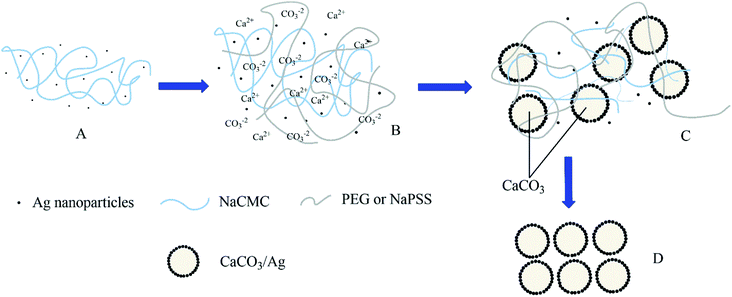
The proposed precipitation process of calcium carbonate particles in silver colloid and polyelectrolyte solution is illustrated in Fig. 6. Matai et al. have reported the precipitation of calcite calcium carbonate decorated with silver nanoparticles obtained from a synthetic salt origin in the presence of seaweed as a source of polysaccharide and silver colloid and found that the shapes of PCC particles depend on initial calcium salt molar concentration.43
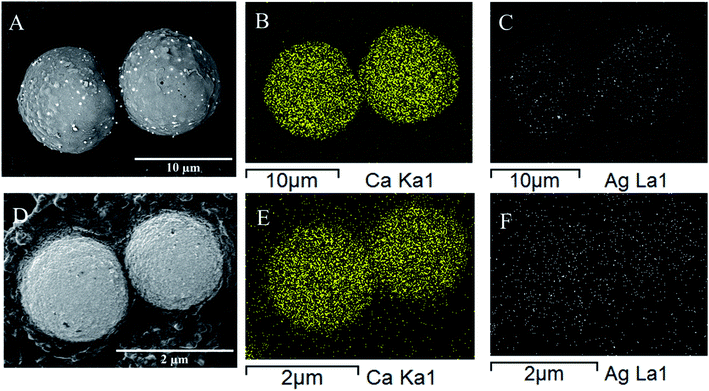
Fig. 7 shows the energy-dispersive X-ray spectroscopy mapping (EDS) images of the PCC particles loaded with silver nanoparticles utilising PSS and PEG-6000 polyelectrolytes. The silver nanoparticles have not demonstrated a clear spherical pattern (Fig. 7D) using PSS polyelectrolyte due to their possibility of encapsulation during the core–shell formation based on our previous assumption. In contrast, silver nanoparticles depicted a clear spherical pattern (Fig. 7C), indicating their loading at the outer layer of PCC particles. Furthermore, EDS atomic weight percentage (wt%) elemental analysis revealed the average wt% of silver atom loaded in PCC particles with the presence of PEG-6000 was higher (4.27 wt%) than in the PCC particles with the presence of PSS (1.44 wt%).
Surface analysis
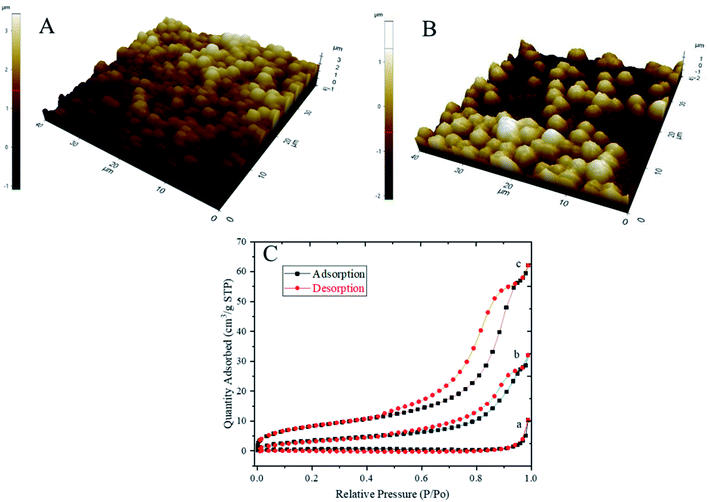
Fig. 8A and B show the three-dimensional (3D) AFM topography images of PCC particles before and after loading with silver nanoparticles in the presence of PSS polyelectrolyte. AFM images show the spherical shape morphology of the PCC particles, which are in agreement with SEM images (Fig. 4D and 5C). The AFM study results demonstrate that loading the silver nanoparticles decreases the surface roughness of calcium carbonate particles, and the root mean square value (RMS) is reduced from 1.69 μm in PCC particles without silver nanoparticles to 1.12 μm in PCC particles loaded with silver nanoparticles. The decrease in surface roughness would help the particles be more stabilised in suspension. In addition, particles with smoother surfaces feature strong adhesive forces.44 The nitrogen adsorption–desorption linear isotherms of untreated ground eggshell particles, PCC in the presence of PSS polyelectrolyte with low salt molar concentration and a silver loaded calcium carbonate are shown in Fig. 8C. Fig. 8C-a shows that the untreated eggshell is non-porous or macroporous, representing the isotherm type II.45 However, as shown in Fig. 8C-b and c, the adsorption–desorption behaviour has been changed with precipitation and indicating mesoporous crystal structures, reflecting the isotherm type IV.46 The Brunauer–Emmett– Teller (BET) surface area of untreated eggshell calcium carbonate powders is 2.2813 m2 g−1 with a pore volume of 0.003092 cm3 g−1. However, after precipitation of calcium carbonate in the presence of PSS polyelectrolyte and loading with silver nanoparticles the BET surface area was increased significantly to 13.5841 m2 g−1 and 30.4632 m2 g−1, respectively. Moreover, the pour volume was also increased to 0.040260 cm3 g−1 and 0.087130 cm3 g−1, respectively. Therefore, it can be concluded that the precipitation of calcium carbonate in presence of PSS polyelectrolyte and silver nanoparticles can significantly increase the surface area of particles. However, as reported by Minakshi et al., other treatment methods such as calcination of chicken eggshells effectively reduced the surface area of particles.47Conclusions
Spherical calcium carbonate powders were successfully synthesised from discarded eggshell wastes by precipitation technique in the presence of different polyelectrolytes. The experimental results showed that morphologies and polymorphs structures of PCC particles could be effectively tunned by changing the experimental parameters such as initial calcium ions molar concentration, using different polyelectrolytes (non-ionic or ionic) with different molecular weight, and concentration of polyelectrolyte solution. The histogram of PCC particles shows that the maximum particle size distribution in low salt concentration is in the range of 4.5–6 μm and 1.9–2.4 μm in the presence of PEG-6000 and PSS polyelectrolytes, respectively. Moreover, the precipitation technique changed the adsorption–desorption behaviour from non-porous or macroporous in untreated eggshell particles to mesoporous crystal structures.In addition, PCC has also been precipitated in the silver colloid. Silver nanoparticles were mainly loaded on PCC particles' outer layer using PEG as polyelectrolyte while mostly encapsulated within the PCC particles using PSS polyelectrolyte. Therefore, the PCC particles can be employed as delivery vehicles or encapsulants for nanoparticle loading. It can be concluded that using discarded eggshells to produce calcium carbonate particles by precipitation technique effectively enables the control of PCC's morphology and polymorph structure in the presence of different polyelectrolyte solutions. The obtained silver-loaded PCC particles in this study have the potential to be incorporated into the polymer matrix film and applied for advanced material applications such as antimicrobial food packaging or wound dressing.
Conflicts of interest
There are no conflicts of interest to declare.Acknowledgements
The authors would like to thank Thailand Science Research and Innovation (TSRI) for financial support.References
- M. Minakshi, H. Visbal, D. R. G. Mitchell and M. Fichtner, Dalton Trans., 2018, 47, 16828–16834 RSC.
- M. Felipe-Sesé, D. Eliche-Quesada and F. A. Corpas-Iglesias, Ceram. Int., 2011, 37, 3019–3028 CrossRef.
- S. Owuamanam and D. Cree, J. Compos. Sci., 2020, 4, 70 CrossRef CAS.
- M. R. Saeb, M. Ghaffari, H. Rastin, H. A. Khonakdar, F. Simon, F. Najafi, V. Goodarzi, P. P. Vijayan, D. Puglia, F. H. Asl and K. Formela, RSC Adv., 2017, 7, 2218–2230 RSC.
- D. Athanasiadou, W. Jiang, D. Goldbaum, A. Saleem, K. Basu, M. S. Pacella, C. F. Böhm, R. R. Chromik, M. T. Hincke, A. B. Rodríguez-Navarro, H. Vali, S. E. Wolf, J. J. Gray, K. H. Bui and M. D. McKee, Sci. Adv., 2018, 4, 1–13 CrossRef PubMed.
- M. M. Mailafiya, K. Abubakar, A. Danmaigoro, S. M. Chiroma, E. B. A. Rahim, M. A. M. Moklas and Z. A. B. Zakaria, Appl. Sci., 2019, 9, 1–25 Search PubMed.
- B. M. Jessop, J. C. Shiao, Y. Iizuka and W. N. Tzeng, Aquat. Biol., 2008, 2, 171–178 CrossRef.
- B. J. Tiimob, G. Mwinyelle, W. Abdela, T. Samuel, S. Jeelani and V. K. Rangari, J. Agric. Food Chem., 2017, 65, 1967–1976 CrossRef CAS PubMed.
- T. A. Hassan, V. K. Rangari and S. Jeelani, ACS Sustainable Chem. Eng., 2014, 2, 706–717 CrossRef CAS.
- P. Toro, R. Quijada, M. Yazdani-Pedram and J. L. Arias, Mater. Lett., 2007, 61, 4347–4350 CrossRef CAS.
- M. Baláž, J. Ficeriová and J. Briančin, Chemosphere, 2016, 146, 458–471 CrossRef PubMed.
- M. Baláž, Z. Bujňáková, P. Baláž, A. Zorkovská, Z. Danková and J. Briančin, J. Colloid Interface Sci., 2015, 454, 121–133 CrossRef PubMed.
- V. Apalangya, V. Rangari, B. Tiimob, S. Jeelani and T. Samuel, Appl. Surf. Sci., 2014, 295, 108–114 CrossRef CAS.
- D. Render, T. Samuel, H. King, M. Vig, S. Jeelani, R. J. Babu and V. Rangari, J. Nanomater., 2016, 2016, 3170248 Search PubMed.
- S. C. Onwubu, A. Vahed, S. Singh and K. M. Kanny, J. Appl. Biomater. Funct. Mater., 2017, 15, e341–e346 Search PubMed.
- I. Udrea, C. Capat, E. A. Olaru, R. Isopescu, M. Mihai, C. D. Mateescu and C. Bradu, Ind. Eng. Chem. Res., 2012, 51, 8185–8193 CrossRef CAS.
- Y. Lai, L. Chen, W. Bao, Y. Ren, Y. Gao, Y. Yin and Y. Zhao, Cryst. Growth Des., 2015, 15, 1194–1200 CrossRef CAS.
- W. Hou and Q. Feng, J. Cryst. Growth, 2005, 282, 214–219 CrossRef CAS.
- T. Beuvier, B. Calvignac, G. J. R. Delcroix, M. K. Tran, S. Kodjikian, N. Delorme, J. F. Bardeau, A. Gibaud and F. Boury, J. Mater. Chem., 2011, 21, 9757–9761 RSC.
- G. Yuan, X. Chen, X. Li, Q. Liang, G. Miao and B. Yuan, Powder Technol., 2015, 284, 253–256 CrossRef CAS.
- N. H. Sulimai, R. A. Rani, Z. Khusaimi, S. Abdullah, M. J. Salifairus, M. Rusop, S. Alrokayan and H. Khan, IEEE Reg. Symp. Micro Nanoelectron., 2017, 187–190 Search PubMed.
- Z. Zhao, L. Zhang, H. Dai, Y. Du, X. Meng, R. Zhang, Y. Liu and J. Deng, Microporous Mesoporous Mater., 2011, 138, 191–199 CrossRef CAS.
- L. Brečević, V. Nöthig-Laslo, D. Kralj and S. Popović, J. Chem. Soc., Faraday Trans., 1996, 92, 1017–1022 RSC.
- S. Maleki Dizaj, M. Barzegar-Jalali, M. H. Zarrintan, K. Adibkia and F. Lotfipour, Expert Opin. Drug Delivery, 2015, 12, 1649–1660 CrossRef PubMed.
- P. Y. Lin, H. M. Wu, S. L. Hsieh, J. S. Li, C. Dong, C. W. Chen and S. Hsieh, Chemosphere, 2020, 254, 126903 CrossRef CAS PubMed.
- W. Sutapun, Y. Raksakulpiwat, N. Suppakarn, R. Jeencham and A. Aontee, Adv. Mater. Res., 2012, 410, 228–231 CAS.
- M. Długosz, M. Bulwan, G. Kania, M. Nowakowska and S. Zapotoczny, J. Nanopart. Res., 2012, 14, 1313 CrossRef PubMed.
- D. B. Trushina, T. V. Bukreeva and M. N. Antipina, Cryst. Growth Des., 2016, 16, 1311–1319 CrossRef CAS.
- X. Xu, Y. Zhao, Q. Lai and Y. Hao, J. Appl. Polym. Sci., 2010, 119, 319–324 CrossRef.
- Q. Li, Y. Ding, F. Li, B. Xie and Y. Qian, J. Cryst. Growth, 2002, 236, 357–362 CrossRef CAS.
- D. B. Trushina, T. V. Bukreeva, M. V. Kovalchuk and M. N. Antipina, Mater. Sci. Eng., C, 2014, 45, 644–658 CrossRef CAS PubMed.
- W. Wang, G. Wang, Y. Liu, C. Zheng and Y. Zhan, J. Mater. Chem., 2001, 11, 1752–1754 RSC.
- Q. Yu, H. D. Ou, R. Q. Song and A. W. Xu, J. Cryst. Growth, 2006, 286, 178–183 CrossRef CAS.
- A. I. Putkham, S. Ladhan and A. Putkham, Mater. Trans., 2018, 59, 1220–1224 CrossRef CAS.
- P. Yin, MSc thesis, Universitat Konstantz, 2016.
- T. M. DeCarlo, Nat. Commun., 2018, 9, 9–11 CrossRef PubMed.
- A. Dandeu, B. Humbert, C. Carteret, H. Muhr, E. Plasari and J. M. Bossoutrot, Chem. Eng. Technol., 2006, 29, 221–225 CrossRef CAS.
- Q. Liu, Y. Ma, X. Duan, Y. Zhou, X. Liu and C. Pei, CrystEngComm, 2014, 16, 11042–11049 RSC.
- C. W. Hargis, I. A. Chen, M. Devenney, M. J. Fernandez, R. J. Gilliam and R. P. Thatcher, Materials, 2021, 14, 2709 CrossRef CAS PubMed.
- J. D. Rodriguez-Blanco, S. Shaw and L. G. Benning, Nanoscale, 2011, 3, 265–271 RSC.
- B. V. Parakhonskiy, A. M. Yashchenok, S. Donatan, D. V. Volodkin, F. Tessarolo, R. Antolini, H. Möhwald and A. G. Skirtach, ChemPhysChem, 2014, 15, 2817–2822 CrossRef CAS PubMed.
- A. Jada and K. Jradi, Macromol. Symp., 2006, 233, 147–151 CrossRef CAS.
- C. Matei, D. Berger, A. Dumbrava, M. D. Radu and E. Gheorghe, J. Sol-Gel Sci. Technol., 2020, 93, 315–323 CrossRef CAS.
- J. D. Olarte-Plata, G. Brekke-Svaland and F. Bresme, Nanoscale, 2020, 12, 11165 RSC.
- G. Aranovich and M. Donohue, J. Colloid Interface Sci., 1998, 200, 273–290 CrossRef CAS.
- M. N. Kajama, Sustain. Dev. Plan. VII, 2015, 1, 447–456 Search PubMed.
- M. Minakshi, S. Higley, C. Baur, D. R. G. Mitchell, R. T. Jones and M. Fichtner, RSC Adv., 2019, 9, 26981–26995 RSC.
| This journal is © The Royal Society of Chemistry 2022 |

