 Open Access Article
Rapid determination of lambda-cyhalothrin residues on Chinese cabbage based on MIR spectroscopy and a Gustafson–Kessel noise clustering algorithm
Jun Zhenga,
Zhe Gonga,
Shaojie Yina,
Wei Wanga,
Meng Wanga,
Peng Lina,
Haoxiang Zhou *ab and
Yangjian Yanga
aDepartment of Electrical and Control Engineering, Research Institute of Zhejiang University-Taizhou, Taizhou 318000, China
bSchool of Electrical and Information Engineering, Jiangsu University, Zhenjiang 212000, China
First published on 23rd June 2022
Abstract
Pesticide residues exceeding the standard in Chinese cabbage is harmful to human health. In order to quickly, non-destructively and effectively qualitatively analyze lambda-cyhalothrin residues on Chinese cabbage, a method involving a Gustafson–Kessel noise clustering (GKNC) algorithm was proposed to cluster the mid-infrared (MIR) spectra. A total of 120 Chinese cabbage samples with three different lambda-cyhalothrin residue levels (no lambda-cyhalothrin, and cases where the ratios of lambda-cyhalothrin and water were 1![[thin space (1/6-em)]](https://www.rsc.org/images/entities/char_2009.gif) :
:![[thin space (1/6-em)]](https://www.rsc.org/images/entities/char_2009.gif) 500 and 1
500 and 1![[thin space (1/6-em)]](https://www.rsc.org/images/entities/char_2009.gif) :
:![[thin space (1/6-em)]](https://www.rsc.org/images/entities/char_2009.gif) 100) were scanned using an Agilent Cary 630 FTIR spectrometer for collecting the MIR spectra. Next, multiple scatter correction (MSC) was employed to eliminate the effects of light scattering. Furthermore, principal component analysis (PCA) and linear discriminant analysis (LDA) were utilized to reduce the dimensionality and extract the feature information from the MIR spectra. Finally, fuzzy c-means (FCM) clustering, Gustafson–Kessel (GK) clustering, noise clustering (NC) and the GKNC algorithm were applied to cluster the MIR spectral data, respectively. The experimental results showed that the GKNC algorithm gave the best classification performance compared against the other three fuzzy clustering algorithms, and its highest clustering accuracy reached 93.3%. Therefore, the GKNC algorithm coupled with MIR spectroscopy is an effective method for detecting lambda-cyhalothrin residues on Chinese cabbage.
100) were scanned using an Agilent Cary 630 FTIR spectrometer for collecting the MIR spectra. Next, multiple scatter correction (MSC) was employed to eliminate the effects of light scattering. Furthermore, principal component analysis (PCA) and linear discriminant analysis (LDA) were utilized to reduce the dimensionality and extract the feature information from the MIR spectra. Finally, fuzzy c-means (FCM) clustering, Gustafson–Kessel (GK) clustering, noise clustering (NC) and the GKNC algorithm were applied to cluster the MIR spectral data, respectively. The experimental results showed that the GKNC algorithm gave the best classification performance compared against the other three fuzzy clustering algorithms, and its highest clustering accuracy reached 93.3%. Therefore, the GKNC algorithm coupled with MIR spectroscopy is an effective method for detecting lambda-cyhalothrin residues on Chinese cabbage.
1. Introduction
Chinese cabbage, originating in China, is a major cash crop.1 Chinese cabbage is enjoyed by people all over the world and is widely planted.2–4 Chinese cabbage is rich in multiple nutritional components and has a high medicinal value, and therefore it occupies an important position in many vegetable markets.5 Due to it containing protein, crude fibre, multivitamins and minerals (such as calcium, phosphorus and iron), Chinese cabbage can prevent cardiovascular disease, scurvy and cancer.6 However, insect pests are the main reason hindering the normal growth of Chinese cabbage during the whole planting process. In order to increase production, many farmers commonly use high-concentration lambda-cyhalothrin as an insecticide.7 However, the long-term intake of Chinese cabbage with high lambda-cyhalothrin residue levels may lead to several chronic diseases, and even death.8–11 As food safety is gradually being taken more seriously, many countries have imposed strict limits on pesticide residues in vegetables and fruits.12 Consumers have a high demand for high-quality and pollution-free Chinese cabbage, but many markets lack effective ways to detect lambda-cyhalothrin residues. Therefore, a fast, convenient, effective and non-destructive method is urgently required to identify lambda-cyhalothrin residues on Chinese cabbage.Chemical analysis techniques have been widely applied to accurately detect pesticide residues in fruits and vegetables. For instance, Sivaperumal et al. used ultrahigh-performance liquid chromatography/time-of-flight mass spectrometry (UHPLC/TOF-MS) to sensitively identify and quantify 60 pesticide residues, and proved the reliability of the method for such detection in various food samples.13 Li et al. developed gas chromatography-tandem mass spectrometry (GC-MS/MS) coupled with a modified QuEChERS method, which illustrated a good applicability, recovery and repeatability for the detection of 133 pesticide residues in chenpi.14 Yang et al. utilized gas chromatography combined with an electron capture detector (GC-ECD) to accurately screen and quantitatively analyze 15 pesticide residues in various leafy vegetables.15 Sun et al. developed a method involving ultrahigh-performance liquid chromatography coupled with diode array detection (UHPLC-DAD) for the simultaneous identification of E/Z-fluoxastrobins, and extended its application to 160 kinds of vegetables and fruits.16 Laura et al. adopted an accurate and sensitive method involving an ion chromatography-tandem mass spectrometry system (IC-MS/MS) to determine 9 highly polar anionic pesticides.17 However, due to their typically complicated operation, high cost, time-consuming and polluting nature, it is difficult to promote the large-scale application of chemical analysis techniques for the detection of pesticide residues.
At present, infrared (IR) spectroscopy technology is considered a quite mature technique with the emergence of several new types of spectral instruments. The characteristic information of hydrogen groups in organic molecules can be obtained by scanning samples by IR spectroscopy.18 Due to the advantages in terms of convenience, rapidity, non-destructivity, accuracy and efficiency, IR spectroscopy technology has been widely applied in many fields, such as food production,19–21 agricultural product classification,22–24 environment monitoring25 and medical safety.26–28 Especially for the detection of pesticide residues, researchers have achieved great success through utilizing IR spectroscopy technology. Sun et al. combined a series of methods, such as competitive adaptive reweighted sampling (CARS), iteratively retaining informative variables (IRIV), gravitational search algorithm (GSA) and support vector machine (SVM) approaches, to analyze the collected near-infrared (NIR) spectral data of lettuce leaves, and the detection accuracy for pesticide residues was up to 98.33%.29 Jamshidi et al. used partial least squares (PLS) and partial least squares-discriminant analysis (PLS-DA) to establish an NIR spectral data model for cucumber, so as to be able to quickly analyze the safety of samples.30 Yazici et al. developed a non-destructive detection method based on NIR spectroscopy to determine multiple pesticide residues on strawberry fruits.31 Jamshidi et al. collected the visible/near-infrared (Vis/NIR) spectra of cucumber at a range of 450–1000 nm, and then applied PLS-DA to accurately classify samples with different concentrations of diazinon residue.32 Xue et al. used both particle swarm optimization (PSO) and a PLS model to predict the dichlorvos residue on the surface of navel orange with Vis/NIR spectroscopy.33 However, MIR spectroscopy technology combined with fuzzy clustering algorithms has rarely been reported as applied to detect pesticide residues in vegetables and fruits.34
Fuzzy clustering analysis belongs to unsupervised machine learning method. Fuzzy clustering algorithms can determine a sample's attributes by clustering and modelling unlabelled sample data.35,36 Since the concept of fuzzy partitioning was first put forward, fuzzy clustering algorithms have been continuously extended. Among many fuzzy clustering algorithms, fuzzy c-means (FCM) clustering is the most widely applied and successful app.37,38 FCM obtains the fuzzy membership of each sample point by optimizing the objective function, and then correctly determines the class of sample points. However, FCM is sensitive to noise data and prone to local optimization. In order to overcome the shortcomings of FCM, researchers have made a series of improvements. Gustafson and Kessel proposed a new fuzzy clustering algorithm called Gustafson–Kessel (GK) clustering.39,40 Not only that, to solve the noise sensitivity problem of FCM, Noise clustering (NC) algorithm relaxes the noise distance to optimize the objective function.41 The proposed GKNC algorithm is a derivation of GK clustering and the NC algorithm, and uses the Mahalanobis distance as a new distance measure to accurately cluster the analyzed data points with a high-dimensional, non-spherical or elliptical distribution. Therefore, GKNC can cluster MIR spectra with a complicated data structure and has shown good robustness.
In this paper, the Gustafson–Kessel noise clustering (GKNC) algorithm combined with MIR spectroscopy technology was proposed to quickly identify lambda-cyhalothrin residues on Chinese cabbage. The MIR spectra of Chinese cabbage were collected using an Agilent Cary 630 FTIR spectrometer. Then, multiple scatter correction (MSC) was used to reduce the MIR spectral scattering and noise effects. Furthermore, principal component analysis (PCA) and linear discriminant analysis (LDA) were applied to reduce the dimensions and extract the identification information, respectively. Finally, an optimal method for clustering MIR spectral data of Chinese cabbage was verified by running the FCM, GK, NC and GKNC algorithms.
2. Materials and methods
2.1 Samples preparation
In this experiment, fresh Chinese cabbage (Brassica rapa, Chinese group) were purchased from the same supermarket.42 In total, 120 Chinese cabbage leaf samples were collected under similar growth conditions. All the samples were washed adequately with water (45 °C), which removed pesticide residues on the surface of the samples effectively. Then, the samples were stored in sealed bags.Lambda-cyhalothrin (5% EC, Shandong Shenda Crop Science Co. Ltd, Shouguang, China) was selected as the experimental pesticide. The 120 cabbage leaves were randomly and evenly divided into three groups, so each group had 30 leaves. Lambda-cyhalothrin and clear water were mixed made into two different concentrations of solution, with ratios of 1![[thin space (1/6-em)]](https://www.rsc.org/images/entities/char_2009.gif) :
:![[thin space (1/6-em)]](https://www.rsc.org/images/entities/char_2009.gif) 500 and 1
500 and 1![[thin space (1/6-em)]](https://www.rsc.org/images/entities/char_2009.gif) :
:![[thin space (1/6-em)]](https://www.rsc.org/images/entities/char_2009.gif) 100 respectively. Group A were sprayed with water as the control group. Two different concentrations of lambda-cyhalothrin solution were sprayed on the surface of groups B and C, respectively, striving to maintain a uniform and comprehensive spraying.
100 respectively. Group A were sprayed with water as the control group. Two different concentrations of lambda-cyhalothrin solution were sprayed on the surface of groups B and C, respectively, striving to maintain a uniform and comprehensive spraying.
In order to reduce the effect of water, all the prepared samples were placed in a cool and ventilated place for 24 h. Before MIR spectra collection, the samples of Chinese cabbage leaves were made into 2 mm × 2 mm small samples.
2.2 MIR spectra collection
An Agilent Cary 630 FTIR spectrometer (Agilent Technologies Co., USA) was utilized to collect the MIR spectral data of Chinese cabbage. Micro lab PC and Resolutions Pro were used as the data collection software. During the whole collection process, the experimental temperature and relative humidity were kept at about 25 °C and 50–60%, respectively. The spectrometer adopted an ATR (attenuated total reflectance) adapter to scan the Chinese cabbage samples 64 times. The resolution ratio of the Agilent Cary 630 FTIR spectrometer was 8 cm−1, and the background scanning was set to 64 times. The wavenumber range of the collected MIR spectra was 4000–400 cm−1. Also, the dimensionality of the collected spectral data was 971.2.3 MIR spectra preprocessing
The collected MIR spectral data contained light scatter information, such as noise, baseline shift and translation. At the same time, light scattering was also affected by the sample size and the external environment. Due to the existence of light scattering information in the original spectral data, the results from the direct classification were unsatisfactory. Multiple scatter correction (MSC) was utilized as an effective and common spectral data preprocessing method.24 Therefore, MSC preprocessed the MIR spectral data of Chinese cabbage to eliminate the light scattering effectively and to enhance the spectral absorption information related to the contents of the components.2.4 Feature extraction and dimension reduction methods
The collected MIR spectra represented the high-dimensional data (the dimensionality of the MIR spectra was 971), so they also contained redundant information and noisy data. Not only that, the high-dimensional data caused the curse of dimensionality. In order to reduce the huge amount of computation required and to improve the modelling accuracy, feature extraction and dimension reduction methods were used to process the MIR spectra of the Chinese cabbage leaves. Principal component analysis (PCA) was used to map the high-dimensional data to the low-dimensional space to reduce the dimensionality of the MIR spectra while retaining the largest variance information.43 Linear discriminant analysis (LDA) was used as a feature extraction and dimension reduction method based on scatter matrixes.44 With the LDA process, the spectral data were transformed and the data belonging to different classes were separated as much as possible so as to accurately classify Chinese cabbage samples with three different lambda-cyhalothrin residue levels in the low-dimensional data. In this paper, PCA and LDA were applied to reduce the dimensionality of the MIR spectra and extract the feature information from the MIR spectra.2.5 Gustafson–Kessel noise clustering (GKNC) algorithm
In this paper, a new clustering algorithm called Gustafson–Kessel noise clustering (GKNC) was proposed which uses the combination of GK clustering and the NC algorithm while including their advantages. GKNC adopted the Mahalanobis distance to replace the original Euclidean distance. Therefore, GKNC expanded the range of data to be clustered. The GKNC was able to accurately perform cluster analysis on the non-spherical or elliptical data by automatically adjusting the distance measures. The detailed description of the GKNC algorithm is as follows.Given an unlabelled data set X = {x1, x2, …, xn} ⊂ ![[scr R, script letter R]](https://www.rsc.org/images/entities/char_e531.gif) p, the objective function of the GKNC algorithm is defined as:
p, the objective function of the GKNC algorithm is defined as:
 | (1) |
 | (2) |
| D2ik = (xk − vi)TSfi(xk − vi), 1 ≤ i ≤ c, 1 ≤ k ≤ n | (3) |
 | (4) |
 | (5) |
 | (6) |
The initialization of the GKNC algorithm is performed described as follows:
(1) Assign values to parameters such as m, c, n and ε. The fuzzy weight parameter m > 1, the threshold ε > 0 and 1 < c < n.
(2) Set the maximum number of iteration rmax and the number of initial iteration r0 = 1.
(3) The terminal fuzzy membership and the terminal cluster centres of FCM are used as the initial fuzzy membership u(0)ik and the initial cluster centre v(0)i of the GKNC algorithm.
(4) The terminal fuzzy membership and the terminal cluster centres of FCM are utilized to calculate the constant δ2ik by eqn (2)–(4);
The iteration steps of the GKNC algorithm are:
Step 1: Calculate the norm matrix D2ik by eqn (2) and (3).
Step 2: Update the fuzzy membership value u(r)ik by eqn (5).
Step 3: Update the typical value v(r)i by eqn (6).
Step 4: Add the number of iterations r.
The termination condition of (‖v(r)i − v(r−1)i‖ < ε) or r > rmax is then judged. If the termination condition is met, the iteration ends.
The GKNC algorithm uses the terminal fuzzy membership values and the terminal cluster centres to identify the Chinese cabbage samples with four pesticide residue levels.
2.6 Software
MSC, PCA, LDA and fuzzy clustering algorithms, such as FCM, GK, NC and GKNC, were run on Matlab 2016a (Mathworks Co., USA) under the Windows 10 system. The computer processor was an i7 core.3. Results and discussion
3.1 Spectral analysis
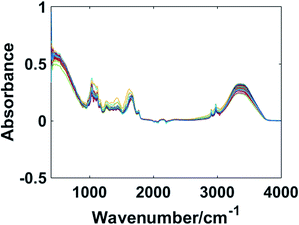
In this study, the wavenumber range of the collected MIR spectra was 4000–400 cm−1. The MIR spectra contained a lot of characteristic functional group information as shown in Fig. 1. Fresh Chinese cabbage contains plenty of water, so the MIR spectra were greatly affected by water. The three main absorption peaks in the 3600–3200 cm−1, 1700–1500 cm−1, and 1100–900 cm−1 regions were due to the specific absorption of water. Not only that, the chemical bonds, such as C–O and P–O stretching vibrations, ranged from 1200 to 1100 cm−1. The region of 1500–1200 cm−1 mainly contained the C–H, N–H distortion vibrations and the N–O, N![[double bond, length as m-dash]](https://www.rsc.org/images/entities/char_e001.gif) O stretching vibrations. Because Chinese cabbage with different lambda-cyhalothrin residue levels had different functional group information, the MIR spectra were able to accurately express all the samples.
O stretching vibrations. Because Chinese cabbage with different lambda-cyhalothrin residue levels had different functional group information, the MIR spectra were able to accurately express all the samples.
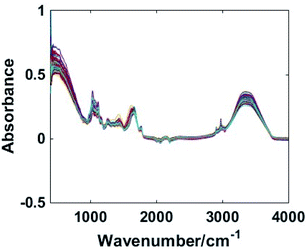
In order to eliminate the influence of noise interference and instrument detection on the original spectral data, it was necessary to preprocess the data. The MIR spectral data were preprocessed by MSC in Fig. 2.
3.2 PCA analysis
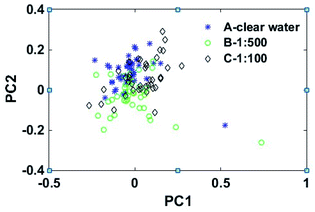
For further analysis, PCA was applied to reduce the dimensionality of the MIR spectra data. In this study, because the first 22 principal components explained 98.9% of the total variance and fully retained the characteristic information of the spectral data, PCA mapped 971-dimensional spectral data to the 22-dimensional feature space, and the dimensions were reduced from 971 to 22. The first 22 eigenvalues were as follows: λ1 = 2.070, λ2 = 1.230, λ3 = 0.830, λ4 = 0.410, λ5 = 0.224, λ6 = 0.135, λ7 = 0.082, λ8 = 0.062, λ9 = 0.061, λ10 = 0.032, λ11 = 0.029, λ12 = 0.028, λ13 = 0.021, λ14 = 0.018, λ15 = 0.016, λ16 = 0.012, λ17 = 0.011, λ18 = 0.010, λ19 = 0.008, λ20 = 0.007, λ21 = 0.006, λ22 = 0.005. The first 22 principal components were directly clustered by four fuzzy clustering algorithms, and the highest clustering accuracy of GKNC was only 63.3%. In order to visualize the spectral data information processed by PCA, the scores plot of the first two principal components were drawn. As shown in Fig. 3, the MIR spectral data of the Chinese cabbage had no unique feature areas and severely overlapped. Due to the existence of redundant data, it was difficult for the fuzzy clustering algorithms to identify the Chinese cabbage samples. In order to accurately classify the Chinese cabbage samples, the MIR spectral data needed to be further processed.3.3 LDA analysis
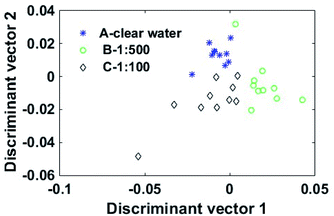
LDA, as a supervised dimensionality reduction algorithm, is commonly used to extract discrimination information from data. PCA was first applied to reduce the dimensionality of the high-dimension data while avoiding the problem of small samples when LDA extracted discriminant information. In this study, LDA extracted the feature vectors from the 22-dimensional spectral data. The Chinese cabbage samples were divided into the training set and the test set. The number of the training samples was 90 and the number of the test samples was 30. Due to the Chinese cabbage samples being classified according to three lambda-cyhalothrin residue levels, the training set was processed to produce two optimal discriminant vectors (DV1 and DV2). The 22-dimensional spectral data of the 30 test samples were projected to DV1 and DV2, so they were transformed into two-dimensional data. Fig. 4 shows the scores plot of the two optimal discriminant vectors. As shown in Fig. 4, the MIR spectral data of the Chinese cabbage samples with three different lambda-cyhalothrin residue levels had good distribution areas.3.4 Classification results of the FCM clustering algorithm
In this section, fuzzy c-means (FCM) clustering was applied to cluster the MIR spectral data of the test samples after PCA dimension reduction and LDA feature information extraction. All the relevant parameters needed to be reset before running FCM clustering. The parameters were as follows: threshold value ε = 0.00001, fuzzy weight parameter m = 3, number of sample categories![[thin space (1/6-em)]](https://www.rsc.org/images/entities/char_2009.gif) c = 3, number of test samples n = 30, maximum number of iterations rmax = 100 and the initial number of iterations r0 = 1. The initial cluster centres were the average values of the Chinese cabbage sample data of each concentration after LDA, so the initial cluster centres of FCM were:
c = 3, number of test samples n = 30, maximum number of iterations rmax = 100 and the initial number of iterations r0 = 1. The initial cluster centres were the average values of the Chinese cabbage sample data of each concentration after LDA, so the initial cluster centres of FCM were:
 | (7) |
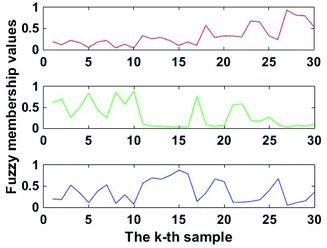
The terminal cluster centres were obtained by running FCM after 15 iterations. The terminal fuzzy membership values are shown in Fig. 5. Therefore, the terminal cluster centres of FCM were determined according to eqn (8).
 | (8) |
In this experiment, the average values for the Chinese cabbage training samples were: group A  , group B
  and group C
  . The Euclidean distances between v(15)i and
  were calculated, so as to determine which variety v(15)i belonged to. Therefore, the Euclidean distances were:
  ,
,  , and
, and  . Due to the Euclidean distance between v(15)1 and
  being the smallest, v(15)1 belonged to the group C. Not only that, the varieties of v(15)2 and v(15)3 were determined in the same way. v(15)2 and v(15)3 belonged to groups A and B, respectively.
The terminal fuzzy membership values of FCM were also used to classify the Chinese cabbage test samples. If the terminal fuzzy membership value uik that was produced by the kth test sample xk was the biggest, xk belonged to vi. For instance, u(15)15 = 0.0977, u(15)25 = 0.8165 and u(15)35 = 0.0858, so u(15)25 > u(15)15 > u(15)35. Due to x5 belonging to v(15)2, x5 belonged to group A. Moreover, the classification accuracy of FCM was 80%.
3.5 Classification results of the GK clustering algorithm
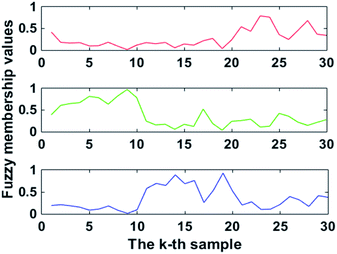
GK clustering based on the Mahalanobis distance was utilized to cluster the MIR spectral data of the test samples. Before running GK, the parameters such as ε, m, c, n, r0 and rmax were set the same as for the FCM. After 100 iterations, the terminal fuzzy membership values were determined and are shown in Fig. 6. The terminal cluster centres of GK were:
 | (9) |
Like FCM clustering, the terminal cluster centres and the terminal fuzzy membership values that were produced by GK were used to identify the Chinese cabbage varieties. The terminal cluster centres v(100)1, v(100)2 and v(100)3 were determined in terms of which variety they belonged to by calculating the distances between v(100)i and  . Therefore, the terminal cluster centres v(100)1, v(100)2 and v(100)3 belonged to groups C, A and B, respectively. Not only that, the terminal fuzzy membership values of the 5th test sample were: u(100)15 = 0.0514, u(100)25 = 0.8364 and u(100)35 = 0.1122. Therefore, sample x5 was classified into group A. The classification accuracy of GK reached 73.3%.
3.6 Classification results of the NC algorithm
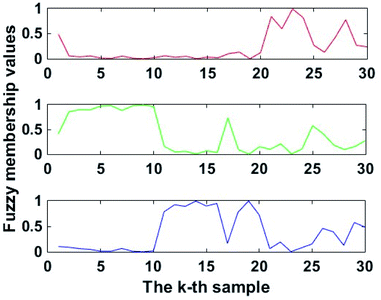
NC was applied to classify the Chinese cabbage varieties by the terminal fuzzy membership values. Like FCM, some parameters needed to be reset before running NC. Therefore, some parameters were: threshold ε = 0.00001, fuzzy weight value m = 3, class number c = 3, amount of test set n = 30 and the maximum number of iterations rmax = 100. The initial cluster centres of NC came from the terminal cluster centres of FCM. Therefore, the terminal fuzzy membership values of NC are illustrated in Fig. 7. The terminal cluster centres of NC were:
 | (10) |
For clustering results analysis, the terminal cluster centres v(10)1, v(10)2 and v(10)3 belonged to groups C, A and B, respectively. On the other hand, the terminal fuzzy membership values of the third Chinese cabbage test sample were: u(10)15 = 0.0050, u(10)25 = 0.8455 and u(10)35 = 0.0026. The Chinese cabbage test sample x5 belonged to v(10)2; that is to say, x5 belonged to group A. As a result, the classification accuracy of NC was 90%.
3.7 Classification results of the GKNC algorithm
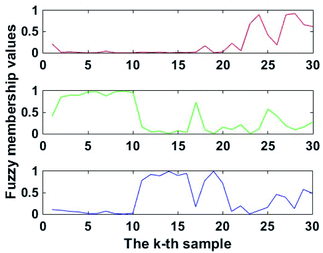
Unlike NC, GKNC adopted the Mahalanobis distance to replace the Euclidean distance. GKNC also offered the terminal fuzzy membership values to classify the Chinese cabbage samples. Some parameters of the GKNC program were: class number c = 3, threshold value ε = 0.00001, fuzzy weight value m = 3, number of test samples n = 30, and the maximum iteration rmax = 100. δ2ik was calculated by the terminal fuzzy membership values of FCM and the terminal cluster centres of FCM. Not only that, the terminal cluster centres of FCM were used as the initial cluster centres of GKNC. After one iteration, the terminal fuzzy membership values of GKNC were determined, as shown in Fig. 8. Therefore, the terminal cluster centres of GKNC were:
 | (11) |
The terminal fuzzy membership values provided by GKNC had the same classification principle as FCM, GK and NC. The clustering accuracy of GKNC was 93.3%. Furthermore, the classification accuracy of GKNC was higher than that of FCM, GK and NC.
3.8 Selection of the optimal fuzzy weight value and test samples
Four fuzzy clustering algorithms, namely FCM, GK, NC and GKNC, were applied to cluster the test samples. Therefore, the fuzzy membership values generated by four fuzzy clustering algorithms were able to classify the Chinese cabbage samples with three different lambda-cyhalothrin residue levels. However, the fuzzy weight value (m) and the number of test samples (n_test) were important factors to change the fuzzy membership values. Before running the four fuzzy clustering algorithms, the fuzzy weight value (m) was changed and the remaining parameters remained unchanged (especially the number of training samples n_training = 90 and the number of test samples n_test = 30). The clustering accuracy also changed owing to the change of the fuzzy weight value (m). From Table 1, the fuzzy membership values from GKNC produced the maximum classification accuracy compared to the other fuzzy clustering algorithms.| m | FCM | GK | NC | GKNC |
|---|---|---|---|---|
| 2.3 | 80% | 53.3% | 90% | 93.3% |
| 2.5 | 80% | 50% | 90% | 93.3% |
| 2.8 | 80% | 70% | 90% | 93.3% |
| 3 | 80% | 73.3% | 90% | 93.3% |
| 3.3 | 80% | 73.3% | 90% | 93.3% |
| 3.5 | 80% | 80% | 90% | 93.3% |
| 3.8 | 80% | 83.3% | 90% | 93.3% |
| 4 | 83.3% | 86.7% | 86.7% | 93.3% |
On the other hand, the number of training samples and training samples were changed, and the fuzzy weight value (m) was set as m = 3. The clustering results are shown in Table 2, and the classification accuracies of GKNC can be seen to be obviously higher than for the others.
| n_training | n_test | FCM | GK | NC | GKNC |
|---|---|---|---|---|---|
| 90 | 30 | 80% | 73.3% | 90% | 93.3% |
| 84 | 36 | 80.6% | 47.2% | 86.1% | 91.7% |
| 75 | 45 | 84.4% | 42.2% | 86.7% | 93.3% |
| 72 | 48 | 85.4% | 43.8% | 87.5% | 91.7% |
In order to compare the clustering accuracies of the four fuzzy clustering algorithms under different conditions, the fuzzy weight value (m) and the number of training samples were modified at the same time. The clustering accuracies are shown in Table 3. As shown in Table 3, the classification accuracies of GKNC had the highest clustering accuracies, reaching 93.3%.
| m | n_training | n_test | FCM | GK | NC | GKNC |
|---|---|---|---|---|---|---|
| 2 | 90 | 30 | 80% | 53.3% | 86.7% | 93.3% |
| 2.5 | 87 | 33 | 80.8% | 73.7% | 87.8% | 92.9% |
| 3 | 84 | 36 | 78.7% | 71.3% | 87% | 92.6% |
| 3.5 | 78 | 42 | 83.3% | 73% | 86.5% | 92.9% |
| 4 | 75 | 45 | 83.7% | 73.3% | 89.6% | 93.3% |
3.9 Selection of different numbers of concentration levels
In order to further prove the superior performance of the GKNC algorithm, a new concentration level (the ratio of lambda-cyhalothrin and water was 1![[thin space (1/6-em)]](https://www.rsc.org/images/entities/char_2009.gif) :
:![[thin space (1/6-em)]](https://www.rsc.org/images/entities/char_2009.gif) 20) was added. FCM, GK, NC and GKNC were used to identify and classify the four different lambda-cyhalothrin concentrations of Chinese cabbage samples. The clustering accuracies of the four algorithms are shown in Table 4. The clustering accuracies of GKNC were significantly higher than that of FCM, GK and NC.
20) was added. FCM, GK, NC and GKNC were used to identify and classify the four different lambda-cyhalothrin concentrations of Chinese cabbage samples. The clustering accuracies of the four algorithms are shown in Table 4. The clustering accuracies of GKNC were significantly higher than that of FCM, GK and NC.
| m | n_training | n_test | FCM | GK | NC | GKNC |
|---|---|---|---|---|---|---|
| 2 | 90 | 30 | 80% | 53.3% | 85.8% | 93.3% |
| 2.5 | 87 | 33 | 80.3% | 73.5% | 86.4% | 93.2% |
| 3 | 84 | 36 | 80.6% | 70.1% | 86.1% | 92.4% |
| 3.5 | 78 | 42 | 82.9% | 73.2% | 86% | 93.3% |
| 4 | 75 | 45 | 83.3% | 73.3% | 90% | 93.3% |
4. Conclusions
To qualitatively determine lambda-cyhalothrin residues in Chinese cabbage quickly, non-destructively and effectively, the Gustafson–Kessel noise clustering (GKNC) algorithm coupled with MIR spectroscopy was proposed. The GKNC algorithm is a derivation of Gustafson–Kessel (GK) clustering and noise clustering (NC). The MIR spectral data were collected for 120 Chinese cabbage samples of three lambda-cyhalothrin residue levels using an Agilent Cary 630 FTIR spectrometer. MIR spectra were processed by multiple scatter correction (MSC), principal component analysis (PCA) and linear discriminant analysis (LDA). Finally, four fuzzy clustering algorithms, namely fuzzy c-means (FCM) clustering, Gustafson–Kessel (GK) clustering, noise clustering (NC) and GKNC, were used to cluster the spectral data. GKNC was able to identify and classify the lambda-cyhalothrin concentration of Chinese cabbage accurately and had the highest classification accuracies compared to the other three fuzzy clustering algorithms. The experimental results proved that the GKNC algorithm coupled with MIR spectroscopy was superior in the identification of lambda-cyhalothrin residues on Chinese cabbage.Conflicts of interest
The authors declare that they have no known competing financial interests or personal relationships that could have influenced the work reported in this paper.Acknowledgements
The authors sincerely thank National Natural Science Foundation of China (31471413), and Key R&D Program of Zhejiang Province (2021C03178).References
- Y. X. Wei, F. Li, S. J. Zhang, S. F. Zhang, H. Zhang, H. Y. Qiao and R. F. Sun, Characterization of interspecific hybrids between Chinese cabbage (Brassica rapa) and red cabbage (Brassica oleracea), Sci. Hortic., 2019, 250, 33–37 CrossRef.
- G. Rasool, X. P. Guo, Z. C. Wang, M. Hassan, M. Aleem, Q. Javed and S. Chen, Effect of Buried Straw Layer Coupled with Fertigation on Fluorescence and Yield Parameters of Chinese Cabbage Under Greenhouse Environment, J. Soil Sci. Plant Nutr., 2020, 20, 598–609 CrossRef CAS.
- E. A. Alenyorege, H. L. Ma, J. H. Aheto, A. A. Agyekum and C. S. Zhou, Effect of sequential multi-frequency ultrasound washing processes on quality attributes and volatile compounds profiling of fresh-cut Chinese cabbage, LWT--Food Sci. Technol., 2020, 117, 108666 CrossRef CAS.
- M. Wen, H. H. Wang, Y. L. Chen, Y. M. Jiang, F. P. Chen and Z. Luo, Inhibition effect of super atmospheric O2 packaging on H2O2-production and the key enzymes of lignin biosynthesis in fresh-cut Chinese cabbage, Postharvest Biol. Technol., 2020, 159, 111027 CrossRef CAS.
- R. A. Shawon, B. S. Kang, S. G. Lee, S. K. Kim, H. J. Lee, E. Katrich, S. Gorinstein and Y. G. Ku, Influence of drought stress on bioactive compounds, antioxidant enzymes and glucosinolate contents of Chinese cabbage (Brassica rapa), Food Chem., 2020, 308, 125657 CrossRef CAS PubMed.
- C. H. Kang, E. K. Yoon, M. Muthusamy, J. A. Kim, M. J. Jeong and S. I. Lee, Blue LED light irradiation enhances L-ascorbic acid content while reducing reactive oxygen species accumulation in Chinese cabbage seedlings, Sci. Hortic., 2020, 261, 108924 CrossRef CAS.
- S. M. R. Azam, H. L. Ma, B. G. Xu, S. Devi, M. A. B. Siddique, S. L. Stanley and B. Bhandari, Efficacy of ultrasound treatment in the removal of pesticide residues from fresh vegetables: A review, Trends Food Sci. Technol., 2020, 97, 417–432 CrossRef CAS.
- H. Y. Liu, X. M. Bai and X. P. Pang, Intercity variability and local factors influencing the level of pesticide residues in marketed fruits and vegetables of China, Sci. Total Environ., 2020, 700, 134481 CrossRef CAS PubMed.
- K. H. Kim, E. Kabir and S. A. Jahan, Exposure to pesticides and the associated human health effects, Sci. Total Environ., 2017, 575, 523–535 CrossRef PubMed.
- N. Yang, P. Wang, C. Y. Xue, J. Sun and H. P. Mao, A portable detection method for organophosphorus and carbamates pesticide residues based on multilayer paper chip, J. Food Process Eng., 2018, 41, e12867 CrossRef.
- G. Ding and Y. Bao, Revisiting pesticide exposure and children's health: focus on China, Revisiting pesticide exposure and children's health: focus on China, Sci. Total Environ., 2014, 472, 289–295 CrossRef CAS PubMed.
- M. Lefrancq, A. Jadas-Hecart, L. La-Jeunesse, D. Landry and S. Payraudeau, High frequency monitoring of pesticides in runoff water to improve understanding of their transport and environmental impacts, Sci. Total Environ., 2017, 587, 75–86 CrossRef PubMed.
- P. Sivaperumal, P. Anand and L. Riddhi, Rapid determination of pesticide residues in fruits and vegetables, using ultra-high-performance liquid chromatography/time-of-flight mass spectrometry, Food Chem., 2015, 168, 356–365 CrossRef CAS PubMed.
- S. Li, P. P. Yu, C. Zhou, L. Tong, D. X. Li, Z. G. Yu and Y. L. Zhao, Analysis of pesticide residues in commercially available chenpi using a modified QuEChERS method and GC-MS/MS determination, J. Pharm. Anal., 2020, 10, 60–69 CrossRef PubMed.
- Y. Farina, M. P. Abdullah, N. Bibi and W. M. A. W. M. Khalik, Determination of pesticide residues in leafy vegetables at parts per billion levels by a chemometric study using GC-ECD in Cameron Highlands, Malaysia, Food Chem., 2017, 224, 55–61 CrossRef CAS PubMed.
- Q. Sun, W. M. Wang, Y. B. Li, G. Y. Wen, H. X. Tang, W. G. Song and M. F. Dong, A novel approach for simultaneous determination of E/Z-fluoxastrobins in vegetables and fruits by UHPLC-DAD, Food Control, 2017, 78, 7–13 CrossRef CAS.
- L. M. Melton, M. J. Taylor and E. E. Flynn, The utilisation of ion chromatography and tandem mass spectrometry (ICMS/MS) for the multi-residue simultaneous determination of highly polar anionic pesticides in fruit and vegetables, Food Chem., 2019, 298, 125028 CrossRef CAS PubMed.
- M. Mukrimin, A. O. Conrad, A. Kovalchuk, R. Julkunen-Tiitto, P. Bonello and F. O. Asiegbu, Fourier-transform infrared (FT-IR) spectroscopy analysis discriminates asymptomatic and symptomatic Norway spruce trees, Plant Sci., 2019, 289, 110247 CrossRef CAS PubMed.
- J. U. Porep, D. R. Kammerer and R. Carle, On-line application of near infrared (NIR) spectroscopy in food production, Trends Food Sci. Technol., 2015, 46, 211–230 CrossRef CAS.
- C. W. Dong, H. K. Zhu, J. J. Wang, H. B. Yuan, J. W. Zhao and Q. S. Chen, Prediction of black tea fermentation quality indices using NIRS and nonlinear tools, J. Food Process Eng., 2017, 26, 853–860 CAS.
- J. J. Wang, M. Zareef, P. H. He, H. B. Yuan, H. Sun, Q. S. Chen, H. H. Li, Q. Ouyang, Z. M. Guo, Z. Z. Zhang and D. L. Xu, Evaluation of matcha tea quality index using portable NIR spectroscopy coupled with chemometric algorithms, J. Sci. Food Agric., 2019, 99, 5019–5027 CrossRef CAS PubMed.
- J. Sun, X. Zhou, H. P. Mao, X. H. Wu, X. D. Zhang and Q. L. Li, Discrimination of pesticide residues in lettuce based on chemical molecular structure coupled with wavelet transform and near infrared hyperspectral, J. Food Process Eng., 2017, 40, e12509 CrossRef.
- X. B. Zou, J. W. Zhao and Y. X. Li, Objective quality assessment of apples using machine vision, NIR spectrophotometer, and electronic nose, Trans. ASABE, 2010, 53, 1351–1358 Search PubMed.
- X. H. Wu, J. Zhu, B. Wu, J. Sun and C. X. Dai, Discrimination of tea varieties using FTIR spectroscopy and allied Gustafson-Kessel clustering, Comput. Electron. Agric., 2018, 147, 64–69 CrossRef.
- A. Casson, R. Beghi, V. Giovenzana, I. Fiorindo, A. Tugnolo and R. Guidetti, Environmental advantages of visible and near infrared spectroscopy for the prediction of intact olive ripeness, Biosyst. Eng., 2020, 189, 1–10 CrossRef.
- F. L. Yue, C. Chen, Z. W. Yan, C. Chen, Z. Q. Guo, Z. X. Zhang, Z. Y. Chen, F. B. Zhang and X. Y. Lv, Fourier transform infrared spectroscopy combined with deep learning and data enhancement for quick diagnosis of abnormal thyroid function, Photodiagn. Photodyn. Ther., 2020, 32, 101923 CrossRef CAS PubMed.
- C. Chen, L. Yang, H. Y. Li, F. F. Chen, C. Chen, R. Gao, X. Y. Lv and J. Tang, Raman spectroscopy combined with multiple algorithms for analysis and rapid screening of chronic renal failure, Photodiagn. Photodyn. Ther., 2020, 30, 101792 CrossRef CAS PubMed.
- C. Chen, L. Yang, J. Y. Zhao, Y. S. Yuan, C. Chen, J. Tang, H. Yang, Z. W. Yan, H. Wang and X. Y. Lv, Urine Raman spectroscopy for rapid and inexpensive diagnosis of chronic renal failure (CRF) using multiple classification algorithms, Optik, 2020, 203, 164043 CrossRef CAS.
- J. Sun, X. Ge, X. H. Wu, C. X. Dai and N. Yang, Identification of pesticide residues in lettuce leaves based on near infrared transmission spectroscopy, J. Food Process Eng., 2018, 41, e12816 CrossRef.
- B. Jamshidi, E. Mohajerani and J. Jamshidi, Developing a Vis/NIR spectroscopic system for fast and non-destructive pesticide residue monitoring in agricultural product, Measurement, 2016, 89, 1–6 CrossRef.
- A. Yazici, G. Y. Tiryaki and H. Ayvaz, Determination of pesticide residual levels in strawberry (Fragaria) by near-infrared spectroscopy, J. Sci. Food Agric., 2020, 100, 1980–1989 CrossRef CAS PubMed.
- B. Jamshidi, E. Mohajerani, J. Jamshidi, S. Minaei and A. Sharifi, Non-destructive detection of pesticide residues in cucumber using visible/near-infrared spectroscopy, Food Addit. Contam., Part A, 2015, 32, 857–863 CrossRef CAS PubMed.
- L. Xue, J. Cai, J. Li and M. Liu, Application of Particle Swarm Optimization (PSO) Algorithm to Determine Dichlorvos Residue on the Surface of Navel Orange with Vis-NIR Spectroscopy, International Workshop on Information and Electronics Engineering, 2012, vol. 29, pp. 4124–4128 Search PubMed.
- O. Kira, R. Linker and Y. Dubowski, Estimating drift of airborne pesticides during orchard spraying using active Open Path FTIR, Atmos. Environ., 2016, 142, 264–270 CrossRef CAS.
- L. Ni, W. J. Luo, W. J. Zhu and W. J. Liu, Clustering by finding prominent peaks in density space, Eng. Appl. Artif. Intell., 2019, 85, 727–739 CrossRef.
- X. H. Wu, B. Wu, J. Sun, S. W. Qiu and X. Li, A hybrid fuzzy K-harmonic means clustering algorithm, Appl. Math. Model., 2015, 39, 3398–3409 CrossRef.
- Z. X. Ji, Q. S. Sun and D. S. Xia, A modified possibilistic fuzzy c-means clustering algorithm for bias field estimation and segmentation of brain MR image, Comput. Med. Imag. Graph., 2011, 35, 383–397 CrossRef PubMed.
- J. Z. Wang, J. Kong, Y. H. Lu, M. Qi and B. X. Zhang, A modified FCM algorithm for MRI brain image segmentation using both local and nonlocal spatial constrains, Comput. Med. Imag. Graph., 2008, 31, 685–698 CrossRef PubMed.
- D. E. Gustafson and W. C. Kessel, Fuzzy clustering with a fuzzy covariance matrix, IEEE Conference on Decision and Control including the 17th Symposium on Adaptive Processes, San Diego, CA, USA, 1979, pp. 761–766 Search PubMed.
- J. Yu Chaomurilige and M. S. Yang, Deterministic annealing Gustafson-Kessel fuzzy clustering algorithm, Inf. Sci., 2017, 417, 435–453 CrossRef.
- G. P. He, M. Li, B. Wu and X. H. Wu, Generalized noise clustering based on Non-Euclidean distance in China, J. Beijing Jiaotong Univ., 2008, 32, 98–101 Search PubMed.
- J. Y. Shen, X. H. Wu, B. Wu, Y. Tan and J. M. Liu, Qualitative Analysis of Lambda-Cyhalothrin on Chinese Cabbage Using Mid-Infrared Spectroscopy Combined with Fuzzy Feature Extraction Algorithms, Agriculture, 2021, 11, 275 CrossRef.
- L. Q. He, C. L. Yin, S. Ma and Z. M. Liu, Assessing the authenticity of black pepper using diffuse reflectance midinfrared Fourier transform spectroscopy coupled with chemometrics, Comput. Electron. Agric., 2018, 154, 491–500 CrossRef.
- B. Y. Jiang, Z. Q. Chen and C. L. Leng, Dynamic linear discriminant analysis in high dimensional space, Bernoulli, 2020, 26, 1234–1268 Search PubMed.
| This journal is © The Royal Society of Chemistry 2022 |

