 Open Access Article
Simultaneous removal of organic matter and nitrogen compounds by partitioned aeration in a 226 L-scale microbial fuel cell†
Taiki Yamane‡
,
Naoko Yoshida‡ * and
Mari Sugioka
Department of Civil and Environmental Engineering, Nagoya Institute of Technology (Nitech), Gokiso-Cho, Showa-Ku, Nagoya, Aichi, Japan. E-mail: yoshida.naoko@nitech.ac.jp
First published on 18th May 2022
Abstract
Although microbial fuel cells (MFCs) have been widely studied as wastewater treatment technologies that convert organic matter to electricity, there are few reports of large-scale MFCs that treat both organic matter and nitrogen compounds. In this study, a 226 L reactor equipped with 27 MFC units was partially aerated at 10% of its total volume. The MFC unit consists of a cylindrical air core covered with a carbon-based air cathode, an anion exchange membrane, and a graphite non-woven fabric anode. The air-cathode MFC with 13 L min−1 aeration rate produced a current density of 0.0012–0.15 A m−2 with 40 to >93% biological oxygen demand (BOD) removal to have an effluent BOD of <5–36 mg L−1 at a hydraulic retention time (HRT) of 12–47 h. Meanwhile, 55 ± 17% of the total nitrogen (TN) was removed, resulting in 9.7 ± 3.8 mg L−1 TN in the effluent, although the TN removal was limited at ≥20 °C. The mono-exponential regression for BOD and TN (≥20 °C) estimated that an HRT of 21 h could meet the Japanese effluent quality standards of BOD and TN. Calculation of the total energy recovered via current generation and energy consumed by aeration suggested an energy consumption of 0.22 kW h m−3. Decreasing the aeration rate and HRT in the reactor would further reduce energy consumption and increase energy production.
1. Introduction
Municipal wastewater treatment systems have received much attention as infrastructure that recycles biomass energy and nutrients1 and maintains water quality. Energy self-sufficient wastewater treatments can be realized by recovering energy from the wastewater treatment process and improving energy consumption efficiency.2 However, practical energy capture is limited to the use of sludge for biogas fermentation and solid fuel, while dissolved organic matter in wastewater rather consumes energy to meet discharge standards and thus is not recovered as an energy source. Chemical oxygen demand (COD) removal consumes approximately 0.6 kW h kg COD−1 of energy via aeration,3 and total nitrogen (TN) removal4 consumes 6.08 kW h kg TN−1, which accounts for approximately half of the total energy consumption.1 In terms of the volumetric energy density, conventional activated sludge consumes 0.27–1.89 kW h m−3 energy for organic matter removal.2,3Microbial fuel cells (MFCs) have received much attention as a promising technology for simultaneously recovering energy and treating wastewater without aeration;5 however, there are still challenges in power production with a low concentration of organic substrate. For instance, an insufficient supplement of organic fuel to anodic microbes raises the anodic potential with low external resistance and leads to a higher anode resistance.6 Increasing the specific surface area of anode7–9 or flow velocity10 successfully increases the current recovery and COD removal efficiency. Further improvement of the anode results in a comparatively higher cathode resistance and separator membrane resistance.11 Although MFCs have progressed, the primary goal of MFC wastewater treatment is to provide good quality effluent to meet discharge standards.
MFCs are capable of successfully treating domestic wastewater without aeration, even at a > 100 L scale.6,12–19 However, the COD of the effluent from anaerobic MFC was higher than 81 mg L−1 with less than 43 h of HRT and rarely met discharge standards.6,12–19 However, there have been few exceptions; dual-chambered MFC with an aerated cathode chamber yielded an effluent with a COD 25 mg L−1.20 Thus, MFCs generally require post or partial treatments such as aeration,21 anaerobic membrane filtration,22 and activated carbon filtration.19 Furthermore, partial or post-aeration conferred external oxidizing power for nitrogen removal. The aerated cathode chamber of dual-chambered MFCs20 successfully removed nitrogen from municipal wastewater.20,23–25 Nitrogen removal has also been achieved without aeration in an air-cathode MFC, especially with a gas diffusion layer (GDL)26 and at a relatively smaller scale owing to the high GDL area/wastewater volume ratio for sufficient oxygen supplement via GDL. An anaerobic MFC using persulfate as oxidant in the cathode chamber successfully demonstrates an anammox reaction.27 An air-cathode MFC separated with an ion exchange membrane cannot achieve nitrogen removal and requires additional air supply via effluent sprinkling18 or partial aeration. Thus, nitrogen removal from municipal wastewater has been optimized for various types of MFCs and is still at the stage of feasibility, along with MFC itself.
A one-meter deep air-cathode MFC with an anion exchange membrane (AEM) was demonstrated for the first time in our previous study,28 and it successfully recovered electric power from sewage wastewater over a year.6 Previous studies have revealed that a comparison of electric power production by MFCs using AEMs and other separators shows the advantage of AEMs in mitigating pH imbalances that are often observed in MFCs with cation exchange membrane or GDL.29–31 However, the MFC with AEM could not remove TN and was estimated to require 90 W h m−3 of external energy for aeration to decrease TN from 30 to 15 mg L−1. In this study, an air-cathode MFC with an AEM was operated in a 226 L reactor with partial aeration, and the current production, biological oxygen demand (BOD) removal, nitrogen removal, and energy efficiency were evaluated.
2. Experimental
2.1 MFC unit and its operation
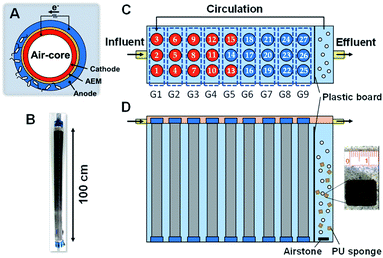
The MFC used in this study was a cylindrical structure (φ 5.0 × 100 cm) with an air chamber wrapped with carbon cloth painted with a mixture of black carbon and activated carbon as the core, AEM, and non-woven graphite fabric (Fig. 1A and B) as described previously.21 In total, 27 MFC units were previously run in a cubic reactor (34 × 110 × 110 cm) with 226 L of wastewater flowing continuously from a primary sedimentation tank for 463–535 days6 (Fig. 1C). In this study, 10% of wastewater near the outlet was supplemented with a 5 L polyurethane (PU) sponge (1 cm3) and aerated using an air pump (Fig. 1C). The aerobic and anaerobic compartments were separated by a plastic board with a slit to avoid direct expose of air to the anodic biofilm, while the aerated wastewater was circulated using a submersible pump (HY-4501, Sea Billion, Guangdong, China) at a circulation time of 0.5–3 h. The aeration rate was 34 L min−1 for 21 days and then decreased to 13 L min−1 for 165 days. The 13 L min−1 aeration rate was the minimum rate to keep sponges from settling down in the aeration compartment. The total hydraulic retention time (HRT) was in the range of 12–28 h for the anaerobic and aerobic parts. The anode and cathode of each MFC unit were individually connected via an external resistance (R = 2 Ω) during the entire operating period, and a data logger was connected in parallel with the external resistors to measure the voltage hourly.2.2 Water quality analysis
Influent and effluent BODs were analyzed by Toa Environmental Services Co., Ltd (Aichi, Japan). In this study, BOD rather than COD was determined, given that BOD is the permitted discharge water quality standard based on the regulation pertaining to sewage treatment systems in Japan. Ammonia (NH4+), nitrite (NO2−), and nitrate (NO3−) were quantitatively detected using an electron conductivity detector (CDD-10Avp; SHIMADZU, Kyoto, Japan) in an ion chromatograph equipped with Shim-pack IC-A3 (φ 4.6 × 150 mm; SHIMADZU) and Shim-pack IC-C4 (φ 4.6 × 150 mm; SHIMADZU) for anion and cation analyses, respectively. A mixture of 8 mM p-hydroxybenzoic acid, 3.2 mM Bis–Tris, and 50 mM boric acid was used for anion analysis, whereas a mixture of 2.5 mM oxalic acid dihydrate and 5 mM 18-crown-6 was used for cation analysis. Samples were filtered using a polytetrafluoroethylene membrane (0.45 μm pore size) (Merck Millipore, Darmstadt, Germany), and the filtrates were injected at 1.5 mL. TN concentration was defined as the sum of NH4+, NO2−, and NO3− concentrations.2.3 Calculation of BOD, TN, and current generated
The BOD and TN degradation rates in the reactor can be calculated using the mono-exponential regression shown in eqn (1).| C = C0e−kt | (1) |
This study assumed that all electrons were produced from the oxidation of BOD at the coulombic efficiency (CE). Therefore, the current density, I [A m−3], can be calculated using eqn (2).
 | (2) |
 [g m−3 h−1] is the degradation rate, F is Faraday's constant (96
![[thin space (1/6-em)]](https://www.rsc.org/images/entities/char_2009.gif) 485 C mol−1), b is the number of electrons produced per molecule of oxygen (4), and M is the molar mass of oxygen (32 g mol−1). The CE can be calculated based on the current production and organic matter removal using eqn (3).
485 C mol−1), b is the number of electrons produced per molecule of oxygen (4), and M is the molar mass of oxygen (32 g mol−1). The CE can be calculated based on the current production and organic matter removal using eqn (3).
 | (3) |
 | (4) |
2.4 Calculation of total energy
Total energy (TE) was calculated by combining MFC and partial aeration treatments. The energy generated by the MFC was represented by the energy generation efficiency (EGE) [W h g BOD−1] calculated using eqn (5).
 | (5) |
| Eair = Pair × HRT | (6) |
Thus, TE [W h m−3], i.e., TE for both BOD and TN removal from 1 m3 of sewage, is the sum of the energy generated by the MFC, energy consumed by partial aeration, and Eair.
| TE = EGE·ΔBOD − Pair·HRT | (7) |
3. Results and discussion
3.1 Current production
Fig. 2 shows the current densities produced in each of the 27 MFC units during operation with continuous primary sedimentation tank effluent inflow. The operation time represents the time elapsed since the start of aeration in the reactor, which originally ran for more than 500 days under anaerobic conditions.6 The HRTs varied in the range 12–47 h throughout the operation owing to the accidental clogging of the tubing pump (Fig. 2A). The current production was almost zero at 0–19 days with an aeration rate of 34 L min−1 and then gradually increased to 0.15 A m−2 at day 20 after the aeration rate decreased to 13 L min−1 (Fig. 2B), indicating that aeration inhibits the current production. The current density drastically decreased and approached zero with the increase in HRT to 23–36 h (days 34–63). The decrease in HRT to 17–20 h again increased the current production, resulting in an average current density of 0.015 A m−2 (days 64–93). The lack of current production at days 94–110 decreased the current due to the clogged inflow tube during the long vacation. Thereafter, the MFCs maintained the current production response to HRTs until the end of the operation on day 184 (Fig. 2B). The lower current at longer HRT reflects the lower BOD in the reactor that resulted from higher BOD removal.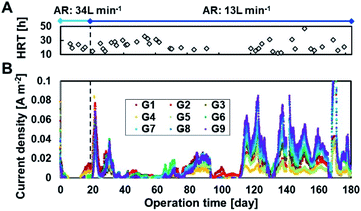 | ||
| Fig. 2 Current production in 27 microbial fuel cell (MFC) units in the continuous flow reactor. Panels (A) and (B) indicate the hydraulic retention times (HRTs) and current densities, respectively. | ||
The partial aeration at 10% volume significantly decreased current production using MFCs even in the presence of partition; 34 L min−1 of aeration almost eliminated the current production using MFC, and 13 L min−1 of aeration reduced the current production using MFC without aeration by 59–71% at an HRT of 12–24 h.6 Inhibition of current production by aeration in the anodic chamber has been reported in other MFCs.32 The oxygen of the alternative oxidant increases the anode potential by eliminating the charge on the anode, resulting in lower current. Because the current recovered immediately after decreasing the aeration rate, temporary exposure of the biofilm to oxygen did not inhibit current production irreversibly. Another reason for the decrease in current is degradation of BOD by aerobic bacteria, resulting in a lower CE.33,34
The overall trend observed was that a lower aeration rate and a shorter HRT produced more current, as observed for all MFCs, although the current varied in each MFCs due to position and unit variances. The highest current was obtained in G9, followed by G8 and G7. The higher current in the MFCs in the vicinity of aeration is possibly attributed to the enhancement of substrate supplement to anode by turbulence in wastewater due to aeration.10
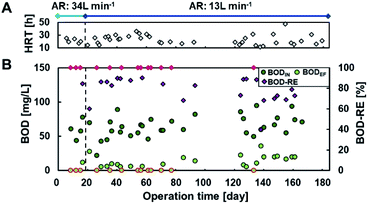
3.2 BOD removal
Fig. 3 shows BOD removal by MFCs with partial aeration in the continuous flow reactor. The influent BOD (BODIN) was maintained at 64 ± 15 mg L−1 throughout the study. Partial aeration (10%) at 34 L min−1 (day 0–19) yielded effluent BOD (BODEF) ranging from <5 mg L−1 to 12 mg L−1 at an HRT of 18–24 h. The decrease in partial aeration rate to 13 L min−1 did not remarkably change BODEF, which ranged from <5 mg L−1 to 21 mg L−1 at corresponding HRTs of 18–24 h. HRT affected BOD-removal more than aeration rate; HRT < 19 h (12–18 h) reduced BOD by 40–88%, with a BODEF of 5.9–36 mg L−1, whereas HRT of >19 h (19–47 h) resulted in 69% to >93% of BOD removal efficiency to yield BODEF of <5 mg L−1 to 20 mg L−1. Considering the permitted discharge water quality standards of the activated sludge process, which is 15 mg BOD L−1, as per the Sewerage Act in Japan, 19 h of HRT with partial aeration (10% volume) is the optimum condition.Limited aeration in wastewater treatment is a rapidly growing strategy to save energy and achieve the simultaneous removal of organic matter and TN. An HRT of 19 h with partial aeration at 13 L min−1 in a 200 L reactor corresponded to 74![[thin space (1/6-em)]](https://www.rsc.org/images/entities/char_2009.gif) 100 L HRT−1 m−3 and achieved better removal of organic matter and TN better than the reactors with limited aeration. A microbial electrochemical system (MES) with 0.5/5.5 min intermittent aeration at an air-flow rate of 400 L min−1 achieved 92% COD-reduction to 22 mg L−1 within 7 h of HRT; the accumulated airflow was calculated to be approximately 20% of that in the minimum aeration performed in this study.20 Other studies with limited aeration, such as vertical flow constructed wetlands35 and up-flow partially aerated biological filters, also achieved sufficient COD reduction with aeration, corresponding to 20% and 85% of that obtained in this study, respectively. These results suggested that a maximum 80% of aeration can be reduced (from 13 to 2.6 L min−1) to achieve sufficient effluent quality. The airflow affected current rather than BOD removal, and an 80% reduction in airflow can produce more current with lower energy consumption.
100 L HRT−1 m−3 and achieved better removal of organic matter and TN better than the reactors with limited aeration. A microbial electrochemical system (MES) with 0.5/5.5 min intermittent aeration at an air-flow rate of 400 L min−1 achieved 92% COD-reduction to 22 mg L−1 within 7 h of HRT; the accumulated airflow was calculated to be approximately 20% of that in the minimum aeration performed in this study.20 Other studies with limited aeration, such as vertical flow constructed wetlands35 and up-flow partially aerated biological filters, also achieved sufficient COD reduction with aeration, corresponding to 20% and 85% of that obtained in this study, respectively. These results suggested that a maximum 80% of aeration can be reduced (from 13 to 2.6 L min−1) to achieve sufficient effluent quality. The airflow affected current rather than BOD removal, and an 80% reduction in airflow can produce more current with lower energy consumption.
3.3 Nitrogen removal in the chemostat reactor
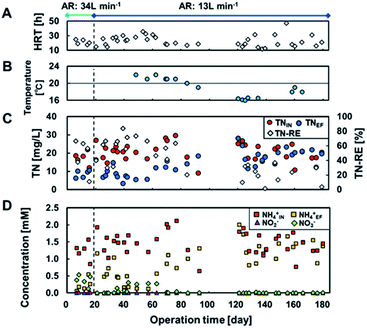
The influent TN (TNIN) was 21 ± 4.7 mg L−1 throughout the operation (Fig. 4) and was successfully reduced in the reactors at ≥20 °C (Fig. 4B). The TN removal efficiency (TN-RE) achieved was 55 ± 16%, regardless of aeration rate and yielded an effluent TN (TNEF) of 9.4 ± 3.5 mg L−1 (Fig. 4C). The data at day 17 had a significantly low TN-RE despite a longer HRT, which was probably attributed to the lower TNIN. In contrast, following day 92, TN-RE declined drastically to 13 ± 14% at <20 °C with TNEF of 19 ± 4.2 mg L−1 at an HRT of 12–47 h (Fig. 4B, C). Thus, the TNEF and TN-RE were more sensitive to water temperature than aeration rate and HRT, and a temperature of ≥20 °C was preferable for TN reduction.Fig. 4D shows the breakdown of TN, i.e., NH4+, NO2−, and NO3−. TNIN mostly comprised NH4+, which was oxidized to NO2− and NO3− by partial aeration. NH4+ removal by nitrification was supported by the absence of nitrification ability in the air-cathode MFC operated anaerobically in a previous study.6 This is typical for air-cathode MFCs using IEM instead of GDL. Therefore, the NH4+ removal is attributed to nitrification in the aeration tank rather than the MFC itself, although only the total removal was available with no breakdown of how the anaerobic and aerobic parts contributed. The imbalance between NH4+ and the oxidation products and the decrease in NH4+ suggested further denitrification. During day 0–19 with an aeration rate of 34 L min−1, 19–86% of the TNEF (0.58 ± 0.12 mM) remained as NO3− (0.13–0.53 mM), indicating insufficient denitrification due to excessive aeration. During day 19–84 with a temperature ≥ 20 °C and an aeration rate of 13 L min−1, 81 ± 25% of the TNEF (0.69 ± 0.27 mM) comprised NH4+ (0.60 ± 0.34 mM). NO3− concentration was 0.18 ± 0.11 mM during day 34–62. Additionally, after day 92 with <20 °C, the TNEF remained as NH4+ at 1.3 ± 0.31 mM.
TN removal generally involves aerobic nitrification (conversion of NH4+ to NO3−) and subsequent anoxic denitrification (conversion of NO3− to N2). Hence, BOD and NH4+ are competitive electron donors for aerobic bacteria, while electrode and NO3− are competitive electron acceptors for anaerobic bacteria. In addition, NH4+ has been reported to be the electron donor for current production by using sulphate peroxide as the oxidant in MFCs. However, there was no result suggesting that either of these competitions or the ammonia-driven current production occurred in this study. The most sensitive factor affecting TN removal was the water temperature in the MFC reactor, rather than the aeration rate, and 20 °C seemed to be the turning temperature for TN reduction. This is well agreed by the Arrhenius relationship for oxidation of ammonia, which suggests activation energies of 87.1 and 38.6 kJ mol−1 in the temperature ranges 10–20 °C and 20–30 °C, respectively.36 In contrast, nitrite oxidation has an activation energy of 34.2 kJ mol−1 in the range of 10–30 °C. These calculations suggest that the reduction in TN removal can be attributed to the requirement of twice the activation energy for ammonia oxidation. Dissolved oxygen (DO) has been recognized as an important factor for nitrification; 0.5 mg L−1 of DO is required for oxidation of both nitrite and ammonia.37 The DO in the aeration tank was approximately 1.0 mg L−1 (data not shown), with the minimum aeration rate in this study. This suggests that the aeration rate could be further decreased.
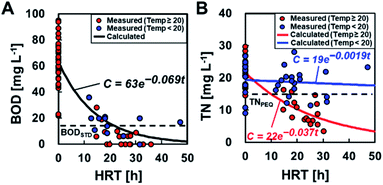
3.4 Calculation of BOD and TN degradation and current recovery
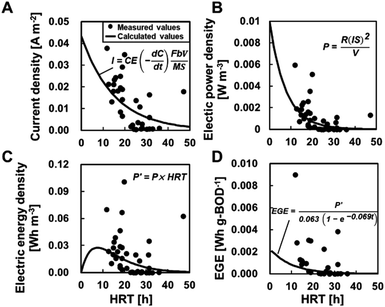
BOD degradation was determined using mono-exponential regression with BODIN and BODEF at different HRTs, resulting in the value C = 63e−0.069t (Fig. 5A). Based on this calculation, an HRT of 21 h was required to meet the discharge standard of 15 mg L−1. The degradation rate constant (0.069) in partial aeration MFCs was higher than that of the MFCs without aeration (0.046) (ref. 6) (ESI Fig. S1†), and the HRT was reduced by approximately half to meet the permitted standard discharge water quality. The TN removal was calculated as C = 22e−0.037t and C = 19e−0.0019t at ≥20 °C and <20 °C, respectively. Thus, the MFC operation at ≥20 °C of water temperature and 10 h of HRT is necessary to meet the effluent quality standards of TN, i.e., 15 mg L−1 for advanced wastewater treatment by the Sewerage Act, Japan.The measured CEs ranged from 0.078 to 21% (average CE: 4.9 ± 5.3%) and varied widely even under similar HRT and BOD (equivalent to BODEF). There was no trend between the CE and HRT, BODIN, and BODEF (ESI Fig. S2†). Therefore, the CE is assumed to be a constant value independent of the HRT and BOD concentrations and is determined using the measured current and BODEF (C = 63e−0.069t) to obtain the best fit for eqn (2). The determined CE was 2.5%, which was approximately half of the measured average, although the calculated current seemed to well demonstrate the observed current (Fig. 6A) and the electric power (Fig. 6B). The electrical energy and EGE varied and did not reproduce the experimental data well (Fig. 6C and D).
The CE obtained in this study drastically decreased from 24 ± 13% to 4.9 ± 5.3% due to aeration (HRT: 12–42 h) (ESI Fig. S3†).6 The CE with partial aeration was still higher than that in the biocathode-MES using intermittent-aerated cathode portion in half of the total wastewater (calculated as 0.64%),20 although the aeration rate was much higher in the MFC operated in this study. In our study, the CE of the MFC operated with aeration was comparable to that of two anaerobic MFCs: an air-cathode MFC with a GDL12,14 and an air-cathode MFC with a cation exchange membrane.18 This contradiction suggests that CE was determined by multiple factors rather than just aeration, which included the concentration of organic matter, electrode or separator, GDL specific surface ratio, and cathode reaction rate.
3.5 Towards practical application of MFC
TE, the sum of the total energy generated by the MFC and the energy consumed by partial aeration, was calculated for the treatment of 1 m3 of sewage at an HRT of 21 h, which enabled both BOD and TN to meet the discharge water qualities. Energy production was negligible (0.013 W h m−3), and energy consumption by partial aeration (220 W h m−3) dominated the TE. The TE (0.22 kW h m−3) corresponds to 73–11% of conventional activated sludge (0.30–1.89 kW h) and 50–11% of that in oxidation ditch plants (0.44–2.07 kW h m−3) in Japan.38 The presented total energy could reduce energy consumption but is less effective in comparison to other advanced technologies. For example, the biocathode-MES achieved 12% energy consumption of the conventional activated sludge20 with an HRT of 5 h. The superiority of MES over MFC is attributed to its shorter HRT requirement. The system combining anaerobic digestion and nitrification–anammox achieved 96% COD and 81% TN removal, with a net energy consumption of 0.09 kW h m−3.39 The high energy-consumption efficiency is attributed to the lack of aeration in the system. Thus, decreasing the aeration rate in the present reactor or lack of aeration and shortening the HRT by increasing biomass with more anode specific surface area40 are required to reduce energy consumption and increase energy production.4 Conclusions
The present study revealed that 10% partial aeration in air-cathode MFCs facilitates the meeting of the discharge standards for BOD and TN with an energy consumption of 0.22 kW h m−3. However, it decreased the current with a reduction in current recovery and dominated the total energy consumption. For practical application as a less energy consuming treatment, decreasing the aeration rate and shortening the HRT by increasing the biomass are required.Author contributions
TY analyzed the MFC data and wrote the manuscript. NY designed and operated the MFC and wrote the manuscript. MS performed MFC experiments.Conflicts of interest
There are no conflicts to declare.Acknowledgements
This study was funded by MEXT/JSPS KAKENHI grant (grant number 22H01625) and JST A-STEP grant (grant number JPMJTM20EK) and supported by Nippon KOEI Co., Ltd, Tamano Consultants Co., Ltd and TOYOBO Co., Ltd, Japan. We appreciate the staff at the Nagoya City Waterworks and Sewerage Bureau for their technical advice and permission to work at the site. We thank Akihiro Iwata of Tamano Consultants Co., Ltd for their technical support during reactor construction and Fumichika Tanaka for analytical support.References
- P. L. McCarty, J. Bae and J. Kim, Environ. Sci. Technol., 2011, 45, 7100–7106 CrossRef CAS.
- Y. Gu, Y. Li, X. Li, P. Luo, H. Wang, X. Wang, J. Wu and F. Li, Energy Procedia, 2017, 105, 3741–3751 CrossRef.
- M. Maktabifard, E. Zaborowska and J. Makinia, Rev. Environ. Sci. Biotechnol., 2018, 17, 655–689 CrossRef.
- S. Di Fraia, N. Massarotti and L. Vanoli, Energy Convers. Manage., 2018, 163, 304–313 CrossRef.
- B. E. Logan, B. Hamelers, R. Rozendal, U. Schröder, J. Keller, S. Freguia, P. Aelterman, W. Verstraete and K. Rabaey, Environ. Sci. Technol., 2006, 40, 5181–5192 Search PubMed.
- M. Sugioka, N. Yoshida, T. Yamane, Y. Kakihana, M. Higa, T. Matsumura, M. Sakoda and K. Iida, Environ. Res., 2022, 205, 112416 CrossRef CAS PubMed.
- N. Yoshida, Y. Miyata, A. Mugita and K. Iida, Materials, 2016, 9, 742 CrossRef.
- N. Yoshida, Y. Miyata and K. Iida, RSC Adv., 2019, 9, 39348–39354 RSC.
- V. Lanas, Y. Ahn and B. E. Logan, J. Power Sources, 2014, 247, 228–234 CrossRef CAS.
- K. Fujii, N. Yoshida and K. Miyazaki, Bioelectrochemistry, 2021, 107821 CrossRef CAS PubMed.
- R. Itoshiro, N. Yoshida, T. Yagi, Y. Kakihana and M. Higa, Membranes, 2022, 12, 183 CrossRef CAS PubMed.
- Y. Feng, W. He, J. Liu, X. Wang, Y. Qu and N. Ren, Bioresour. Technol., 2014, 156, 132–138 CrossRef CAS PubMed.
- Y. Goto and N. Yoshida, J. Gen. Appl. Microbiol., 2017, 63, 165–171 CrossRef CAS.
- H. Hiegemann, T. Littfinski, S. Krimmler, M. Lübken, D. Klein, K. G. Schmelz, K. Ooms, D. Pant and M. Wichern, Bioresour. Technol., 2019, 294, 122227 CrossRef CAS.
- R. Rossi, P. J. Evans and B. E. Logan, J. Power Sources, 2019, 412, 294–300 CrossRef CAS.
- R. Rossi, D. Jones, J. Myung, E. Zikmund, W. Yang, Y. A. Gallego, D. Pant, P. J. Evans, M. A. Page, D. M. Cropek and B. E. Logan, Water Res., 2019, 148, 51–59 CrossRef CAS PubMed.
- Z. Ge, L. Wu, F. Zhang and Z. He, J. Power Sources, 2015, 297, 260–264 CrossRef CAS.
- Z. Ge and Z. He, Environ. Sci.: Water Res. Technol., 2016, 2, 274 RSC.
- B. E. L. Ruggero Rossi, A. Hur, M. A. Page, A. O'Brien Thomas, J. J. Butkiewicz, D. W. Jones, G. Baek, P. E. Saikaly and D. M. Cropek, Water Res., 2022, 215, 118208 CrossRef PubMed.
- W. He, Y. Dong, C. Li, X. Han, G. Liu, J. Liu and Y. Feng, Water Res., 2019, 372–380 CrossRef CAS PubMed.
- T. Yamane, N. Yoshida and M. Sugioka, RSC Adv., 2021, 11, 20036–20045 RSC.
- L. Ren, Y. Ahn and B. E. Logan, Environ. Sci. Technol., 2014, 48, 4199–4206 CrossRef CAS PubMed.
- J. Niu, Y. Feng, N. Wang, S. Liu, Y. Liang, J. Liu and W. He, Sci. Total Environ., 2021, 755, 142641 CrossRef CAS.
- I. Zekker, G. D. Bhowmick, H. Priks, D. Nath, E. Rikmann, M. Jaagura, T. Tenno, K. Tämm and M. M. Ghangrekar, Biodegradation, 2020, 31, 249–264 CrossRef CAS.
- B. Virdis, K. Rabaey, Z. Yuan and J. Keller, Water Res., 2008, 42, 3013–3024 CrossRef CAS.
- Y. Park, S. Park, V. K. Nguyen, J. Yu, C. I. Torres, B. E. Rittmann and T. Lee, Chem. Eng. J., 2017, 316, 673–679 CrossRef CAS.
- N. J. Koffi and S. Okabe, Chemosphere, 2021, 274, 129715 CrossRef CAS.
- M. Sugioka, N. Yoshida and K. Iida, Front. Energy Res., 2019, 7, 19 CrossRef.
- R. Rossi, X. Wang and B. E. Logan, J. Power Sources, 2020, 475, 228633 CrossRef CAS.
- R. Rossi, G. Baek, P. E. Saikaly and B. E. Logan, ACS Sustainable Chem. Eng., 2021, 9, 2946–2954 CrossRef CAS.
- R. Rossi and B. E. Logan, Chem. Eng. J., 2021, 422, 130150 CrossRef CAS.
- S. E. Oh, J. R. Kim, J. H. Joo and B. E. Logan, Water Sci. Technol., 2009, 60, 1311–1317 CrossRef CAS PubMed.
- H. Liu and B. Logan, ACS Natl. Meet. B. Abstr., 2004, vol. 228, pp. 4040–4046 Search PubMed.
- R. K. Jung, S. Cheng, S. E. Oh and B. E. Logan, Environ. Sci. Technol., 2007, 41, 1004–1009 CrossRef.
- H. Wu, J. Fan, J. Zhang, H. H. Ngo, W. Guo, Z. Hu and J. Lv, Int. Biodeterior. Biodegrad., 2016, 113, 139–145 CrossRef CAS.
- J. H. Kim, X. Guo and H. S. Park, Process Biochem., 2008, 43, 154–160 CrossRef CAS.
- K. Hanaki, C. Wantawin and S. Ohgaki, Water Res., 1990, 24, 297–302 CrossRef CAS.
- K. Mizuta and M. Shimada, Water Sci. Technol., 2010, 62, 2256–2262 CrossRef CAS.
- W. Dai, X. Xu, B. Liu and F. Yang, Chem. Eng. J., 2015, 279, 725–734 CrossRef CAS.
- W. Nagahashi and N. Yoshida, J. Gen. Appl. Microbiol., 2021, 67, 248–255 CrossRef CAS PubMed.
Footnotes |
| † Electronic supplementary information (ESI) available. See https://doi.org/10.1039/d2ra01485h |
| ‡ These authors contributed equally to this work. |
| This journal is © The Royal Society of Chemistry 2022 |

