 Open Access Article
Utilization of mesoporous phosphotungstic acid in nanocellulose membranes for direct methanol fuel cells
Arif Priyanggaa,
Lukman Atmaja *a,
Mardi Santosoa,
Juhana Jaafarb and
Hamid Ilbeygi*c
aDepartment of Chemistry, Institut Teknologi Sepuluh Nopember, ITS Sukolilo, Surabaya 60111, Indonesia. E-mail: lukman_at@chem.its.ac.id
bAdvanced Membrane Technology (AMTEC) Research Centre, Universiti Teknologi Malaysia, 81310 UTM Johor Bahru, Johor, Malaysia
cARC Research Hub for Integrated Devices for End-User Analysis at Low Levels (IDEAL), Future Industries Institute, University of South Australia, Mawson Lakes, SA 5095, Australia. E-mail: Hamid.Ilbeygi@unisa.edu.au
First published on 12th May 2022
Abstract
Nanocellulose (NC) composite membranes containing novel ternary materials including NC, imidazole (Im), and mesoporous phosphotungstic acid (m-PTA) were successfully fabricated by a phase inversion method. The single-particle size of NC was 88.79 nm with a spherical form. A m-PTA filler with a mesopore size of 4.89 nm was also successfully synthesized by a self-assembly method. Moreover, the fabricated membrane NC/Im/m-PTA-5 exhibited the best performances towards its proton conductivity and methanol permeability at 31.88 mS cm−1 and 1.74 × 10⁻⁶ cm2 s−1, respectively. The membrane selectivity was 1.83 × 10⁴ S cm−3.
Introduction
Fuel cells have attracted the attention of many scientists for decades to be an alternative to generate cleaner and more efficient electricity.1 In general, the fundamental work of the fuel cell is to convert chemical energy into electricity via a redox reaction. Direct methanol fuel cells (DMFCs) are one of the various types of fuel cells using diluted methanol as the fuel.2 The uniqueness of DMFC is advantageous for its further development such as easy operation, generation of high power density, and modification to portable devices.3 The most important component in the DMFC is the proton exchange membrane (PEM) as well as the cathode and anode. The PEM plays a significant role in DMFC as proton transfer media. Nafion is the preferable PEM for fuel cells in recent years due to its high performance. However, the conductivity and its methanol permeability diminish during the long-term operation, which affects its selectivity and other performances.4–6Biopolymers are considered promising materials to develop a thin film or membrane. Various types of biopolymers such as chitosan, pectin, carrageenan, and cellulose could be used as thin films. The common characteristics of the biopolymers are good film-formation, biodegradability, non-toxicity, hydrophilic features, and low cost.7–10 Cellulose is the most abundant polysaccharide in nature that is formed from the β-1,4-glucosidase structure. Based on its structure, cellulose is classified into microcrystalline cellulose (MCC), cellulose microfiber (CMF), cellulose nanofiber (CNF), and nanocellulose (NC).11 The main function of nanomaterials in the fuel cell is used to reduce the methanol permeability.12 NC is classified as a nanomaterial derived from cellulose with a particle size of 1–100 nm. The nanoparticle of NC is used to retain the methanol crossover of the membrane and lower the permeability.13 According to our previous study, the NC membrane possessed a proton conductivity of 5.32 mS cm−1 and a selectivity of 0.56 × 10⁴ S cm−3, which is higher than that of the pristine cellulose.14 In addition, CNF blended into sulfonated polyethersulfone (SPES) can decrease the methanol permeability of the membrane to 4.45 × 10⁻⁷ cm2 s−1. The small particle from NC also supports the membrane to form a homogenous surface structure.12,15
Inorganic materials are mostly used as fillers for biopolymer matrixes to reinforce them. Heteropoly acid (HPA) is categorized as an inorganic material and polyoxometalate. Among many kinds of HPA, phosphotungstic acid (PTA) has good stability and high acidity.16 The high oxidation level of tungsten and reduction of W6+ to W3+ can generate a high power density that is very useful for fuel cell application.16 PTA is categorized as a strong Brønsted acid that acts as a proton donor. However, due to its high hydrophilicity and low surface area, it can dissolve into the solvent easily.17 To alleviate this weakness of PTA, many methods including the modification to the mesoporous form of PTA were applied. According to Ilbeygi et al. (2019), m-PTA was applied to lithium batteries, which has a high surface area of 93 m2 g−1 with a pore size of 4 nm. It also renders high performance for the battery until 100 cycles with a capacity of 872 mA h g−1, which shows great potential for fuel cell applications.17 Furthermore, the addition of m-PTA fillers into the chitosan matrix also improved the membrane performance including the improvement of its power density to 83 mW cm−2 and significantly low methanol permeability at 2 × 10⁻⁸ cm2 s−1.16 These improvements can be promising for the application of the m-PTA filler as a PEM-based biopolymer.
Heterocyclic organic materials are suitable for conducting protons in the membrane structure since they possess lone-pair electrons that provide the proton pathways. Imidazole plays a significant role in maintaining the proton transfer issue.11,18 Some research studies revealed an improvement in the membrane function upon addition of imidazole. The improvement achieved a power density of 124 mW cm−2 with a current density of 347 mA cm−2 for the Nafion/polybenzimidazole-functionalized imidazole membrane.19 Furthermore, the modified filler based on silica-imidazole improved its proton conductivity at 45 mS cm−1 as compared to the silica-phosphate acid filler at 3.5 mS cm−1, which was applied to the same polybenzimidazole membrane.20 A recent study has fabricated NC membrane-modified imidazole that significantly improved the proton conductivity to 400 mS cm−1 at 150 °C.18
Based on the brief review, the objective of this study is to develop a novel composite membrane consisting of ternary materials including NC, imidazole, and m-PTA to achieve a low methanol permeability and a high value in proton conductivity and selectivity for DMFC application. The physicochemical properties of the membranes are also carried out including the mechanical strength, water and methanol uptake, ion exchange capacity (IEC), and swelling ratio. The morphology and chemical interactions in the membrane are covered in this research.
Experimental
Materials
Microcrystalline cellulose (MCC) powder, sodium hydroxide (NaOH) pellets, phosphotungstic acid (H3PW12O40), imidazole (C3H4N2), urea (CH4N2O), ethanol (C2H5OH), methanol (CH3OH), KCl, mesitylene (C9H12), copolymer block Pluronic F127, and sulfuric acid (H2SO4) were all acquired from Merck.Synthesis of nanocellulose
Nanocellulose (NC) was achieved by the regenerated method, as described in our previous research.14 Initially, 5 g of MCC was mixed into a 100 mL solution of 7 wt% (w/w) NaOH and 12 wt% (w/w) CH4N2O. The solution was stirred at room temperature for 30 min and then stored in a freezer for 16 h. The product was stirred at 1000 rpm for 10 min and poured into 1000 mL distilled water. Furthermore, the suspension was centrifuged at 3000 rpm for 30 min. The regenerated cellulose was then neutralized with distilled water until the pH reached 7 to remove the excess amount of NaOH and CH4N2O. The neutralized cellulose was further dispersed into distilled water and sonicated for 15 min. The resulting suspension was stored in a fridge until further use.Synthesis of mesoporous phosphotungstic acid
Mesoporous phosphotungstic acid (m-PTA) was synthesized by a self-assembly method. The materials containing copolymer block F127 (2 g), mesitylene (2 g), KCl (3 g), and PTA (2.5 g) were added into 120 mL distilled water and then stirred at room temperature for 4 h. Subsequently, the suspension was heated at 35 °C for 24 h followed by a hydrothermal reaction at 100 °C for 72 h. The mixture was filtered and dried at 70 °C. The dried product was then washed with ethanol repeatedly. The product was treated via 2 steps of calcination. The first step of calcination was conducted using a N2 gas until the temperature reached 250 °C at a heating rate of 2 °C min−1. In addition, it was calcined with airflow at 350 °C for 24 h.17 The dried powder was denoted as m-PTA.Fabrication of composite membranes
Various membranes of NC, NC/m-PTA, NC/Im, and NC/Im/m-PTA were fabricated by a phase-inversion method, as described elsewhere.16,21 First, 25 g suspension of NC was added into an 80 mL solution containing 7 wt% (w/w) NaOH and 12 wt% (w/w) CH4N2O and stirred until a homogeneous solution was obtained. In another glass, m-PTA was dispersed into 10 mL distilled water and sonicated for 2 h. The suspension of m-PTA was added dropwise into the NC dope solution and stirred for 4 h. After the addition of m-PTA, imidazole was poured into a dope solution and sonicated for further 2 h. The dope solution was stored in a freezer at −20 °C for 24 h. Furthermore, the dope solution was stirred again and sonicated to remove the bubble gas. The dope solution was cast onto the glass plate with 0.5 mm thickness and immersed in a 5 wt% H2SO4 coagulation bath for 10 min. In addition, the membrane was immersed in distilled water to remove the remnant of H2SO4 and dried at room temperature. The various compositions of membranes are presented in Table 1.| Membrane | NC (g) | m-PTA (g) | Im (g) |
|---|---|---|---|
| NC | 25 | — | — |
| NC/m-PTA | 25 | 0.20 | — |
| NC/Im | 25 | — | 0.75 |
| NC/Im/m-PTA-1 | 25 | 0.04 | 0.75 |
| NC/Im/m-PTA-3 | 25 | 0.12 | 0.75 |
| NC/Im/m-PTA-5 | 25 | 0.20 | 0.75 |
Characterizations and testing
In this research, the functional groups of each material were investigated by Fourier transform infrared (FTIR) spectroscopy (8400S Shimadzu). The sample was initially ground and a KBr powder was added to the ground sample with a sample-to-KBr ratio of 1![[thin space (1/6-em)]](https://www.rsc.org/images/entities/char_2009.gif) :
:![[thin space (1/6-em)]](https://www.rsc.org/images/entities/char_2009.gif) 10. Then, it was pressed until forming a thin pellet. The pellet was put on the sample holder and investigated at a wavenumber of 400–4000 cm−1.
10. Then, it was pressed until forming a thin pellet. The pellet was put on the sample holder and investigated at a wavenumber of 400–4000 cm−1.
An X-ray diffractometer (XRD, Philips Xpert MPD) was utilized to examine the crystal structure of the membranes, NC, and, m-PTA. The sample was put on the pin stub holder and analyzed at 40 kV and 30 mA. The sample was scanned from 5° to 50° at a scan step of 0.017°. The radiation source was a copper target (Cu Kα, λ = 1.54056 Å).
The morphological structures of the membranes and NC samples were analyzed by scanning electron microscopy (SEM-EDX, Zeiss EVO MA) and transmission electron microscopy (TEM, HT 7700), respectively. The SEM analysis was conducted at an accelerating voltage of 10 kV and the magnifications were 500–1000×. Furthermore, the TEM analysis was particularly conducted on the NC sample to observe the specific size of the NC particle. It was examined at an accelerating voltage of 100 kV and the magnifications were 30![[thin space (1/6-em)]](https://www.rsc.org/images/entities/char_2009.gif) 000× and 50
000× and 50![[thin space (1/6-em)]](https://www.rsc.org/images/entities/char_2009.gif) 000×. The NC suspension was dropped onto the TEM sample grid. The grid was dried at 80 °C before analysis. The distribution size of NC was further measured using a particle size analyzer (PSA, Malvern instrument). The suspension of NC was put into the glass cuvette and evaluated at room temperature for 1 min for each analysis. The sample was evaluated in triplicate at a count rate of 46.7 kcps.
000×. The NC suspension was dropped onto the TEM sample grid. The grid was dried at 80 °C before analysis. The distribution size of NC was further measured using a particle size analyzer (PSA, Malvern instrument). The suspension of NC was put into the glass cuvette and evaluated at room temperature for 1 min for each analysis. The sample was evaluated in triplicate at a count rate of 46.7 kcps.
The pore size of m-PTA was evaluated by the N2 adsorption–desorption method. Before the analysis, m-PTA was degassed at 300 °C for 3 h to remove the absorbed gas by m-PTA. The measurement was conducted at 77 K under vacuum conditions and the data were collected using a Quantachrome Nova Instrument.
The proton conductivity of membranes was examined using an Autolab PGSTAT204 system at room temperature and 100% relative humidity. The membranes were initially immersed in distilled water for 24 h. Moreover, the membranes were gently placed between the two electrodes of the cell, which have a through-plane contact and are attached in a Teflon block. AC impedance spectra of the membranes were recorded in the frequency range of 0.1 Hz to 1 MHz at an oscillating voltage of 10–100 mV. The measurement of conductivity must follow eqn (1):
 | (1) |
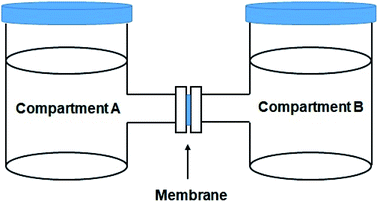
The methanol crossover of membranes was also determined using two compartments (A and B) that each compartment contained 100 mL distilled water and 100 mL 2 M methanol solution. The membrane was placed between the two compartments. Additionally, each compartment was stirred at a continuous speed for 6 h. The 10 mL solution in compartment A was gained every 30 min and laid into the pycnometer. Then, it was weighed. The same procedure was repeatedly conducted on the other membrane. The permeability was calculated using eqn (2):
 | (2) |
The sorption properties and swelling ratio of membranes were investigated by measuring the weight and length of the membranes before and after hydration. Initially, the membrane was dried at 60 °C for 24 h and its weights and lengths were then measured, which was denoted as the dried membrane. Moreover, it was soaked in distilled water for 24 h. The membrane was gently dry blotted with tissue paper. The weights and lengths were measured again, and the membrane was denoted as the wet membrane. The methanol uptake was conducted according to the above-mentioned procedure, except that water was substituted with methanol. The calculation of methanol and water uptake is given as eqn (3):
 | (3) |
 | (4) |
The ion exchange capacity (IEC) was measured by the titration method. The membrane was dried at 60 °C for 24 h to remove the excess amount of water. It was weighed and denoted as the dried membrane. Furthermore, the membrane was immersed in 1 M NaCl solution for 24 h to exchange the H+ ions with Na+ ions. The solution was titrated using a 0.01 M NaOH solution with the addition of phenolphthalein as an indicator. The IEC was calculated using eqn (5):
 | (5) |
A universal testing machine (UTM, AG-1 Shimadzu) was operated to measure the mechanical properties of the membrane. The membranes were set in the sample gauze of machine with the operation head load at 10 kN and the cross-head speed at 2 mm min−1. The measurement was conducted at room temperature.
Results and discussion
Physicochemical characteristics of nanocellulose
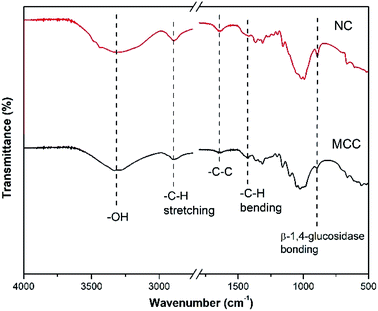
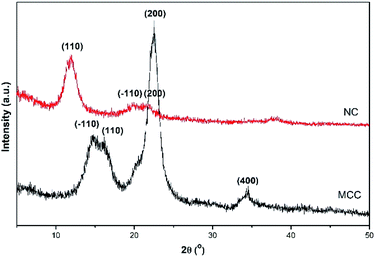
The existence of signature bonding and functional group of nanocellulose (NC) and microcrystalline cellulose (MCC) is confirmed by the FTIR spectra shown in Fig. 2. The FTIR spectra of nanocellulose (NC) showed the decrease in the main intensity at wavenumber 1050–1100 cm−1, indicating the reduction of the NC crystallinity. This phenomenon can be contributed using the NaOH/(NH2)2CO mixture during the regeneration process that can break the hydrogen bonding of polysaccharides at low temperatures.22 Another peak appeared at a wavenumber of 1429 cm−1 denoted as the bending vibration of the alkyl group in cellulose. It also indicated that the main chain of NC was not ruptured in the strong base solution during the synthesis process.23 Furthermore, the stretching vibration of hydroxyl and alkyl groups was revealed at wavenumbers 3500 and 2893 cm−1, respectively.23 The stretching vibration of the C–C group and β-1,4-glucosidase bonding was also detected at 1636 and 895 cm−1, respectively. Moreover, the band of 895 cm−1 also contributed to the amorphous region of cellulose.23The diffractogram of MCC showed some peaks and planes at 2θ = 14.5° (−110), 16.3° (110), 22.7° (200), and 34.6° (400). Meanwhile, the NC showed a transformation of its crystal structure at 2θ = 12° (110), 20.2° (−110), and 22.5° (200) (PDF ID no. 00-050-2241). According to our previous study, the transformation occurred due to the NaOH/(NH2)2CO inclusion complex. The solution can also disrupt the crystallinity zone of MCC and lower the crystallinity of NC.14 A low crystallinity level of NC leads to an improvement in the compatibility and easiness to combine with the other materials.18 The XRD patterns of NC and MCC are shown in Fig. 3.
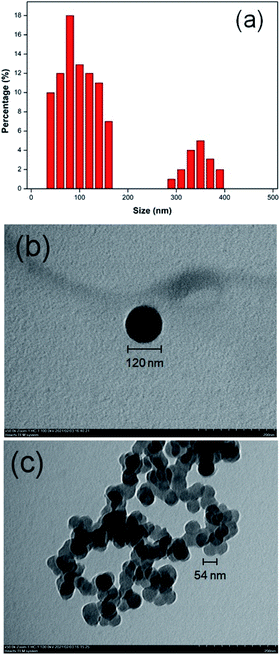
The particle size of NC was investigated using PSA and TEM. Based on our previous study, the PSA analysis showed the two major distributions at 88.79 nm and 356.40 nm.14 The first dominated peak showed that the most distributed particle has a percentage of particle distribution of 82.9% and the minor distribution is 17.1%, respectively. The minor distribution appeared due to the hydrophilic features of the NC and it can swell easily in water as a dispersed medium.24 In addition, the two peaks were still in the nanometer range. The size and morphology of NC nanoparticles were also investigated by TEM. The morphology of the NC nanoparticle revealed a spherical structure at 100–200 nm, which is in agreement with the PSA analysis. The spherical structure was created during the self-assembly process of urea and NaOH/cellulose that formed the stabilized complex inclusion.25 The complex inclusion in cellulose can also stimulate the breaking of intermolecular hydrogen bonds and it assisted in the formation of spherical structures in NC nanoparticles.22,25 According to Shankar et al. (2016), the size of NC nanoparticles is 100–500 nm with sphere-shaped by the regenerated method.23 The size distribution and morphology of the NC nanoparticle are shown in Fig. 4.
Characterizations of m-PTA
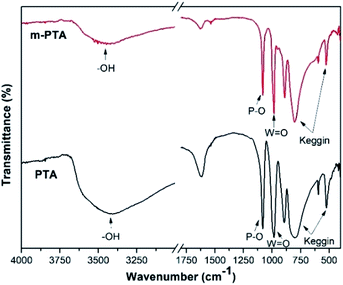
The FTIR spectra of m-PTA showed the characteristic bands of phosphotungstic acid such as 1080 cm−1 (stretching vibration of P–O group), 981 cm−1 (W![[double bond, length as m-dash]](https://www.rsc.org/images/entities/char_e001.gif) O group), and 887 cm−1 (W–O–W group), and 757 cm−1 and 526 cm−1 (bending vibration of the Keggin structure). These bands are quite similar to those of pristine PTA, which indicated that the hydrothermal process does not damage the main structure of PTA.17 Furthermore, some bands of m-PTA possess narrower and sharper bands than those of pristine PTA as a result of the ion exchange process from H3PW12O40 to K3PW12O40.16,17 The typical band of the hydroxyl group appeared at a wavenumber of 3400 cm−1, which demonstrated that the water crystal is present inside the crystal structure of both PTA and m-PTA.17 The FTIR spectra of m-PTA are shown in Fig. 5.
O group), and 887 cm−1 (W–O–W group), and 757 cm−1 and 526 cm−1 (bending vibration of the Keggin structure). These bands are quite similar to those of pristine PTA, which indicated that the hydrothermal process does not damage the main structure of PTA.17 Furthermore, some bands of m-PTA possess narrower and sharper bands than those of pristine PTA as a result of the ion exchange process from H3PW12O40 to K3PW12O40.16,17 The typical band of the hydroxyl group appeared at a wavenumber of 3400 cm−1, which demonstrated that the water crystal is present inside the crystal structure of both PTA and m-PTA.17 The FTIR spectra of m-PTA are shown in Fig. 5.
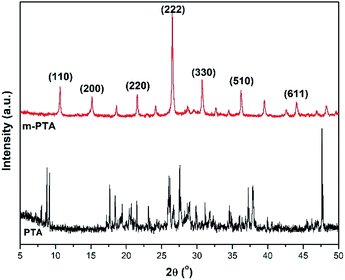
The XRD patterns of pristine PTA and m-PTA are significantly different, which showed the crystal plane transformation of the PTA structure. The main peak of m-PTA is 2θ = 27° denoted as the (222) plane. The peak is attributed to the characteristic of the m-PTA crystal, which is not identified in the pristine PTA pattern.26 The other peaks were also detected, such as the planes of (110), (200), (220), (330), and (510) (PDF ID no. 00-050-0657). Furthermore, the sharp peaks belonging to m-PTA revealed an arranged structure due to the hydrothermal process and self-assembly of the molecules during the synthesis.17 The XRD pattern of m-PTA is shown in Fig. 6.
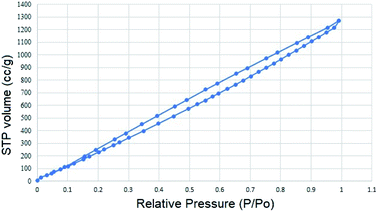
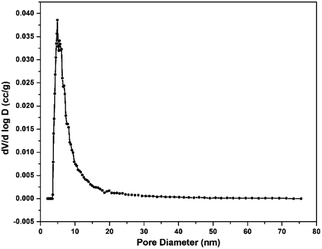
The pore size and surface area of m-PTA were investigated by the adsorption–desorption isotherm method. The isotherm curve exhibited the type-4 isotherm that emerged due to the self-assembly and co-condensation during the hydrothermal process.17 Moreover, the hysteresis loop of the curve was formed due to the different amounts of the N2 gas absorbed and desorbed at the constant pressure.17 The type-4 isotherm curve showed the mesoporous behavior of the PTA. The surface area of m-PTA was achieved at 1892.403 m2 g−1 with a pore diameter of 4.89 nm classified as a mesoporous material. Furthermore, the pore volume was identified at 1.786 g−3. The large surface area of m-PTA occurred due to the diminishing blockage in the pore by the tungsten molecules or the oxide form (WO3).17 According to the previous study,17 the obtained surface area of the m-PTA is larger than that of pristine PTA with a surface area of 3 m2 g−1. The isotherm curve and pore size distribution of m-PTA are shown in Fig. 7 and 8, respectively.
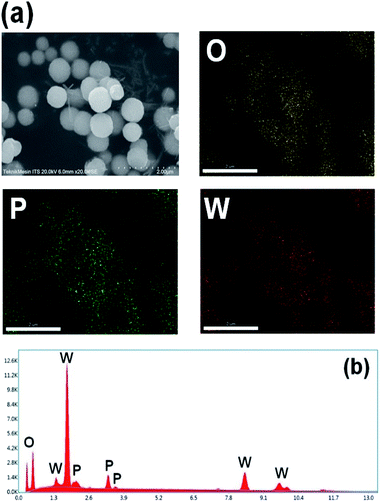
The morphological structure of m-PTA exhibited a spherical structure with the main compounds of PTA such as oxygen, phosphorus, and tungsten. In this research, the structure has been created due to the Pluronic F127 that is used as a copolymer block template for PTA.16 The elements contained in m-PTA were confirmed by EDX spectra. The EDX spectra also revealed the main elements of m-PTA still detected as well as the carbon element successfully removed during calcination at a high temperature of 300 °C under the flow of N2 inert gas.26 The carbon element could have originated from the Pluronic F127 template. The template removal was conducted to avoid the alteration of the PTA chemical properties and leaching easily into the solvent.27,28 The SEM-EDX pattern of the m-PTA filler is shown in Fig. 9.
Characterizations of the composite membranes
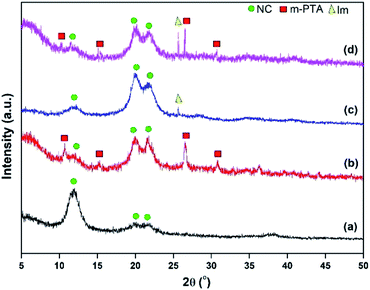
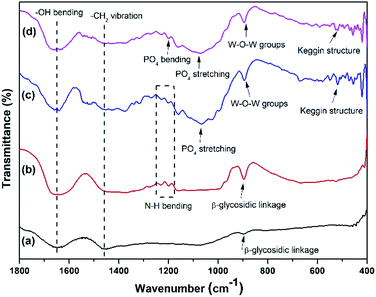
The XRD pattern of the membranes showed some new patterns in the NC membrane including the incorporation of imidazole and m-PTA filler. The NC/m-PTA and NC/Im/m-PTA membranes showed the m-PTA crystal structure that was identified at 2θ = 10° (110), 15° (200), 26.5° (222), and 31° (442).16 The imidazole crystal plane was also observed at 2θ = 25.6°. Furthermore, the crystal planes of the NC matrix were observed at 2θ = 12°, 20.2°, and 22.3°. One peak at 2θ = 12° and two peaks at 2θ = 20.2° and 22.3° described the typical structure of the cellulose nanoparticle as a result of the complex inclusion among NaOH, urea, and cellulose.25,29,30 Those peaks revealed that there is an interaction between the matrix and the filler in the membrane structure.2,31,32 The diffractogram of the membranes is shown in Fig. 10.FTIR analysis was conducted to investigate the functional groups in the membrane. The pristine NC possessed –OH bending and –CH2 vibration at 1641 and 1512 cm−1, respectively. The –OH bending band could be attributed to the absorbed water molecules by the membrane. Moreover, the –CH2 vibration indicated the crystalline region of cellulose.10 The β-glycosidic linkage was discovered at 896 cm−1, which is associated with the amorphous region of cellulose.10 Those bands were also detected in the NC/Im, NC/m-PTA, and NC/Im/m-PTA membranes, which indicated the crystalline region of cellulose.10 Furthermore, the new double peaks of imidazole detected at wavenumber 1271 cm−1 indicated the N–H bending group of imidazole detected in the NC/Im/m-PTA membrane.18 The chemical interactions of m-PTA in the membrane were presented in some bands including the nature of the Keggin structure, W–O–W group, PO4 stretching, and bending groups that were revealed at 518, 895, 1067, and 1271 cm−1, respectively.16 The FTIR spectra of the NC/Im/m-PTA membrane exhibited all bands of cellulose, imidazole, and m-PTA. The FTIR spectra of the membranes are shown in Fig. 11.
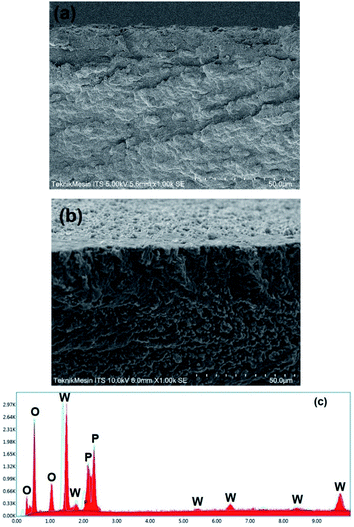
The morphological structure of the membranes was investigated through the cross-section images and compared between the pristine NC membrane and the NC/Im/m-PTA composite membrane. The NC membrane showed a dense structure without void and aggregation due to the nanometer-sized particles of NC that exhibited well-dispersed particles in the NaOH/urea solution.13 The structure emerged due to the characteristic of the natural polymer and also the inversion method that was applied to fabricate the membrane.33,34 The NC membrane was also revealed the sheet-like structure that achieved from the characteristic of the lignocellulose.24,35 In addition, the NC/Im/m-PTA composite membrane is quite different from the NC membrane. The presence of the granular structures exhibits the inclusion complex among the matrix and m-PTA filler. The inclusion complex plays a role in avoiding the agglomeration in the membrane structure and improves the possibility to create a chemical interaction among PTA, imidazole, and NC.22 The chemical function between m-PTA and imidazole will easily make the exchange of protons in the membrane. The proton transfer travelled through some chemical bonds between m-PTA and imidazole including the hydrogen bond, the –OH groups, and the possible remaining water molecules.18 Furthermore, the usage of the mesopore filler is used to manage the leaching process of the PTA into the polar solvent and optimized its features for the conductivity.36 According to the EDX spectra, it was observed that the NC/Im/m-PTA membrane possessed the composition of the m-PTA filler and the main elements such as O, P, and W were still discovered. It is in an agreement with the XRD analysis, which showed that the m-PTA filler was incorporated into the membrane structure. The SEM-EDX analysis is shown in Fig. 12.
Performances of NC/Im/m-PTA membranes
The performance of the prepared membranes was expressed in terms of proton conductivity, methanol permeability, and their ratio. The permeability of the membranes was investigated to measure the amount of methanol crossover through the membrane. It revealed that the permeability tends to decrease upon the addition of imidazole and the m-PTA filler. The pristine NC membrane was used as the control and obtained the permeability at 7.48 × 10⁻⁶ cm2 s−1. The particle size distribution of NC at nanometer size provided the membrane with narrow channels that created a methanol barrier sheet inside the membrane and reduced its methanol crossover.16 Otherwise, the addition of two fillers revealed a significant dropping in the methanol permeability. The permeability of NC/Im/m-PTA-5 is 1.74 × 10⁻⁶ cm2 s−1. According to the observation, the methanol permeability decreased along with the addition of both imidazole and m-PTA, and it was well understood that a lower methanol permeability is favorable for the PEMFC.2,37 It is affected by the longer diffusion system and cross-linked structure of the membrane since the PEMFC applied the diffusion method.2,31,38 Furthermore, the mesoporous nature of the filler also assists the increment of water sorption, which gives more hydrophilic features to the membranes. This suggests that the membranes tend to take more water molecules, thereby suppressing methanol permeability through the membranes.16 In comparison, the commercial PEM like Nafion possesses its permeability at 5.65 × 10⁻⁵ cm2 s−1.39 The methanol permeability of the tested membranes is shown in Table 2.| Membrane | Proton conductivity (mS cm−1) | Methanol permeability (×10−6 cm2 s−1) | Selectivity (S cm−3) |
|---|---|---|---|
| NC | 1.88 ± 0.10 | 7.75 ± 1.28 | 2.51 ± 0.03 × 10² |
| NC/m-PTA | 7.29 ± 0.29 | 6.28 ± 2.13 | 1.66 ± 0.79 × 10³ |
| NC/Im | 3.37 ± 1.86 | 6.76 ± 2.17 | 4.99 ± 0.26 × 10² |
| NC/Im/m-PTA-1 | 19.09 ± 0.16 | 4.85 ± 1.96 | 3.94 ± 1.05 × 10³ |
| NC/Im/m-PTA-3 | 20.91 ± 0.66 | 4.13 ± 1.26 | 5.06 ± 1.20 × 10³ |
| NC/Im/m-PTA-5 | 31.88 ± 0.31 | 1.74 ± 1.48 | 1.83 ± 0.62 × 10⁴ |
In this research, the highest proton conductivity was achieved by the NC/Im/m-PTA-5 membrane. Its conductivity is 31.88 mS cm−1. The conductivity tends to increase as the addition of filler increases. The enhancement to its conductivity indicated its proton transfer in the membrane.20 According to the previous study, the interaction between cellulose and the heterocyclic molecule like imidazole can provide a new pathway for the proton transfer and could perform as a donor or acceptor proton.11,18 In addition, m-PTA also gives the extra conduction site to the membrane structure that is useful for the proton transfer.17 The high surface area of m-PTA plays an important role to increase the charge per unit area, which facilitates the proton transfer of the membranes.16 The Nafion 117 membrane has its proton conductivity at 31.60 mS cm−1 under the same condition.2 The proton conductivity of the membranes is shown in Table 2.
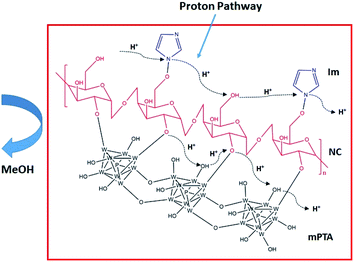
The selectivity was measured through the ratio between the conductivity and methanol permeability, as shown in Table 2. The high selectivity is deliberated for PEMFC. The high conductivity and low permeability generate the high selectivity for the membrane.40,41 Furthermore, the highest selectivity was also achieved by the NC/Im/m-PTA-5 composite membrane at 1.83 × 10⁴ S cm−3 as a result of low methanol crossover and high proton conductivity as well. It proved that there is a synergy between the matrix and the filler. At the same time, the composite membrane provides the new conduction site for protons and the long diffusion methanol permeation.5,39,42 The selectivity of the Nafion membrane under the same condition is 1.26 × 10⁴ S cm−3.2 In addition, the illustration of the possible membrane mechanism and its chemical interaction is shown in Fig. 13. The mechanism showed the pathways of the proton and methanol crossover in the membrane, which indicated that the NC/Im/m-PTA membrane possessed low methanol crossover and high proton transfer. According to the result, the combination of low methanol permeability and high proton conductivity leads to the high selectivity of the membrane, as shown in the illustration.
Physicochemical properties of NC/Im/m-PTA membranes
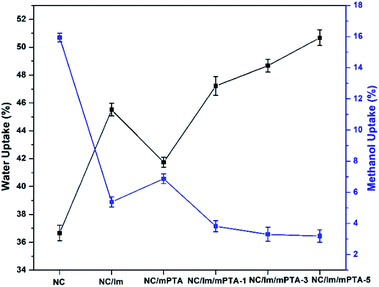
The water uptake of the membranes can reveal the mechanism of the proton transfer in the membrane. The higher water uptake shows a tendency to the diffusion mechanism in the membrane that aids the proton transfer via proton hopping.43 In this research, the highest water uptake was obtained by the NC/Im/m-PTA-5 composite membrane at 50.68%; meanwhile, the NC membrane showed 36.66%. The main factor is the involvement of the hydrophilic composite including imidazole and the m-PTA filler. These materials significantly absorb the water molecules into the membranes.11 The trends also showed that the water uptake improved along with the addition of the filler. Due to the high surface area of the m-PTA, it is also possible to increase the water sorption and homogeneous distribution in the membrane framework contributes to the higher sorption area of the membranes.16 The water uptake of the membranes is shown in Fig. 13.Furthermore, the methanol uptake of the membranes reflects and confirms the methanol permeability of the membranes.4 The low methanol uptake is also favorable to the PEM to lower the methanol loss of the membrane.2 The chemical interaction between the matrix and the filler can form a strong and dense structure in the membrane that decreased the methanol crossover through the membrane.4 Since m-PTA increases the water sorption characteristic of the membranes, it is well known to prioritize the water sorption over the methanol uptake of the membranes.16 The NC/Im/m-PTA-5 composite membrane achieved the lowest methanol uptake at 3.19% in comparison to the pristine NC membrane at 15.94%. The trends belonging to the methanol uptake are also in agreement with the methanol permeability value. The methanol uptake is shown in Fig. 14.
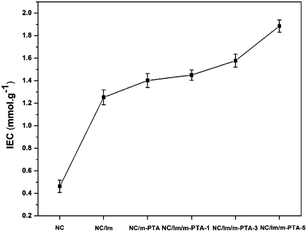
The ion exchange capacity (IEC) of the membranes showed an increasing trend along with the addition of imidazole and the m-PTA filler. The highest IEC was achieved by the NC/Im/m-PTA-5 membrane at 1.885 mmol g−1 compared to the commercial Nafion 117 under the same condition at 0.860 mmol g−1.10 In addition, its IEC was also improved than the unmodified NC membrane. It obtained the IEC at 0.463 mmol g−1 at room temperature. The other membranes showed a good IEC including the NC/Im, NC/Im/m-PTA-1, and NC/Im/m-PTA-5 membranes. It possessed the IEC at 1.253, 1.450, and 1.578 mmol g−1, respectively. It also revealed that the addition of imidazole and the m-PTA filler significantly improved the IEC. These trends denote that the enrichment of the hydrophilic groups obtained from imidazole and m-PTA increases the IEC value.7 As a result of the increasing charge per unit due to the m-PTA surface area, it also affects the rising of ion exchange capability.16 The higher IEC is favorable to apply for the fuel cell application.2 The IEC of the membranes is shown in Fig. 15.
The tensile strength of the membranes is shown in Table 3, which presented an improvement in the mechanical properties along with the addition of m-PTA and imidazole. It can be concluded that the addition of the m-PTA filler until 0.12 g can enhance the tensile strength of the pristine NC itself. The highest tensile strength was obtained by the NC/Im/m-PTA-3 membrane at 27.8 ± 1.43 MPa, which showed good mechanical stability of the membrane. The excellent interaction between the polymer and the filler influences this improvement.13,16 Furthermore, the interaction of –OH groups of NC and m-PTA as well as the NC and imidazole via –NO interaction could reinforce the interface of the membrane that is useful for the advanced tension transfer.13 However, the further addition of fillers showed the decline of its tensile strength. The declining dimensional stability of the membrane leads to the weakening of the interaction and hindering effect.13 The elongation of the membrane also showed a decrease in its value when excessive amounts of m-PTA were applied. The elongation at break of the membranes showed an increment upon addition of the Im/m-PTA filler; however, the composition of the Im/m-PTA-5 filler indicated the lowest elongation at break. It can be ascribed to the reduced chain interchange of the membrane due to the presence of excessive fillers and matrix-filler linkage that diminishes the membrane flexibility.37 It also showed that the proper composition of m-PTA and imidazole assisted in the longer elongation of the membrane. The elongation at break of the membranes is shown in Table 3.
| Membrane | Tensile strength (MPa) | Elongation at break (%) | Swelling ratio (%) |
|---|---|---|---|
| NC | 19.3 ± 0.89 | 35.6 ± 1.88 | 30.2 ± 0.22 |
| NC/m-PTA | 24.1 ± 0.31 | 39.1 ± 0.56 | 35.9 ± 2.13 |
| NC/Im | 20.7 ± 0.67 | 38.9 ± 2.33 | 38.3 ± 1.09 |
| NC/Im/m-PTA-1 | 25.2 ± 1.15 | 42.5 ± 1.97 | 42.6 ± 0.37 |
| NC/Im/m-PTA-3 | 27.8 ± 1.43 | 48.3 ± 0.69 | 43.1 ± 0.11 |
| NC/Im/m-PTA-5 | 22.4 ± 0.42 | 37.4 ± 0.44 | 60.3 ± 1.17 |
The swelling ratio of the membranes is also associated with the membrane's ability to retain the water molecules that play a role in the proton transfer.37 According to the results listed in Table 3, all membranes ensued to an increase in their size ranging from 30.2 to 60.3%. The significant increment might be due to the presence of many hydrophilic groups attached to the membrane, including the –OH groups that are possessed by cellulose and m-PTA as well as the hydrogen bond.37 In addition, the plasticization effect of cellulose also improves as long as it is in the hydrated state.37 However, the swelling ratio of the NC/Im/m-PTA-5 membrane is too high for the other membranes. It can be expected by the exceeding filler composition that absorbed excessive water molecules. Moreover, the higher swelling ratio also leads to a reduction in its dimensional stability. Those phenomena are linked to the tendency of the membrane to be easily damaged, which is in agreement with the tensile strength results.37
Conclusions
In this research, NC membranes have been successfully synthesized by the regenerated method from MCC. The particle size of the NC was 88.79 nm, as confirmed by FTIR spectroscopy and XRD, which showed the transformation from MCC to NC. Furthermore, m-PTA fillers with a pore size of 4.89 nm and a spherical shape have also been successfully synthesized. All the composite membranes were fabricated by the phase-inversion method and NC/Im/m-PTA-5 is the best membrane with the highest selectivity and water uptake respectively at 1.83 × 10⁴ S cm−3 and 50.68%. Its methanol permeability and uptake also achieved the lowest value at 1.74 × 10⁻⁶ cm2 s−1 and 3.19%, respectively. Another physicochemical test also showed that the highest IEC was achieved at 1.885 mmol g−1. The morphological structure of the membranes showed a dense structure with no void and cracking. The NC/Im/m-PTA-5 composite membrane could be considered as an alternative PEM for DMFC.Conflicts of interest
There are no conflicts to declare.Acknowledgements
The authors are very thankful to the Ministry of Research and Higher Education, Indonesia for funding the research under contract number 3/E1/KP.PTNBH/2021, Institut Teknologi Sepuluh Nopember (ITS) including the Material Chemistry and Energy Laboratory that facilitated this research and Advanced Membrane Technology (AMTEC) Research Centre, Universiti Teknologi Malaysia as a research partnership.Notes and references
- F. Lufrano, V. Baglio, P. Staiti, A. S. Arico’ and V. Antonucci, J. Power Sources, 2008, 179, 34–41 CrossRef CAS
.
- M. Purwanto, L. Atmaja, M. A. Mohamed, M. T. Salleh, J. Jaafar, A. F. Ismail, M. Santoso and N. Widiastuti, RSC Adv., 2016, 6, 2314–2322 RSC
.
- L. L. Wang, J. L. Wang, Y. Zhang and R. J. Feng, J. Electroanal. Chem., 2015, 759, 174–183 CrossRef
.
- A. Muthumeenal, S. Neelakandan, P. Kanagaraj and A. Nagendran, Renewable Energy, 2016, 86, 922–929 CrossRef CAS
.
- W. Wang, B. Shan, L. Zhu, C. Xie, C. Liu and F. Cui, Carbohydr. Polym., 2018, 187, 35–42 CrossRef CAS PubMed
.
- H. Zhang and P. K. Shen, Chem. Rev., 2012, 112, 2780–2832 CrossRef CAS PubMed
.
- A. Priyangga, Z. Mumtazah, H. Junoh, J. Jaafar and L. Atmaja, J. Membr. Sci. Res., 2021, 7, 295–304 CAS
.
- S. D. Pasini Cabello, N. A. Ochoa, E. A. Takara, S. Mollá and V. Compañ, Carbohydr. Polym., 2017, 157, 1759–1768 CrossRef CAS PubMed
.
- S. D. Pasini Cabello, S. Mollá, N. A. Ochoa, J. Marchese, E. Giménez and V. Compañ, J. Power Sources, 2014, 265, 345–355 CrossRef CAS
.
- A. Bagus Pambudi, A. Priyangga, D. Hartanto and L. Atmaja, Mater. Today: Proc., 2020, 46, 1855–1859 Search PubMed
.
- I. Jankowska, P. Ławniczak, K. Pogorzelec-Glaser, A. Łapiński, R. Pankiewicz and J. Tritt-Goc, Mater. Chem. Phys., 2020, 239, 122056–122063 CrossRef CAS
.
- C. Ni, Y. Wei, Q. Zhao, B. Liu, Z. Sun, Y. Gu, M. Zhang and W. Hu, Appl. Surf. Sci., 2018, 434, 163–175 CrossRef CAS
.
- C. Ni, Y. Wei, Q. Hu, X. Li, B. Liu, Q. Zhao, M. Zhang, Y. Li and W. Hu, Solid State Ionics, 2016, 297, 29–35 CrossRef CAS
.
- A. Priyangga, A. B. Pambudi, L. Atmaja and J. Jaafar, Mater. Today: Proc., 2020, 46, 1998–2003 Search PubMed
.
- X. Xu, R. Li, C. Tang, H. Wang, X. Zhuang, Y. Liu, W. Kang and L. Shi, Carbohydr. Polym., 2018, 184, 299–306 CrossRef CAS PubMed
.
- S. Mohanapriya and V. Raj, Ionics, 2018, 24, 2729–2743 CrossRef CAS
.
- H. Ilbeygi, I. Y. Kim, M. G. Kim, W. Cha, P. S. M. Kumar, D. H. Park and A. Vinu, Angew. Chem., Int. Ed., 2019, 58, 10849–10854 CrossRef CAS PubMed
.
- J. Tritt-Goc, L. Lindner, M. Bielejewski, E. Markiewicz and R. Pankiewicz, Carbohydr. Polym., 2019, 225, 115196 CrossRef CAS PubMed
.
- M. Malinowski, A. Iwan, K. Parafiniuk, L. Gorecki and G. Pasciak, Int. J. Hydrogen Energy, 2015, 40, 833–840 CrossRef CAS
.
- C. Y. Wong, W. Y. Wong, K. Ramya, M. Khalid, K. S. Loh, W. R. W. Daud, K. L. Lim, R. Walvekar and A. A. H. Kadhum, Int. J. Hydrogen Energy, 2019, 44, 6116–6135 CrossRef CAS
.
- N. A. Awang, W. N. Wan Salleh, A. F. Ismail, N. Yusof, F. Aziz and J. Jaafar, Ind. Eng. Chem. Res., 2019, 58, 720–728 CrossRef CAS
.
- Z. Shi, Q. Yang, S. Kuga and Y. Matsumoto, J. Agric. Food Chem., 2015, 63, 6113–6119 CrossRef CAS PubMed
.
- S. Shankar and J. W. Rhim, Carbohydr. Polym., 2016, 135, 18–26 CrossRef CAS PubMed
.
- A. G. Souza, D. F. Santos, R. R. Ferreira, V. Z. Pinto and D. S. Rosa, Int. J. Biol. Macromol., 2020, 165, 1803–1812 CrossRef CAS PubMed
.
- S. Zhang, F. Zhang, L. Jin, B. Liu, Y. Mao, Y. Liu and J. Huang, Cellulose, 2019, 26, 5177–5185 CrossRef CAS
.
- S. Mehanathan, H. Mohamed, J. Jaafar and H. Ilbeygi, Journal of Applied Membrane Science and Technology, 2020, 24, 13–29 Search PubMed
.
- A. R. Kim, C. J. Park, M. Vinothkannan and D. J. Yoo, Composites, Part B, 2018, 155, 272–281 CrossRef CAS
.
- H. Lee, J. Han, K. Kim, J. Kim, E. Kim, H. Shin and J. C. Lee, J. Ind. Eng. Chem., 2019, 74, 223–232 CrossRef CAS
.
- K. R. Srivastava, S. Dixit, D. B. Pal, P. K. Mishra, P. Srivastava, N. Srivastava, A. Hashem, A. A. Alqarawi and E. F. Abduallah, Environ. Technol. Innovation, 2021, 21, 101312 CrossRef CAS
.
- M. Cheng, Z. Qin, Y. Chen, S. Hu, Z. Ren and M. Zhu, ACS Sustainable Chem. Eng., 2017, 5, 4656–4664 CrossRef CAS
.
- N. Shaari and S. K. Kamarudin, J. Power Sources, 2015, 289, 71–80 CrossRef CAS
.
- Y. Ou, W. C. Tsen, C. Gong, J. Wang, H. Liu, G. Zheng, C. Qin and S. Wen, Polym. Adv. Technol., 2018, 29, 612–622 CrossRef CAS
.
- Q. Chen, J. Xiong, G. Chen and T. Tan, Int. J. Biol. Macromol., 2020, 158, 781–789 CrossRef CAS PubMed
.
- F. Jiang and Y. Lo Hsieh, Carbohydr. Polym., 2013, 95, 32–40 CrossRef CAS PubMed
.
- M. H. Gouda, W. Gouveia, M. L. Afonso, B. Šljukić, N. A. El Essawy, A. B. A. A. Nassr and D. M. F. Santos, J. Power Sources, 2019, 432, 92–101 CrossRef CAS
.
- N. Shaari and S. K. Kamarudin, Int. J. Hydrogen Energy, 2018, 43, 22986–23003 CrossRef CAS
.
- V. V. D. Khastgir, Cellulose, 2017, 25, 661–681 Search PubMed
.
- S. S. Gaur, P. Dhar, A. Sonowal, A. Sharma, A. Kumar and V. Katiyar, J. Membr. Sci., 2017, 526, 348–354 CrossRef CAS
.
- Z. Jahan, M. Bilal, K. Niazi and Ø. Weiby, J. Ind. Eng. Chem., 2018, 57, 113–124 CrossRef CAS
.
- N. Awang, A. F. Ismail, J. Jaafar, T. Matsuura, H. Junoh, M. H. D. Othman and M. A. Rahman, React. Funct. Polym., 2015, 86, 248–258 CrossRef CAS
.
- J. Jaafar, A. F. Ismail, T. Matsuura and K. Nagai, J. Membr. Sci., 2011, 382, 202–211 CrossRef CAS
.
- D. R. Dekel, J. Power Sources, 2018, 375, 158–169 CrossRef CAS
.
- H. Liu, C. Gong, J. Wang, X. Liu, H. Liu, F. Cheng, G. Wang, G. Zheng, C. Qin and S. Wen, Carbohydr. Polym., 2016, 136, 1379–1385 CrossRef CAS PubMed
.
| This journal is © The Royal Society of Chemistry 2022 |

