 Open Access Article
Creative Commons Attribution 3.0 Unported Licence
MNP–cellulose–OSO3H as an efficient and biodegradable heterogeneous catalyst for green synthesis of trisubstituted imidazoles†
Shaghayegh Saeedi and
Abbas Rahmati *
*
Department of Chemistry, University of Isfahan, P. O. Box 81746-73441, Isfahan, Iran. E-mail: a.rahmati@sci.ui.ac.ir; Tel: +98 31 37934943
First published on 19th April 2022
Abstract
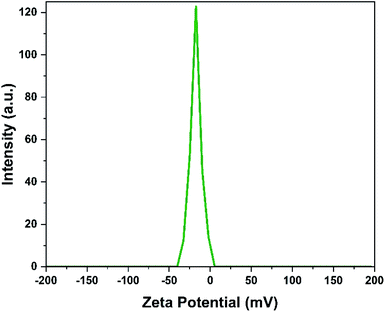
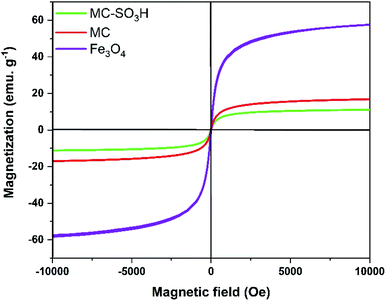
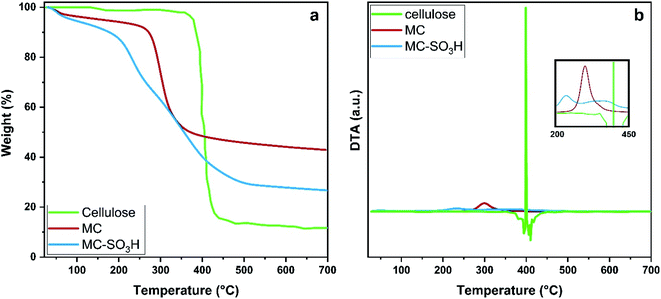
Cellulose is an eco-friendly, efficient, and suitable substrate for use as a coating material and support in the preparation of catalysts. Herein, MNP–cellulose–OSO3H was prepared as an efficient heterogeneous catalyst composed of Fe3O4 nanoparticles covered with cellulose–OSO3H and used for the synthesis of trisubstituted imidazoles. The catalyst was characterized by FT-IR, CHNS, ICP, PXRD, EDAX, elemental mapping, SEM, TEM, zeta potential, TGA, and VSM techniques. The catalytic activity was evaluated in the one-pot three-component synthesis of trisubstituted imidazole derivatives using benzil or 9,10-phenanthrenequinone, different aldehydes, and ammonium acetate in EtOH solvent at 80 °C over 30 min. The yields of products were excellent, in the range 83–97%. The catalyst showed outstanding catalytic performance toward heating conditions and good reusability. Also, this methodology had several advantages, such as simple procedures, short reaction time, excellent yield, simple workup, and mild reaction conditions.
1. Introduction
Nowadays, green chemistry encourages scientists to minimize the harmful impacts of chemical processes on the environment by changing the design of chemical reactions and processes.1 Synthesis of organic compounds using multi-component reactions in the presence of a functionalized supported heterogeneous catalyst exactly accords with the green chemistry program.2Heterogeneous catalysts have received significant attention because of their simple separation from the reaction mixture, reusability, and long-term stability.3 To produce a functionalized heterogeneous catalyst, a proper selection of support is vital due to increasing the performance and activity of the catalyst, improving its ability to stabilize nanoparticles and their durability, enhancing thermal stability, increasing the surface area and surface active sites, high catalyst dispersion, and effective contact with the substrates.4,5 Hence, various materials have been used as support such as silica,6 bio-based materials, insoluble polymers,7 and magnetic nanoparticles (MNPs).8 MNPs are very useful since they have large surface areas, can be simply synthesized and they can easily separate from the reaction mixture using an external strong magnet.9,10 Among the bio-based supports, cellulose-supported MNPs are a series of attractive heterogeneous catalysts because of the unique properties of cellulose such as sustainability, accessibility, low cost, easy handling, and eco-friendly nature. Moreover, the hydroxyl groups on cellulose can be easily functionalized by suitable reagents to produce more appropriate and active catalysts.11 Thus cellulose-supported MNPs are excellent candidates both from the perspective of green chemistry and a large number of functional groups.
Multi-component reactions (MCRs) are one of the most important types of chemical reactions owing to their valuable properties such as efficiency, safety, atom-economic chemistry, straightforward reaction design, and simultaneous combination of at least three reactants at a single vessel to selectively obtain the desired product.12 These reactions have many fundamental roles in medicinal chemistry,13 combinatorial chemistry, polymer chemistry,14 and synthesis of many useful and important small molecules, heterocyclic compounds and natural products.15,16
Imidazole is one of the most valuable five-membered heterocyclic compounds with two nitrogen atoms.17 This compound is found in the structure of various materials (i.e. composites,18 ionic liquids,19 metal-coordinating ligands20 host materials) and is widely applied in photonic and electronic areas such as OLEDs,21 optical sensors22 and memory devices23 and natural products.17 Besides, imidazole derivatives demonstrate a great variety of pharmaceutical and biological activities such as antitumor, anticancer, antimicrobial herbicidal, anti-inflammatory, and anti-diabetic.24 Various methods have been reported for the synthesis of imidazole.25 One of the best synthetic methods is three component reaction of a 1,2-dicarbonyl compound, aldehydes and ammonia. This reaction has been reported in the presence of various heterogeneous catalysts such as Co(II) salen@KCC-1,26 heteropolyacid,27 molecular sieve supported titanium,28 NaHSO4–SiO2,29 NiFe2O4@SiO2@aminoglucose,30 Fe3O4@chitosan,31 clays, zeolite, nanocrystalline sulfated zirconia,32 chitosan–SO3H,33 in different conditions. However, most of them suffer from poor yields34 high temperatures,35 the presence of hazardous solvents or toxic metal catalysts,36 the existence of side reactions, and tedious and time-consuming multi-step procedures.35 Therefore, scientists are still trying to find eco-friendly ways to synthesize these valuable compounds in the presence of efficient catalysts under mild conditions.37,38
For this purpose, Fe3O4 nanoparticles were covered with cellulose fibers and the resulting nanocomposite was modified with chlorosulfonic acid to obtain MNP–cellulose–OSO3H (MC–SO3H) catalyst. The performance of this catalyst was evaluated in the synthesis of trisubstituted imidazoles and the effect of different parameters on the yield of the reaction was assayed. Also, catalyst reusability was investigated.
2. Experimental
2.1. Materials
Cellulose, iron(III) chloride hexahydrate, iron(II) chloride tetrahydrate, and chlorosulfonic acid were acquired from Merck. Other chemicals were purchased from other commercial resources and used without further purification.2.2. Catalyst preparation
2.3. Characterization techniques
A Büchi B-545 apparatus was applied to determine the melting points in open capillary tubes. The 1H NMR spectra were recorded on a Bruker AVANCE DPX FT-NMR spectrometer at 400 MHz (δ in ppm). Inductively coupled plasma optical emission spectrometry (ICP-OES) was performed on a Varian Vista PRO Radial. FT-IR spectra were recorded on a JASCO FT/IR-6300 spectrometer using the KBr disk method at 400–4000 cm−1 at room temperature. Elemental analysis was used to estimate the elemental composition using a Heraeus CHNS Rapid analyzer. High angle powder X-ray diffraction (XRD) analysis was carried out on a Bruker D8 ADVANCE diffractometer, equipped with Ni-filtered Cu Kα (K = 0.15406 nm) radiation. The thermogravimetric analysis was performed by a SDT Q600 V20.9 Build 20 thermogravimetric system over a temperature range 25–700 °C at a scan rate of 5 °C min−1 in N2 atmosphere. A MIRA3 TESCAN-XMU microscope was applied to take FE-SEM, EDX, and elemental mapping images. Transmission electron microscopy (TEM) images were acquired on a Philips EM 208S apparatus. Zeta Potential measurements were performed using a SZ-100 nanoparticle analyzer at 25 °C. The magnetic properties of the particles were investigated by a vibrating sample magnetometer (LBKFB 1.5 tesla).2.4. Typical experimental procedure for the synthesis of 2,4,5-trisubstituted imidazole (3a)
4 mL of ethanol was added to a mixture of 4-bromobenzaldehyde (0.185 g, 1 mmol), benzil (0.210 g, 1 mmol), ammonium acetate (0.231 g, 3 mmol), and MC–SO3H (0.012 g) in a reaction tube at 80 °C for 2 h. The progress of the reaction was monitored by thin-layer chromatography (TLC) using silica gel plates (SIL G/UV 254) and after completion of the reaction, the mixture was cooled to room temperature, filtered, and washed with EtOH/H2O (1![[thin space (1/6-em)]](https://www.rsc.org/images/entities/char_2009.gif) :
:![[thin space (1/6-em)]](https://www.rsc.org/images/entities/char_2009.gif) 1 v/v) to obtain the pure product (3a) as a white solid (0.360 g, 96%, mp: 251–253 °C). The desired product was confirmed by H-NMR.
1 v/v) to obtain the pure product (3a) as a white solid (0.360 g, 96%, mp: 251–253 °C). The desired product was confirmed by H-NMR.
2.5. Investigation of acidity and reusability of the catalyst
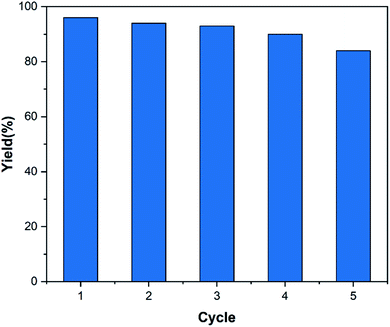
The number of acidic sites (H+) of the MC–SO3H was determined by acid–base back titration. 10 mg of catalyst was added to 3 mL of 0.01 N NaOH solution and stirred for 1 h in an Erlenmeyer flask. Then the excess amount of base was titrated by the addition of 0.01 N HCl solution.39 Also, the reusability of the catalyst was evaluated in the model reaction under optimum conditions. After completion of the reaction, the catalyst was separated by an external magnet, washed with ethanol and acetone, and dried in an oven at 70 °C for 3 h before using it in a subsequent run. This procedure was repeated three more times and the product yield was obtained at the end of each cycle.3. Results and discussion
3.1. Catalyst characterization
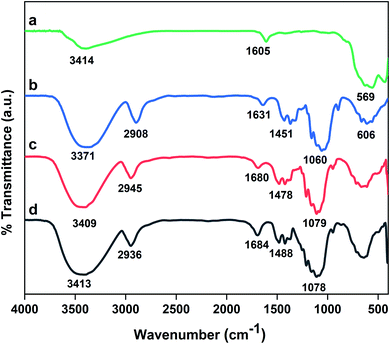
![[double bond, length as m-dash]](https://www.rsc.org/images/entities/char_e001.gif) S
S![[double bond, length as m-dash]](https://www.rsc.org/images/entities/char_e001.gif) O are overlapped with broad stretching 1,4-β-glycosidic bonds of cellulose.43 Notably, the peak corresponding to O–H bending of adsorbed water molecules on the surface is observed at 1605–1684 cm−1 in all spectrums.
O are overlapped with broad stretching 1,4-β-glycosidic bonds of cellulose.43 Notably, the peak corresponding to O–H bending of adsorbed water molecules on the surface is observed at 1605–1684 cm−1 in all spectrums.
| Method | H+ content (mmol g−1) |
|---|---|
| CHNS | 0.6 |
| Back titration | 1.02 |
| TGA | 2.53 |
3.2. Optimization of reaction conditions
In order to investigate the catalytic activity, MC–SO3H catalyst was used in a one-pot three-component reaction for the synthesis of trisubstituted imidazoles. For this purpose, 4-bromobenzaldehyde, benzil and ammonium acetate were selected as starting materials for the model reaction in the presence of MC–SO3H. Since the polarity of the solvent may be effective in this reaction, various solvents with different polarities were tested. The results shown in Table 3 indicate that the maximum yield of the product was obtained in the presence of ethanol.| Entry | Solvent | Temperature (°C) | Yieldb (%) |
|---|---|---|---|
| a Reaction conditions: 4-bromobenzaldehyde (1 mmol), benzil (1 mmol), ammonium acetate (3 mmol), MC–SO3H (20 mg), solvent (4 mL), 2 h.b Isolated yield. | |||
| 1 | Water | 80 | 79 |
| 2 | Methanol | Reflux | 84 |
| 3 | Ethanol | 80 | 96 |
| 4 | Propanol | 80 | 67 |
| 5 | Dioxane | 80 | 28 |
| 6 | THF | Reflux | 16 |
| 7 | Acetonitrile | Reflux | 38 |
| 8 | Ethyl acetate | Reflux | 41 |
| 9 | Chloroform | Reflux | N.R |
| 10 | Solvent free | 80 | N.R |
In the next step, a series of experiments were performed to investigate the effect of the reaction temperature, amount of catalyst, and reaction time on the yield of the product and the results are reported in Table 4. Temperature is one of the most important factors affecting the yield of reactions. To evaluate the importance of temperature in the yield of the reaction, the model reaction was carried out under thermal condition at different temperatures, and it was observed that the temperature of 80 °C as the optimal temperature gives the best yield (Table 4, entries 1–3). The results of the experiments related to the investigation of the catalyst amount indicated that with increasing the amount of catalyst from 5 to 12 mg (Table 4, entries 4–6), the yield of the reaction increased from 37 to 96%. However, the further increase in the catalyst amount did not change the reaction yield (Table 4, entry 7). Finally, after optimization of solvent, temperature, and catalyst amount, the model reaction was carried out in different time periods (Table 4, entries 8–11). As can be seen in Table 4, the highest yield of the product was obtained in about 30 minutes and a further increase in reaction time had no effect on the product yield (Scheme 2). Finally, various derivatives of the product were synthesized under optimum reaction conditions in the presence of MC–SO3H catalyst (Table 5). To demonstrate the efficiency and repeatability of the intended catalyst, a wide variety of aldehydes with acceptor and donor substitutions were used to synthesis different trisubstituted imidazoles. The results exhibited that the product yields have not significantly influenced by various substituents of the aldehydes and all the products were acquired in high yields.31,48
| Entry | Amount of MC–SO3H (mg) | Temperature (°C) | Time (min) | Yieldb (%) |
|---|---|---|---|---|
| a Reaction conditions: 4-bromobenzaldehyde (1 mmol), benzil (1 mmol), ammonium acetate (3 mmol), EtOH (4 mL).b Isolated yield. | ||||
| 1 | 20 | R.T | 120 | Trace |
| 2 | 20 | 50 | 120 | 62 |
| 3 | 20 | 80 | 120 | 96 |
| 4 | 5 | 80 | 120 | 37 |
| 5 | 10 | 80 | 120 | 79 |
| 6 | 12 | 80 | 120 | 96 |
| 7 | 15 | 80 | 120 | 96 |
| 8 | 12 | 80 | 60 | 96 |
| 9 | 12 | 80 | 30 | 96 |
| 10 | 12 | 80 | 20 | 90 |
| 11 | 12 | 80 | 10 | 69 |
 | ||
| Scheme 2 Synthesis of compound 3 using benzil or 9,10-phenanthrenequinone, different aldehydes and ammonium acetate under optimized reaction conditions. | ||
| Comp. | α-Diketone | R | Yield (%) | Mp (°C) | Ref. |
|---|---|---|---|---|---|
| a Reaction conditions: 4-bromobenzaldehyde (1 mmol), benzil (1 mmol), ammonium acetate (3 mmol), EtOH (4 mL). | |||||
| 3a | 1a | 4-Br–C6H4 | 96 | 251–253 | 249–251 (ref. 49) |
| 3b | 1a | 4-F–C6H4 | 95 | 187–189 | 189–190 (ref. 50) |
| 3c | 1a | 3-F–C6H4 | 91 | >260 | 284–285 (ref. 50) |
| 3d | 1a | 2,6-diCl–C6H4 | 83 | 231–232 | 229–230 (ref. 51) |
| 3e | 1a | 4-CN–C6H4 | 97 | >260 | 259–261 (ref. 49) |
| 3f | 1a | 3-NO2–C6H4 | 90 | >260 | 301–303 (ref. 49) |
| 3g | 1a | 4-OMe–C6H4 | 89 | 222–224 | 219–221 (ref. 49) |
| 3h | 1a | 2-Thiophene | 87 | 254–256 | 257–259 (ref. 49) |
| 3i | 1b | C6H4 | 89 | >260 | 311–313 (ref. 52) |
| 3j | 1b | 4-Br–C6H4 | 95 | >260 | 280–282 (ref. 52) |
| 3k | 1b | 4-Cl–C6H4 | 93 | >260 | 274–276 (ref. 52) |
| 3l | 1b | 2-Cl–6-F–C6H4 | 87 | >260 | — |
| 3m | 1b | 4-NO2–C6H4 | 93 | >260 | 335–337 (ref. 52) |
| 3n | 1b | 2-NO2–C6H4 | 94 | >260 | 267 (ref. 53) |
| 3o | 1b | 4-iPr–C6H4 | 90 | >260 | — |
| 3p | 1b | 4-Ph–C6H4 | 94 | >260 | 258–259 (ref. 54) |
| 3q | 1b | 2-OH–5-NO2–C6H4 | 88 | >260 | 259–260 (ref. 55) |
| 3r | 1b | 4-OMe–C6H4 | 91 | 252–254 | 254–255 (ref. 56) |
The proposed mechanism for the synthesis of trisubstituted imidazole is displayed in Scheme 3. As can be found, the carbonyl group of the aldehyde was firstly activated by MC–SO3H catalyst and attacked by two ammonia molecules (produced from the decomposition of ammonium acetate) that formed diamine I. In the following, one of the carbonyl groups of benzil, activated by MC–SO3H catalyst reacted by one amine groups of the diamine intermediate I which resulted in intermediate II. Then, the second amine group attacked to other carbonyl via intermolecular cyclization reaction. In the final stage, trisubstituted imidazole was produced by elimination of a H2O molecule.57
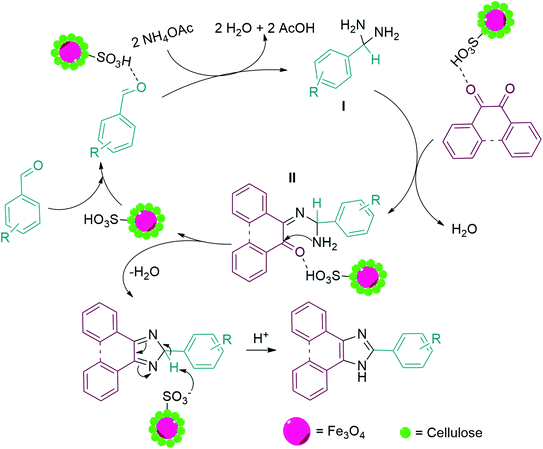 | ||
| Scheme 3 Suggested mechanism for the synthesis of 2,4,5-trisubstituted imidazole derivatives in the presence of MC–SO3H catalyst. | ||
3.3. Catalyst reusability study
The reusability of the catalyst is one of the main advantages of using a heterogeneous catalyst. Therefore, this parameter was investigated according to the procedure mentioned in Section 2.5. The results displayed in Fig. 9 show that the decrease in product yield is about, probably due to the breakdown of some –OSO3H bonds on the surface of nanocomposite particles which leads to reduce the number of –OSO3H agents on the surface of the catalyst and reduction of catalyst efficiency. Characterization of the recovered catalyst was done with FT-IR spectroscopy and SEM analysis. The SEM images of the recovered catalyst (Fig. 10) exhibited that the morphology of the catalyst was conserved during its reuse.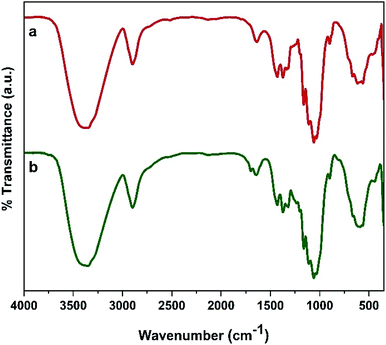 | ||
| Fig. 10 FT-IR spectra of (a) fresh catalyst, (b) five cycles recovered catalyst and SEM images of catalyst after five rounds. | ||
3.4. Comparison of this catalyst with other heterogeneous catalysts
Since the imidazoles are one of the most interesting compounds, various heterogeneous catalysts were introduced to synthesize these derivatives. Here, the catalytic performance of MC–SO3H catalyst was compared to that of reported heterogeneous catalysts for the synthesis of 2,4,5-trisubstituted imidazole derivatives and the results are presented in Table 6. Approximately, most of these catalysts have some problems such as intricate preparations, high cost, long time, and complicated recycling. For example, Shen et al. synthesized these derivatives in the presence of Yb(OPf)3 catalyst (6.7 mg) and perfluorodecalin (1.5 mL) in AcOH at 80 °C for a long period time (360 minutes) with 85% yield. This catalyst was recovered and reused for 5 cycles. In another study, Magyar et al. reported a time-consuming method by using toluene, which is a toxic, non-green organic solvent at 100 °C, in the presence of 100 mg catalyst (Ti4+/4 Å MS) with a yield of 85%. Also, Arghan et al. investigated the synthesis of 2,4,5-trisubstituted imidazole derivatives in solvent free condition at 100 °C, in presence of 15 mg Fe3O4/PVAm–SO3H catalyst. The yield of this reaction was 89% and the catalyst was recovered and reused for 8 cycles.| Catalyst (amount) | Reaction conditions | Time (min) | Run | Yield (%) | Ref. |
|---|---|---|---|---|---|
| Co(II) salen complex@KCC-1 (4 mg) | EtOH, 80 °C | 15 | 8 | 80 | 26 |
| Yb(OPf)3 (6.7 mg), perfluorodecalin (1.5 mL) | AcOH, 80 °C | 360 | 5 | 85 | 58 |
| PMO-ICS (20 mg) | EtOH, reflux | 42 | 4 | 98 | 59 |
| Ti4+/4 Å MS (100 mg) | Toluene, 100 °C | 660 | 4 | 85 | 28 |
| Montmorillonite K10 (25 mg) | EtOH, reflux | 110 | 3 | 75 | 32 |
| Zeolite (25 mg) | EtOH, reflux | 90 | 3 | 75 | 32 |
| Nano-crystalline SZ (25 mg) | EtOH, reflux | 75 | 3 | 81 | 32 |
| Fe3O4/PVAm–SO3H (15 mg) | Solvent free, 100 °C | 30 | 8 | 89 | 60 |
| MC–SO3H (12 mg) | EtOH, 80 °C | 30 | 5 | 96 | This work |
4. Conclusion
In the present work, MC–SO3H nanoparticles as a simple, non-expensive, and eco-friendly heterogeneous catalyst were prepared using cellulose as abundant biopolymer support. This catalyst was characterized by different methods and it was found that the modification approach was successfully performed. Then, MC–SO3H nanoparticles were used to synthesize a series of 2,4,5-trisubstituted imidazoles in EtOH solvent at 80 °C and the products were obtained in a short time with excellent yields. More importantly, these products were synthesized in the absence of hazardous organic solvents and under mild reaction conditions. Moreover, MC–SO3H nanoparticles were easily removed from the reaction mixture and reused for four cycles.Conflicts of interest
There are no conflicts to declare.Acknowledgements
We gratefully acknowledge financial support from the Research Council of the University of Isfahan.References
- S. L. Y. Tang, R. L. Smith and M. Poliakoff, Green Chem., 2005, 7, 761–762 RSC.
- J. Tan, X. Liu, N. Yao, Y. L. Hu and X. H. Li, ChemistrySelect, 2019, 4, 2475–2479 CrossRef CAS.
- M. Dabiri, P. Salehi, M. Baghbanzadeh, M. A. Zolfigol, M. Agheb and S. Heydari, Catal. Commun., 2008, 9, 785–788 CrossRef CAS.
- N. Yao, Y. P. Wu, K. B. Zheng and Y. L. Hu, Curr. Org. Chem., 2018, 22, 462–484 CrossRef CAS.
- G. Wang, F. Li, L. Li, J. Zhao, X. Ruan, W. Ding, J. Cai, A. Lu and Y. Pei, ACS Omega, 2020, 5, 8839–8846 CrossRef CAS PubMed.
- F. Shamsa, A. Motavalizadehkakhky, R. Zhiani, J. Mehrzad and M. S. Hosseiny, RSC Adv., 2021, 11, 37103–37111 RSC.
- Y. Ren, H. Li, W. Yang, D. Shi, Q. Wu, Y. Zhao, C. Feng, H. Liu and Q. Jiao, Ind. Eng. Chem. Res., 2019, 58, 2824–2834 CrossRef CAS.
- K. Zhou, X. P. Liu, H. Guo, H. Q. Li and P. Yang, RSC Adv., 2022, 12, 2623–2631 RSC.
- L. Z. Fekri, K. H. Pour and S. Zeinali, J. Organomet. Chem., 2020, 915, 121232 CrossRef CAS.
- M. Nikpassand, L. Z. Fekri and M. Nabatzadeh, Comb. Chem. High Throughput Screening, 2017, 20, 533–538 CrossRef CAS PubMed.
- A. H. Nordin, S. Wong, N. Ngadi, M. M. Zainol, N. A. F. Abd Latif and W. Nabgan, J. Environ. Chem. Eng., 2021, 9, 104639 CrossRef CAS.
- L. Z. Fekri and S. Zeinali, Appl. Organomet. Chem., 2020, 34, e5629 CrossRef CAS.
- E. Ruijter, R. Orru, K. Lam and H. Timmerman, Drug Discovery Today: Technol., 2018, 29, 1–2 CrossRef PubMed.
- R. Kakuchi, Polym. J., 2019, 51, 945–953 CrossRef CAS.
- N. Yao, M. Lu, X. B. Liu, J. Tan and Y. L. Hu, J. Mol. Liq., 2018, 262, 328–335 CrossRef CAS.
- J. Tan, J. R. Li and Y. L. Hu, J. Saudi Chem. Soc., 2020, 24, 777–784 CrossRef CAS.
- A. Verma, S. Joshi and D. Singh, J. Chem., 2013, 2013, 329412 Search PubMed.
- M. Mizuno, A. Iwasaki, T. Umiyama, R. Ohashi and T. Ida, Macromolecules, 2014, 47, 7469–7476 CrossRef CAS.
- G. Iijima, T. Kitagawa, A. Katayama, T. Inomata, H. Yamaguchi, K. Suzuki, K. Hirata, Y. Hijikata, M. Ito and H. Masuda, ACS Catal., 2018, 8, 1990–2000 CrossRef CAS.
- A. I. Solomatina, P. S. Chelushkin, T. O. Abakumova, V. A. Zhemkov, M. Kim, I. Bezprozvanny, V. V. Gurzhiy, A. S. Melnikov, Y. A. Anufrikov, I. O. Koshevoy and S. H. Su, Inorg. Chem., 2018, 58, 204–217 CrossRef PubMed.
- R. H. Yi, C. M. Shao, C. H. Lin, Y. C. Fang, H. L. Shen, C. W. Lu, K. Y. Wang, C. H. Chang, L. Y. Chen and Y. H. Chang, J. Phys. Chem. C, 2020, 124, 20410–20423 CrossRef CAS.
- J. Wang, R. Li, X. Long and Z. Li, Sens. Actuators, B, 2016, 237, 740–748 CrossRef CAS.
- K. Zhao, F. Yu, W. Liu, Y. Huang, A. A. Said, Y. Li and Q. Zhang, J. Org. Chem., 2019, 85, 101–107 CrossRef PubMed.
- M. S. Jourshari, M. Mamaghani, F. Shirini, K. Tabatabaeian, M. Rassa and H. Langari, Chin. Chem. Lett., 2013, 24, 993–996 CrossRef.
- M. Hossain and A. K. Nanda, Science, 2018, 6, 83–94 CAS.
- A. Allahresani, E. Naghdi and M. A. Nasseri, Inorg. Chem. Commun., 2020, 119, 108137 CrossRef CAS.
- M. M. Heravi, F. Derikvand and F. F. Bamoharram, J. Mol. Catal. A: Chem., 2007, 263, 112–114 CrossRef CAS.
- Á. Magyar and Z. Hell, Synlett, 2019, 30, 89–93 CrossRef.
- A. R. Karimi, Z. Alimohammadi, J. Azizian, A. A. Mohammadi and M. R. Mohammadizadeh, Catal. Commun., 2006, 7, 728–732 CrossRef CAS.
- L. Z. Fekri, M. Nikpassand, S. Shariati, B. Aghazadeh, R. Zarkeshvari and N. Norouz, J. Organomet. Chem., 2018, 871, 60–73 CrossRef CAS.
- Z. Zarnegar and J. Safari, RSC Adv., 2014, 4, 20932–20939 RSC.
- A. Teimouri and A. N. Chermahini, J. Mol. Catal. A: Chem., 2011, 346, 39–45 CrossRef CAS.
- K. Khan and Z. N. Siddiqui, Ind. Eng. Chem. Res., 2015, 54, 6611–6618 CrossRef CAS.
- I. Singh, R. Rani, V. Luxami and K. Paul, Eur. J. Med. Chem., 2019, 166, 267–280 CrossRef CAS PubMed.
- X. J. Wu, R. Jiang, X. P. Xu, X. M. Su, W. H. Lu and S. J. Ji, J. Comb. Chem., 2010, 12, 829–835 CrossRef CAS PubMed.
- C. T. F. Salfeena, R. Jalaja, R. Davis, E. Suresh and S. B. Somappa, ACS Omega, 2018, 3, 8074–8082 CrossRef CAS PubMed.
- L. Zare Fekri and M. Nateghi-Sabet, J. Chin. Chem. Soc., 2021, 68, 695–703 CrossRef CAS.
- L. Zare Fekri and M. Nateghi, Chem. Rev. Lett., 2021, 4, 37–42 Search PubMed.
- Z. Mohammadbagheri and A. N. Chermahini, Chem. Eng. J., 2019, 361, 450–460 CrossRef CAS.
- H. Huang, X. Wang, H. Ge and M. Xu, ACS Sustainable Chem. Eng., 2016, 4, 3334–3343 CrossRef CAS.
- Y. Sie, C. Wan and A. Wu, RSC Adv., 2016, 7, 2460–2465 RSC.
- Z. Mohammadbagheri, A. Rahmati and P. Hoshyarmanesh, Int. J. Biol. Macromol., 2021, 182, 1893–1905 CrossRef CAS PubMed.
- A. N. Chermahini, F. Shahangi, H. A. Dabbagh and M. Saraji, RSC Adv., 2016, 6, 33804–33810 RSC.
- J. Gong, J. Li, J. Xu, Z. Xiang and L. Mo, RSC Adv., 2017, 7, 33486–33493 RSC.
- Y. Yang, W. Zhang, F. Yang, B. Zhou, D. Zeng, N. Zhang, G. Zhao, S. Hao and X. Zhang, Nanoscale, 2018, 10, 2199–2206 RSC.
- Q. Zhang, X. Han and B. Tang, RSC Adv., 2013, 3, 9924–9931 RSC.
- A. Azizi, J. Inorg. Organomet. Polym. Mater., 2020, 30, 3552–3561 CrossRef CAS.
- H. Naeimi and D. Aghaseyedkarimi, New J. Chem., 2015, 39, 9415–9421 RSC.
- B. Das, J. Kashanna, R. A. Kumar and P. Jangili, Monatsh. Chem., 2013, 144, 223–226 CrossRef CAS.
- J. Jayram and V. Jeena, Green Chem., 2017, 19, 5841–5845 RSC.
- F. Xu, N. Wang, Y. Tian and G. Li, J. Heterocycl. Chem., 2013, 50, 668–675 CrossRef CAS.
- N. L. Higuera, D. Peña-Solórzano and C. Ochoa-Puentes, Synlett, 2019, 30, 225–229 CrossRef CAS.
- A. H. Cook and D. G. Jones, J. Chem. Soc., 1941, 278–282 RSC.
- O. Neunhoeffer, G. Krieg and B. Krieg, Z. Naturforsch. B, 1966, 21, 536–539 CrossRef CAS.
- A. O. Eseola, O. Akogun, H. Görls, O. Atolani, G. A. Kolawole and W. Plass, J. Mol. Catal. A: Chem., 2014, 387, 112–122 CrossRef CAS.
- H. Eshghi, M. Rahimizadeh, M. Hasanpour and M. Bakavoli, Res. Chem. Intermed., 2015, 41, 4187–4197 CrossRef CAS.
- E. Kanaani and M. Nasr-Esfahani, J. Chin. Chem. Soc., 2019, 66, 119–125 CrossRef CAS.
- M. G. Shen, C. Cai and W. B. Yi, J. Fluorine Chem., 2008, 129, 541–544 CrossRef CAS.
- M. G. Dekamin, E. Arefi and A. Yaghoubi, RSC Adv., 2016, 6, 86982–86988 RSC.
- M. Arghan, N. Koukabi and E. Kolvari, J. Iran. Chem. Soc., 2019, 16, 2333–2350 CrossRef CAS.
Footnote |
| † Electronic supplementary information (ESI) available. See https://doi.org/10.1039/d2ra01348g |
| This journal is © The Royal Society of Chemistry 2022 |


