DOI:
10.1039/D2RA01322C
(Paper)
RSC Adv., 2022,
12, 12631-12646
Processing-properties-performance triad relationship in a Washingtonia robusta mesoporous carbon materials-based supercapacitor device†
Received
27th February 2022
, Accepted 20th April 2022
First published on 27th April 2022
Abstract
Two-electrode electrochemical tests provide a close performance approximation to that of an actual supercapacitor device. This study presents mesoporous carbon materials successfully derived from Washingtonia robusta bark (Mexican fan palm) and their electrical performance in a 2-electrode supercapacitor device. The triad relationship among carbon materials “processing, properties, and performance” was comprehensively investigated. X-ray diffraction reveal that amorphousness increases with activating KOH ratio and decreases with both activation time and temperature. Raman spectroscopy shows an increase in structural defects and degree of graphitization with an increase in KOH ratio, temperature and time while transmission electron microscopy shows conversion of aggregated particles to materials with interconnected porosity and subsequent destruction of porosity with an increase in KOH ratio. A nitrogen-sorption study reveals varying trends between BET, micro and mesopore surface areas, however, pore size and volume and hysteresis loop size decreases with KOH ratio and temperature. Electrochemical studies on the other hand reveal that both the specific capacitance and charge–discharge time increase with KOH ratio, temperature and time while both charge transfer and Warburg resistances decrease and the phase angles increases towards the ideal −90° with an increase in KOH ratio, temperature and time. The device fabricated with the HHPB sample prepared at 700 °C, KOH ratio 3 for 60 min attained a specific capacitance of 179.3 and 169 F g−1 at a scan rate of 5 mV s−1 and current density of 0.5 A g−1, respectively, good cycling stability with 95% capacitance retention and 100% coulombic efficiency when cycled 5000 times at a current density of 2 A g−1. HHPB electrodes reveal perfect EDLC behavior with an energy density of 20 W h kg−1 and power density of 2000 W kg−1 when used in a symmetric coin supercapacitor cell with 6 M KOH solution. These findings show the potential of fan palm bark as electrode materials with good stability and high-rate capability for supercapacitor application.
Introduction
Supercapacitors have gained considerable attention as a result of the increase in the usage of portable electronic devices. In addition, their unparallel attributes of longer cycling ability, faster charging, and high power density compared to batteries has projected them as a superior alternative.1 Typically there are two main forms of supercapacitors based on the mechanism of charge storage: pseudocapacitors which store charge through faradaic redox reactions, and the electric double layer capacitor (EDLC) which stores charge through electrostatic interactions in the electrical double layer.1,2 Various materials including conducting polymers, carbon-based materials and metal oxides have been studied as supercapacitor electrode materials.3 Transition metal oxides are reported to offer high specific capacitance due to faradaic reactions compared to carbon based materials which are based on EDL formation.2 Although pseudocapacitive based materials have been reported to have high specific capacitance, their life cycling stability is poor thus making carbon based materials the potential materials for supercapacitors. Apart from good life cycle, good conductivity, chemical stability, high specific surface area, and availability have made carbon-based materials such as activated carbon, graphene, carbon nanotubes and carbon aerogels promising for EDLC based supercapacitors.
Activated carbon is most preferred carbon material for application in commercial supercapacitors owing to its availability, high specific surface area, and low production cost.4 However, these materials have poor electronic conductivity, low specific capacitance and low energy density which hinder their application in real life energy storage applications. Thus strategies to synthesize activated carbon from natural or synthetic sources with improved performance are highly needed. It is reported that activated carbon from synthetic sources, such as, polymers, can attain outstanding properties and physical structures for supercapacitors,5 however, their high production cost, hampers their large scale production for commercialization. Thus carbon materials synthesized from natural sources are mostly preferred for commercial production of activated carbon for various applications due to their outstanding properties and low cost.1 For many years activated carbons have been produced from coal, wood, petroleum residues, peat, and lignite but these precursors are nonrenewable and unsustainable. Therefore, due to sustainability and renewability credentials, biomass waste has recently been used for large scale production of activated carbon and used as electrode materials.6 To date, biomass waste such as willow wood,7 biogas slurry,8 fish bladder,9 walnut shells3 and many other precursors as reviewed by Shanmuga Priya et al.,10 Enock et al.,11 and Lin et al.,12 have been studied as supercapacitor electrode materials.
Additionally, most studied biomass based carbon for supercapacitor utilized three electrode system which is reported to be suitable for studying electrochemical properties of electrode materials rather than the performance of a supercapacitor device. Two-electrode test cell is thus reported to simulates what is actually happening in a real supercapacitor device in terms of the charge transfer, physical configuration and internal voltages and finally demonstrates the performance of the device.13 The performance of materials in two electrode system still faces a challenge of stability at high current densities. Thus developing appropriate carbon materials with high capacitance and long cycling life for supercapacitor device from renewable and sustainable precursor is significant. This study therefore, utilized porous carbon derived from Washingtonia robusta to make supercapacitor electrodes that exhibited high specific capacitance, stable life cycle and good rate capability when tested in two electrode system. Further, the study comprehensively investigated the influence of hydrothermal pre-treatment and activation on the textural, internal structure, morphological, and electrochemical properties and hence performance of the supercapacitor device and revealed an intimate processing-properties-performance triad relationship. Washingtonia robusta commonly known as Washington palm, Mexican Washington palm or Mexican fan palm is one among common palms called fan palms. Its fronds has been used for various activities including making furniture and in construction works to replace steel in concrete.14 It is composed of 46.82, 25.70, 22.46 and 5.02% cellulose, hemicellulose, lignin and extractives, respectively,14 comparable to that of wood thus suggesting its potential for synthesizing activated carbon for various applications. To the best of our knowledge there is no literature that reports utilization of carbon derived from dried palm barks for supercapacitor applications. The current study therefore, explored the possibility of synthesizing carbon from dried fan palm barks for supercapacitor applications. It further scrutinized the effect of carbon precursor hydrothermal pretreatment, activating agent ratio, temperature and time on BET, micro/mesopores surface areas, pore size and volume (textural properties); structural defects, degree of graphitization and crystallinity (internal structure properties); particle size and shape (morphology), phase angle, charge transfer and Warburg resistances (electrochemical properties) and on the specific capacitance, cycling stability, coulombic efficiency, capacitance retention, energy and power density (performance) of a 2-electrode supercapacitor device. Utilization of palm bark as carbon precursor addresses environmental pollution by reducing waste and the global energy demand by converting environmentally friendly biomass waste to functional materials with high power and energy density in supercapacitor applications.
Methodology
Chemicals
Chemicals including polyvinylidene fluoride (PVDF), Kuray active carbon for supercapacitor electrode (Model YP-50F) both from MTI cooperation, acetone, DMF, H2SO4, KOH and HCl were used without any purification. Commercial activated charcoal (AC115) from Alpha Chemica was also used.
Synthesis of carbon
Dried Mexicana palm barks were cut from the garden around Botswana International University of Science and Technology (BIUST) and thorns were removed. Palm barks were cut into small pieces, washed with tap water to remove any adhering dirt and thereafter ashed with distilled water before being oven dried overnight at 100 °C. The dried pieces were then grounded with a compaction module, pulverized and then sieved to the size of 1.27 mm. Six (6) g of the pulverized sample was mixed with 100 mL of 2 M H2SO4 and placed into a 120 mL Teflon lined autoclave, tightened and heated at 180 °C in oven for 24 h. After that, the autoclave was left to cool to room temperature and the resulting sample was filtered and washed several times with distilled water until filtrates became clear. The obtained sample was oven dried overnight at 100 °C, named HHPB and stored in closed containers for further use. One (1) g of HHPB was mixed with KOH pellets at different ratios varying from 1 to 3 and ground thoroughly with an agate mortar. The HHPB and KOH mixture was then activated in MTI OTF-1200X-60 series tube furnace under flow of nitrogen gas at 650, 700 and 750 °C for 60, 90 and 120 min. The heating ramp rate and nitrogen mass flow was set to 10 °C min−1 and 20 SCCM, respectively. The sample was allowed to cool naturally in the furnace to room temperature under flow of nitrogen gas. The sample was then soaked in 1 M HCl for several hours to neutralize the remaining KOH and also remove ash after which it was washed with distilled water until the effluent pH reach 6.5 to 7. The washed sample was oven dried at 100 °C overnight and labeled as HHPBxy_z where x denotes HHPB to KOH ratio, while y and z denotes activation temperature and time, respectively. HHPB samples carbonized without activation are hereafter referred to as CHHPBx_y where x and y denote carbonization temperature and time, correspondingly.
Material characterization
The morphology of the synthesized materials was studied by a JEOL JEM-2100F electron transmission electron microscopy (HR-TEM) operating at 200 kV accelerating voltage and Tescan Vega 3 LMH scanning electron microscope (SEM) while nitrogen sorption studies were used to determine pore size distribution and specific surface area employing Barret–Joyner–Halenda (BJH) desorption isotherm and Brunauer–Emmett–Teller (BET) method, respectively. Raman spectroscopy (LabRAM HR800 Raman spectrometer, Horiba JobinYvon, exciting samples with 532 nm Nd-YAG laser) and X-ray powder diffraction (XRD) (Bruker D8 Advance powder diffractometer with a Cu tube X-ray source with λ = 1.54056 nm operating at 40 kV, 40 mA and with a LynxEye XE energy-dispersive strip detector) were used to characterize crystal structure changes in carbon materials prepared at different carbonization and activation conditions.
Electrochemical studies
Cyclic voltammetry (CV), electrochemical impedance spectroscopy (EIS) and cyclic charge and discharge (CCD) was used to study the electrochemical properties/performance of the electrodes at room temperature using Gamry potentiostat/galvanostat reference 3000 in two electrode system. A symmetrical two-electrode supercapacitor system was assembled using EQ-HSTC split-able test cell with Ni foam as current collector and Whatman filter paper as separator. The Whatman filter was soaked in 6 M KOH overnight before being used as a separator. The two working electrodes were prepared by mixing 80% of the synthesized carbon material, 10% of PVDF and 10% Kuray active carbon for supercapacitor in a solution of acetone and DMF (1![[thin space (1/6-em)]](https://www.rsc.org/images/entities/char_2009.gif) :
:![[thin space (1/6-em)]](https://www.rsc.org/images/entities/char_2009.gif) 2 volume ratios) to make viscous slurry which was pasted on nickel foam pieces of 3.14 cm2. The electrodes were oven dried at 60 °C overnight to evaporate the solvent. The total mass of active material on single electrode was calculated by taking the mass difference between the nickel foam before and after coating. The total weight of active materials on both electrodes varied from 12–16 mg. EIS measurements were done at open circuit potential with the amplitude of 5 mV at a frequency range of 100 kHz to 10 mHz.
2 volume ratios) to make viscous slurry which was pasted on nickel foam pieces of 3.14 cm2. The electrodes were oven dried at 60 °C overnight to evaporate the solvent. The total mass of active material on single electrode was calculated by taking the mass difference between the nickel foam before and after coating. The total weight of active materials on both electrodes varied from 12–16 mg. EIS measurements were done at open circuit potential with the amplitude of 5 mV at a frequency range of 100 kHz to 10 mHz.
The specific capacitance (Cs) in F g−1 from both CV and CCD for two electrode system was calculated using eqn (1) and (2), respectively.15,16
| |
 | (1) |
| |
 | (2) |
where

symbolizes the area under the CV curve,
m is the total mass (g) of active materials in both electrode,
ν is the scan rate (V s
−1), Δ
V is the potential window (V),
Vf and
Vi (V) are final and initial potential limit of the CV tests,
I is the discharge current (A) and Δ
t is the discharge time (s).
The energy density (E) and power density (P) in W h kg−1 and W kg−1, respectively, were calculated using eqn (3) and (4).16–19
| |
 | (3) |
| |
 | (4) |
where,
Cs is the specific capacitance in F g
−1, Δ
V is the potential window and Δ
t is the discharge time in seconds.
Results and discussion
Characterization
Fig. 1a–c shows the XRD patterns of HHPB samples at different activation conditions. All samples demonstrates two broad diffraction peaks at about 22 and 44°, 2θ, corresponding to (002) and (100) graphitic planes, respectively. The broad and asymmetric peaks signify that the carbon samples were turbostratic in nature.20 The (002) peak intensity was found to decrease with an increase in KOH ratio from 1 to 3 during activation, Fig. 1a. This was probably caused by amorphization of the samples as the KOH etched out inorganics and accelerated volatilization of extractives in the carbon precursor. Contrary, activation temperature and time led to an increase in peaks intensity, particularly (002), Fig. 1b and c. This is indicative of an increase in crystallinity of the samples, albeit within the turbostratic range, caused by carbon microstructure coarsening and crystallites growth during graphitization process at high temperatures.21
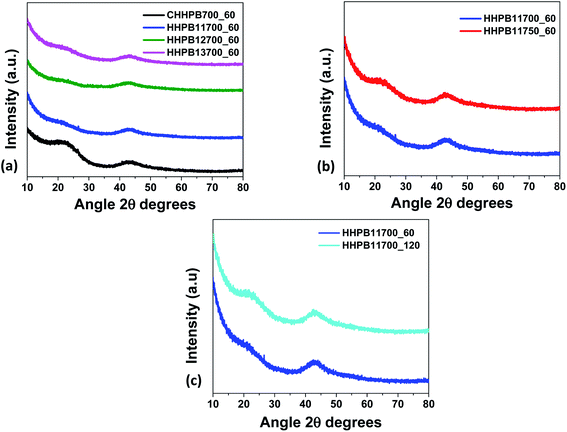 |
| | Fig. 1 XRD of HHPB at different activation (a) ratio (b) temperature (c) time. | |
Fig. 2 represents SEM images of HHPB samples at different activation conditions. It can be seen that heterogeneous morphology composed of microspheres and irregular monoliths after hydrothermal treatment and carbonization at 700 °C for 1 h (Fig. 2a). The microsphere morphology was preserved after activation with KOH ratio 1 at 700 °C for 1 h (Fig. 2b). However, the microspheres disappeared as KOH ratio increased to 2 and 3 (Fig. 2c and d) and faceted particles with more interparticles pores, cavities and more rough surfaces were formed. This might be due to the fact that the microspheres were destroyed by the strong etching effect of increased KOH ratio during activation process as previously reported by Romero-Anaya et al.22 Upon varying activation temperature from 650 to 750 °C, KOH ratio 1, the carbon particles, though still agglomerated and reduced in size, (Fig. S1 in the ESI†). Moreover, TEM was used to study the morphological and structural changes that occurred as the samples were activated at different KOH ratio, temperature, and time. The carbonized sample showed agglomerated particles that are relatively small and thick (Fig. 3a and e) compared to its activated counterparts, Fig. 3b–d and f–h. Upon activation, the agglomerated thick particles were converted to carbon materials with highly interconnected porosity at KOH ratio of 1, Fig. 3b and f. At this ratio, KOH is suggested to have optimally etched inorganics and accelerated volatilization of extractibles in the carbon precursor leaving behind fixed carbon with interconnected porous structure. Increasing KOH ratio to 2 significantly reduced the interconnected porous structure leading to formation of relatively large but thinner particles, Fig. 3c and g. At KOH ratio of 3, the interconnected porous structure was completely lost and large relatively thick particles were formed, Fig. 3d and h. The reduction of and complete loss of the interconnected porosity at KOH ratios of 2 and 3, respectively, was probably due to the destruction of walls separating adjacent pores by the KOH. The TEM results showing highly porous carbon structure at KOH ratio 1 is in harmony with N2 sorption studies, Fig. 5, which show lack of hysteresis loop for none activated carbon materials (CHHPB700_60), largest hysteresis loop and a sharp pore size distribution peak centered at around 4 nm with highest pore volume for carbon materials activated at KOH ratio of 1 (HHPB11700_60). Carbon microstructure coarsening was observed with increase in activation temperature revealed by formation of small and scattered semi-crystalline domains at 700 and 750 °C, Fig. S2 in the ESI.† This was due to carbon crystallites grow with temperature. These images further supports XRD results, Fig. 1b, that depict turbostratic nature of carbon samples and an increase in XRD peaks intensity with increase in temperature.
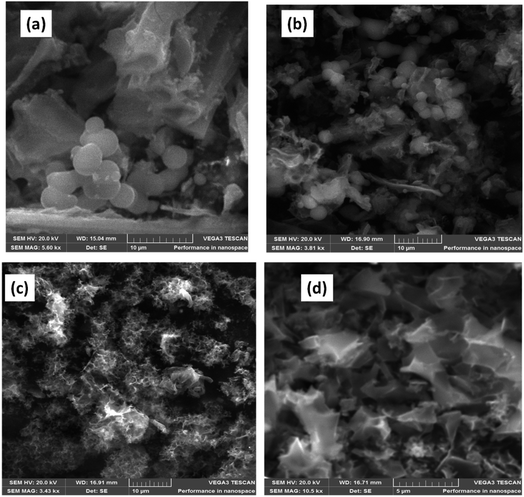 |
| | Fig. 2 SEM image of (a) CHHPB700_60 (b) HHPB11700_60 (c) HHPB12700_60 (d) HHPB13700_60. | |
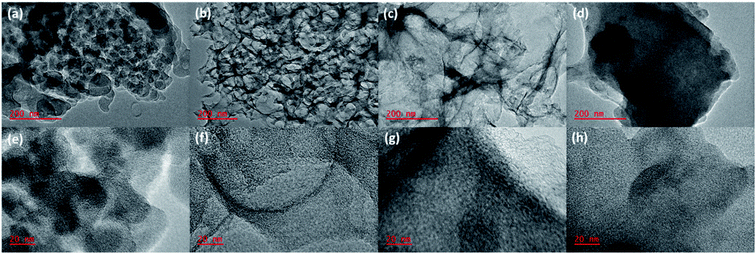 |
| | Fig. 3 (a–d) low magnification TEM images of CHHPB700_60, HHPB11700_60, HHPB12700_60, and HHPB13700_60, respectively, (e–h) high magnification TEM images of (a–d) in that order. | |
Fig. 4a–c show Raman spectra of different HHPB samples with D peak related to the defect or disorder-induced scattering signal at around 1330 cm−1 and a G peak assigned to the vibration signal of sp2-bonded carbon atoms at around 1590 cm−1. The intensity ratio of the D to G peak (ID/IG) in carbon materials represents the degree of graphitization and the structural disorder of the carbon framework. The higher the ID/IG value the more the defects in carbon materials. These defects have been shown to favor charge storage in supercapacitors.23 The values of ID/IG increased from 0.99 to 1.06 as activation temperature increased from 650 to 700 °C. However, the intensity ratio dropped to 0.97 as activation temperature increased to 750 °C (Fig. 4a) as a result of rearrangement in the lamellar structure of the carbon when the sample was treated under high activation temperature. Similarly, ID/IG increased from 0.95 to 1.01 as activating agent (KOH) ratio increased from 0 to 3, Fig. 4b. This was due to the formation of structure defects in the carbon framework as the KOH etched out inorganics and accelerated volatilization of extractibles in the carbon precursor and formed –OH and –COOH functional groups on the fixed carbon framework. These defects in the HHPB samples increased active sites and active surface area and are thus beneficial for the enhancement of the capacitance as previously reported by Hou et al.24 Likewise, activation time was found to have a significant influence on the degree of graphitization and disorder since an increase in activation time led to an increase in the intensity of both the D and G bands, Fig. 4c.
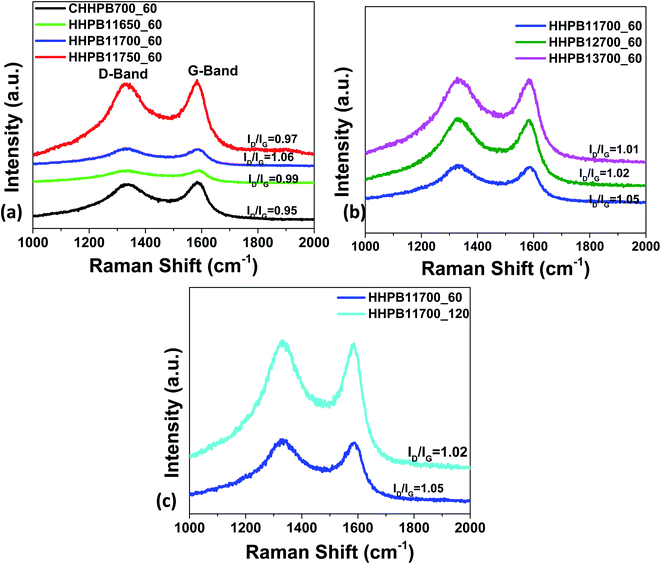 |
| | Fig. 4 Raman spectra of HHPB at different activation (a) temperatures (b) ratio (c) time. | |
Nitrogen adsorption studies were used to study the BET surface area, pore volume, t-plot micropore area and pore width of HHPB samples and the results are summarized in Table 1. From Table 1, it can be seen that the none activated sample, CHHPB700_60 showed the lowest BET, micropore, and mesopore surface areas and this could explain its poor electrochemical performance. BET surface area of the activated HHPB samples and total pore volume increased from 532.50 to 1830.61 m2 g−1 and 0.46 to 0.91 cm3 g−1, respectively, after introduction of activating agent due to generation of large amount of pores in the course of the activation process. The BET surface area, however, decreased to 1509.79 m2 g−1 as activating agent ratio increased to 3, probably due to pore blocking effects as previously reported by Kennedy et al.25 In addition, the deterioration of porous structure resulting from destruction of walls between adjacent pores by the etching effect of KOH might also have contributed to the reduction in BET surface area. Previous reports suggest that the overall porosity of a chemically activated carbon materials increase with KOH concentration.26 However, this trend was not observed in our case. For instance as KOH ratio increased from 0 to 1, mesopore surface area and volume increased from 21![[thin space (1/6-em)]](https://www.rsc.org/images/entities/char_2009.gif) 313.85 to 1253.46 m2 g−1 and from 0.36 to 0.85 cm3 g−1 respectively. As KOH ratio increases further to 3, the mesopores surface area and volume decreased to 169.3 m2 g−1 and 0.3 cm3 g−1 respectively. These results demonstrate the strong influence of KOH amount on the textural properties of the HHPB samples especially in the formation of mesopores. The formation mechanism of porosity in carbon at different KOH concentrations is a very complex process which follows several steps as depicted by eqn (5)–(11). Normally, the KOH etchant reacts with carbon generating the alkali metal (K), alkali compounds (K2O and K2CO3), and H2 gas in several steps as per eqn (5) and (6). The whole process can be explained as follows: at lower temperature around 400 °C dehydration of KOH to K2O occurs (eqn (6)). Water (H2O) then react with C and CO to form H2 as per eqn (7) and (8) followed by carbonate formation, eqn (9). At temperatures higher than 700 °C, the carbonates decompose into CO2 and K2O, eqn (10). The K2O formed is then reduced by carbon to form metallic potassium (K), eqn (11), which intercalate between carbon layers. During washing with HCl and water, the intercalated metallic K and other compounds containing K are removed resulting into expanded carbon lattices that cannot return to their earlier structure therefore pores that are essential for charge storage are formed.27–29 Moreover, the surface area decreased from 3572.03 to 2453.56 m2 g−1 as temperature increased from 650 to 750 °C owing to carbon microstructure coarsening and crystallites growth during graphitization process at high temperatures.21 The pore sizes of all HHPB samples varied between 1.91–7.27 nm which represent mesoporous materials according to IUPAC pore size definition.
313.85 to 1253.46 m2 g−1 and from 0.36 to 0.85 cm3 g−1 respectively. As KOH ratio increases further to 3, the mesopores surface area and volume decreased to 169.3 m2 g−1 and 0.3 cm3 g−1 respectively. These results demonstrate the strong influence of KOH amount on the textural properties of the HHPB samples especially in the formation of mesopores. The formation mechanism of porosity in carbon at different KOH concentrations is a very complex process which follows several steps as depicted by eqn (5)–(11). Normally, the KOH etchant reacts with carbon generating the alkali metal (K), alkali compounds (K2O and K2CO3), and H2 gas in several steps as per eqn (5) and (6). The whole process can be explained as follows: at lower temperature around 400 °C dehydration of KOH to K2O occurs (eqn (6)). Water (H2O) then react with C and CO to form H2 as per eqn (7) and (8) followed by carbonate formation, eqn (9). At temperatures higher than 700 °C, the carbonates decompose into CO2 and K2O, eqn (10). The K2O formed is then reduced by carbon to form metallic potassium (K), eqn (11), which intercalate between carbon layers. During washing with HCl and water, the intercalated metallic K and other compounds containing K are removed resulting into expanded carbon lattices that cannot return to their earlier structure therefore pores that are essential for charge storage are formed.27–29 Moreover, the surface area decreased from 3572.03 to 2453.56 m2 g−1 as temperature increased from 650 to 750 °C owing to carbon microstructure coarsening and crystallites growth during graphitization process at high temperatures.21 The pore sizes of all HHPB samples varied between 1.91–7.27 nm which represent mesoporous materials according to IUPAC pore size definition.
| | |
6KOH + 2C → 2K + 3H2 + 2K2CO3
| (5) |
Table 1 Textural properties of the synthesized HHPB samples
| Sample |
BETa (m2 g−1) |
Amicrob (m2 g−1) |
Amesoc (m2 g−1) |
Vmicrod (cm3 g−1) |
Vmesoe (cm3 g−1) |
Vtotalf (cm3 g−1) |
Pore size (nm) |
| BET surface area. Micropore area. Mesopore area. Micropore volume. Mesopore volume. Total pore volume. |
| Activation ratio |
| CHHPB700_60 |
532.50 |
218.65 |
313.85 |
0.10 |
0.36 |
0.46 |
7.27 |
| HHPB11700_60 |
1830.61 |
577.15 |
1253.46 |
0.25 |
0.85 |
1.09 |
5.58 |
| HHPB12700_60 |
1478.11 |
231.58 |
1246.54 |
0.09 |
0.55 |
0.64 |
4.48 |
| HHPB13700_60 |
1509.79 |
1340.59 |
169.20 |
0.62 |
0.30 |
0.91 |
2.42 |
![[thin space (1/6-em)]](https://www.rsc.org/images/entities/char_2009.gif) |
| Activation temperature |
| HHPB11650_60 |
3572.03 |
2527.28 |
1044.75 |
1.10 |
1.06 |
2.16 |
2.42 |
| HHPB11700_60 |
1830.61 |
577.15 |
1253.46 |
0.25 |
0.85 |
1.09 |
5.58 |
| HHPB11750_60 |
2453.56 |
142.30 |
2311.26 |
0.03 |
1.76 |
1.79 |
4.48 |
![[thin space (1/6-em)]](https://www.rsc.org/images/entities/char_2009.gif) |
| Activation time |
| HHPB11700_60 |
1830.61 |
577.15 |
1253.46 |
0.25 |
0.85 |
1.09 |
5.58 |
| HHPB11700_120 |
1899.31 |
1612.51 |
286.80 |
0.68 |
0.23 |
0.91 |
1.91 |
| HHPB11700_150 |
1746.26 |
156.91 |
1589.35 |
0.06 |
0.84 |
0.90 |
3.25 |
Fig. 5a and b presents the nitrogen adsorption–desorption isotherms at 77 K for HHPB samples. The shape of the isotherms looks different before and after activation at different KOH ratios and temperatures. The none activated sample, CHHPB700_60 afforded type II isotherm representing unhindered monolayer–multilayer adsorption quintessential for non-porous materials. Its activated counterparts, samples HHPB11650_60, HHPB11700_60, HHPB12700_60 HHPB13700_60 and HHPB11750_60 samples showed type IV isotherms typical for mesoporous materials with H4 type hysteresis loops between 0.4 and 1.0 relative pressure,30 which is associated with the slit-shaped pores or particles with internal voids of irregular shape and broad size distribution.31
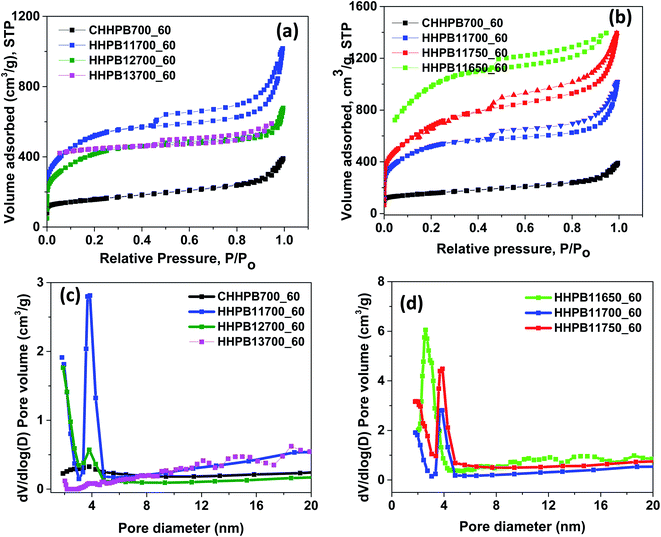 |
| | Fig. 5 (a and b) Nitrogen adsorption–desorption isotherms (c and d) pore size distribution of HHPB samples at different activation KOH ratios and temperatures. | |
The pore size distributions of HHPB samples were analyzed by and BJH (Barrett–Joyner–Halenda) method and presented in Fig. 5c and d. It was observed that non-activated sample, CHHPB700_60 afforded very low differential volume and almost a flat pore size distribution curve with a small hump around 4 nm, Fig. 5c. This together with the fact that the sample did not show any hysteresis loop (Fig. 5a) is indicative of its non-porous nature. At KOH activation ratio of 1, a sharp pore size distribution peak centered at around 4 nm and high differential volume was observed, Fig. 5c, which is in agreement with the relatively large hysteresis loop size observed for the same sample. Though the pore size distribution peak remained at around 4 nm, increasing KOH ratio to 2 dramatically reduced the differential volume (Fig. 5c) and the size of the hysteresis loop (Fig. 5a). Further increase in KOH ratio to 3 led to an almost flat pore size distribute curve with the lowest differential pore volume in the entire pore size range, Fig. 5c. The highest differential volume and relatively large hysteresis loop at KOH ratio of 1 show that the removal of inorganics and volatilization of extractibles from the carbon precursor by the KOH thereby creating a high number of mesopores was successful. The reduction of differential pore volume and pore size distribution peak with increase in KOH ratio implies lose of mesoporosity by the destruction of walls separating adjacent pores by the KOH. Similarly, an increase in activation temperature decreased the differential pore volume and shifted pore distribution peak to high pore diameter, Fig. 5d. This is probably due to carbon microstructure coarsening and crystallites growth during graphitization process at high temperatures leading to fusion of adjacent mesopores thereby forming bigger pores.
Electrochemical performance
Electrochemical studies were performed to assess the performance of HHPB based supercapacitor in two electrode system. Fig. 6a–d presents the CV curves of electrodes made from different HHPB samples at scan rate of 5 to 200 mV s−1. From Fig. 6 it can be observed that, all CV curves of HHPB electrodes exhibited relatively regular rectangular shapes at all scan rates, attesting to their ideal EDL capacitance behavior of the produced carbon. Moreover, there was no noticeable distortion (polarization) of the CV curves from the standard rectangular shape indicating that the electrodes still allow smooth and easy penetration of the electrolyte ions during charge and discharge cycles even at higher scan rates, Fig. 6b. It is worth noting that the electrodes prepared from HHPB11750_60 and HHPB13700_60 samples show high area under the CV curves at scan rate of 5 mV s−1 when compared to non-activated sample, CHHPB700_60. This is an indication that they possess large specific capacitance (Fig. 6c and d). We deduce this may be due to their high surface areas and structural defects compared to that of CHHPB700_60.
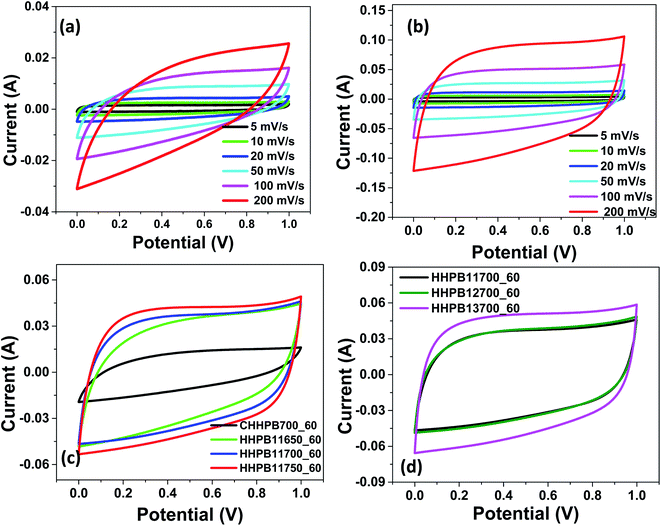 |
| | Fig. 6 CV curves of (a) CHHPB700_60 (b) HHPB13700_60 at different scan rates, (c) and (d) different electrodes prepared from HHPB samples activated different temperature and KOH ratios, at 5 mV s−1. | |
Fig. 7a represents the CCD curves of the HHPB13700_60 electrode at current density of 0.5 to 5 A g−1 while Fig. 7b and c shows CCD curves of electrodes from different HHPB samples prepared at different activation temperatures and KOH ratios at current density of 0.5 A g−1, respectivelyrespectively. All CCD curves exhibit a regular triangular shape signifying their ideal EDL capacitance and good charge–discharge reversibility which are in good agreement with the CV plots presented earlier. The charge–discharge time for HHPB11750_60 and HHPB11700_60 electrodes is higher than that of the HHPB11650_60 indicating that the specific capacitance increased with increase in activation temperature. It is also worth to note that, charge–discharge time for HHPB13700_60 electrodes is larger than that of HHPB12700_60 and HHPB11700_60 showing that capacitance increased with increase in activating KOH ratio (Fig. 7c). This superior performance is attributed to its high BET surface area that provided a larger number of active site for the electrolyte ions. Commercial activated carbon (AC) posted substantially larger IR drop and shorter charge–discharge time compared to all HHPB carbon based electrodes demonstrating the superior electrochemical performance of the carbon materials prepared in our study, Fig. 7d.
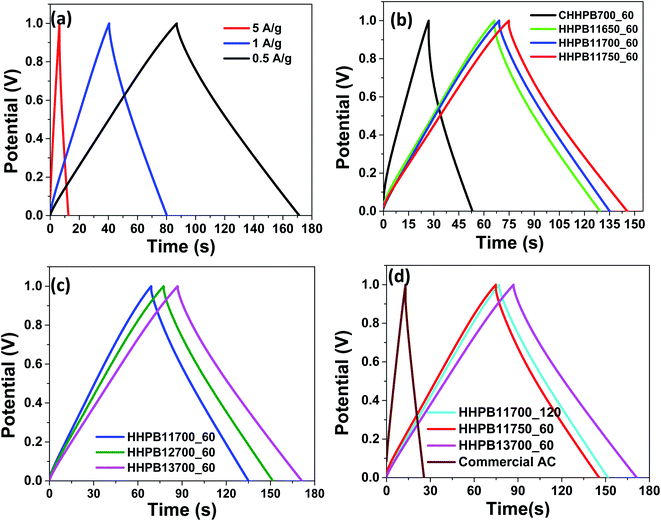 |
| | Fig. 7 CCD curves of (a) HHPB13700_60 at different current densities (b and c) HHPB samples prepared at different activation temperature and KOH ratios at 0.5 A g−1 (d) commercial AC compared with different HHPB samples at current density of 0.5 A g−1 in two electrode systems. | |
Fig. 8 and 9 illustrate the specific capacitances of different devices made from different HHPB samples at different scan rates and current densities as calculated using eqn (1) and (2), respectively. The specific capacitance of all HHPB based cells decreased with the increase in scan rate from 5 to 200 mV s−1 and current density from 0.5 to 10 A g−1 due to limited time of electrolyte to infiltrate to the pores of the electrode materials.32
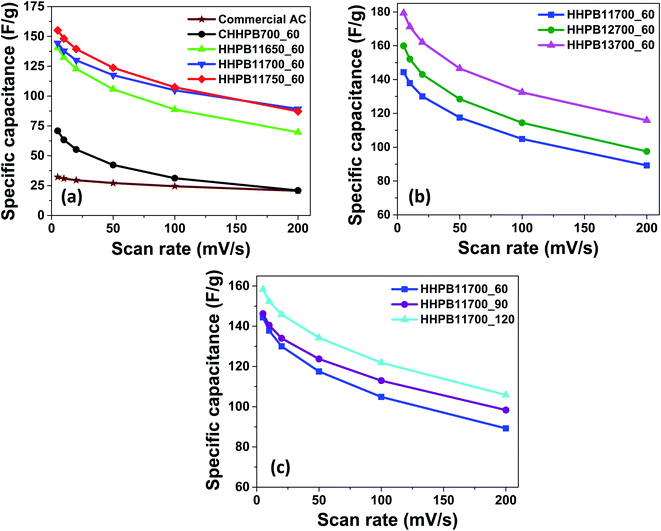 |
| | Fig. 8 Specific capacitance of HHPB samples and commercial AC at different scan rates calculated from CV by varying activation (a) temperature (b) KOH ratio (c) time. | |
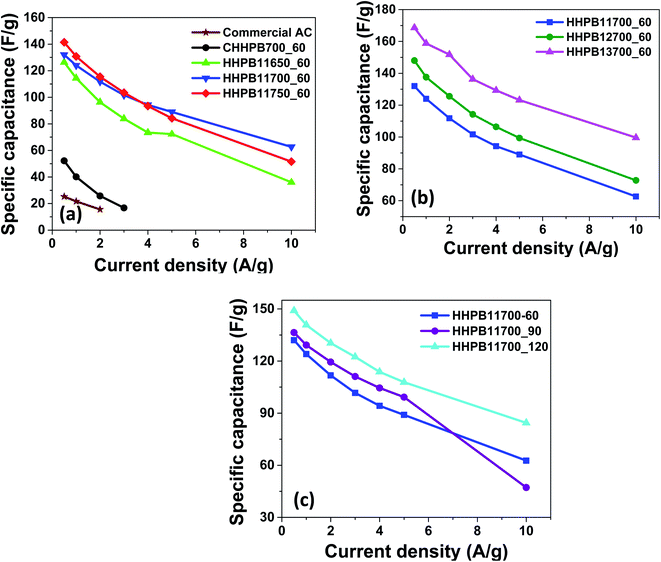 |
| | Fig. 9 Specific capacitance of HHPB samples and commercial AC at different current densities as calculated from CCD by varying activation (a) temperature (b) ratio (c) time. | |
Effect of combined activation conditions on carbon yield and electrochemical performance
Activating agent ratio is one among the factors that greatly influence physical properties and electrochemical performance of biomass-based carbon materials for supercapacitor applications. At 650 °C and 60 min activation conditions, specific capacitance increased to a maximum at KOH ratio of 2 then dropped, Fig. 10a. This trend was the same for 90 and 120 min activation time, Fig. 10b and c. Increasing activating KOH ratio from 1 to 3 increased specific capacitance consistently for samples activated at 700 °C for 60 and 90 min as shown in Fig. 10a and b. Contrary, the specific capacitance decreased consistently as the KOH ratio increased from 1 to 3 at 700 °C and 120 min, Fig. 10c. Increasing activation KOH ratio, time, and temperature above 1, 90 min, and 700 °C, respectively, led to burning out of all the sample. On the other hand, specific capacitance increased with time only for samples prepared at KOH ratio 1 at 700 °C activation temperature, Fig. 10a–c. Thus the optimum activation conditions for producing carbon materials with high specific capacitance from palm bark are KOH ratio 3, 700 °C, and 60 min (HHPB13700_60) which attained the highest specific capacitance of 179.3 and 169 F g−1 from CV and CCD at scan rate of 5 mV s−1 and current density of 0.5 A g−1, respectively, for a 2 electrodes supercapacitor device.
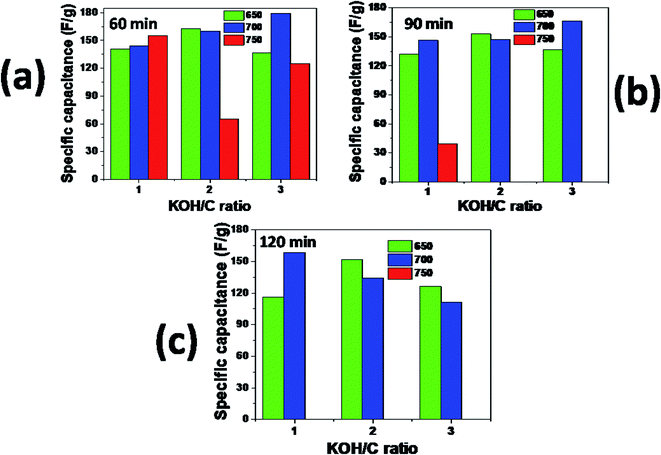 |
| | Fig. 10 Specific capacitance of HHPB samples activated at different KOH/C ratio, temperature and time as calculated from CV curves at scan rate of 5 mV s−1, (a) 60 min, (b) 90 min, and (c) 120 min(a) 60 min, (b) 90 min, and (c) 120 min. | |
Moreover, it has been reported that mesoporous structure and large surface area facilitate fast electrolyte ions transfer thereby enhancing specific capacitance.33 But this is not always the case. As shown in Table 2, sample HHPB13700_60 with surface area of 1509.79 m2 g−1 attained the highest specific capacitance of 169 F g−1 while sample HHPB11650_60 with surface area of 3572.03 m2 g−1 attain specific capacitance of 148 F g−1. This is indicative of the fact that BET surface area is not the main factor influencing the electrochemical performance. Further analysis of micro to mesopores volume ratio (Vmicro/Vmeso) showed that for all the activation parameters: carbon/KOH ratio; temperature and time, the specific capacitance and hence the performance of the supercapacitor device was highest when Vmicro/Vmeso was largest, Table 2.
Table 2 Relationship between BET surface area, Vmicro and Vmeso with specific capacitance
| Sample |
BET (m2 g−1) |
Vmicro (cm3 g−1) |
Vmeso (cm3 g−1) |
Vmicro/Vmesoa |
SPb (F g−1) |
| Ratio of micropore to mesopore volume. Specific capacitance. |
| Activating ratio |
| CHHPB700_60 |
532.50 |
0.10 |
0.35 |
0.29 |
52 |
| HHPB11700_60 |
1830.61 |
0.25 |
0.85 |
0.29 |
132 |
| HHPB12700_60 |
1478.11 |
0.09 |
0.55 |
0.16 |
148 |
| HHPB13700_60 |
1509.79 |
0.62 |
0.30 |
2.07 |
169 |
![[thin space (1/6-em)]](https://www.rsc.org/images/entities/char_2009.gif) |
| Activating temperature |
| HHPB11650_60 |
3572.03 |
1.10 |
1.06 |
1.04 |
148 |
| HHPB11700_60 |
1830.61 |
0.25 |
0.85 |
0.29 |
132 |
| HHPB11750_60 |
2453.56 |
0.03 |
1.76 |
0.02 |
141 |
![[thin space (1/6-em)]](https://www.rsc.org/images/entities/char_2009.gif) |
| Activating time |
| HHPB11700_60 |
1830.61 |
0.25 |
0.85 |
0.29 |
132 |
| HHPB11700_120 |
1899.31 |
0.68 |
0.23 |
2.96 |
149 |
Electrochemical impedance spectroscopy (EIS) was performed and the impedance spectra of HHPB samples at different activation conditions are shown in Fig. 11. The Nyquist plots Fig. 11a–c consists of two main regions: the semi-circle at the high-frequency region where its diameter represent the charge transfer resistance of electrodes and the solution interface and the straight line in low frequency, showing the EDL capacitance behavior. The charge transfer resistance decreased with increase in activation temperature from 650 to 750 °C (Fig. 11a), activation KOH ratio (Fig. 11b) and time (Fig. 11c). The intercept at the Zreal axis shows the equivalent series resistance (ESR) or internal resistance of the electrode. As seen in inserts of Fig. 11a–c representing the enlargement of the high-frequency region, all ESR values are around 0.25 Ω indicating good electrical conductivity and fast exchange of ions between the electrode and electrolyte interface. The semicircle of commercial AC is larger than that of HHPB samples implying its high charge transfer resistance and IR drop and thus its poor electrochemical performance in supercapacitor device in terms of specific capacitance, Fig. 9a, and power and energy density, Fig. 12f.
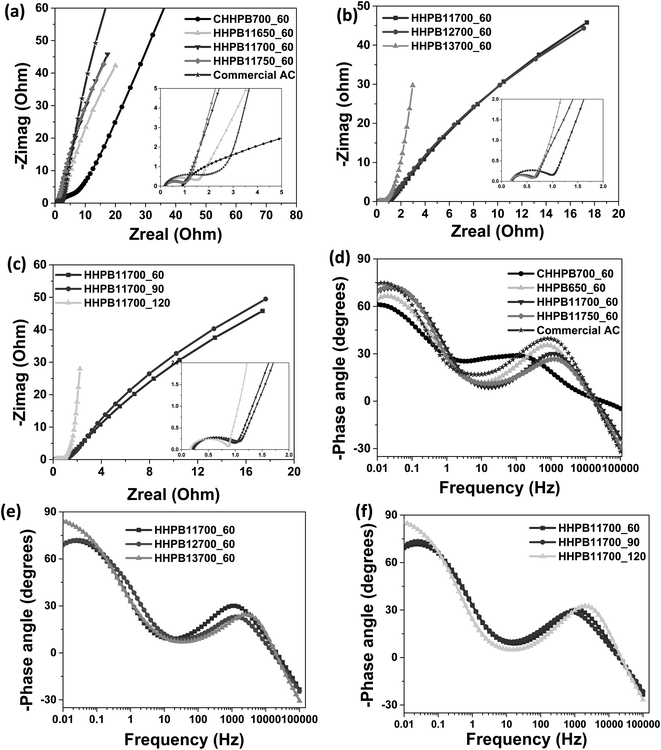 |
| | Fig. 11 (a–c) Nyquist and (d–f) Bode plots of HHPB samples at different activation temperatures, KOH ratios, and time. | |
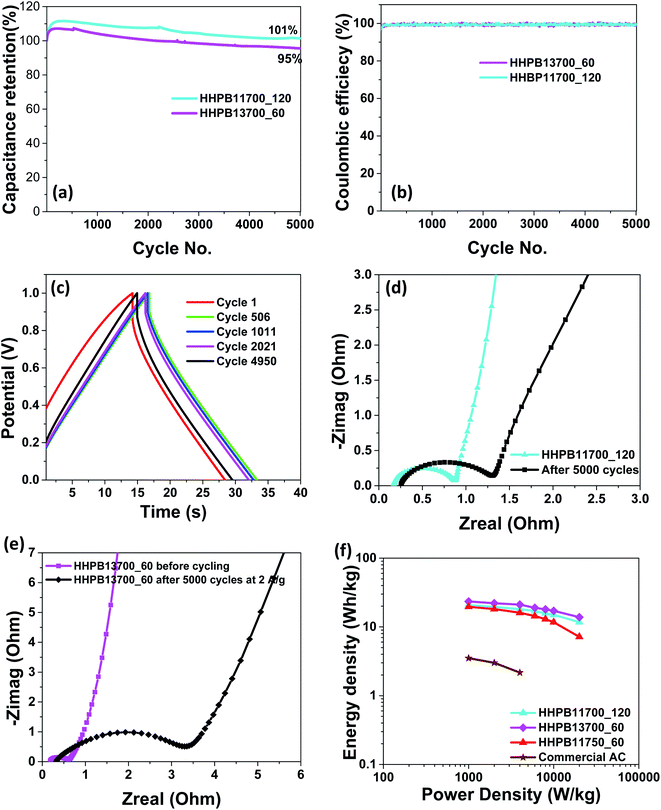 |
| | Fig. 12 (a) Capacitance retention of HHPB13700_60 and HHPB11700_120 at current density 2 A g−1 (b) coulombic efficiency of HHPB13700_60 and HHPB11700_120 at current density 2 A g−1 (c) CCD curves of HHPB13700_60 at 1st, 506th, 1011th, 2021st, and 4950th cycle (d) Nyquist plot of HHPB11700_120 before and after 5000 charge–discharge cycles at 2 A g−1 (e) Nyquist plot of HHPB13700_60 before and after 5000 charge–discharge cycles at 2 A g−1 (f) Ragone plot of HHPB samples compared with commercial AC. | |
Fig. 11d–f represents the relationship between the phase angle and the frequency. Activation conditions were found to have different effects on the phase angle. For instance, increasing activation temperature from 650 to 750 °C at low frequency, the phase angle increased from −64 to −70°, Fig. 11d. Introducing activating agent at different ratios from 0 to 3 caused the phase angle to increased from −61° for non-activated sample, CHHPB700_60, to −84° for HHPB13700_60 which is very close to that of an ideal capacitor of −90, Fig. 11e. This explains the good capacitive behavior (highest specific capacitance) demonstrated by these materials. Likewise the phase angle increased from −70 to −85° as activation time increase from 60 to 120 min, Fig. 11f.
Cycling stability of the electrode material is a significant parameter to consider in energy storage applications. Therefore, cycling stability of HHPB13700_60 and HHPB11700_120 in two electrode system was studied by measuring 5000 charge–discharge cycles at current density of 2 A g−1. HHPB11700_120 and HHPB13700_60 electrodes retain 101 and 95% of its capacitance, respectively, after 5000 CCD cycles with 100% coulomb efficiency, Fig. 12a and b, approving the suitability of the HHPB materials for supercapacitor device. The HHPB-based device shows excellent charge–discharge cycling behavior as demonstrated by the increase in charge–discharge time and reduction in IR drop in the first 2021 cycles, Fig. 12c, attributed to electrochemical activation of the electrodes.
Furthermore, EIS measurement of HHPB13700_60 and HHPB11700_120 devices were carried out after 5000 charge discharge cycles cycling at 2 A g−1 and presented in Fig. 12d and e. It can be seen that both plots shows a semicircle and a straight line in the high and low frequency regions, respectively. The straight line in the low frequency region after cycling is more slanted than before cycling, indicating low ions diffusion and mass transport at electrode/electrolyte interface. Also, the diameter of the semicircle in the EIS spectra increased after 5000 charge–discharge cycles implying increase in charge transfer resistance arising from longer ion/electron transport pathway as also revealed by Agudosi et al.34 From Nyquist plot, the charge transfer resistances of HHPB11700_120 device increased from 0.70 Ω (before cycling) to 1.05 Ω (after cycling) while that of HHPB13700_60 the device increase from 0.47 Ω (before cycling) to 3.8 Ω (after cycling).
The power and energy densities are crucial parameters to consider for supercapacitor applications and are commonly plotted on Ragone plots. Fig. 12f shows the Ragone plot of different HHPB electrodes whereby HHPB13700_60 based supercapacitor device afforded the highest energy density compared to other HHPB samples and 7 times greater than that of commercial AC. The electrochemical performance of HHPB materials prepared in our study is relatively higher than that of other biomass based carbon materials presented in the literature, Table 3.
The result from this study shows that electrodes derived from palm barks have a good rate capability compared to some other biomass-based carbon presented in literature as summarized in Table 3 suggesting that it can be utilized in devices that need fast charging process.
Table 3 Performance of different biomass-based carbon for supercapacitor applicationsa
| Carbon source |
Activation route |
BET SSA (m2 g−1) |
Electrode configuration |
Electrolyte |
SPC* (F g−1) |
CR* (%) |
Ref. |
| SPC* = specific capacitance, CR* = capacitance retention. |
| Coconut kernel pulp (milk free) |
KOH activation |
1200 |
2 electrode system |
1 M TEABF4 in PC |
56 at 0.25 A g−1 |
100% at 1 A g−1 after 2000 cycles |
35 |
| Fallen leaves |
Mixed KOH and K2CO3 |
1078 |
2 electrode |
6 M KOH |
223 at 0.5 A g−1 |
∼100% at 1 A g−1 after 2000 cycles |
36 |
| Sugar cane bagasse |
ZnCl2 |
1155 |
2 electrode |
1 M H2SO4 |
300 |
77 at 5 A g−1 |
37 |
| Starch |
Stabilization, carbonization followed by KOH activation |
3251 |
2 electrode |
6 M KOH |
304 at 0.05 A g−1 |
98 at 40 A g−1 after 10![[thin space (1/6-em)]](https://www.rsc.org/images/entities/char_2009.gif) 000 cycles 000 cycles |
38 |
| Fructose corn syrup |
Hydrothermal followed by physical self-activation |
1223 |
2 electrode |
6 M KOH |
168 at 0.2 A g−1 |
∼83 at 0.5 A g−1 after 2000 cycles |
39 |
| Fan palm barks |
KOH |
1509.79 |
2 electrode |
6 M KOH |
169 at 0.5 A g−1 |
95 at 2 A g−1 after 5000 cycles |
This study |
Conclusion
Plentiful and low cost Washingtonia robusta barks (Mexican fan palm) were used to successfully synthesize good carbon materials for 2 electrode supercapacitor device via by hydrothermal treatment followed by KOH chemical activation. The electrochemical studies shows that the specific capacitance of the supercapacitor device was affected by material preparation parameters including activation temperature, impregnation ratio and time. Both the charge transfer and Warburg resistance were found to decrease and phase angle increase towards the idea −90° with increase in activation KOH ratio, temperature, and time. The symmetric supercapacitor device made from HHPB13700_60 sample attained a specific capacitance of 179.3 and 169 F g−1 from CV and CCD at scan rate of 5 mV s−1 and current density of 0.5 A g−1, respectively. The device exhibits capacitance retention of 95 and 100% coulombic efficiency after 5000 charge–discharge cycles. The supercapacitor devices exhibited perfect EDLC behavior with approximate energy densities of 20 W h kg−1 at power density of 2000 W kg−1. These findings show that carbon materials derived from palm barks have a huge potential in supercapacitor device applications.
Author contributions
Joyce Elisadiki: conceptualization, methodology, investigation, validation, formal analysis, writing – original draft. Mavis K. Gabookolwe: investigation and writing–reviewing and editing. Oluwatayo R. Onisuru: investigation and writing-reviewing and editing. Reinout Meijboom: resources and writing-reviewing and editing. Cosmas Muiva: formal analysis and writing-reviewing and editing. Cecil K. King'ondu: supervision, conceptualization, formal analysis, methodology, resources, project administration, funding acquisition and writing-reviewing and editing.
Conflicts of interest
The authors declare that they have no competing interests.
Acknowledgements
We acknowledge the Royal Society in partnership with the African Academy of Sciences under grant FLR\R1\190535 for material and financial support.
References
- L. L. Zhang and X. S. Zhao, Carbon-based materials as supercapacitor electrodes, Chem. Soc. Rev., 2009, 38, 2520–2531, 10.1039/b813846j.
- Y. Wang and Y. Xia, Recent progress in supercapacitors: from materials design to system construction, Adv. Mater., 2013, 25, 5336–5342, DOI:10.1002/adma.201301932.
- X. Xu, J. Gao, Q. Tian, X. Zhai and Y. Liu, Walnut shell derived porous carbon for a symmetric all-solid-state supercapacitor, Appl. Surf. Sci., 2017, 411, 170–176, DOI:10.1016/j.apsusc.2017.03.124.
- P. Sharma and T. S. Bhatti, A review on electrochemical double-layer capacitors, Energy Convers. Manage., 2010, 51, 2901–2912, DOI:10.1016/j.enconman.2010.06.031.
- M. Inagaki, H. Konno and O. Tanaike, Carbon materials for electrochemical capacitors, J. Power Sources, 2010, 195, 7880–7903, DOI:10.1016/j.jpowsour.2010.06.036.
- A. M. Abioye and F. N. Ani, Recent development in the production of activated carbon electrodes from agricultural waste biomass for supercapacitors: A review, Renewable Sustainable Energy Rev., 2015, 52, 1282–1293, DOI:10.1016/j.rser.2015.07.129.
- J. Phiri, J. Dou, T. Vuorinen, P. A. C. Gane and T. C. Maloney, Highly Porous Willow Wood-Derived Activated Carbon for High Performance Supercapacitor Electrodes, ACS Omega, 2019, 4, 18108–18117, DOI:10.1021/acsomega.9b01977.
- T. K. Enock, C. K. King’ondu, A. Pogrebnoi and Y. A. C. Jande, Biogas-slurry derived mesoporous carbon for supercapacitor applications, Mater. Today Energy, 2017, 5, 126–137, DOI:10.1016/j.mtener.2017.06.006.
- K. Sirengo, Y. A. C. Jande, T. E. Kibona, A. Hilonga, C. Muiva and C. K. King'ondu, Fish bladder-based activated carbon/Co3O4/TiO2 composite electrodes for supercapacitors, Mater. Chem. Phys., 2019, 232, 49–56, DOI:10.1016/j.matchemphys.2019.04.059.
- M. Shanmuga Priya, P. Divya and R. Rajalakshmi, A review status on characterization and electrochemical behaviour of biomass derived carbon materials for energy storage supercapacitors, Sustainable Chem. Pharm., 2020, 16, 100243, DOI:10.1016/j.scp.2020.100243.
- T. K. Enock, C. K. King’ondu, A. Pogrbnoi and Y. A. C. Jande, Status of Biomass Derived Carbon Materials for Supercapacitor Application, Int. J. Electrochem., 2017, 2017, 1–14, DOI:10.1155/2017/6453420.
- S. Lin, F. Wang and Z. Shao, Biomass applied in supercapacitor energy storage devices, J. Mater. Sci., 2020, 56, 1943–1979, DOI:10.1007/s10853-020-05356-1.
- M. D. Stoller and R. S. Ruoff, Review of Best Practice Methods for Determining an Electrode Material's Performance for Ultracapacitors, Energy Environ. Sci., 2010, 3, 1294–1301, 10.1039/C0EE00074D.
- M. T. Audu and A. A. Jimoh, Chemical Components of Fan Palm and its Durability in Severe Environment, World Sci. News, 2015, 24, 90–102 CAS.
- C. Chen, D. Yu, G. Zhao, L. Sun, Y. Sun, K. Leng, M. Yu and Y. Sun, Hierarchical porous graphitic carbon for high-performance supercapacitors at high temperature, RSC Adv., 2017, 7, 34488–34496, 10.1039/c7ra06234f.
- Z. Peng, Y. Zou, S. Xu, W. Zhong and W. Yang, High-Performance Biomass-Based Flexible Solid-State Supercapacitor Constructed of Pressure-Sensitive Lignin-Based and Cellulose Hydrogels, ACS Appl. Mater. Interfaces, 2018, 10, 22190–22200, DOI:10.1021/acsami.8b05171.
- V. Ramasubbu, F. S. Omar, K. Ramesh, S. Ramesh and X. S. Shajan, Three-dimensional hierarchical nanostructured porous TiO2 aerogel/Cobalt based metal-organic framework (MOF) composite as an electrode material for supercapattery, J. Energy Storage, 2020, 32, 101750, DOI:10.1016/j.est.2020.101750.
- B. Pandit, D. P. Dubal and B. R. Sankapal, Large scale flexible solid state symmetric supercapacitor through inexpensive solution processed
V 2 O 5 complex surface architecture, Electrochim. Acta, 2017, 242, 382–389, DOI:10.1016/j.electacta.2017.05.010.
- Q. Gong, Y. Li, H. Huang, J. Zhang, T. Gao and G. Zhou, Shape-controlled synthesis of Ni-CeO2@PANI nanocomposites and their synergetic effects on supercapacitors, Chem. Eng. J., 2018, 344, 290–298, DOI:10.1016/j.cej.2018.03.079.
- R. Kumar, T. Bhuvana and A. Sharma, Tire Waste Derived Turbostratic Carbon as an Electrode for a Vanadium Redox Flow Battery, ACS Sustainable Chem. Eng., 2018, 6, 8238–8246, DOI:10.1021/acssuschemeng.8b00113.
- E. A. Belenkov, Formation of Graphite Structure in Carbon Crystallites, Inorg. Mater., 2001, 37, 928–934, DOI:10.1023/A:1011601915600.
- A. J. Romero-Anaya, M. Ouzzine, M. A. Lillo-Ródenas and A. Linares-Solano, Spherical carbons: Synthesis, characterization and activation processes, Carbon, 2014, 68, 296–307, DOI:10.1016/j.carbon.2013.11.006.
- Y. Dong, S. Zhang, X. Du, S. Hong, S. Zhao, Y. Chen, X. Chen and H. Song, Boosting the Electrical Double-Layer Capacitance of Graphene by Self-Doped Defects through Ball-Milling, Adv. Funct. Mater., 2019, 29, 1901127, DOI:10.1002/adfm.201901127.
- J. Hou, K. Jiang, R. Wei, M. Tahir, X. Wu, M. Shen, X. Wang and C. Cao, Popcorn-Derived Porous Carbon Flakes with an Ultrahigh Specific Surface Area for Superior Performance Supercapacitors, ACS Appl. Mater. Interfaces, 2017, 9, 30626–30634, DOI:10.1021/acsami.7b07746.
- L. J. Kennedy, T. Ratnaji, N. Konikkara and J. J. Vijaya, Value added porous carbon from leather wastes as potential supercapacitor electrode using neutral electrolyte, J. Clean. Prod., 2018, 197, 930–936, DOI:10.1016/j.jclepro.2018.06.244.
- S. Ghosh and A. R. Barron, The effect of KOH concentration on chemical activation of porous carbon sorbents for carbon dioxide uptake and carbon dioxide–methane selectivity: the relative formation of micro- (<2 nm) versus meso- (>2 nm) porosity, Sustain. Energy Fuels, 2017, 1, 806–813, 10.1039/c6se00102e.
- A.-N. A. El-Hendawy, An insight into the KOH activation mechanism through the production of microporous activated carbon for the removal of Pb2+ cations, Appl. Surf. Sci., 2009, 255, 3723–3730, DOI:10.1016/j.apsusc.2008.10.034.
- T. S. Hui and M. A. A. Zaini, Potassium hydroxide activation of activated carbon: a commentary, Carbon Letters, 2015, 16, 275–280 CrossRef.
- J. Wang and S. Kaskel, KOH activation of carbon-based materials for energy storage, J. Mater. Chem., 2012, 22, 23710, 10.1039/c2jm34066f.
- K. Xu, X. Jiang, Q. Gong, Y. Ren, T. Gao, Y. He, X. Xu, P. Cao and G. Zhou, The design and synthesis of Ni3S4/Co3S4 heterostructure@mesoporous carbon with hybrid-capacitance, Mater. Lett., 2021, 290, 129489, DOI:10.1016/j.matlet.2021.129489.
- G.-J. Lee and S.-I. Pyun, Synthesis and characterization of nanoporous carbon and its electrochemical application to electrode material for supercapacitors, in Modern aspects of electrochemistry, ed. V. Vayenas, Springer, 2007, pp. 139–195 Search PubMed.
- N. Mishra, S. Shinde, R. Vishwakarma, S. Kadam, M. Sharon and M. Sharon, MWCNTs synthesized from waste polypropylene plastics and its application in super-capacitors, AIP Conf. Proc., 2013, 1539, 228–236 CrossRef.
- S. Chaisit, N. Chanlek, J. Khajonrit, T. Sichumsaeng and S. Maensiri, Preparation, characterization, and electrochemical properties of KOH-activated carbon from cassava root, Mater. Res. Express, 2020, 7, 105605, DOI:10.1088/2053-1591/abbf84.
- E. S. Agudosi, E. C. Abdullah, A. Numan, N. M. Mubarak, S. R. Aid, R. Benages-Vilau, P. Gomez-Romero, M. Khalid and N. Omar, Fabrication of 3D binder-free graphene NiO electrode for highly stable supercapattery, Sci. Rep., 2020, 10, 11214, DOI:10.1038/s41598-020-68067-2.
- B. Kishore, D. Shanmughasundaram, T. R. Penki and N. Munichandraiah, Coconut kernel-derived activated carbon as electrode material for electrical double-layer capacitors, J. Appl. Electrochem., 2014, 44, 903–916, DOI:10.1007/s10800-014-0708-9.
- Y.-T. Li, Y.-T. Pi, L.-M. Lu, S.-H. Xu and T.-Z. Ren, Hierarchical porous active carbon from fallen leaves by synergy of K2CO3 and their supercapacitor performance, J. Power Sources, 2015, 299, 519–528, DOI:10.1016/j.jpowsour.2015.09.039.
- T. E. Rufford, D. Hulicova-Jurcakova, K. Khosla, Z. Zhu and G. Q. Lu, Microstructure and electrochemical double-layer capacitance of carbon electrodes prepared by zinc chloride activation of sugar cane bagasse, J. Power Sources, 2010, 195, 912–918, DOI:10.1016/j.jpowsour.2009.08.048.
- S. H. Du, L. Q. Wang, X. T. Fu, M. M. Chen and C. Y. Wang, Hierarchical porous carbon microspheres derived from porous starch for use in high-rate electrochemical double-layer capacitors, Bioresour. Technol., 2013, 139, 406–409, DOI:10.1016/j.biortech.2013.04.085.
- W. Cao and F. Yang, Supercapacitors from high fructose corn syrup-derived activated carbons, Mater. Today Energy, 2018, 9, 406–415, DOI:10.1016/j.mtener.2018.07.002.
|
| This journal is © The Royal Society of Chemistry 2022 |
Click here to see how this site uses Cookies. View our privacy policy here.  Open Access Article
 c,
Cosmas Muivad and
Cecil K. King'ondu
 *ae
*ae
![[thin space (1/6-em)]](https://www.rsc.org/images/entities/char_2009.gif) :
:![[thin space (1/6-em)]](https://www.rsc.org/images/entities/char_2009.gif) 2 volume ratios) to make viscous slurry which was pasted on nickel foam pieces of 3.14 cm2. The electrodes were oven dried at 60 °C overnight to evaporate the solvent. The total mass of active material on single electrode was calculated by taking the mass difference between the nickel foam before and after coating. The total weight of active materials on both electrodes varied from 12–16 mg. EIS measurements were done at open circuit potential with the amplitude of 5 mV at a frequency range of 100 kHz to 10 mHz.
2 volume ratios) to make viscous slurry which was pasted on nickel foam pieces of 3.14 cm2. The electrodes were oven dried at 60 °C overnight to evaporate the solvent. The total mass of active material on single electrode was calculated by taking the mass difference between the nickel foam before and after coating. The total weight of active materials on both electrodes varied from 12–16 mg. EIS measurements were done at open circuit potential with the amplitude of 5 mV at a frequency range of 100 kHz to 10 mHz.


 symbolizes the area under the CV curve, m is the total mass (g) of active materials in both electrode, ν is the scan rate (V s−1), ΔV is the potential window (V), Vf and Vi (V) are final and initial potential limit of the CV tests, I is the discharge current (A) and Δt is the discharge time (s).


![[thin space (1/6-em)]](https://www.rsc.org/images/entities/char_2009.gif) 313.85 to 1253.46 m2 g−1 and from 0.36 to 0.85 cm3 g−1 respectively. As KOH ratio increases further to 3, the mesopores surface area and volume decreased to 169.3 m2 g−1 and 0.3 cm3 g−1 respectively. These results demonstrate the strong influence of KOH amount on the textural properties of the HHPB samples especially in the formation of mesopores. The formation mechanism of porosity in carbon at different KOH concentrations is a very complex process which follows several steps as depicted by eqn (5)–(11). Normally, the KOH etchant reacts with carbon generating the alkali metal (K), alkali compounds (K2O and K2CO3), and H2 gas in several steps as per eqn (5) and (6). The whole process can be explained as follows: at lower temperature around 400 °C dehydration of KOH to K2O occurs (eqn (6)). Water (H2O) then react with C and CO to form H2 as per eqn (7) and (8) followed by carbonate formation, eqn (9). At temperatures higher than 700 °C, the carbonates decompose into CO2 and K2O, eqn (10). The K2O formed is then reduced by carbon to form metallic potassium (K), eqn (11), which intercalate between carbon layers. During washing with HCl and water, the intercalated metallic K and other compounds containing K are removed resulting into expanded carbon lattices that cannot return to their earlier structure therefore pores that are essential for charge storage are formed.27–29 Moreover, the surface area decreased from 3572.03 to 2453.56 m2 g−1 as temperature increased from 650 to 750 °C owing to carbon microstructure coarsening and crystallites growth during graphitization process at high temperatures.21 The pore sizes of all HHPB samples varied between 1.91–7.27 nm which represent mesoporous materials according to IUPAC pore size definition.
313.85 to 1253.46 m2 g−1 and from 0.36 to 0.85 cm3 g−1 respectively. As KOH ratio increases further to 3, the mesopores surface area and volume decreased to 169.3 m2 g−1 and 0.3 cm3 g−1 respectively. These results demonstrate the strong influence of KOH amount on the textural properties of the HHPB samples especially in the formation of mesopores. The formation mechanism of porosity in carbon at different KOH concentrations is a very complex process which follows several steps as depicted by eqn (5)–(11). Normally, the KOH etchant reacts with carbon generating the alkali metal (K), alkali compounds (K2O and K2CO3), and H2 gas in several steps as per eqn (5) and (6). The whole process can be explained as follows: at lower temperature around 400 °C dehydration of KOH to K2O occurs (eqn (6)). Water (H2O) then react with C and CO to form H2 as per eqn (7) and (8) followed by carbonate formation, eqn (9). At temperatures higher than 700 °C, the carbonates decompose into CO2 and K2O, eqn (10). The K2O formed is then reduced by carbon to form metallic potassium (K), eqn (11), which intercalate between carbon layers. During washing with HCl and water, the intercalated metallic K and other compounds containing K are removed resulting into expanded carbon lattices that cannot return to their earlier structure therefore pores that are essential for charge storage are formed.27–29 Moreover, the surface area decreased from 3572.03 to 2453.56 m2 g−1 as temperature increased from 650 to 750 °C owing to carbon microstructure coarsening and crystallites growth during graphitization process at high temperatures.21 The pore sizes of all HHPB samples varied between 1.91–7.27 nm which represent mesoporous materials according to IUPAC pore size definition.![[thin space (1/6-em)]](https://www.rsc.org/images/entities/char_2009.gif)
![[thin space (1/6-em)]](https://www.rsc.org/images/entities/char_2009.gif)


![[thin space (1/6-em)]](https://www.rsc.org/images/entities/char_2009.gif)
![[thin space (1/6-em)]](https://www.rsc.org/images/entities/char_2009.gif)

![[thin space (1/6-em)]](https://www.rsc.org/images/entities/char_2009.gif) 000 cycles
000 cycles


