 Open Access Article
Enhanced electrocatalytic performance of N-doped carbon xerogels obtained through dual nitrogen doping for the oxygen reduction reaction
Hong Jin *a,
Yongping Luo
 a,
Laihong Zhou*b,
Zonghu Xiaoa,
Fayun Zhanga,
Ping Huanga and
Chen Liua
aSchool of New Energy Science and Engineering, Xinyu University, Xinyu, Jiangxi 338004, China. E-mail: hjin00@126.com
bSchool of Mechanical and Electrical Engineering, Xinyu University, Xinyu, Jiangxi 338004, China. E-mail: lai_h@126.com
First published on 4th May 2022
Abstract
The development of high efficiency and low-cost electrocatalysts for the oxygen reduction reaction (ORR) is urgently desired for many energy storage and conversion systems. Nitrogen-doped carbon xerogels (NCXs) which have been successfully applied as effective electrocatalysts for the ORR have continued to attract attention due to their competitive price and tunable surface chemistry. A new dual N-doped NCX (NCoNC) electrocatalyst is fabricated as a carbon based catalyst though a facile impregnation of peptone in a precursor and ammonia etching pyrolysis method. XPS analysis demonstrates that the NCoNC electrocatalyst not only has a high N doping amount, but also has an optimized chemical state composition of N doping, which play an important role in improving the microstructure and catalytic performance of the catalysts. XRD and HRTEM results show that the doped metal nano-particles are coated with a double carbon layer of graphene carbon (inner layer) and amorphous carbon (outer layer) forming serrated edges that facilitate the ORR process. The as-obtained NCoNC catalyst exhibits good electrocatalytic performance and excellent stability for the ORR in both acidic and alkaline environments. In particular, in alkaline electrolyte, the decrements of both the limiting current density and the half-wave potential of the NCoNC catalyst were significantly lower than those of a commercial Pt/C catalyst during accelerated aging tests. When serving as an air electrode in Zn–air batteries, the catalyst also exhibits superior catalytic performance with a peak power density of 78.2 mW cm−2 and a stable open-circuit voltage of 1.37–1.43 V. This work presents a novel tactic to regulate the microstructure and composition of carbon-based electrocatalysts by the facile and scalable dual-effect nitrogen doping method which may be conducive to promoting and developing highly efficient and promising electrocatalysts for the ORR.
1 Introduction
Due to their high power density, good environmental friendliness and renewable energy storage and conversion technologies, metal–air batteries and fuel cells have attracted more and more attention. Among them, Zn–air batteries have been regarded as one of the most promising technologies for electric vehicles and other energy-demanding devices because of their large theoretical energy density, natural abundance and unlimited oxygen supply.1–3 The oxygen reduction reaction (ORR) is one of the most important chemical reactions in many renewable energy conversion technologies involving oxygen such as the air cathode of Zn–air batteries. To date, although Pt based nanocatalysts are still the most excellent ORR cathode catalysts with remarkable catalytic performance, it is difficult to achieve large-scale promotion and application because of the high cost and scarce sources of Pt.4,5At present, the development of low cost and high activity carbon-based catalysts has become the most popular and promising research direction in the field of ORR catalysis.6,7 Carbon-based catalysts mainly refer to heteroatom-doped carbon-based electrocatalytic materials such as nitrogen-doped carbon nanotubes, graphene and graphitic arrays usually exhibits a high electrocatalytic activity, extraordinary stability and superior methanol tolerance.8–11 Among these different N-doped carbon based catalysts suggested as alternatives to Pt/C catalyst, N-doped carbon xerogel (NCX) continues to attract a lot of attention due to its controllable structure, tunable surface properties, economical efficiency and easily scaled-up preparation.12,13 Moreover, both the amount and type of doped nitrogen have significantly effects on the surface states of NCX material and the reduction behavior of oxygen on its surface. In addition, transition metals also have been reported to contribute to the incorporation of nitrogen atom into the carbon lattice, forming highly reactive C–N structures serve to ORR.14,15
Previously, NCX has been proved to be a promising ORR catalyst in both acid media (proton exchange membrane fuel cells) and alkaline media (direct methanol alkaline fuel cell and direct borohydride fuel cell).16–18 Pyrolytic ammonia etching is a feasible doping method for NCX catalyst as reported in previous studies.12,19 However, the amount of N doped into the carbon matrix that can participate in the reaction in this method is extremely limited, because the N doping is mainly concentrated on the accessible surface of sample by the high temperature treatment of the catalysts. Therefore, in order to enhance the doping effect of NCX catalyst, in this work, a new dual N-doped NCX electrocatalyst (NCoNC) was prepared by a compound dual N doping scheme using organic synthetic doping and pyrolytic doping to realize high effective N doping and improve the chemical configuration of NCX catalyst in substrate as well as surface layer. The correlations between the formation of chemical configuration of the catalysts towards their electrocatalytic performance for ORR were discussed further in the following section. The mechanism analysis of ORR demonstrates that the ORR catalyzed by NCoNC is almost dominated by a direct four electron pathway both in alkaline electrolyte and in acidic electrolyte. Additionally, NCoNC catalyst shows remarkably better stability than commercial Pt/C catalyst especially in alkaline media. This work also creates an avenue to develop high effective N-doped carbon composite ORR electrocatalysts by dual or multifarious-effect N doping scheme.
2 Experimental
2.1 Catalyst preparation
The resorcinol, formaldehyde, nitrogen and cobalt (RFNCo) composite xerogel precursor was prepared by polymerization of resorcinol, formaldehyde, cobalt acetate and peptone according to our previously reported literature with slight modification.18 The NCoNC composite electrocatalyst was prepared by high temperature pyrolysis of RFNCo xerogel precursor in ammonia for carbonization and further N doping. The preparation process of RFNCo xerogel precursor was as follows: firstly, 6.16 g (0.056 mol) resorcinol (C6H6O2, AR, Tianjin Damao Co.) was dissolved in 7.0 mL deionized water, 2.0 g peptone (Tianjin Zhiyuan Co., Ltd.) was added into the solution slowly, stirred until it was completely dissolved. Then 0.815 g cobalt acetate (Co(CH3COO)2·4H2O, AR, Tianjin Bodi Chemical Co., Ltd) was added into the solution with the molar ratio resorcinol/cobalt = 20. Stirring until the solid was completely dissolved, 9.08 g (0.112 mol) formaldehyde solution (HCHO, AR, 37 wt%, Tianjin Damao Co.) was added to the solution drop by drop. After the solution was thoroughly stirred for 10 minutes, a certain amount of ammonia (NH3, 25–28 wt%, AR, Xichang Co. Ltd) was slowly added while stirring to adjust pH to form hydrogel by solution reaction. The organic hydrogel was dried and sealed at 85 °C in the vacuum drying chamber for 7 days. Then, the precursor of organic xerogel RFNCo was obtained. After the precursor sample was crushed and heat-treated at 800 °C for 2 h in ammonia etching atmosphere, it was naturally reduced to room temperature, and the dual N-doped NCoNC composite electrocatalyst was obtained. The fabrication process for dual N-doped NCoNC sample are shown in Fig. 1.In order to compared the enhancement of dual N doping, singular N-doped carbon composite sample without adding peptone (CoNC) and singular N-doped carbon composite sample heat-treated without ammonia etching (NCoC) were also prepared using the same method above. Commercial Pt/C (20 wt%, Johnson Matthey Co. Ltd) was selected for comparison.
2.2 Analytical techniques
The crystal structure of the catalyst samples was characterized by X-ray diffraction (XRD, Rigaku Rotalflex (Ru–200B)) with a Cu-Ka radiation (L = 1.54056 A) and Ni filter with the angle range of 10–80°. The tube current is 100 mA and the tube voltage is 40 kV.The microstructure and morphology structure of the samples were characterized by Field Emission Transmission Electron Microsc (FE-TEM) measurements which conducted on a Talos F200X equipment.
X-ray photoelectron spectroscopy (XPS) patterns of the samples were collected on an Axis Ultra DLD spectrometer and Mono (Al (Mono)) (150 W). The binding energies were calibrated with C 1s (284.6 eV) peak as an internal standard. An XPS peak fitting program (CasaXPS Version 2.3.16 Pre-rel) was employed for the deconvolutions of XPS peak.
2.3 Electrochemical measurements
The electrochemical property of the catalysts were measured by a PGSTAT302N electrochemical station (Metrohm Corp., Switzerland) with a rotating disk electrode (RDE) system (PINE Instrument Corp., USA) attached and carried out in a standard three electrode electrochemical system at room temperature. During the electrochemical measurements, a Pt wire, an Ag/AgCl electrode and a glassy carbon electrode (GCE, area: 0.19625 cm2) were employed as the counter electrode, reference electrode and working electrode. 0.5 M H2SO4 and 0.1 M KOH were applied as the acidic and alkaline electrolyte, respectively. The catalytic layer on working electrode was prepared as follows: 5.0 mg catalyst, 1.0 mL ethanol and 50.0 μL Nafion (Du Pont Corp., 5 wt%) were dispersed in a weighing bottle with ultrasonic agitation for 25 min to obtain a uniform slurry. After that, 10 μL of the homogeneous dispersion was dropped onto the top of a clean GCE surface and desiccated at room temperature to form a thin film catalyst layer. The catalysts loading on working electrode is 0.243 mg cm−2. All electrode potentials in this paper were quoted versus reversible hydrogen electrode (RHE) by the following equation:| E vs. RHE = E vs. Ag/AgCl + 0.197 + 0.059 × pH | (1) |
Cyclic voltammetry (CV) and linear sweep voltammetry (LSV) were used to measure the electrochemical properties of the catalysts. The CV measurements were carried out in N2 saturated 0.5 M H2SO4 or 0.1 M KOH electrolyte at a 10 mV s−1 scan rate with the potential range from 0.16 to 1.16 V. The LSV experiments were performed in N2 or O2 saturated electrolyte with the rotating speeds of 1600 rpm at room temperature. The potential range is from 1.16 to 0.16 V at the scan rate of 5 mV s−1.
An AFCBP1 bipotentiostat (PINE Instrument Corp.) was applied to take the rotating ring disk electrode (RRDE) measurement in a three-electrode electrochemical cell at room temperature. An RRDE with GCE (5.7 mm diameter) and Pt ring (6.1 mm inner-diameter and 7.9 mm outer-diameter) was employed as the working electrode. The thin film catalytic layer with the catalysts loading of 0.187 mg cm−2 was prepared using the same method as mentioned above. A platinum wire and an Ag/AgCl electrode were used as the counter and reference electrodes, respectively. The selectivity of catalyst in the mechanism of ORR through a 4-electron or a 2-electron process was determined by recording the LSVs of RRDE in O2 saturated 0.5 M H2SO4 or 0.1 M KOH solution at 1600 rpm with a scan rate of 5 mV s−1.
The following equations were used to calculate the percentage of H2O2 released (% H2O2) and the apparent electrons transferred number (n) during ORR.20
 | (2) |
 | (3) |
The accelerated aging test (AAT) based on continuous CV potential cycling for 1000 cycles at room temperature was employed to evaluate the stability of the catalysts. The AAT was conducted in N2 purged acidic or alkaline electrolyte by scanning potential between 0 and 1.2 V with a scan rate of 50 mV s−1. LSV measurements using the same standard three-electrode electrochemical system as described above were performed to study the ORR performances (before and after AAT). The ORR polarization curve was recorded at a rotating speed of 1600 rpm in the electrolyte saturated with O2.
The aqueous zinc–air battery was designed at room temperature with 5.0 M NaOH solution containing 0.2 M Zn(Ac)2 as electrolyte, a polished zinc sheet as a metal anode and a hydrophobic carbon paper with effective contact area of 1 cm2 coated by electrocatalysts with a mass loading of 2.0 mg cm−2 as the cathode. The polarization curves were measured by LSV with a scan rate of 5 mV s−1 with an electrochemical workstation (CHI 660E, CH Instrument).
3 Results and discussion
3.1 Characterization of as-prepared samples
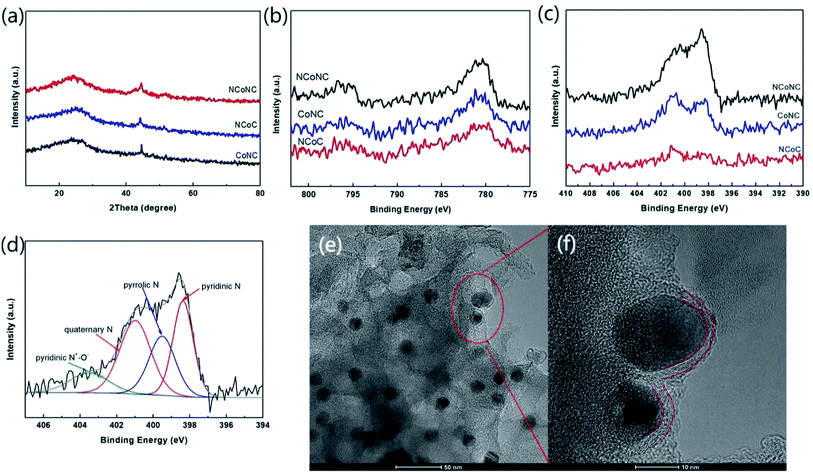
XRD patterns of NCoNC, NCoC and CoNC samples shown in Fig. 2a were used to analyze the crystal structure and lattice structure of the samples. As shown in Fig. 2a, the diffraction peaks of C(002) and C(101) crystal surfaces of carbon materials at 26.3° and 42.6° are not particularly obvious for the three samples, which demonstrates that most of the carbon in the three sample was in an amorphous nature. The two diffraction peaks occur at 44.1° and 51.5° are attributed to the crystal plane diffraction peaks of Co(111) and Co(311). It can be seen from the Fig. 2a that the peak intensities of Co(111) and Co(311) diffraction peaks of NCoC and CoNC samples are similar. Compared with those of NCoC and CoNC, the two diffraction peaks of Co in NCoNC samples are slightly wider, which indicates that the Co grains in NCoNC samples are smaller than those in NCoC and CoNC samples, and the Co crystal shape has not been completely formed. As demonstrated in previous studies, the formation of amorphous nanoparticles was critical for catalyzing oxygen reduction in four electron transfer pathway.21,22 The formation of this structure is probably due to the introduction of N in the material. The N doping in the carbon-based material changes the electronic states on the surface of C material. Under the joint action of the complex electronic states of C and N, the co-doped form of Co on the sample surface is adjusted. Then, the growth of Co particles is affected which leads to the diffraction peak broadening of Co.As shown in Fig. 2b, the NCoNC, CoNC and NCoC samples exhibit similar Co 2p XPS spectra with typical characteristic peaks of Co species (Co 2p3/2, 782 eV and Co 2p1/2, 796 eV).23,24 XPS spectra of N 1s for NCoNC, CoNC and NCoC samples are shown in Fig. 2c. Compared with NCoC and CoNC, the N 1s spectral intensity of NCoNC sample is obviously higher. It fully indicates that the N doping in the dual doped NCoNC sample is obviously more effective with the N doping amount remarkably higher than the single doped NCoC and CoNC samples. Table 1 shows Co 2p, O 1s and N 1s regions analysis of NCoNC, NCoC and CoNC. As can be seen from the data in Table 1, the doping amount of N in NCoNC sample is 1.49% (relative to C atom), which is 1.1 percent higher than that of NCoC (0.39%) and 0.6 percent higher than that of CoNC (0.89%). According to previous literature reports, N spectra can be divided into four types, as shown in Fig. 2d, among which quaternary-N and pyridinic-N are very likely to be beneficial to the ORR catalytic process.25–27 The contents of various N in samples according to the intensity of each peak deconvolution conducted by the fitting program (Casa XPS Version 2.3.16 Pre-rel) are shown in Table 2, in which, quaternary N and pyridinic N for NCoNC sample account for 64.13% of the total N significantly higher than those of CoNC (48.85%) and NCoC (53.67%).
| Sample ID | Co 2p (%) | O 1 s (%) | N 1 s (%) |
|---|---|---|---|
| NCoNC | 0.25 | 22.27 | 1.49 |
| NCoC | 0.23 | 23.91 | 0.39 |
| CoNC | 0.16 | 22.04 | 0.89 |
| Sample ID | Pyridinic N–O | Quaternary N | Pyrrolic N | Pyridinic N | ||||
|---|---|---|---|---|---|---|---|---|
| B.E. (eV) | N (%) | B.E. (eV) | N (%) | B.E. (eV) | N (%) | B.E. (eV) | N (%) | |
| NCoNC | 403.5 | 11.95 | 401.0 | 34.71 | 399.5 | 23.91 | 398.4 | 29.42 |
| CoNC | 403.0 | 19.54 | 401.0 | 32.22 | 399.5 | 31.61 | 398.4 | 16.63 |
| NCoC | 402.9 | 30.51 | 400.9 | 24.12 | 400.0 | 15.82 | 398.4 | 29.55 |
As shown in Fig. 2e, the particles with a diameter of about 10 nm are uniformly embedded and distributed in the sample phase. It can be seen from the partially enlarged electron microscope photo (Fig. 2f) that the outside of the particles is covered by two parts of carbon layer, in which the graphene carbon layer with several obvious crystal lattices is in contact with the particles, and the outside is amorphous structure with a lot of exposed edge forming an abundant edge sites. The exposed edge sites are consistent with the results of amorphous carbon test in XRD. The thin amorphous carbon layer wrapped in the outermost layer of nanoparticles forms a curved edge structure with a special zigzag shape. According to the previous studies,28,29 the zigzag configuration is highly likely to contribute to ORR.
3.2 Catalytic performance
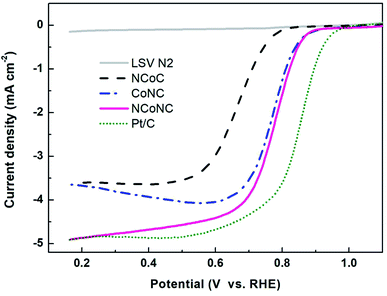
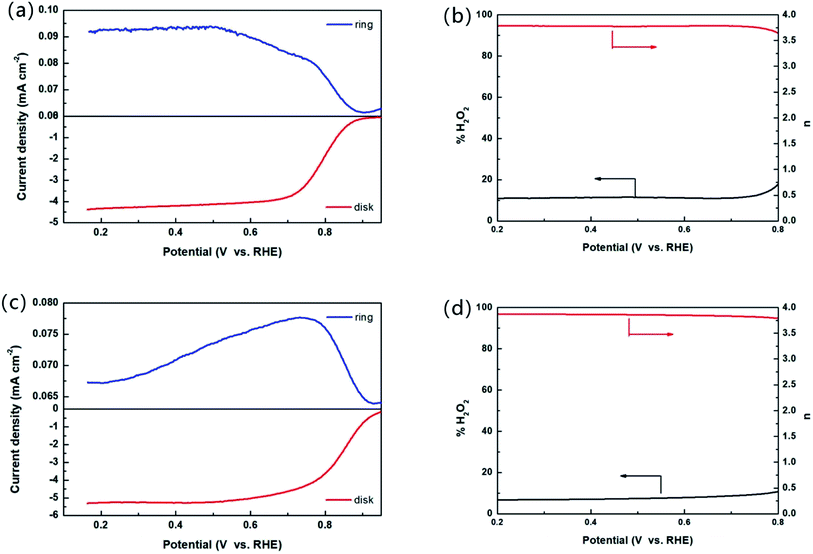
The samples were analyzed by electrochemical analysis with three electrodes system to study the electrocatalytic properties of the materials. Fig. 3 shows the ORR polarization curve of the samples measured in O2 saturated 0.1 M KOH media at rotation speed of 1600 rpm. It can be seen from Fig. 3 that the onset oxygen reduction potential of NCoNC (0.915 V) is close to that of CoNC (0.912 V), and much higher than that of NCoC (0.810 V). Compared with Pt/C (0.966 V), the potential gap is nearly 50 mV. The half-wave potential of NCoNC (0.781 V) was 10 mV and 113 mV higher than that of CoNC (0.771 V) and NCoC (0.668 V), respectively, indicating that NCoNC sample had better oxygen reduction catalytic activity than CoNC and NCoC catalysts. The result is consistent with the N-doping amounts in XPS analysis. This indicates that the catalytic performance of the catalyst can be effectively improved by enhancing the N doping effect through dual nitrogen doping.In order to analyze the formation of peroxide (H2O2) in alkaline medium during the ORR process, the RRDE measurement was performed in oxygen saturated 0.1 M KOH solution. The test curves of the NCoNC catalyst and commercial Pt/C were recorded and shown in Fig. 4a and c. The electron transfer numbers (n) calculated based on the RRDE results in Fig. 4a ranged from 3.65 to 3.78 and the % H2O2 yield ranged from 10.7–17.3 as shown in Fig. 4b, which are fairly close to those of commercial Pt/C as shown in Fig. 4d (n = 3.78–3.86, % H2O2 yield = 6.6–10.6). Thus, it would be approximated that most of O2 was reduced to H2O catalyzed by NCoNC catalyst follow a four electron path with only a few H2O2 produced through a two electron process.
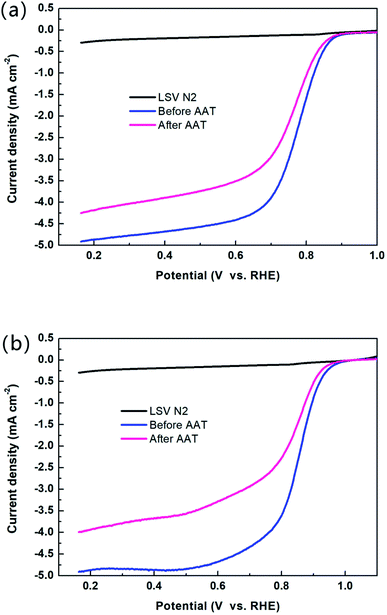
Fig. 5 shows the oxygen reduction polarization curve of the catalyst before and after the AAT (a) NCoNC (b) Pt/C. The performances of both NCoNC and Pt/C catalysts degrade to a certain extent after AAT experiment as shown in Fig. 5a and b. However, the limiting current density decrement (0.66–0.83 mA cm−2) and the half-wave potential negative shift (17.1 mV) of NCoNC catalyst were significantly lower than those of Pt/C catalyst (0.92–1.27 mA cm−2 for limiting current density decrement and 26.9 mV for half-wave potential negative shift). In conclusion, during cyclic potential scanning AAT, NCoNC catalyst shows remarkably better stability than commercial Pt/C catalyst.
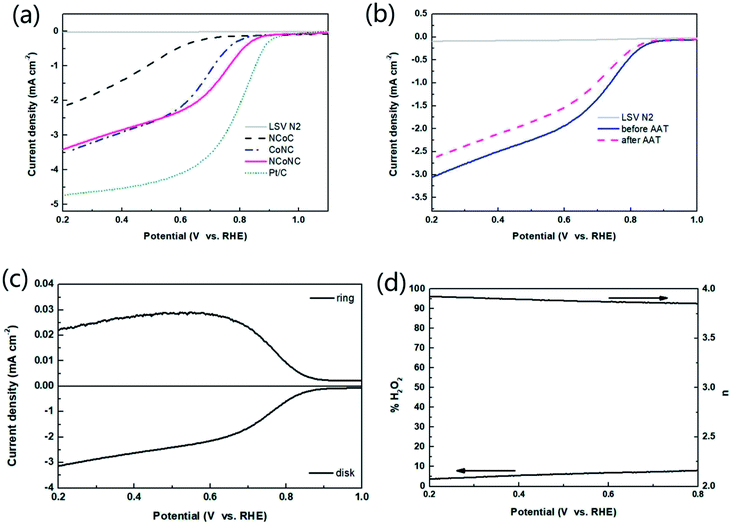
The ORR catalytic performance of NCoNC catalyst in acidic medium was further studied by RDE test which was carried out in 0.5 M H2SO4 electrolyte saturated with oxygen. The LSV curves of NCoC, CoNC, NCoNC and Pt/C were obtained and shown in Fig. 6a. According to the curve data in the Fig. 6a, the onset oxygen reduction potential of NCoNC is 0.908 V, which is 141 mV and 58 mV higher than those of NCoC sample (0.767 V) and CoNC sample (0.852 V). In addition, the half-wave potential of NCoNC is 0.693 V, which is 234 mV higher than that of NCoC sample (0.459 V) and 51 mV higher than that of CoNC sample (0.642 V). Thus, compared with NCoC and CoNC samples, NCoNC catalyst showed significantly higher oxygen reduction activity in acidic electrolyte. However, compared with commercial Pt/C (onset ORR potential 0.969 V and half wave potential 0.788 V), there is still a big gap for NCoNC catalyst to improve. At present, pt-based catalyst is still one of the most advantageous catalysts for ORR in acidic system.
The catalytic ORR process and mechanism of NCoNC materials in acidic medium were further studied by RRDE measurement. RRDE voltammogram and the percentage of peroxide and the electron transfer number at various potentials based on the RRDE results are shown in Fig. 6c and d. The electron transfer numbers (n) calculated from RRDE results is in the range of 3.85 to 3.93 and the % H2O2 yield ranged from 3.7–8.0, indicating that most of O2 was reduced to H2O in acidic media catalyzed by NCoNC catalyst follow a four electron path with only a few H2O2 (3.7–8.0%) produced through a two electron process.
Fig. 6b shows the oxygen reduction polarization curve of NCoNC catalyst before and after AAT. It can be seen from the figure that after AAT, the limiting current density decrement is 0.52–0.71 mA cm−2 and half wave potential attenuation is 63.5 mV for NCoNC catalyst. Compared with the attenuation under acidic condition, the limiting current density decrement decreases by about 13 mA cm−2, while the half wave potential attenuation increases by 46.4 mV. This suggests that NCoNC catalyst shows comparable stability both in acid and in alkaline medium, which would be a novel corrosion-resistant electrocatalytic material that is potentially to be used in a variety of corrosive electrolyte environments.
The aqueous zinc–air batteries were assembled to assess the practical application of NCoNC, CoNC and NCoC catalysts which were illustrated in Fig. 7. As can be seen in Fig. 7a, the Zn–air batteries with NCoNC catalyst exhibits a stable open-circuit voltage (1.37–1.43 V) for more than 1 h, which is larger than those of CoNC (1.35–1.39 V) and NCoC (1.34–1.39 V). Fig. 7b depicts the discharge polarization and power density curves for the Zn–air batteries driven by NCoNC, CoNC and NCoC. The battery drived by NCoNC exhibites a maximized power density of 78.2 mW cm−2, higher than those of CoNC (63.3 mW) and NCoC (36.8 mW). The battery test results verify the promising potential of NCoNC material as the air cathode electrocatalyst for Zn–air batteries.
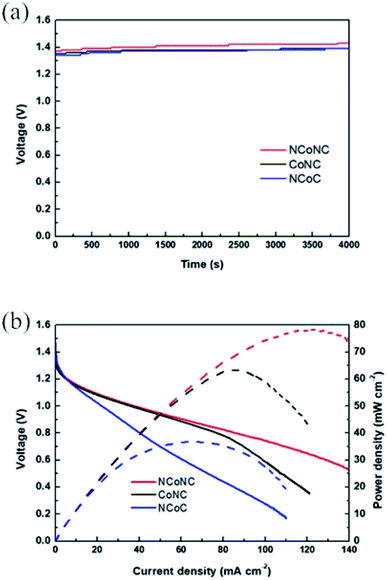 | ||
| Fig. 7 Zn–air batteries performances driven by NCoNC, CoNC, NCoC. (a) Open-circuit plots and (b) discharge polarization and power density curves curves. | ||
4 Conclusions
The electrocatalytic materials with high N doping amount and good ORR catalytic activity can be obtained by the dual nitrogen doping method including precursor polymerization N-doping and ammonia etching N-doping at high-temperature. XPS analysis shows that NCoNC sample obtained by dual N doping method not only has high N doping amount, but also has the optimized chemical state composition of N doping, which play an important role in improving the microstructure and catalytic performance of catalysts. XRD and HRTEM results show that the doped metal particles in the sample have uniform particle size. The nano-particles are coated with double carbon layers composed of graphene carbon (inner layer) and amorphous carbon (outer layer) forming a serrated surface edge structure with uniform thickness which is conducive to the ORR. Electrochemical tests show that NCoNC catalyst exhibits good catalytic performance and excellent stability in both acidic and alkaline environments. The limiting current and half-wave potential attenuation of NCoNC catalysts are significantly lower than those of commercial Pt/C catalysts, especially under alkaline conditions. The Zn–air battery assembled with NCoNC exhibits a large peak current density of 78.2 mW cm−2 and superior pen-circuit voltage. Therefore, as a fresh strategy to regulate the microstructure and composition of catalysts, dual-effect nitrogen doping can be used to promote and develop highly efficient unprecedented oxygen reduction catalysts.Conflicts of interest
The authors declare no conflicts of interest.Acknowledgements
The authors gratefully acknowledge the financial support by the Science & Technology Project of Education Department of Jiangxi Province, China (GJJ191060, GJJ212320) and Science & Technology Guidance Plan Project of Xinyu City (21KJZD01, 21KJZD02).References
- Q. Zhou, Z. Zhang, J. Cai, B. Liu, Y. Zhang, X. Gong, X. Sui, A. Yu, L. Zhao, Z. Wang and Z. Chen, Nano Energy, 2020, 71, 104592 CrossRef CAS.
- Q. Lv, N. Wang, W. Si, Z. Hou, X. Li, X. Wang, F. Zhao, Z. Yang, Y. Zhang and C. Huang, Appl. Catal., B, 2020, 261, 118–234 CrossRef.
- X. Ren, Q. Lv, L. Liu, B. Liu, Y. Wang, A. Liu and G. Wu, Sustainable Energy Fuels, 2020, 4, 15–30 RSC.
- A. Mahata, A. S. Nair and B. Pathak, Catal. Sci. Technol., 2019, 9, 4835–4863 RSC.
- Y. Li and H. Dai, Chem. Soc. Rev., 2014, 43, 5257–5275 RSC.
- L. L. Chen, X. L. Xu, W. X. Yang and J. B. Jia, Chin. Chem. Lett., 2020, 31, 626–634 CrossRef CAS.
- M. Nunes, I. M. Rocha, D. M. Fernandes, A. S. Mestre, C. N. Moura, A. P. Carvalho, M. F. R. Pereira and C. Freire, RSC Adv., 2015, 5, 102919–102931 RSC.
- M. M. Mohideen, Y. Liu and S. Ramakrishna, Appl. Energy, 2020, 257, 19 CrossRef.
- Y. Liu, L. Yang, B. Xie, N. Zhao, L. Yang, F. Zhan, Q. Pan, J. Han, X. Wang, J. Liu, J. Li and Y. Yang, Chem. Eng. J., 2020, 381, 122681 CrossRef CAS.
- C. Xiong, M. Li, W. Zhao, C. Duan and Y. Ni, J. Materiomics, 2020, 6, 523–531 CrossRef.
- Z. Zhao, C. Gao, K. Ma and Y. Lu, Appl. Surf. Sci., 2020, 504, 144380 CrossRef CAS.
- K. Morawa Eblagon, N. Rey-Raap, J. L. Figueiredo and M. F. R. Pereira, Appl. Surf. Sci., 2021, 548, 149242 CrossRef CAS.
- A. F. Zainul Abidin, K. S. Loh, W. Y. Wong and A. B. Mohamad, Int. J. Hydrogen Energy, 2019, 44, 28789–28802 CrossRef CAS.
- A. F. Zainul Abidin, K. S. Loh, W. Y. Wong, A. B. Mohamad and I. Puspasari, Int. J. Hydrogen Energy, 2018, 43, 11047–11055 CrossRef CAS.
- P. Matter, L. Zhang and U. Ozkan, J. Catal., 2006, 239, 83–96 CrossRef CAS.
- H. Jin, H. Zhang, H. Zhong and J. Zhang, Energy Environ. Sci., 2011, 4, 3389–3394 RSC.
- S. Liu, H. Zhang, Z. Xu, H. Zhong and H. Jin, Int. J. Hydrogen Energy, 2012, 37, 19065–19072 CrossRef CAS.
- H. Jin, J. Li, F. Chen, L. Gao, H. Zhang, D. Liu and Q. Liu, Electrochim. Acta, 2016, 222, 438–445 CrossRef CAS.
- A. F. Zainul Abidin, K. S. Loh, W. Y. Wong and A. B. Mohamad, Int. J. Hydrogen Energy, 2019, 44, 28789–28802 CrossRef CAS.
- M. S. El-Deab and T. Ohsaka, Electrochim. Acta, 2002, 47, 4255–4261 CrossRef CAS.
- D. Su and R. Schlögl, ChemSusChem, 2010, 3, 136–168 CrossRef CAS PubMed.
- P. H. Matter, E. Wang and U. S. Ozkan, J. Catal., 2006, 239, 83–96 CrossRef CAS.
- Y. He, S. Hwang, D. A. Cullen, M. A. Uddin, L. Langhorst, B. Li, S. Karakalos, A. J. Kropf, E. C. Wegener, J. Sokolowski, M. Chen, D. Myers, D. Su, K. L. More, G. Wang, S. Litster and G. Wu, Energy Environ. Sci., 2019, 12, 250–260 RSC.
- X. Guo, C. Qian, X. Wan, W. Zhang, H. Zhu, J. Zhang, H. Yang, S. Lin, Q. Kong and T. Fan, Nanoscale, 2020, 12, 4374–4382 RSC.
- N. P. Subramanian, X. Li, V. Nallathambi, S. P. Kumaraguru, H. Colon-Mercado, G. Wu, J.-W. Lee and B. N. Popov, J. Power Sources, 2009, 188, 38–44 CrossRef CAS.
- C. Guo, Y. Li, Y. Xu, Q. Xiang, L. Sun, W. Zhang, W. Li, Y. Si and Z. Luo, Nanoscale Res. Lett., 2019, 14, 22 CrossRef.
- R. G. Morais, N. Rey-Raap, R. S. Costa, C. Pereira, A. Guedes, J. L. Figueiredo and M. F. R. Pereira, J. Compos. Sci., 2020, 4, 1–14 Search PubMed.
- M. P. Woods, E. J. Biddinger, P. H. Matter, B. Mirkelamoglu and U. S. Ozkan, Catal. Lett., 2010, 136, 1–8 CrossRef CAS.
- P. H. Matter, E. Wang, J. M. M. Millet and U. S. Ozkan, J. Phys. Chem. C, 2007, 111, 1444–1450 CrossRef CAS.
| This journal is © The Royal Society of Chemistry 2022 |


