 Open Access Article
Hydrogen production rates of aluminum reacting with varying densities of supercritical water
Keena Trowell *,
Sam Goroshin,
David Frost and
Jeffrey Bergthorson
Department of Mechanical Engineering, McGill University, Rm 270 Macdonald Engineering Building, 817 Sherbrooke Street West, Montréal, Canada. E-mail: keena.trowell@mail.mcgill.ca
First published on 25th April 2022
Abstract
Aluminum particles, spanning in size from 10 μm to 3 mm, were reacted with varying densities of water at 655 K. The density of the water is varied from 50 g L−1 to 450 g L−1 in order to understand the effect of density on both reaction rates and yields. Low-density supercritical water is associated with properties that make it an efficient oxidizer: low viscosity, high diffusion, and low relative permittivity. Despite this, it was found that the high-density (450 g L−1) supercritical water was the most efficient oxidizer both in terms of reaction rate and hydrogen yield. The 10 μm powder had a peak reaction rate of approximately 675 cmH23 min−1 gAl−1 in the high-density water, and a peak reaction rate below 250 cmH23 min−1 gAl−1 in the low- and vapour-density water. A decline in peak reaction rate with decreasing water density was also observed for the 120 μm powder and the 3 mm slugs. These findings imply that the increased collision frequency, a property of the high-density water, outpaces reduction in the reaction enhancing properties associated with low-density supercritical water. Hydrogen yield was minimally affected by decreasing the oxidizer density from 450 g L−1 to 200 g L−1, but did drop off significantly in the vapour-density (50 g L−1) water.
1 Background
Two key challenges in the transition to a carbon-free energy sector are the ability to store and transport clean energy, and a fuelling option for applications that require sustained access to high power, such as shipping. It is impractical to use hydrogen, the presumed fuel in a decarbonized energy system, as an energy carrier due to its low energy density. Aluminum, produced using renewable electricity, is a more suitable energy carrier because of its high energy density, safety, abundance and recyclability.1 Aluminum, when reacted with water, produces heat and hydrogen and, if the reaction is fast enough, would entirely remove the need to ship or store hydrogen. Such an in situ and on-demand approach to hydrogen production would allow for its use as a fuel while circumventing the inconvenience and safety issues related to its shipping and storage.High-temperature reactions using liquid water not only produce heat that is mechanically useful, but it has also been shown that coarse aluminum particles2 can be used as fuel in high-temperature reactions, further improving safety and reducing cost. The solid oxidation products, aluminum hydroxide, are inert, non-toxic and recyclable. Carbon-free, industrial-scale aluminum smelting is on the horizon.3 Inert anodes, when combined with clean power, mean a carbon-free energy carrier, in the form of aluminum, is possible. The reaction has been shown to be very powerful,4 and has garnered interest as a potential green propellent,5,6 and for sub-marine propulsion.7,8
A thin passivating layer of α-Al2O3, an amorphous alumina, prevents all but the finest nano-scale aluminum powders from oxidizing with water under normal conditions.9 The reaction takes place at the α-Al2O3:Al interface, and therefore this layer must be compromised before any reaction occurs. When reactants are heated separately, the reaction has three steps.10 During the induction period, the first phase, the passivating oxide is weakened via diffusion of hydroxide (OH−) ions.9–12 The duration of the induction period depends on the particulars of the aluminum (size, presence of certain alloying elements, pre-treatment, etc.), the reaction temperature, and the pH of the fluid. The hydration process breaks the Al–O–Al bonds of the α-Al2O3 to form Al–OH bonds.12 The formation of hydroxyl-group molecules diminishes the effective cross-link density of the oxide and replaces O2− with the more easily diffused OH− ions.12 Simultaneously, a reverse reaction serves to repair the oxide layer and eliminate OH− ions.
Rapid oxidation, the second phase, begins when the rate of the OH−-producing reaction exceeds the rate of the reverse, oxide-repairing reaction. During this phase, hydrogen and heat evolve at the same time as a hydroxide. At low reaction temperatures, or when coarse aluminum particles are used, the hydroxide may adhere to the particle, preventing complete oxidation.13–15 In these cases, the formed hydroxides begin to slow, and ultimately quench, the reaction. Otherwise, the reaction quenches when all of the metal has been consumed. It has been shown that complete oxidation of coarse particles is possible when high-temperature liquid water or supercritical water are used as the oxidizer.2
Aluminum, when reacting with water, releases approximately half of its energy as chemical energy (H2), the other half as thermal energy, and will form one of three solid products. The reaction pathways are shown in eqn (1)–(3). The ratio of hydrogen to aluminum stays the same, that is 1.5 molH2 per molAl, but the solid products change to reflect the change in the stoichiometric amount of water. The thermal products, Qn=1,2,3, range in value from 400–450 kJ per molAl. Experimental work has demonstrated that the reaction pathway is a function of temperature and pressure.2,9,16–18
| 2Al + 6H2O → 3H2 + 2Al(OH)3 + Q1 | (1) |
| 2Al + 4H2O → 3H2 + 2AlO(OH) + Q2 | (2) |
| 2Al + 3H2O → 3H2 + Al2O3 + Q3 | (3) |
The bulk of aluminum–water research for hydrogen production has concentrated on improving reaction rates at low temperatures. The addition of alkalis to the oxidizer,19–21 alloys to the metals,22–24 or the use of nanopowders, which have high specific surface areas,10,25 and mechanical activation26–30 have all been tested. Although successful, to varying extents, at increasing reaction rates, the approaches are hindered by increased complexity and expense, corrosive reaction products, and low reaction onset temperatures.31 The low reaction temperatures are not only a safety concern, but the heat that evolves from low temperature reactions is of low quality, which means that, effectively, half of the energy of the fuel is wasted.
Temperature increase has been shown to also increase reaction efficiency,2,13–15 with complete oxidation being observed, even for large particles, under supercritical conditions.2 The Arrhenius expression shows that reaction rate D (s−1) is exponentially dependent on temperature T (K):
 | (4) |
An increase in density (pressure) would increase A which should serve to increase reaction efficiency. However, increasing density also increases relative permittivity, ε, the property which governs solubility.32 An increase in ε decreases the solubility of non-polar species in the fluid, which may lead to the formation of hydroxides that passivate the bulk metal thereby slowing reaction. Vlaskin et al.39 contend that water vapour is a more effective oxidizer than liquid water when temperature is held constant but other studies2,10,13,15,17,25 have reported empirical results that contradict Vlaskin's contention. In the supercritical regime, it is unclear whether the increase in number density or the reaction-slowing properties of the water will dominate.
Previous work by Trowell et al. showed that supercritical water would fully oxidize coarse aluminum, but no attempt was made to describe reaction rates at this temperature. In rate studies by other researchers, low-density water was used,25 or the study stayed below the critical temperature.14,15
In this study, aluminum powders and slugs are exposed to varying densities of water at 655 K, just above the critical temperature of 647 K. High-density water (≈450 g L−1), low-density water (≈200 g L−1), and vapour-density water (≈50 g L−1) is used in these experiments. The specific volume of the water used in these experiments are indicated with circles on Fig. 1.
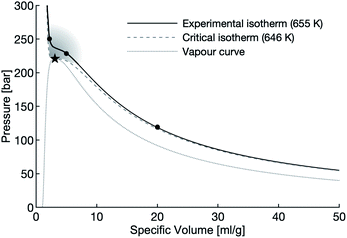 | ||
| Fig. 1 The vapour dome of water with the supercritical region shaded. The circles mark the densities of water used in this study, the star marks the critical point of water. | ||
2 Methodology
2.1 Experimental procedure
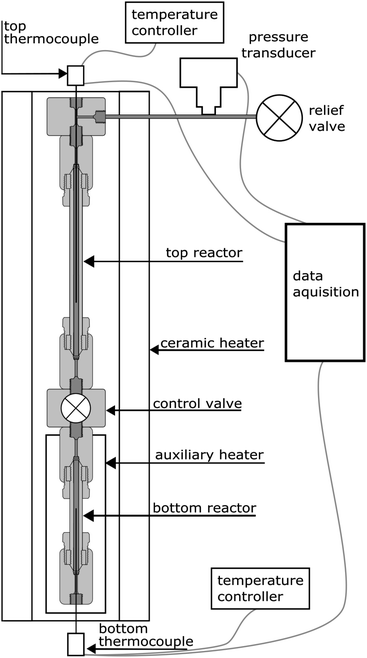
The experiments were carried out using a purpose-built apparatus, illustrated in Fig. 2. The apparatus consists of two high-pressure micro reactors manufactured by High Pressure Equipment Company. The top reactor was an MS-13 (10 mL internal volume), and the bottom reactor was an MS-11 (5 mL internal volume). A Hipco air-operated valve, also procured from High Pressure Equipment Company, was used as a control valve and separated the two reactors. Each reactor was fitted with a dual-output K-type thermocouple with an Inconel sheathing to monitor temperature. A pressure transducer (Omega) was connected to the top part of the apparatus to monitor pressure. The reactors were heated by a 3.5 kW, semi-cylindrical, ceramic fibre heater (Watlow). A wide temperature gradient between the top and bottom reactor was observed during testing of the apparatus and therefore an auxiliary heater and temperature controller were added. The auxiliary heater was a 475 W strip heater (McMaster-Carr) and was placed next to the bottom reactor during experiments. The open side and top of the cylindrical heater was blocked with refractory bricks to create an oven-like environment around the reactors. Data from the pressure transducer and both thermocouples were recorded using a Raspberry Pi data acquisition system. The readings from the pressure transducer proved to be very noisy and therefore an eighth-order polynomial was fit to the data.For each of the high- and low-density water experiments, 10 g of water were loaded into the top reactor and the reactor sealed. The free volume of the bottom reactor was adjusted, through the use of stainless steel (316 SS) spheres, to create the different densities of water. For the vapour-density water experiments, 6 g of water were used. Approximately 0.33 g of aluminum was loaded into the bottom reactor for each experiment. Three forms of aluminum were used: a 10 μm powder, a 120 μm powder, and 3 mm aluminum slugs. The powders, supplied by Valimet are 99.7% pure aluminum. The slugs were procured from Alfa Aesar and have a purity of 99.99%. The aluminum samples had no coating except the naturally-occurring passivation layer and no pre-treatment was done.
Once both reactors were connected, loaded, and sealed, the heaters would be moved into place and the system heated up to 655 K, at which point the control valve would be opened and reactants allowed to mix. The system was held at temperature for 30 minutes, then cooled back down to room temperature. The final pressure was recorded before the relief valve was opened to depressurize the system. In addition to the experiments, baseline tests were also run at each density of water. Each baseline test was set up using the protocol described above, except no aluminum was loaded into the bottom reactor.
2.2 Data analysis
The hydrogen yield of the reaction in moles, nH2, was determined using the ideal gas law and the difference between the initial pressure (P1) and the final pressure after cooling (P2), in bars:
 | (5) |
Very little on the rates of aluminum–water reactions at temperatures above approximately 500 K has been reported in the literature. At elevated temperatures and pressures the solubility of hydrogen in water is significant,33 and H2–H2O mixtures do not behave ideally. Setiani et al.15 addressed the challenge of hydrogen dissolution by running experiments in different time increments, and reporting the yield of each case. This approach gives a good first estimate of reaction times, but has the drawback of not capturing the induction period or, in some cases, the onset of rapid oxidation.
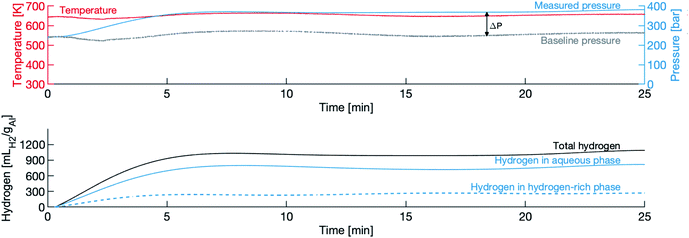
In this study, we aimed to determine the dynamic evolution of hydrogen around the critical point of water, but this region poses particular challenges. In our experiments, a difference in pressure, ΔP, is observed between the experimental runs (with aluminum) and the correlating baseline tests (no reactive powder). Although the ΔP observed can be attributed to hydrogen evolution in the system, on its own it is insufficient to determine instantaneous reaction yield because of the intermolecular behaviour of the water and hydrogen molecules.2
The critical region is notably difficult to characterize because of the wild fluctuations in pressure, with even small changes in temperature, rendering pressure alone an unreliable indicator of hydrogen evolution or the rate thereof. Under supercritical conditions, and as pressure (density) of the fluid increases, the occurrence of polymeric water due to hydrogen bonding also increases.32 At the pressures seen in these experiments, clusters of up to 20 molecules have been reported.34
Furthermore, the H2–H2O system at temperatures above 650 K, the region of these experiments, has been reported to be a single-phase mixture by some researchers,35 although others have proposed that at temperatures around 650 K, phase separation does occur.36 The two phases exist in equilibrium with one being aqueous with dissolved hydrogen, and the other being hydrogen-rich with some dissolved H2O.36 Further evidence for the existence of phase separation has been provided by experiments by Seward and Franck, who directly observed the phase transition point using an apparatus with optical access,33 however the exact temperature of the transition is not reported.
In the Redlich–Kwong equation of state (EOS), eqn (6), the variable Vm is molar volume (cm3 mol−1), T is temperature in Kelvin, P is pressure and R is the universal gas constant.
 | (6) |
The constant a describes the attractive intermolecular forces and b captures the repulsive forces. These constants are typically derived empirically. The Redlich–Kwong EOS can be used to describe H2–H2O systems, if accurate a and b constants are available. Constants proposed by Rimbach et al. for a and b for H2–H2O mixtures have proved to be insufficiently accurate to capture H2–H2O behaviour in the region of these experiments, a weakness recognized by the authors themselves.36
To analyze our data, we developed an approach which assumes a phase separation. This approach accounts for the hydrogen present in the water-rich component by calculating the concentration of hydrogen, and the hydrogen in the hydrogen-rich phase is calculated using the Redlich–Kwong equation of state.
The concentration of hydrogen in an aqueous solution, CH2 (cm3 gH2O−1), is the ratio between the product of the fugacity coefficient, ϕ, and the partial pressure of hydrogen PH2 and the conversion factor between fugacity and concentration, Y, as shown in eqn (7). In these calculations, the ΔP described above is taken to be PH2.
 | (7) |
The calculation of the fugacity coefficients used in this work relies on expressions developed by Shaw et al.:37
 | (8) |
| C1 = exp(−3.8402T0.125 + 0.5410) | (9) |
| C2 = exp(−1263 T0.5 − 15.980) | (10) |
C3 = 300![[thin space (1/6-em)]](https://www.rsc.org/images/entities/char_2009.gif) exp(−0.11901T − 5.941) exp(−0.11901T − 5.941)
| (11) |
In the Shaw equations, pressure is in units of bar and temperature is in degrees Celsius. The conversion factor data, Y, are taken from Kishima et al.38 The volume of hydrogen in the aqueous phase (VH2,1, cm3) is calculated by multiplying the concentration by the mass of water in the system. Depending on the initial mass of water and the hydrogen yield, no more than 4% of the initial water mass is consumed, therefore the mass of water is treated as a constant in the calculations.
The hydrogen in the hydrogen-rich component of the mixture was calculated using eqn (6). Pressure is in bar and the R is in the same units as in eqn (5). For non-polar species such as hydrogen, the constants can be calculated using eqn (12) and (13)).
 | (12) |
 | (13) |
After solving the Redlich–Kwong EOS for Vm, moles of hydrogen, nH2 can be calculated using eqn (14) if the volume of the hydrogen-rich phase is known.
 | (14) |
The volume of the hydrogen-rich phase is equivalent to the free volume, V(t), inside the reactor. The total reactor volume and the volume of spheres inside the reactor is known, leaving only the volume of water, VH2O(t), to be determined. The mole fraction of hydrogen was always small in the aqueous phase (no more than 0.03) therefore, for the purposes of ascertaining V(t), the water was treated as pure water. Once again holding mass of water constant, VH2O(t) was calculated by dividing mH2O by water density, ρH2O(t), at time t. ρH2O(t), was calculated as a function of temperature and pressure (T(t) and P(t)) using the IAPWS IF-97 water property formulations.
The total hydrogen in the system at time t, VH2(t), is the sum of the hydrogen in the aqueous phase, VH2,1(t), and the hydrogen in the hydrogen-rich phase, VH2,2(t):
 | (15) |
The rate of hydrogen evolution is calculated by taking the derivative of eqn (15)
 | (16) |
The authors recognize that the simplifying assumptions made in this analysis likely leads to an overestimation of hydrogen in the aqueous-phase (VH2,1), by as much as 3%, and an underestimation of the hydrogen present in the hydrogen-phase (VH2,2), with consequences for the rates derived. This study aims to understand the drivers of supercritical water oxidation around the critical point of water and therefore the qualitative findings are more important than the quantitative findings at this juncture.
3 Results
3.1 Typical pressure and temperature trace
Fig. 3 shows a typical pressure and temperature trace from an experiment, in this case the 120 μm powder in water with a density of 450 g L−1. In this figure, t = 0 is the moment the valve is opened (the heating and cooling portions of the experiment are not shown). The top panel shows the raw measurements of temperature and pressure, and the baseline pressure. The difference between the two pressure lines is treated as the partial pressure of hydrogen PH2, and is taken to be an indicator of the presence of a hydrogen-rich phase. The “dip” in temperature (and consequently pressure) is due to the opening of the valve. The slight variation in pressure is due to the difficulty in maintaining a constant temperature in this particular experimental apparatus.The bottom panel shows the calculated hydrogen evolution, comprised of the sum of the hydrogen in the aqueous phase of the solution, VH2,1, and the hydrogen in the hydrogen-rich phase, VH2,2. There is a short induction period, lasting less than one minute, followed by the rapid evolution of hydrogen phase, which lasts approximately 4 minutes, then a slowing of production is observed and the total amount of hydrogen levels off near the final yield. The decrease in hydrogen evolution between the 10 and 20 minute marks is an artefact of the poor temperature control and not an indication that evolved hydrogen is oxidizing back to water.
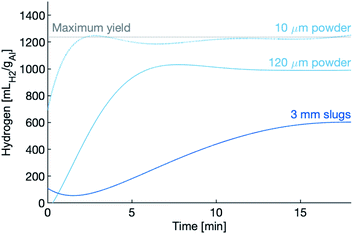
Hydrogen production, for all three samples in the dense supercritical water (450 g L−1) are shown in Fig. 4. Markers relay the hydrogen yield of each sample after being held at temperature for the full thirty minutes. In the case of the 10 μm powder, hydrogen production is completed within the first three minutes, while the 120 μm powder and the slugs take longer.
The hydrogen production rates during the first 10 minutes of the experiments using the 120 μm powder are shown in Fig. 5. After the 10 minute mark, the production rate tapers to nearly zero, an indication that the reaction has slowed or even quenched. The reactions in dense water peak faster, peak higher and last longer than the reaction in vapour-density water. Again, the dense water reactions outperform the vapour-density water.
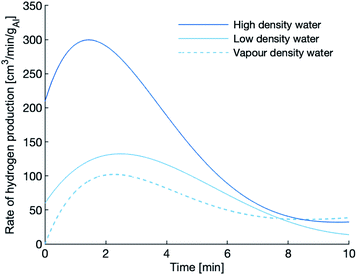 | ||
| Fig. 5 Hydrogen production of the 120 μm powder at 655 K. The peak rate of hydrogen evolution is highest in the high-density water. | ||
3.2 Hydrogen yield and maximum rates
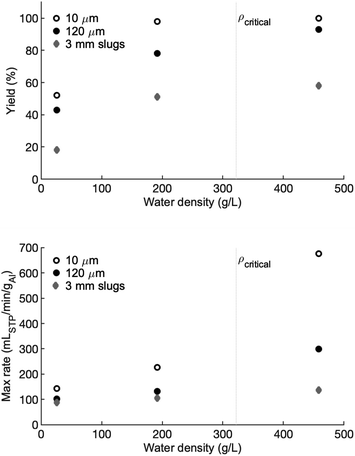
The hydrogen yields, reported as a percentage of full yield are shown in the top panel of Fig. 6 and the maximum rates are shown in the bottom panel. The critical density at the critical temperature is marked with a dotted grey line for reference. For all three forms of aluminum, there is a marginal difference in hydrogen yield between the high-density and the low-density water. A large drop in yield is observed for the vapour-density water. In each case there is approximately a 35% decrease in yield from the high-density water to the vapour-density water, compared to a difference of 0% to 5% between the high- and low-density water. For the high- and low-density water, the 10 μm powder has a yield of 100% and nearly 100% (respectively) before dropping to approximately 50% in the vapour-density water. Similarly, the slugs have a hydrogen yield between 50% and 60% in the high- and low-density water, but only 20% in the vapour-density water. The 120 μm powder shows a similar trend, but with a greater gap in yields between the high- and low-density water.The reaction rate of the 10 μm powder is the most sensitive to water density. In the high-density water, the maximum reaction rate is approximately 675 cmH23 min−1 gAl−1. This peak reaction rate drops to 226 and 145 cmH23 min−1 gAl−1 in the low- and vapour-density experiments, respectively. The decline in peak reaction rate as water density declines is observed in the 120 μm powder and the slugs, but the drop in peak reaction rate as water density decreases is not as extreme.
4 Discussion
4.1 Comparison to other work
Very little work has been carried out in the supercritical water regime. The closest study was done by Vostrikov and coworkers who published the results of two experiments carried out at temperatures around the critical point.25 One of the experiments is similar to the one described in this work: using water vapour with a density of 150 g L−1 at 665 K, with aluminum pieces that, in terms of specific surface area, were equivalent to the 3 mm slugs used in these experiments. We found a peak reaction rate and yield in line with their results. Vostrikov et al. report a peak reaction rate of 120 cmH23 min−1 gAl−1, which is higher than our peak rate of 105 cmH23 min−1 gAl−1 using the 200 g L−1 water. The hydrogen yield in the Vostrikov work was 47% while ours was 51%.The main difference between the two works is that the oxide coating on their samples was removed under a nitrogen atmosphere before being loaded into the reactor. No such preparation was done on our samples. The effect of the particle preparation is negligible in terms of the yield, but seems to increase the peak reaction rate by approximately 15%. A higher reaction rate is unsurprising since the goal of such surface preparation is to increase rates. It is effective because the induction period, during which the oxide layer must be compromised, is eliminated allowing for a very rapid evolution of hydrogen. It is worth noting that in both the Vostrikov work and the experiments with the 3 mm slugs in this work, the peak reaction rate occurs at the 2 minute mark. After the first few minutes, the advantage of the surface preparation is negated by the usual reaction mechanisms, resulting in similar yields.
Using a 100 μm powder, and at a much lower temperature of 615 K, Setiani and coworkers found that approximately 57 mmol of hydrogen was produced in just over 1 hour, which implies a mean reaction rate of approximately 20 cmH23 min−1 gAl−1.15 Vlaskin et al. reported 95% yield in 10 minutes using a 77.5 μm power at 640 K,14 implying a mean rate of 117 cmH23 min−1 gAl−1. In both cases, liquid water was used as the oxidizer. In the dense water experiments using the 120 μm powder, 80% hydrogen yield was realized in the first 5 minutes, which correlates to a mean reaction rate of 200 cmH23 min−1 gAl−1. These few data points illustrate the exponential effect of temperature on reaction rate described by eqn (4).
4.2 Effect of water density on reaction efficiency
The yield results of these experiments directly contradict a reaction mechanism proposed by Vlaskin et al. in another work.39 They assert that, at a given temperature, steam is a more efficient oxidizer than liquid water. In this study, we find the exact opposite, both in terms of yield and rate. The mechanism proposed by Vlaskin et al. neglects the fundamental, electro-chemical nature of the reaction and fails to explain empirical results published by others.2,10,13,15,17,25Viscosity (η), diffusion, and relative permittivity (ε) are the key properties of supercritical water that contribute to the effectiveness of the fluid as an oxidizer. These properties are also greatly affected by density (pressure). The ionic product, which has been shown to be important for reactions in the subcritical region,2 does not change much with density in the supercritical region.40
Low viscosity enhances mass transfer promoting diffusion-controlled reactions.35 It is believed that the aluminum–water reaction is at least partially diffusion-controlled12 but that other rate-limiting steps play a role.9 When temperature is held constant, the viscosity of supercritical water increases with pressure, thus the reaction should be slower in high-density water.
Mutual diffusion, J as described by Fick's law, is driven by concentration gradients.
 | (17) |
At the critical point, J goes to zero, a phenomenon called “critical slowing down”.35 This phenomenon has been shown to be pronounced in concentrated solutions, resulting in reaction rates of diffusion-controlled reactions that are much slower than would be expected.35 At infinite dilution, critical slowing down must be zero. In these experiments, the solution is dilute thus the effect is less pronounced35 but nevertheless serves to negatively impact rates.
Tuning pressure inside the reactor vessel can influence the solubility properties of the fluid because ε, the property that governs the solubility properties of a fluid, increases with density in the supercritical region. The rapid change in ε as density increases is shown in Fig. 7. The increasing ε is correlated to a decrease in the solubility of the non-polar hydroxides formed in the reaction. The decrease in solubility means that the hydroxides that form may offer some passivating effect, thus leading to lower yields and reaction rates. It is important to note that although ε increases, ε for dense supercritical water is still only on the order of 1/10th the value of ε for water at ambient conditions. Taken together, the effect of increased density on viscosity, diffusion and ε should lead to lower reaction rates and yields in the dense fluid, but that is not what is observed.
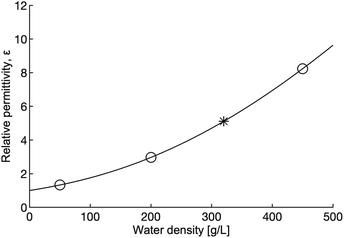 | ||
| Fig. 7 Relative permittivity as a function of water density at 655 K. The open circles indicate the density of the water used in this study, the star marks the critical density. Relative permittivity increases significantly with density (pressure). Calculations for this figure were done using the 1997 IAPWS release on the relative permittivity of water.41 | ||
An increase in reaction efficiency as a function of increased reaction temperature, as described by the Arrhenius expression (eqn (4)), has been shown by many authors.2,10,13–15,17 When temperature is held constant, the influence of the pre-exponential factor emerges. The collision theory of reaction states that for a chemical reaction to occur, particles must collide in the correct orientation and with enough kinetic energy to overcome the activation energy (EA) barrier. With the temperature held constant, the kinetic energy of the oxidizer molecules is constant but the increased density of the oxidizer results in more collisions thereby increasing the reaction rate and yield. In this heterogeneous reaction, the pre-exponential factor is likely a function of both the frequency of collisions as well as the concentration of OH− ions in the oxidizer.
As shown in the bottom panel of Fig. 6, reaction rate is proportional to number density. A high-density fluid, which has a higher concentration of OH− ions, likely increases the rate of absorption of OH− into the oxide/hydroxide protective layer. This rate of absorption is thought to be part of the rate-controlling mechanism of aluminum–water reaction. It is also possible that the rate of hydroxide dissolution or porosity increase in the formed hydroxides are also proportional to fluid density. An increase in either mechanism would lead to a proportional increase in reaction rate with density.
The effect of oxidizer density on peak reaction rate is most pronounced for the 10 μm powder. The peak reaction rate of the 10 μm powder drops by a factor of nearly 5 when the water density is reduced by a factor of 2.25. The difference between the low-density water and the vapour-density water is negligible in comparison. As particle size increases, the effect of decreasing density is less pronounced, although in all cases the vapour-density water results in the slowest rates.
4.3 Prompt hydrogen production
In the experiments using the high-density water, the 10 μm powder exhibits no induction period, seeming to begin with a non-zero amount of hydrogen (see Fig. 4). The hydrogen production curve is nearly vertical for the first few seconds of the experiment. This has been observed for 100 nm and 3.8 μm powders at lower reaction temperatures (around 368 K).10 Yavor and coworkers showed that in 365 K liquid water, a 10 μm powder has an induction period of approximately 1 minute, and at 390 K the induction period is on the order of 0.6 seconds. According to the Arrhenius law (eqn (4)), reaction rate increases exponentially with temperature. Extrapolating from these two points, an induction period near zero, and well below the time resolution of the sampling rate of these experiments, is expected. The use of a valve, although it completely opens in under 1 second, may be too slow to allow for the accurate collection of rate data in these crucial first few milliseconds. The authors suggest that further experiments are needed. In this future work, the valve should be replaced with a diaphragm, and a mechanism to assure fast mixing. The data acquisition system should be capable of sampling on the order of megahertz.4.4 Hydrogen yields in pre-mixed vs. pre-heat experiments
The experiments carried out in this study can be categorized as pre-heat experiments because the reactants were brought to temperature separately. The experiments done in an earlier study by the authors2 created a pre-mixed reaction regime by heating the reactants together. Using the same materials, and holding at temperature for the same amount of time, consistently lower hydrogen yields were observed in the pre-heat experiments. For example, it was reported that the 3 mm slugs fully oxidized in water with a density close to the critical density (322 g L−1) after being held at 650 K for 30 minutes, whereas in this study, the yield was 51% and 58% for water with a density slightly below and above (respectively) the critical density. Similar results are seen in the 120 μm powder.Although in both cases the reactants are held at temperature for 30 minutes, the reality is that in the pre-mixed protocol, the aluminum is exposed to an effective oxidizer for much longer. In the earlier study, the 3 mm slugs began significantly oxidizing at 575 K, just above the temperature corresponding to the peak ionic product.2 The 120 μm powder also exhibited a rapid increase in reaction efficiency around the same temperature. This is evidence that the reaction begins once conditions are favourable, and is sustained until the system is cooled down or all the metal is consumed. It is possible that the reactions in this study do not actually quench on their own but were artificially quenched by beginning the cooling procedure after 30 minutes. A subject of future work would be hold the reactants at temperature longer to understand if the lower yields in pre-heat experiments are due to the reaction self-quenching or due to the shorter time exposure to oxidizer.
5 Conclusions
The high-density supercritical water proved to be the most efficient oxidizer, both in terms of rates and yields, for the aluminum powders and slugs used in this study. Three key properties linked to enhancing oxidation, low viscosity, high diffusion, and low relative permittivity, are properties of low-density supercritical water. Regardless, the highest reaction rates and hydrogen yield were observed in experiments which used the high-density (450 g L−1) supercritical water as oxidizer. The increased reaction efficiency can be attributed to the increased frequency of collisions expected from a denser oxidizer, illustrating that the benefits of increased collision frequency are greater than the drawbacks of increased viscosity and relative permittivity.A decline in peak reaction rate as water density decreased was observed in all cases, and the degree of this decline increased as particle size decreased. The decline in peak reaction rate was most notable in the 10 μm powder, indicating that finer powders are most sensitive to oxidizer density in supercritical aluminum–water reactions. In all three samples, the hydrogen yields of both the high- and low-density density water were similar, then dropped off significantly in experiments where vapour-density water was used. This is further evidence that dense water is a more effective oxidizer than water vapour, even if that water vapour is at high temperatures.
The hydrogen yields recorded in this study were lower than a previous study conducted by the authors using the same aluminum powders and slugs. The lower hydrogen yield is attributable to the shorter amount of time that the aluminum in this study was exposed to an effective oxidizer.
The results of this study are a first attempt to characterize the reaction rates of aluminum with supercritical water. While the quantitative values need to be verified with further experiments and analysis, qualitatively it can be said that dense supercritical water is the most promising oxidizer for aluminum. High-pressure, high-temperature aluminum–water reactions hold the most promise for hydrogen production rates which are high enough to meet the power demand of some of the more difficult to decarbonize power applications.
Conflicts of interest
There are no conflicts to declare.Acknowledgements
We acknowledge the support of the Natural Sciences and Engineering Research Council of Canada, the Fonds de recherche du Québec – Nature et technologies, McGill Sustainability Systems Initiative, Trottier Institute for Sustainability in Engineering and Design, and Vanier Canada Graduate Scholarships. We thank the members, past and present, of the Alternative Fuels Lab at McGill University, for their support and discussions which served to strengthen this work. We are especially grateful to J. Blanchet for his input in developing the apparatus used in this work.Notes and references
- K. A. Trowell, J. M. Bergthorson, S. Goroshin and D. L. Frost, Appl. Energy, 2020, 275, 115112 CrossRef CAS.
- K. A. Trowell, S. Goroshin, D. L. Frost and J. M. Bergthorson, Sustainable Energy Fuels, 2020, 5628–5635 RSC.
- Elysis, A new era for the aluminum industry, https://elysis.com/en Search PubMed.
- D. S. Sundaram, V. Yang, T. L. Connell Jr, G. A. Risha and R. A. Yetter, Proc. Combust. Inst., 2013, 34, 2221–2228 CrossRef CAS.
- T. R. Sippel, T. L. Pourpoint and S. F. Son, Propellants, Explos., Pyrotech., 2013, 38, 56–66 CrossRef CAS.
- G. A. Risha, T. L. Connell Jr, R. A. Yetter, D. S. Sundaram and V. Yang, J. Propul. Power, 2014, 30, 133–142 CrossRef CAS.
- J. P. Foote, B. R. Thompson and J. T. Lineberry, in Advances in Chemical Propulsion: Science to Technology, Taylor & Francis Group, 2001, ch. Combustion, pp. 133–146 Search PubMed.
- D. Barone, E. Loth, P. Weiss, B. Theobald and D. Parker, AIAA Paper, 2011, vol. 5904, p. 2011 Search PubMed.
- W. Vedder and D. A. Vermilyea, Trans. Faraday Soc., 1969, 65, 561–584 RSC.
- M. N. Larichev, in Metal Nanopowders: Production, Characterization, and Energetic Applications, ed. A. A. Gromov and U. Teipel, Wiley-VCH Verlag GmbH & Co. KGaA, Weinheim, Germany, 2014, ch. Chapter 7:, pp. 163–198 Search PubMed.
- J. Petrovic and G. Thomas, Reaction of aluminum with water to produce hydrogen, a study of issues related to the use of aluminum for On-Board vehicular hydrogen storage, US Department of Energy technical report, US Department of Energy, 2010 Search PubMed.
- B. C. Bunker, G. C. Nelson, K. R. Zavadil, J. C. Barbour, F. D. Wall, J. P. Sullivan, C. F. Windisch, M. H. Engelhardt and D. R. Baer, J. Phys. Chem. B, 2002, 106, 4705–4713 CrossRef CAS.
- Y. Yavor, S. Goroshin, J. M. Bergthorson, D. L. Frost, R. Stowe and S. Ringuette, Int. J. Hydrogen Energy, 2013, 38, 14992–15002 CrossRef CAS.
- M. Vlaskin, E. Shkolnikov and A. Bersh, Int. J. Hydrogen Energy, 2011, 36, 6484–6495 CrossRef CAS.
- P. Setiani, N. Watanabe, R. R. Sondari and N. Tsuchiya, Mater. Renew. Sustain. Energy, 2018, 7, 10 CrossRef.
- A. K. Narayana Swamy and E. Shafirovich, Combust. Flame, 2014, 161, 322–331 CrossRef CAS.
- P. Godart, J. Fischman, K. Seto and D. Hart, Int. J. Hydrogen Energy, 2019, 44, 11448–11458 CrossRef CAS.
- W.-Z. Gai, W.-H. Liu, Z.-Y. Deng and J.-G. Zhou, Int. J. Hydrogen Energy, 2012, 37, 13132–13140 CrossRef CAS.
- Y. A. Aleksandrov, E. I. Tsyganova and A. L. Pisarev, Russ. J. Gen. Chem., 2003, 73, 689–694 CrossRef CAS.
- D. Stockburger, J. H. Stannard, B. M. L. Rao, W. Kobasz and C. D. Tuck, Proc. Symp. Hydrogen Storage Mater. Batteries Electrochem., 1992, pp. 431–444 Search PubMed.
- W. M. Carroll and C. B. Breslin, Corros. Sci., 1992, 33, 1161–1177 CrossRef CAS.
- V. Rosenband and A. Gany, Int. J. Hydrogen Energy, 2010, 35, 10898–10904 CrossRef CAS.
- S. Elitzur, V. Rosenband and A. Gany, Int. J. Hydrogen Energy, 2014, 39, 6328–6334 CrossRef CAS.
- A. V. Parmuzina and O. V. Kravchenko, Int. J. Hydrogen Energy, 2008, 33, 3073–3076 CrossRef CAS.
- A. A. Vostrikov, O. N. Fedyaeva, I. I. Fadeeva and M. Y. Sokol, Russ. J. Phys. Chem. B, 2010, 4, 1051–1060 CrossRef.
- E. Czech and T. Troczynski, Int. J. Hydrogen Energy, 2010, 35, 1029–1037 CrossRef CAS.
- B. Alinejad and K. Mahmoodi, Int. J. Hydrogen Energy, 2009, 34, 7934–7938 CrossRef CAS.
- K. Mahmoodi and B. Alinejad, Int. J. Hydrogen Energy, 2010, 35, 5227–5232 CrossRef CAS.
- S. du Preez and D. Bessarabov, Int. J. Hydrogen Energy, 2021, 46, 35790–35813 CrossRef CAS.
- M. Urbonavicius, S. Varnagiris and D. Milcius, Energy Technol., 2017, 5, 2300–2308 CrossRef CAS.
- J. M. Bergthorson, Y. Yavor, J. Palecka, W. Georges, M. Soo, J. Vickery, S. Goroshin, D. L. Frost and A. J. Higgins, Appl. Energy, 2017, 186, 13–27 CrossRef CAS.
- G. Brunner, in Supercritical Fluid Science and Technology, ed. B. Gerd, Elsevier, 2014, vol. 5, pp. 9–93 Search PubMed.
- T. M. Seward and E. U. Franck, Ber. Bunsenges. Phys. Chem., 1981, 85, 2–7 CrossRef CAS.
- A. A. Galkin and V. V. Lunin, Russ. Chem. Rev., 2005, 74, 21–35 CrossRef CAS.
- H. Weingärtner and E. U. Franck, Angew. Chem., Int. Ed., 2005, 44, 2672–2692 CrossRef PubMed.
- H. Rimbach and N. D. Chatterjee, Phys. Chem. Miner., 1987, 14, 560–569 CrossRef CAS.
- H. R. Shaw and D. R. Wones, Am. J. Sci., 1964, 262, 918–929 CrossRef CAS.
- N. Kishima and H. Sakai, Earth Planet. Sci. Lett., 1984, 67, 79–86 CrossRef CAS.
- M. S. Vlaskin, G. E. Valyano, A. Z. Zhuk and E. I. Shkolnikov, Int. J. Energy Res., 2020, 44, 8689–8715 CrossRef CAS.
- Y. Marcus, Supercritical Water: A Green Solvent, Properties and Uses, Wiley, Hoboken, N.J., 2012 Search PubMed.
- R. Fernandez-Prini and R. Dooley, Release on the Static Dielectric Constant of Ordinary Water Substance for Temperatures from 238 K to 873 K and Pressures up to 1000 MPa, International association for the properties of water and steam technical report, 1997 Search PubMed.
| This journal is © The Royal Society of Chemistry 2022 |

