DOI:
10.1039/D2RA00851C
(Paper)
RSC Adv., 2022,
12, 12321-12334
Synergistic end-capped engineering on non-fused thiophene ring-based acceptors to enhance the photovoltaic properties of organic solar cells
Received
9th February 2022
, Accepted 1st April 2022
First published on 25th April 2022
Abstract
In this study, a series of non-fused thiophene ring-based small molecular acceptors (4T1–4T7) of A-D-A type are developed by the replacement of the end-groups of the 4TR molecule. The optoelectronic characteristics of the 4TR and 4T1–4T7 molecules are investigated employing the MPW1PW91 functional with the 6-31G (d,p) basis set, and solvent-state computations are studied using the TD-SCF. All the parameters estimated in this research are improved to a substantial level for the developed molecules as compared to the 4TR molecule, e.g. all the newly developed molecules have shown a red shift in their maximum absorption (λmax) and a reduced bandgap compared to the 4TR molecule, with ranges of 646 nm to 692 nm (in chlorobenzene solvent) and 2.34 eV to 2.47 eV, respectively. The reorganization energies of electron and hole mobility for almost all developed molecules are smaller than those for the 4TR molecule, with ranges of 0.00766–0.01034 eV and 0.01324–0.01447 eV, respectively. Hence, all the modified chromophores exhibit better charge capabilities than the 4TR molecule. The charge mobility of almost all the developed molecules is improved because of their reduced reorganization energies. The 4T2 molecule has minimum RE values for both electrons (0.00766) and holes (0.01324). The VOC values of all acceptor molecules are calculated with respect to the PTB7-Th donor. An elevation in VOC and FF values is exhibited by the 4T5 and 4T7 molecules. As a result, these end-capped engineered molecules should be proposed for the future manufacturing of highly efficient organic solar cells.
1 Introduction
Experts are attempting to make the transfer from fossil fuels to sustainable and infinite energy sources in order to combat global warming and pollution.1,2 Geothermal, solar, wind, tidal, and biofuels are some examples of renewable resources. Solar energy is the only abundant source, since it delivers 3.8 million EJ (EJ = 1018 J) of energy each year which is entirely unrestricted and pollutant-free.3,4 Solar cells utilize solar energy for the generation of electricity based on the photovoltaic effect; this is illustrated by the fact that when a photon of a particular energy is absorbed, free holes as well as electrons are generated in inorganic solar cells (SCs) or in the joint form in organic SCs as excitons, which create electricity as they go toward the opposite electrodes.5–7
The first generation of inorganic SCs were presented in 1954, but because of several drawbacks, such as short lifetimes, expensive synthetic approaches, and brittleness, second-generation solar cells have replaced them.8,9 Cadmium telluride (CdTe) and amorphous silicon films as well as copper indium gallium selenide (CIG), etc.,9 are thin-film photovoltaic cells that have inexpensive production approaches, are less hazardous, and have higher visible spectrum absorption; however, they have low power conversion efficiency (PCE), i.e., 7–10%.10 Meanwhile, organic solar cells (OSCs), which are third-generation solar devices, are under the consideration of researchers because of their efficient properties, such as their transparent morphology, light weight, maximum absorption, and low cost.11,12
Bulk heterojunctions are another modern approach toward photovoltaic cells in which a blended form of donor and acceptor material is present in the active layer,13 such as the bulk heterojunction of a P3HT donor and PC61BM and PC71BM acceptors in fullerene-based OSCs.14,15 In order to attain effective dissociation of excitons as well as transfer of charge, the donor and acceptor areas should possess their own consistent phase structures, correct phase sizes, maximum phase purities, and organized molecular packing and orientation. The optimization of morphology has long been an important topic in OSC research. Clearly, the active layer's shape is not only influenced by the molecular aggregation qualities of discrete donors and acceptors but also by their intramolecular interactions. Today, the majority of highly efficient OSCs depend on techniques of device optimization such as additives, solvent annealing, thermal annealing and thermal spin-coating procedures.16 Fullerene derivatives are considered good acceptor choices for organic photovoltaic (OPV) cells due to their electron-withdrawing efficiency, effective charge mobility and 3-D structures.17 Fullerene-based acceptors have affected the OPV industry though some of their imperfections, such as nontunable energy levels, structural instability, expensive production methods, and absorption of shorter wavelengths.18 Non-fullerene acceptors (NFAs) exclude the downsides of fullerene-based OSCs by their excellent properties, such as flexible structure, tunable energy levels, cost-efficient production approaches and transparent morphology.17,19,20
A variety of modifications have been performed, such as alkyl chain engineering, interfacial alteration of donor–acceptor moieties as well as substitution of the terminal ends, to tune the optoelectronic properties and increase the efficiency of non-fullerene-based OSCs.21–23 Fused ring electron-acceptors (FREAs) with an A–D–A molecular structure were described with PCEs equivalent or superior to those of the corresponding OSCs using fullerene acceptors since 2015.24 OSCs have progressed to a new level in their modification, and a number of highly efficient FREAs, such as IDIC,25 EICO-4F,26 IHIC,27 ITIC,24 BT-IC,28 and DTDP-IC,29 have emerged. In spite of their remarkable efficiency, FREAs have complicated chemical structures that need lengthy syntheses and many purification procedures, resulting in poor yields and high production costs.30 Low-cost acceptor materials should be made with a minimum of synthetic stages and simple purifying methods using readily accessible starting materials.31,32 Using widely accessible derivatives of thiophene as precursors, non-fused electron acceptors (FNEAs) were produced based on tetrathiophene groups with very high yields in two stages.30
In the present research, a non-fused tetrathiophene-based acceptor molecule with A–D–A symmetry is taken as a reference molecule (4TR). The reference molecule basically consists of four non-fused thiophene rings that are further linked to 2-(5,6-difluoro-2-methylene-3-oxo-indan-1-ylidene)-malononitrile accepting moieties at the end sites.30 We developed seven new molecules (4T1–4T7) by the modification of the terminal acceptor moieties and replaced them with new acceptor moieties, i.e. 1-dicyanomethylene-2-methylene-3-oxo-indan-5,6-dicarboxylic acid dimethyl ester (4T1), 1-dicyanomethylene-2-methylene-3-oxo-indan-5,6-dicarbonitrile (4T2), 6-cyano-1-dicyanomethylene-2-methylene-3-oxo-indan-5-carboxylic acid methyl ester (4T3), 2-(1-chloro-5-methylene-6-oxo-5,6-dihydro-cyclopenta[c]thiophen-4-ylidene)-malononitrile (4T4), 2-(2-methylene-3-oxo-2,3-dihydro-cyclopenta[b]naphthalen-1-ylidene)-malononitrile (4T5), 2-(6,7-difluoro-2-methylene-3-oxo-2,3-dihydro-cyclopenta[b]naphthalen-1-ylidene)-malononitrile (4T6) and 2-(2-bromo-6-methylene-7-oxo-6,7-dihydro-1-thia-s-indacen-5-ylidene)-malononitrile (4T7). ChemDraw geometries of all the examined molecules (4TR, 4T1–4T7) are presented in Fig. 1.
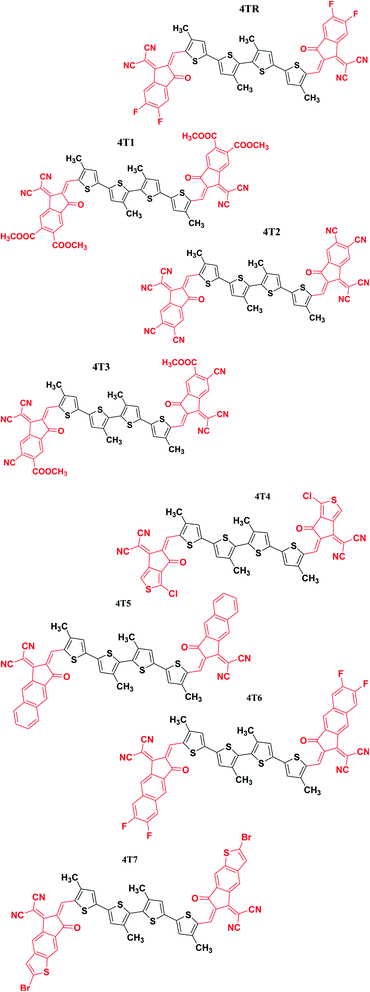 |
| | Fig. 1 ChemDraw structures of all investigated molecules (4TR, 4T1–4T7). | |
2 Computational procedure
The Gaussian 09 (ref. 33) and Gaussview 6.0 (ref. 34) software programs were used to perform quantum chemistry structure simulations based on density functional theory (DFT)35 as well as geometric visualization of the reference 4TR and the designed molecules (4T1–4T7), respectively. To compute the molar absorptivity of reference 4TR, at restricted spin, 6-3IG (d, p) basis set, four hybrid functionals: B3LYP,36 CAM-B3LYP,37 MPW1PW91,38 and wB97XD were used to optimize the ground state.39 The molar absorptivity of the 4TR molecule was also estimated by employing the ZINDO/S method.40 To model the absorption spectrum of 4TR, time-dependent self-consistent field (TD-SCF) computations in the gas phase were performed after geometry optimization.41 The integral equation formalism polarizable continuum model (IEFPCM) was employed to study the influence of a solvent (chlorobenzene).42 Swizard software43 was used to calculate the maximum absorbance value (λmax) for 4TR and the developed molecules (4T1–4T7). The plots of the molar absorption coefficient values (λmax) were drawn using Origin 6.0 software.44 The λmax achieved using the modified Perdew–Wang 1-parameter (MPW1PW91) functional was consistent with the results provided in the literature for the reference molecule 4TR, which clearly offers us a strong indication that it is suitable to calculate the modified molecules employing the nominated combination of functional and basis set.
The densities of states (DOS) of 4TR and the developed molecules (4T1–4T7) were explored using PyMOlyze-1.1 software to determine the roles of different portions of the molecules, such as the donor and acceptor portions, in the absorption.45 To show transition density matrix (TDM) results at the level of theory applied in electronic excited state computations, the Multiwfn-Multifunctional wavefunction analyzer was utilized.46
The reorganization energies (RE) in semiconducting devices are closely related to the charge (electron and hole) mobilities. The entire RE is distributed into two classes: the outer area RE (λext) and the inner region RE (λint). λint deals only with rapid changes in the internal geometry,47 and λext is only related to the external environment; hence, we can ignore it because of its minimal impact on the present research. The reorganization energies for the electrons (λe) and holes (λh) were estimated by eqn (1) and (2).48
| | |
λe= [E0− − E0] + [E−0 − E−]
| (1) |
| | |
λh = [E0+ − E0] + [E+0 − E+]
| (2) |
E0− and
E0+ represent the energies of anions and cations' neutral molecules.
E+0 and
E−0 are the ground-state energies of the anionic and cationic species, respectively.
E− and
E+ are the anion and cation energies obtained by neutral molecule anion and cation geometrical optimization, while the neutral molecule with single point energy calculated in its ground energy state is
E0.
3 Results and discussion
3.1. Method selection and structural optimization
The geometry of the reference molecule 4TR was optimized by employing for four disparate functionals, namely, B3LYP, CAM-B3LYP, MPW1PW91 and wB97XD, with the basis set 6-31G (d,p) for the measurement of maximum absorption. The λmax values of the 4TR molecule for these four functionals are 695, 497, 642, and 478 nm, respectively. The absorbance of the 4TR molecule was also estimated using the ZINDO/S method (one of the best methods for transition energy states, which is also a very effective and low-cost method49), and the observed λmax of this method for the reference molecule is 688 nm. The UV-visible spectra of the 4TR molecule with the abovementioned five methods are shown in Fig. 2, and the estimated λmax for all these methods are given in Table 1. According to the literature, the 4TR molecule exhibits significant absorbance in the 500–700 nm wavelength spectrum, with λmax around 600 nm;30 this demonstrated the closest association with the MPW1PW91 functional and 6-31G (d,p) basis set, indicating a superior choice of DFT technique after thorough consideration. As a result, this functional was selected to carry out more theoretical computations. Therefore, all the developed molecules (4T1–4T7) were optimized with the selected pair of functional and basis set, as shown in Fig. 3. Extended conjugation can be seen from the core to the terminal part of the molecules, indicating efficient charge transfer possibilities.
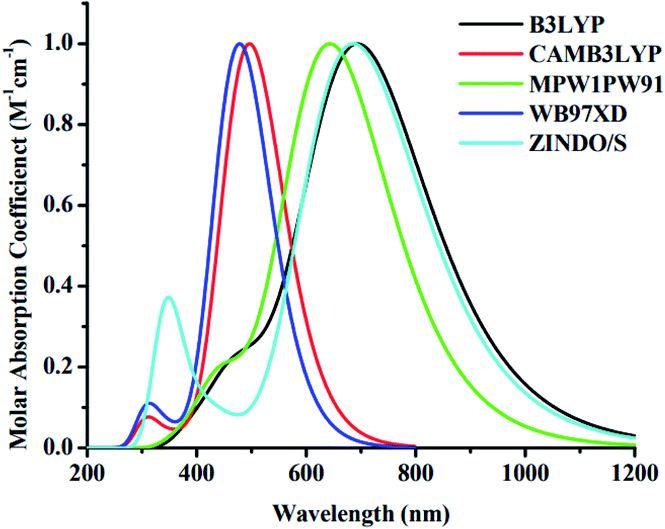 |
| | Fig. 2 UV-visible absorption spectra of 4TR molecule with five different methods. | |
Table 1 Maximum absorption of the reference molecule (4TR) obtained with different methods
| Methods |
Maximum absorption (λmax) |
| B3LYP |
695 nm |
| CAM-B3LYP |
497 nm |
| MPW1PW91 |
642 nm |
| wB97XD |
478 nm |
| ZINDO/S |
688 nm |
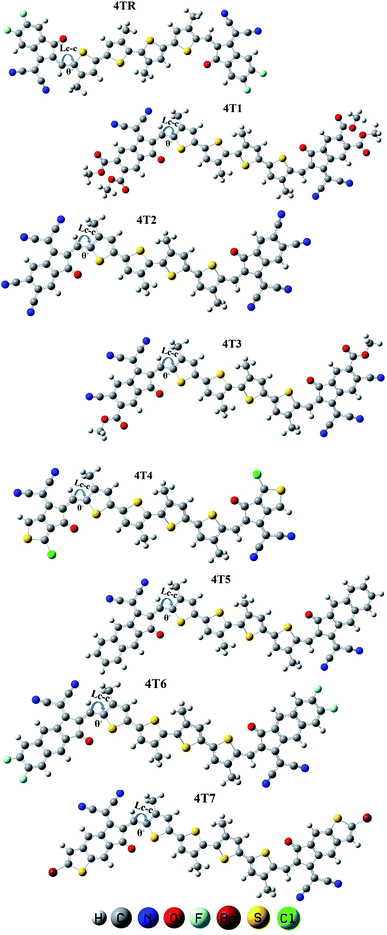 |
| | Fig. 3 Optimized geometries of 4TR and 4T1–4T7 using Gaussian 09 software. | |
The bond lengths (Lc–c) as well as the dihedral angles (θ°) of 4TR and 4T1–4T7 are listed in Table 2. It was found that the optimized structures of all the examined molecules (4TR, 4T1–4T7) possess comparable geometries, as they all have comparable bond lengths and dihedral angles. The C–C single bond length is 1.54 Å and the C![[double bond, length as m-dash]](https://www.rsc.org/images/entities/char_e001.gif) C bond length is 1.33 Å; the bond lengths of all the examined molecules ranged from 1.40 to 1.41 Å, which clearly indicates enhanced charge transport characteristics and enables the delocalization of π-electrons via conjugation. The dihedral angles of all the examined molecules have a range of 0.254–0.594°, which means that all the molecules possess a planar geometry without any twist between the non-fused thiophene groups and terminal acceptors and also without any groups causing hindrance.
C bond length is 1.33 Å; the bond lengths of all the examined molecules ranged from 1.40 to 1.41 Å, which clearly indicates enhanced charge transport characteristics and enables the delocalization of π-electrons via conjugation. The dihedral angles of all the examined molecules have a range of 0.254–0.594°, which means that all the molecules possess a planar geometry without any twist between the non-fused thiophene groups and terminal acceptors and also without any groups causing hindrance.
Table 2 Bond lengths (Lc–c) and dihedral angles (θ°) of the molecules 4TR and 4T1–4T7
| Molecules |
Bond length (Lc–c) (Å) |
Bond angle (θ°) |
| 4TR |
1.41 |
0.302 |
| 4T1 |
1.41 |
0.594 |
| 4T2 |
1.40 |
0.341 |
| 4T3 |
1.40 |
0.301 |
| 4T4 |
1.41 |
0.422 |
| 4T5 |
1.41 |
0.325 |
| 4T6 |
1.41 |
0.254 |
| 4T7 |
1.41 |
0.238 |
3.2. Frontier molecular orbitals (FMOs) analysis
Frontier molecular orbitals (FMOs, also known as the HOMO and LUMO) are important parameters of quantum chemistry that are studied to quantify transfer of charge, charge mobility, and molecular correlation.50,51 The valence band HOMO provides electrons, whereas the conduction band LUMO receives them. The energy gap (Eg) shows the need for dissociation of excitons and is thus a distinguishing feature of SCs and other PV devices.50,52 The electrical energy levels of an organic solar device are inversely related to the PCE, i.e., a smaller band gap results in greater efficiency. By the modification of the parent molecule 4TR, such as replacement of the terminal acceptor groups in this case, the HOMO–LUMO gap (Eg) can be improved. The charge distribution patterns in the FMOs of the reference molecule with all altered molecules at the MPW1PW91/6-31G (d,p) level are presented in Fig. 4.
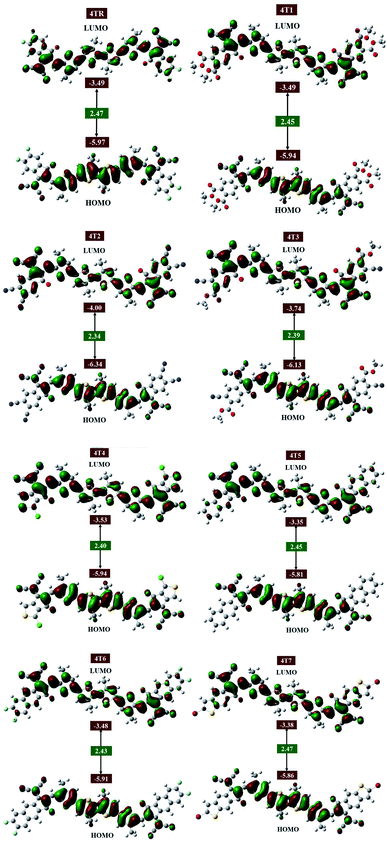 |
| | Fig. 4 Frontier molecular orbitals (FMOs) of molecules 4TR and 4T1–4T7. | |
In reference 4TR, the bonding orbitals have a calculated energy of −5.97 eV, while the antibonding orbitals have a calculated value of −3.49 eV with a bandgap of 2.47 eV; this is greater than the Eg values of all the developed molecules (4T1–4T7), because the 4T1–4T7 molecules have efficient electron-withdrawing acceptor parts at the end sites of the molecules, and therefore these modified molecules possess shorter bandgaps than the 4TR molecule. In all the investigated molecules (4TR, 4T1–4T7), the charge density is mainly dominated by the non-fused thiophene core part of the molecules at the ground state, and the charge shifts to the terminal acceptor groups of the molecules in the excited state. The band gaps of the reference and created compounds, as well as their HOMO and LUMO energies, are listed in Table 3. The HOMO and LUMO energy levels for all the examined molecules have a sequence of 4T2 < 4T3 < 4TR < 4T4 = 4T1< 4T6 < 4T7 < 4T5 and 4T2 < 4T3 < 4T4 < 4T1 = 4TR < 4T6 < 4T7 < 4T5, respectively. All the compounds developed exhibit a narrow bandgaps than the 4TR; only the 4T7 molecule has a comparable bandgap with the 4TR molecule. The declining order of Eg for all the developed molecules is 4T7 > 4T1 = 4T5 > 4T6 > 4T4 > 4T3 > 4T2. In general, molecules with robust electron-withdrawing moieties possess a smaller bandgap as well as greater light absorption, encouraging charge mobility.53 The results illustrate that 4T2 possesses a smaller bandgap of 2.34 eV than all other examined molecules; the reason is the presence of a robust electron-withdrawing acceptor group at the terminal position, i.e., 1-dicyanomethylene-2-methylene-3-oxo-indan-5,6-dicarbonitrile, which indicates the greatest mobility of charge from the HOMO to the LUMO.
Table 3 HOMO, LUMO, Eg, ionization potentials (IPs), and electron affinities (EAs) of molecules 4TR and 4T1–4T7
| Molecules |
HOMO (eV) |
LUMO (eV) |
Eg (eV) |
IP (eV) |
EA (eV) |
| 4TR |
−5.97 |
−3.49 |
2.47 |
5.97 |
3.49 |
| 4T1 |
−5.94 |
−3.49 |
2.45 |
5.94 |
3.49 |
| 4T2 |
−6.34 |
−4.00 |
2.34 |
6.34 |
4.00 |
| 4T3 |
−6.13 |
−3.74 |
2.39 |
6.13 |
3.74 |
| 4T4 |
−5.94 |
−3.53 |
2.40 |
5.94 |
3.53 |
| 4T5 |
−5.81 |
−3.35 |
2.45 |
5.81 |
3.35 |
| 4T6 |
−5.91 |
−3.48 |
2.43 |
5.91 |
3.48 |
| 4T7 |
−5.86 |
−3.38 |
2.47 |
5.86 |
3.38 |
3.3. Ionization potential and electron affinity
Ionization potential (IP) and electron affinity (EA) are suitable parameters to investigate charge transfer capabilities.54 Charge transfer is improved when chromophores have a low IP and a high EA, because electron-donating groups destabilize the HOMO energy level via promoting electron transport;55 on the other hand, molecules with robust electron-withdrawing moieties have larger IPs owing to the stability of the HOMO level, and removing electrons is difficult.56 The IP and EA values of all the considered molecules were calculated by using eqn (3) and (4), as suggested by Koopman's theorem,57,58 and they are given in Table 3.
4T5 has the lowest IP (5.81 eV) and smallest EA (3.35 eV) due to its highest HOMO (−5.81 eV). 4T2 possesses the highest IP (6.34 eV) and greatest EA (4.00 eV) because it possesses the lowest HOMO (−6.34 eV).
3.4. Absorption spectra
The electrical specifications of chromophores can be estimated by employing quantum absorbance spectra. Chromophores are stimulated when they absorb photons of a specific energy relating to their respective band gaps. The absorbance spectrum (λmax), excitation energy (Ex), oscillator strength (f), assignment and dipole moment (D) of all the considered molecules were investigated by employing MPW1PW91/6-31G (d,p) in both the gas and solvent (chlorobenzene) forms and are given in Tables 4 and 5, respectively. The UV-visible spectra of molecules 4TR and 4T1–4T7 are represented in Fig. 5. Oscillator strength (f) is dimensionless, and it is critical in identifying the optical characteristics of photovoltaic cells and in calculating the radiation intensity emitted as a consequence of electrical excitation between two levels of energy. Ex is the amount of energy that is mandatory for the possible transition; therefore, the increment of the oscillator strength (f), lower excitation energy, and wide absorption spectrum at the red shift are all predicted to result in efficient ICT. A considerable red shift was observed in the absorption of all the molecules compared to that of the 4TR molecule. The increasing absorption order of all the explored molecules in the gaseous form is 4TR < 4T7 < 4T1 = 4T5 < 4T4 < 4T6 < 4T3 < 4T2, and the increasing sequence in the solvent (chlorobenzene) phase is 4TR < 4T7 < 4T5 < 4T4 < 4T6 = 4T1 < 4T3 < 4T2. It is clear from the results that 4T2 exhibits the λmax of 634 nm in the gas phase and 692 nm in chlorobenzene. In chlorobenzene solvent, all of the molecules displayed a bathochromic shift because the polar excited state was stabilized using a polar solvent. The LUMO produced a contraction in the Eg and a rise in the wavelength because of the reverse connection between energy and wavelength.4
Table 4 The λmax values, excitation energies (Ex), oscillator strengths (f), assignments and dipole moments (D) of all the considered molecules in the gaseous phase
| Molecules |
Exp. λmax (nm) |
Calculated λmax (nm) |
Ex (eV) |
Oscillator strength (f) |
Assignment |
(D) |
| 4TR |
∼600 |
600 |
2.07 |
2.36 |
H–L (+97%) |
3.27 |
| 4T1 |
— |
608 |
2.04 |
2.44 |
H–L (+97%) |
4.15 |
| 4T2 |
— |
634 |
1.96 |
2.35 |
H–L (+97%) |
2.34 |
| 4T3 |
— |
623 |
1.99 |
2.37 |
H–L (+97%) |
3.24 |
| 4T4 |
— |
611 |
2.03 |
2.42 |
H–L (+97%) |
2.98 |
| 4T5 |
— |
608 |
2.04 |
2.56 |
H–L (+97%) |
3.84 |
| 4T6 |
— |
614 |
2.02 |
2.58 |
H–L (+97%) |
3.44 |
| 4T7 |
— |
604 |
2.05 |
2.66 |
H–L (+97%) |
3.35 |
Table 5 The λmax values, excitation energies (Ex), oscillator strengths (f), assignments and dipole moments (D) of all the considered molecules in the solvent (chlorobenzene) form
| Molecules |
Exp. λmax (nm) |
Calculated λmax nm |
Ex (eV) |
Oscillator strength (f) |
Assignment |
(D) |
| 4TR |
∼600 |
642 |
1.92 |
2.61 |
H–L (+96%) |
4.01 |
| 4T1 |
— |
657 |
1.89 |
2.62 |
H–L (+95%) |
4.86 |
| 4T2 |
— |
692 |
1.79 |
2.47 |
H–L (+95%) |
2.90 |
| 4T3 |
— |
676 |
1.84 |
2.55 |
H−L (+95%) |
3.84 |
| 4T4 |
— |
656 |
1.89 |
2.71 |
H–L (+96%) |
3.59 |
| 4T5 |
— |
652 |
1.90 |
2.83 |
H–L (+95%) |
4.73 |
| 4T6 |
— |
657 |
1.89 |
2.85 |
H–L (+95%) |
4.25 |
| 4T7 |
— |
646 |
1.92 |
2.89 |
H–L (+95%) |
4.09 |
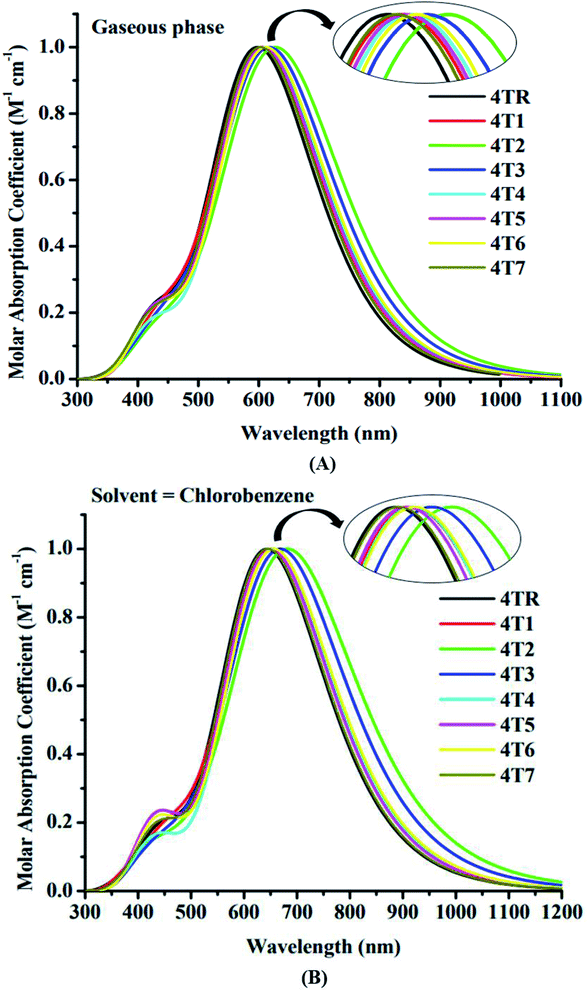 |
| | Fig. 5 UV-visible absorption spectra of molecules 4TR and 4T1–4T7 in the gaseous phase (A) and solvent phase (B). | |
3.5. Dipole moment
The dipole moment (D), which concerns the electron density and polarization of organic molecules, is a crucial aspect that adequately validates the photovoltaic activity of OSCs. The dipole moment determines the solubility of engineered molecules in polar organic solvents.59 The dipole moment describes the efficient flow of electrons and holes between the donor and acceptor components. A large value of D indicates enhanced crystallinity and opens the possibility of electron–hole transit by increasing atom self-assembly.2 The dipole moment values of molecules 4TR and 4T1–4T7 in both the gaseous and solvent phases are given in Tables 4 and 5, respectively. All the examined molecules possess the same increasing sequence of D in both the gaseous as well as the solvent phase, i.e., 4T2 < 4T4 < 4T3 < 4TR < 4T7 < 4T6 < 4T5 < 4T1. In the present case, the 4T2 molecule has the smallest dipole moment both in the gaseous and solvent forms, clearly indicating its lessened charge transfer and reduced solubility in solvent, while the 4T1 molecule possesses the greatest dipole moment in both phases because it has two different and robust electron-withdrawing groups (COOCH3 and CN) at the edges of the acceptors, indicating efficient solubility in solvent and proficient charge transfer.
3.6. Density of states (DOS)
DOS investigations are performed to further validate the roles of each fragment of a molecule, i.e., donor and acceptor, in the charge mobility of the molecule, as it is a helpful aspect for determining the arrangement of the electronic density distribution on the FMOs based on the Mulliken charge distribution theory.60,61 DOS computations of all the examined molecules were executed by employing the MPW1PW91/6-31G (d, p) method, and the graphs were drawn using PyMOlyze 1.1 software. These graphs have the energy (eV) on the x-axis and the relative intensity on the y-axis. For the analysis of the contributions of specific fragments of the molecules to the FMOs, each molecule was segmented into two parts, i.e., donor and acceptor. In the graphs of 4TR and 4T1–4T7, red, black and green lines represent the involvements of the donor and acceptor and the total contribution of the moieties to increasing the FMOs, respectively, as represented in Fig. 6, and the contribution data is listed in Table 6.
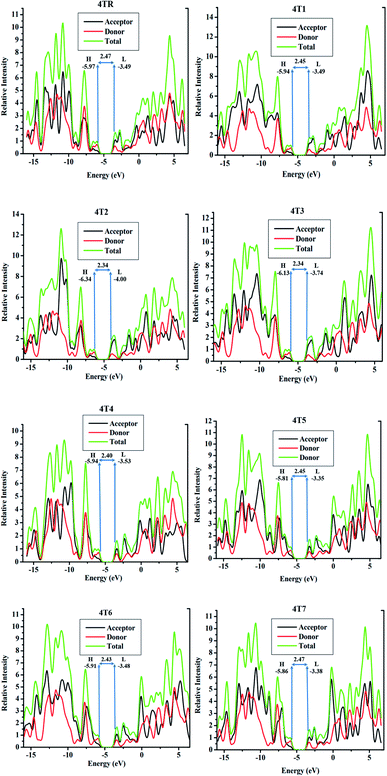 |
| | Fig. 6 DOS analysis spectra of molecules 4TR and 4T1–4T7. | |
Table 6 Influence of the donor and acceptor moieties on elevating the HOMO and LUMO of molecules 4TR and 4T1–4T7
| Molecules |
Donor (eV) |
Acceptor (eV) |
| 4TR |
HOMO |
75.0 |
25.0 |
| LUMO |
40.8 |
59.2 |
| 4T1 |
HOMO |
74.1 |
25.9 |
| LUMO |
38.8 |
61.2 |
| 4T2 |
HOMO |
73.6 |
26.4 |
| LUMO |
35.4 |
64.6 |
| 4T3 |
HOMO |
73.7 |
26.3 |
| LUMO |
36.3 |
63.7 |
| 4T4 |
HOMO |
73.5 |
26.5 |
| LUMO |
41.7 |
58.3 |
| 4T5 |
HOMO |
72.9 |
27.1 |
| LUMO |
39.8 |
60.2 |
| 4T6 |
HOMO |
72.8 |
27.2 |
| LUMO |
39.5 |
60.5 |
| 4T7 |
HOMO |
73.6 |
26.4 |
| LUMO |
41.5 |
58.5 |
The results from the DOS analysis of all the molecules (4TR and 4T1–4T7) illustrated that all the molecules have comparable contributions of donor and acceptor, i.e., the donor fragment makes the major contribution in the ground state and the acceptor moieties are dominant in the excited state; this evidently signifies the conjugation and facilitating the charge transfer from the donor to the acceptor moieties of the molecules, which will possibly improve the overall efficacy of organic SCs. These results also support the FMO analysis for reference and the designed molecules as stated above, as shown by Fig. 4. The results illustrate that the electron-rich donor core majorly participates in the HOMO, and the charge shifts from the core donor to the terminal acceptor part, which is the LUMO; moreover, the participation of the acceptor moieties is greater in almost all the newly developed molecules compared to the 4TR molecule, proving the efficient charge transfer and the greater efficiency of the molecules.
3.7. Reorganization energy
The reorganization energy (RE), which quantifies the movement of charge from the donor to the acceptor fragments and is coupled to the hole and electron migration charge, is the driving factor in developing competent materials for OSCs.62 The charge mobility is inversely related to the RE. The smaller the RE value, the more efficient the charge transfer that will take place.63 The RE is affected by many factors, including the geometry of cations and anions. The electron mobility of acceptor and donor groups depends on their anionic and cationic geometries, respectively. The RE values of electrons and holes for all the examined molecules were calculated using eqn (1) and (2), and the values are listed in Table 7.
Table 7 RE values of electron (λe) and hole (λh) mobilities for molecules 4TR and 4T1–4T7
| Molecules |
λe (electron) |
λh (hole) |
| 4TR |
0.01034 |
0.01398 |
| 4T1 |
0.00987 |
0.01447 |
| 4T2 |
0.00766 |
0.01324 |
| 4T3 |
0.00854 |
0.01388 |
| 4T4 |
0.00975 |
0.01342 |
| 4T5 |
0.00943 |
0.01377 |
| 4T6 |
0.00940 |
0.01390 |
| 4T7 |
0.01025 |
0.01387 |
All the modified molecules (4T1–4T7) possess smaller electron mobility energies compared with 4TR, demonstrating that they have good electron mobilities and are hence excellent electron transporters. The decreasing sequence for λe is 4TR > 4T7 > 4T1 > 4T4 > 4T5 > 4T6 > 4T3 > 4T2. The hole (λh) mobility value for the 4TR molecule is 0.01398 eV, and it is estimated that all the modified molecules except 4T1 have smaller values. The computationally calculated hole (λh) mobility values have an order of 4T1 > 4TR > 4T6 > 4T3 > 4T7 > 4T5 > 4T4 > 4T2. It was determined from the computationally analysed results that 4T2 has the lowest RE values for both electrons and holes; hence, it possesses the maximum electron and hole mobility. Overall, the results demonstrate that the modification of the 4TR molecule by new acceptor groups has a positive influence on the charge transfer capabilities of the molecules.
3.8. Light harvesting efficiency (LHE)
The capability of a compound to generate charge after light collection or to induce the conducting band is also a vital factor to consider for any component used in a solar cell. Eqn (5) was used to determine the LHE.64
In the equation above, LHE is symbolised by ηλ and f is the oscillator strength. The oscillator strength of the solvent phase is used for the attribution of LHE. The computationally calculated values of LHE for 4TR and 4T1–4T7 are listed in Table 8. Among all the molecules, 4T7 has the maximum LHE value (0.9987). According to the following eqn (6),65 LHE has a direct relationship with the short circuit current (JSC):
| |
 | (6) |
where LHE stands for the light harvesting efficiency,
JSC for the short circuit current,
ηcollect for the determined charge assembly, and
ϕinjected for the electron injection in the above equation. Because the above equation links LHE with
JSC, the changes in LHE were shown to have a direct effect on
JSC.
Table 8 Oscillator strength (f) and LHE values of molecules 4TR and 4T1–4T7
| Molecules |
Oscillator strength (f) |
LHE |
| 4TR |
2.61 |
0.9975 |
| 4T1 |
2.62 |
0.9976 |
| 4T2 |
2.47 |
0.9966 |
| 4T3 |
2.55 |
0.9971 |
| 4T4 |
2.71 |
0.9980 |
| 4T5 |
2.83 |
0.9985 |
| 4T6 |
2.85 |
0.9985 |
| 4T7 |
2.89 |
0.9987 |
3.9. Molecular electrostatic potential (MEP)
MEP illustrates the 3-D charge dispersal taking place in a molecule and indicates the electron-rich and electron-poor sites of the molecule.66 MEPs are colorful maps that indicate the existence of electron-withdrawing moieties, lone pairs and electrons on the molecular surface. The colored MEP maps of 4TR and 4T1–4T7 are shown in Fig. 7. Red color on the maps specifies the negative region where excessive electron density is present, green color shows the neutral sites, and blue color indicates the positive region, i.e., electron-deficient sites. The maps of the investigated molecules show red color on the oxygen and nitrogen atoms and a small amount of red color on the fluorine atoms present on the terminal acceptor groups, indicating strong electron density on these sites. Meanwhile, the core of non-fused thiophene rings with carbon atoms in the vicinity presents blue color on the MEP maps, representing an extreme deficiency of electrons on those particular positions of the molecules.
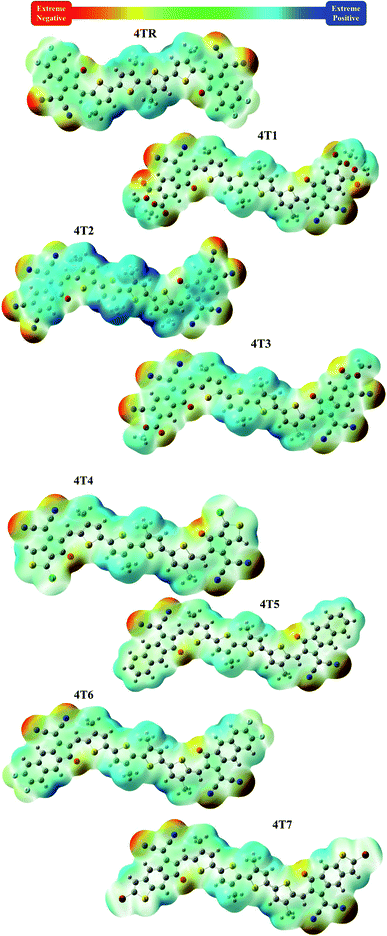 |
| | Fig. 7 Coloured MEP maps of molecules 4TR and 4T1–4T7. | |
3.10. Transition density matrix (TDM) and exciton binding energy
TDM gives qualitative information regarding the two-dimensional movement of electrons, the dynamics of the transition as well as the electronic excitation of related hole–electron pairs inside molecular structures that are conjugated.67 A DFT model was used to compute the TDM energy with the MPW1PW91/6-31G (d,p) method, and then the schemes were plotted using g Multiwfn_3.7 (Multiwavefunction); the x-axis and the left y-axis represent the total numbers of atoms present in that particular molecule, but these numbers do not include hydrogen atoms because the system eliminates them by default because of their minute involvement in excitation. The y-axis (right side) shows the values of the electron density coefficient. In all the examined molecules (4TR and 4T1–4T7), the electron density is dispersed over all the molecules, mainly on their donor region, as shown in Fig. 8. Electronic consistency spreads diagonally and off-diagonally, but more dominantly diagonally, from donor to acceptor. The scheme illustrated effectual charge dispersal from the donor to the acceptor moiety of the molecule, indicating the efficient transfer of electrons from the donor to the acceptor by successive conjugation. The declining sequence of the interaction coefficients for 4TR and 4T1–4T7 is 4T4 > 4TR > 4T5 = 4T6 > 4T1 = 4T3 = 4T7 > 4T2, and the values are given in Table 9. 4T2 has the lowest value of the interaction coefficient, demonstrating efficient charge transfer from the donor to the acceptor part of the molecule.
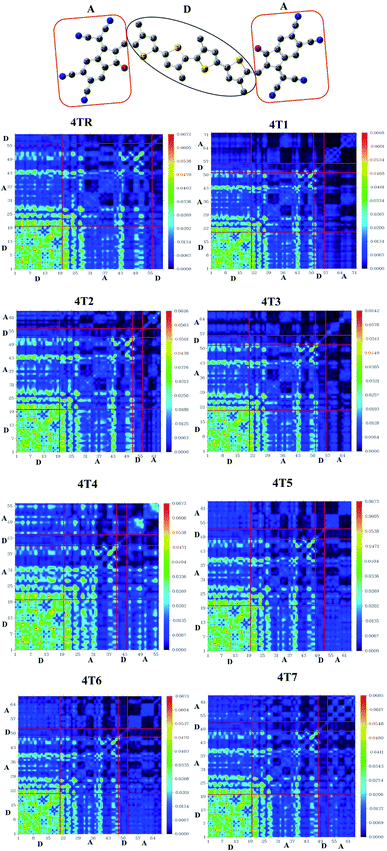 |
| | Fig. 8 TDM plots of molecules 4TR and 4T1–4T7 (A = acceptor, D = donor). | |
Table 9 Bandgap (Eg) and Eb values in the gas and solvent phases and interaction coefficients of molecules 4TR and 4T1–4T7
| Molecules |
Eg (eV) |
Eb (eV)Gaseous |
Eb (eV) Solvent |
Interaction coefficient |
| 4TR |
2.47 |
0.40 |
0.55 |
0.691 |
| 4T1 |
2.45 |
0.41 |
0.56 |
0.689 |
| 4T2 |
2.34 |
0.38 |
0.55 |
0.688 |
| 4T3 |
2.39 |
0.40 |
0.55 |
0.689 |
| 4T4 |
2.40 |
0.37 |
0.51 |
0.693 |
| 4T5 |
2.45 |
0.41 |
0.55 |
0.690 |
| 4T6 |
2.43 |
0.41 |
0.54 |
0.690 |
| 4T7 |
2.47 |
0.42 |
0.55 |
0.689 |
Exciton binding energy (Eb) is a useful method for generating coulombic forces among charge carriers in conjugated molecules as a consequence of photoexcitation. There is less coulombic interaction between the electron–hole pairs of molecules with lower binding energies, and they move more quickly toward their corresponding electrodes. Eb was calculated by using eqn (7).68
Here,
Eg is the bandgap and
Ex is the first excitation energy. The
Eb values of all the examined molecules were estimated in both gas and solvent phases and are listed in
Table 9. Among all the investigated molecules,
4T4 has the smallest
Eb value in the gaseous and solvent phases; therefore, its exciton easily diffuses into independent charge carriers, making it a unique option for higher current charge density. Polar solvents interact and strongly bond with excitons; therefore,
Eb has a higher value in chlorobenzene than in the gaseous form.
3.11. Photovoltaic performance
Open circuit voltage (VOC) is an influential aspect to estimate the maximum efficacy of an OSC. The supreme current which can be achieved from an electrical equipment while the input voltage is zero is called VOC.69 Certain factors that impact VOC include the light intensity, temperature of the solar cell, and charge mobility as well as the difference in energy between the acceptor's LUMO and the donor's HOMO.70 In this study, the HOMO of PTB7-Th as a donor molecule was compared to the LUMOs of all the acceptor molecules (4T1–4T7), and VOC was estimated computationally. PTB7-Th is a competent donor, with −5.20 eV energy of its HOMO and −3.60 energy of its LUMO as reported in the literature.71 The given eqn (8) was employed to calculate the VOC values of our investigated molecules by forming their complexes with the PTB7-Th donor.| |
 | (8) |
In the preceding equation, e is the molecule charge, which is 1; 0.3 is the commonly used number for intersurface charge generation. Table 10 shows the computed VOC values of all the studied compounds. The HOMO and LUMO energy levels of the PTB7-Th donor and examined acceptor molecules with the calculated VOC values are shown in Fig. 9. The increasing sequence of VOC for the reference and modified molecules is 4T2 < 4T3 < 4T4 < 4TR = 4T1 < 4T6 < 4T7 < 4T5. According to the given increasing order, the 4T5 molecule possesses the greatest VOC value; therefore, it can be utilized to boost the power PCEs of OSCs.
Table 10 Open circuit voltage (VOC), normalized VOC and fill factor (FF) values of molecules 4TR and 4T1–4T7
| Molecules |
VOC (eV) |
Normalized VOC |
FF |
| 4TR |
2.01 |
77.75 |
0.9319 |
| 4T1 |
2.01 |
77.75 |
0.9319 |
| 4T2 |
1.50 |
58.02 |
0.9140 |
| 4T3 |
1.76 |
68.07 |
0.9235 |
| 4T4 |
1.97 |
76.29 |
0.9308 |
| 4T5 |
2.15 |
83.14 |
0.9354 |
| 4T6 |
2.02 |
78.13 |
0.9321 |
| 4T7 |
2.12 |
82.01 |
0.9347 |
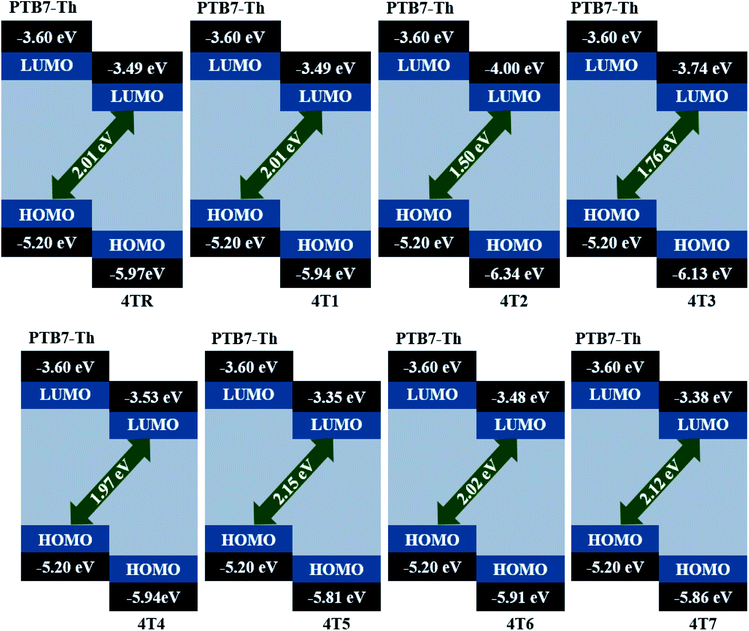 |
| | Fig. 9 Theoretically estimated VOC values of molecules 4TR and 4T1–4T7 with the PTB7-Th donor. | |
3.12. Fill factor (FF)
The fill factor (FF) has a direct link to the PCE of an SC as another critical component. It is a parameter that is mostly determined by the donor–acceptor VOC. Using eqn (9), FF was calculated:72| |
 | (9) |
 is the normalized VOC in the above equation, and e is the standard charge, which is constantly 1. KB is the Boltzmann constant, and it has a value of 8.61733034 × 10⁻⁵ electron volts per kelvin. T is the temperature, which is constant (300 K). The computationally estimated normalized VOC and FF values for molecules 4TR and 4T1–4T7 are listed in Table 10. The range of normalized VOC is from 58.02 eV to 83.14 eV, and FF ranges from 0.9140 to 0.9354 with the same increasing sequence as VOC, i.e., 4T2 < 4T3 < 4T4 < 4TR = 4T1 < 4T6 < 4T7 < 4T5.
The power conversion efficiency (PCE) is a method for gathering all the performance characteristics of a solar cell in a single value to verify that a photovoltaic substance is efficient enough for effective application. When analysing PCE, JSC, FF, and VOC are all critical factors to consider, as shown in the given eqn (10).73
| |
 | (10) |
PCE is directly related to the aspects of FF, VOC, and JSC. Pin is a constant value that represents the strength of incoming light hitting the cell interface. Theoretically, the FF and VOC values, and JSC, which is directly connected to LHE, were determined. The 4T5, 4T6 and 4T7 molecules possess better VOC, normalized VOC, FF and LHE values as compared to the reference molecule 4TR; therefore, it can be estimated that these molecules have improved PCEs as compared to the 4TR molecule.
4 Conclusion
In the present research, we designed a series of non-thiophene ring-based acceptor–donor-acceptor type molecules (4T1-4T7) by replacing the end-capped acceptor groups of the 4TR molecule. The optoelectronic characteristics of molecules 4TR and 4T1–4T7, such as the maximum absorption (λmax), frontier molecular orbitals (FMOs), density of states (DOS), dipole moment, transition density matrix (TDM), reorganization energy, LHE, and VOC, were investigated using the MPW1PW91 functional with the 6-31G (d,p) basis set, and the solvent state computations were studied using TD-SCF. The λmax values of all the developed molecules (4T1–4T7) were shifted toward higher wavelengths, ranging from 646 to 692 nm, as compared to the λmax of the reference 4TR (642 nm). Except for 4T7, all the developed molecules have shorter bandgaps compared to the reference molecule, ranging from 2.47 to 2.34 eV; the 4T2 molecules possesses the lowest Eg value of 2.34 eV. Almost all the developed molecules possess better charge mobility capacities because of their lower RE values as compared to the reference molecule, ranging from 0.01034 to 0.00766 eV for electron mobility and 0.01447 to 0.01324 eV for hole mobility; 4T2 has the minimum RE values for both electrons (0.00766) and holes (0.01324). Among all the examined molecules, 4T4 has the smallest Eb value in the gaseous phase (0.34 eV) and the solvent phase (0.51 eV); therefore, its excitons easily diffuse into independent charge carriers. 4T2 has the lowest interaction coefficient (0.688), demonstrating efficient transfer of charge from the donor to the acceptor moieties of the molecule. The VOC values of all the studied acceptor compounds were estimated by forming their complexes with PTB7-Th as a donor; the values ranged from 1.50 to 2.12 eV. The normalized VOC and FF values have ranges of 58.02–83.14 eV and 0.9140–0.9354, respectively. 4T5 has the maximum VOC, normalized VOC and FF compared to the other studied molecules. The calculated findings show that the examined acceptor molecules performed more efficiently as compared to the previously reported molecule 4TR. As a result, the developed molecules must be utilized to create OSCs that work well.
Author contributions
Ehsan Ullah Rashid: writing-original draft, acquisition, analysis, working and interpretation of data. Rasheed Ahmad Khera*: project administration, acquisition, analysis, visualization, review and editing. Muhammad Imran Khan: data curation, formal analysis and interpretation of data. Javed Iqbal*: conceptualization, funding acquisition, investigation, review and editing.
Conflicts of interest
The Authors declare no conflict of interest.
Acknowledgements
The authors acknowledge the technical and financial support from Punjab Bio-energy Institute (PBI) and department of chemistry, university of agriculture (UAF), Faisalabad 38000, Pakistan. The authors gratefully acknowledge the financial support provided from the Taif University Researchers Supporting Project number TURSP-2020/106, Taif University, Taif, Saudi Arabia. The authors also thank Dr Khurshid Ayub, COMSATS University, Islamabad, Abbottabad Campus, Pakistan for additional resources.
References
- Q. Deng, R. Alvarado, E. Toledo and L. Caraguay, Environ. Sci. Pollut. Res., 2020, 27, 14477–14491 CrossRef PubMed.
- M. Rafiq, R. A. Khera, M. Salim, M. Khalid, K. Ayub and J. Iqbal, Chem. Phys. Lett., 2021, 782, 139018 CrossRef CAS.
- A. K. Abdelsalam, H. T. Shahin and I. Morsi, 2017.
- U. Azeem, R. A. Khera, A. Naveed, M. Imran, M. A. Assiri, M. Khalid and J. Iqbal, ACS Omega, 2021, 6, 28923–28935 CrossRef CAS PubMed.
- M. A. Hasan and K. Sumathy, Renew. Sustain. Energy Rev., 2010, 14, 1845–1859 CrossRef.
- N. Panwar, S. Kaushik and S. Kothari, Renew. Sustain. Energy Rev., 2011, 15, 1513–1524 CrossRef.
- P. S. Gangadhar, G. Reddy, S. Prasanthkumar and L. Giribabu, Phys. Chem. Chem. Phys., 2021, 23, 14969–14996 RSC.
- J. Zhao, A. Wang, M. A. Green and F. Ferrazza, Appl. Phys. Lett., 1998, 73, 1991–1993 CrossRef CAS.
- R. W. Miles, G. Zoppi and I. Forbes, Mater. Today, 2007, 10, 20–27 CrossRef CAS.
- A. M. Bagher, M. M. A. Vahid and M. Mohsen, Am. J. Opt. Photon., 2015, 3, 94–113 CrossRef.
- R. Jin, X. Zhang and W. Xiao, Molecules, 2020, 25, 667 CrossRef CAS PubMed.
- L. Meng, Y. Zhang, X. Wan, C. Li, X. Zhang, Y. Wang, X. Ke, Z. Xiao, L. Ding and R. Xia, Science, 2018, 361, 1094–1098 CrossRef CAS PubMed.
- J. Roncali, Accounts Chem. Res., 2009, 42, 1719–1730 CrossRef CAS PubMed.
- J. Zhou, Y. Zuo, X. Wan, G. Long, Q. Zhang, W. Ni, Y. Liu, Z. Li, G. He and C. Li, J. Am. Chem. Soc., 2013, 135, 8484–8487 CrossRef CAS PubMed.
- S. Li, W. Liu, M. Shi, J. Mai, T.-K. Lau, J. Wan, X. Lu, C.-Z. Li and H. Chen, Energy Environ. Sci., 2016, 9, 604–610 RSC.
- Y. Lin, Q. He, F. Zhao, L. Huo, J. Mai, X. Lu, C.-J. Su, T. Li, J. Wang and J. Zhu, J. Am. Chem. Soc., 2016, 138, 2973–2976 CrossRef CAS PubMed.
- G. Zhang, J. Zhao, P. C. Chow, K. Jiang, J. Zhang, Z. Zhu, J. Zhang, F. Huang and H. Yan, Chem. Rev., 2018, 118, 3447–3507 CrossRef CAS PubMed.
- Q. Nie, A. Tang, Q. Guo and E. Zhou, Nano Energy, 2021, 87, 106174 CrossRef CAS.
- Y. Lin, Y. Li and X. Zhan, Chem. Soc. Rev., 2012, 41, 4245–4272 RSC.
- Y. He and Y. Li, Phys. Chem. Chem. Phys., 2011, 13, 1970–1983 RSC.
- J. Min, Y. N. Luponosov, A. Gerl, M. S. Polinskaya, S. M. Peregudova, P. V. Dmitryakov, A. V. Bakirov, M. A. Shcherbina, S. N. Chvalun and S. Grigorian, Adv. Energy Mater., 2014, 4, 1301234 CrossRef.
- W. Zhao, S. Li, H. Yao, S. Zhang, Y. Zhang, B. Yang and J. Hou, J. Am. Chem. Soc., 2017, 139, 7148–7151 CrossRef CAS PubMed.
- A. Rasool, S. Zahid, R. A. Shehzad, M. S. Akhter and J. Iqbal, J. Theor. Comput. Chem., 2021, 1203, 113359 CrossRef CAS.
- Y. Lin and J. Wang, Adv. Mater., 2015, 27, 1170 CrossRef CAS PubMed.
- B. Guo, W. Li, X. Guo, X. Meng, W. Ma, M. Zhang and Y. Li, Adv. Mater., 2017, 29, 1702291 CrossRef PubMed.
- H. Yao, Y. Cui, R. Yu, B. Gao, H. Zhang and J. Hou, Angew. Chem., 2017, 129, 3091–3095 CrossRef.
- W. Wang, C. Yan, T. K. Lau, J. Wang, K. Liu, Y. Fan, X. Lu and X. Zhan, Adv. Mater., 2017, 29, 1701308 CrossRef.
- Y. Li, L. Zhong, B. Gautam, H.-J. Bin, J.-D. Lin, F.-P. Wu, Z. Zhang, Z.-Q. Jiang, Z.-G. Zhang and K. Gundogdu, Energy Environ. Sci., 2017, 10, 1610–1620 RSC.
- M. Li, Y. Zhou, J. Zhang, J. Song and Z. Bo, J. Mater. Chem. A, 2019, 7, 8889–8896 RSC.
- Y. Zhou, M. Li, H. Lu, H. Jin, X. Wang, Y. Zhang, S. Shen, Z. Ma, J. Song and Z. Bo, Adv. Funct. Mater., 2021, 31, 2101742 CrossRef CAS.
- X. Li, F. Pan, C. Sun, M. Zhang, Z. Wang, J. Du, J. Wang, M. Xiao, L. Xue and Z.-G. Zhang, Nat. Commun., 2019, 10, 1–11 CrossRef PubMed.
- Z.-P. Yu, Z.-X. Liu, F.-X. Chen, R. Qin, T.-K. Lau, J.-L. Yin, X. Kong, X. Lu, M. Shi and C.-Z. Li, Nat. Commun., 2019, 10, 1–9 CrossRef PubMed.
- A. Frisch, Gaussian 09W Reference, Wallingford, USA, 2009, 25 Search PubMed.
- H. Qin, Guangzhou Chem. Ind., 2012, 10, 199–202 Search PubMed.
- T. Tsuneda, Density Functional Theory in Quantum Chemistry, 2014 Search PubMed.
- B. Civalleri, C. M. Zicovich-Wilson, L. Valenzano and P. Ugliengo, CrystEngComm, 2008, 10, 405–410 RSC.
- T. Yanai, D. P. Tew and N. C. Handy, Chem. Phys. Lett., 2004, 393, 51–57 CrossRef CAS.
- C. Adamo and V. Barone, J. Chem. Phys., 1998, 108, 664–675 CrossRef CAS.
- J.-D. Chai and M. Head-Gordon, Phys. Chem. Chem. Phys., 2008, 10, 6615–6620 RSC.
- W. P. Anderson, T. R. Cundari, R. S. Drago and M. C. Zerner, Inorg. Chem., 1990, 29, 1–3 CrossRef CAS.
- M. D. Hack and D. G. Truhlar, J. Phys. Chem. A, 2000, 104, 7917–7926 CrossRef CAS.
- J. Tomasi, B. Mennucci and R. Cammi, Chem. Rev., 2005, 105, 2999–3094 CrossRef CAS PubMed.
- S. Gorelsky, SWizard program, University of Ottawa, Ottawa, Canada, 2010 Search PubMed.
- K. E. Mitchell, Science, 2000, 288, 1982 CrossRef CAS.
- A. Tenderholt, Stanford University, CA Stanford, 2006.
- T. Lu and F. Chen, J. Comput. Chem., 2012, 33, 580–592 CrossRef CAS PubMed.
- G. R. Hutchison, M. A. Ratner and T. J. Marks, J. Am. Chem. Soc., 2005, 127, 2339–2350 CrossRef CAS PubMed.
- S. Tang and J. Zhang, J. Comput. Chem., 2012, 33, 1353–1363 CrossRef CAS PubMed.
- M. Rezvani, M. Darvish Ganji, S. Jameh-Bozorghi and A. Niazi, Spectrochim. Acta, Part A, 2018, 194, 57–66 CrossRef CAS PubMed.
- A. Farhat, R. A. Khera, S. Iqbal and J. Iqbal, Opt. Mater., 2020, 107, 110154 CrossRef CAS.
- D. Koteshwar, S. Prasanthkumar, S. P. Singh, T. H. Chowdhury, I. Bedja, A. Islam and L. Giribabu, Mater. Chem. Front., 2022, 6, 580–592 RSC.
- P. S. Gangadhar, A. Jagadeesh, M. N. Rajesh, A. S. George, S. Prasanthkumar, S. Soman and L. Giribabu, Mater. Adv., 2022, 3, 1231–1239 RSC.
- M. Ans, J. Iqbal, Z. Ahmad, S. Muhammad, R. Hussain, B. Eliasson and K. Ayub, ChemistrySelect, 2018, 3, 12797–12804 CrossRef CAS.
- T. Sutradhar and A. Misra, J. Phys. Chem. A, 2018, 122, 4111–4120 CrossRef CAS PubMed.
- P. Cias, C. Slugovc and G. Gescheidt, J. Phys. Chem. A, 2011, 115, 14519–14525 CrossRef CAS PubMed.
- S. Ahmed, R. Dutta and D. J. Kalita, Chem. Phys. Lett., 2019, 730, 14–25 CrossRef CAS.
- T. Koopmans, Physica, 1934, 1, 104–113 CrossRef.
- C.-G. Zhan, J. A. Nichols and D. A. Dixon, J. Phys. Chem. A, 2003, 107, 4184–4195 CrossRef CAS.
- S. Sabir, R. A. Khera, S. Jabeen, Z. Shafiq, A. Musawwir and J. Iqbal, J. Theor. Comput. Chem., 2020, 19, 2050003 CrossRef CAS.
- C. Fonseca Guerra, J. W. Handgraaf, E. J. Baerends and F. M. Bickelhaupt, J. Comput. Chem., 2004, 25, 189–210 CrossRef PubMed.
- M. D. Ganji, S. Jameh-Bozorgi and M. Rezvani, Appl. Surf. Sci., 2016, 384, 175–181 CrossRef CAS.
- M. Ans, K. Ayub, X. Xiao and J. Iqbal, J. Mol. Liq., 2020, 298, 111963 CrossRef CAS.
- N. E. Gruhn, D. A. da Silva Filho, T. G. Bill, M. Malagoli, V. Coropceanu, A. Kahn and J.-L. Brédas, J. Am. Chem. Soc., 2002, 124, 7918–7919 CrossRef CAS PubMed.
- A. Ostovan, Z. Mahdavifar and M. Bamdad, Polymer, 2017, 126, 162–176 CrossRef CAS.
- U. Yaqoob, A. R. Ayub, S. Rafiq, M. Khalid, Y. A. El-Badry, Z. M. El-Bahy and J. Iqbal, J. Mol. Liq., 2021, 341, 117428 CrossRef CAS.
- H. Yao, Y. Cui, D. Qian, C. S. Ponseca Jr, A. Honarfar, Y. Xu, J. Xin, Z. Chen, L. Hong and B. Gao, J. Am. Chem. Soc., 2019, 141, 7743–7750 CrossRef CAS PubMed.
- M. Ans, M. Paramasivam, K. Ayub, R. Ludwig, M. Zahid, X. Xiao and J. Iqbal, J. Mol. Liq., 2020, 305, 112829 CrossRef CAS.
- Y. A. Duan, Y. Geng, H. B. Li, J. L. Jin, Y. Wu and Z. M. Su, J. Comput. Chem., 2013, 34, 1611–1619 CrossRef CAS PubMed.
- U. Mubashar, A. Farhat, R. A. Khera, N. Iqbal, R. Saleem and J. Iqbal, J. Mol. Model., 2021, 27, 1–13 CrossRef PubMed.
- M. Azzouzi, T. Kirchartz and J. Nelson, Trends Chem., 2019, 1, 49–62 CrossRef CAS.
- J. Sun, Z. Zhang, X. Yin, J. Zhou, L. Yang, R. Geng, F. Zhang, R. Zhu, J. Yu and W. Tang, J. Mater. Chem. A, 2018, 6, 2549–2554 RSC.
- L. Zhang, W. Shen, R. He, X. Liu, X. Tang, Y. Yang and M. Li, Org. Electron., 2016, 32, 134–144 CrossRef CAS.
- R. Zaier and S. Ayachi, Optik, 2021, 239, 166787 CrossRef CAS.
|
| This journal is © The Royal Society of Chemistry 2022 |
Click here to see how this site uses Cookies. View our privacy policy here.  Open Access Article
 *d and
Rasheed Ahmad Khera
 *a
*a
![[double bond, length as m-dash]](https://www.rsc.org/images/entities/char_e001.gif) C bond length is 1.33 Å; the bond lengths of all the examined molecules ranged from 1.40 to 1.41 Å, which clearly indicates enhanced charge transport characteristics and enables the delocalization of π-electrons via conjugation. The dihedral angles of all the examined molecules have a range of 0.254–0.594°, which means that all the molecules possess a planar geometry without any twist between the non-fused thiophene groups and terminal acceptors and also without any groups causing hindrance.
C bond length is 1.33 Å; the bond lengths of all the examined molecules ranged from 1.40 to 1.41 Å, which clearly indicates enhanced charge transport characteristics and enables the delocalization of π-electrons via conjugation. The dihedral angles of all the examined molecules have a range of 0.254–0.594°, which means that all the molecules possess a planar geometry without any twist between the non-fused thiophene groups and terminal acceptors and also without any groups causing hindrance.


 is the normalized VOC in the above equation, and e is the standard charge, which is constantly 1. KB is the Boltzmann constant, and it has a value of 8.61733034 × 10⁻⁵ electron volts per kelvin. T is the temperature, which is constant (300 K). The computationally estimated normalized VOC and FF values for molecules 4TR and 4T1–4T7 are listed in Table 10. The range of normalized VOC is from 58.02 eV to 83.14 eV, and FF ranges from 0.9140 to 0.9354 with the same increasing sequence as VOC, i.e., 4T2 < 4T3 < 4T4 < 4TR = 4T1 < 4T6 < 4T7 < 4T5.


