 Open Access Article
Identification, synthesis and characterization of avanafil process impurities and determination by UPLC†
Mengmeng Zhaoab,
Xiaoxia Wua,
Zengda Yub,
Yunkai Sun *ac,
Zhao Liu*b,
Jinqiao Yuanb,
Hu Liub and
Yiping Jinb
aCollege of Chemistry and Chemical Engineering, University of South China, Hengyang, 421001, China. E-mail: sunyunkai1983@163.com; liuz@harvest-pharm.com
bHarvest Pharmaceutical Co., Ltd, Changsha, 410000, China
cSchool of Chemistry and Materials Science, Changzhou Institute of Technology, Changzhou, 213022, China
First published on 24th March 2022
Abstract
Avanafil is a phosphodiesterase type 5 inhibitor which is used to treat erectile dysfunction in men. The process-related impurities of avanafil were investigated, and four kinds of impurities in several laboratory batches with a content of 0.29–1.63% were detected by the newly developed gradient ultra-high performance liquid chromatography (UPLC). Based on the synthesis route and UPLC-MS research, the impurities are inferred as Imp-A, Imp-B, Imp-C and Imp-D. The structures of the impurities were inferred from LC-MS studies and confirmed by synthesis, followed by spectroscopic characterization such as NMR and mass spectrometry. Especially, the synthesis of Imp-D is firstly reported. The drug-related substances can be separated well by efficient and selective ultra-high performance liquid chromatography on a Waters ACQUITY HSS C18 (50 × 2.1 mm, particle size 1.8 μm) column at 35 °C, with the mobile phase consisting of ammonium formate (20 mM) and acetonitrile, and the detection at 239 nm with a DAD detector. The method was validated in terms of specificity, linearity, precision, accuracy and sensitivity, and satisfactory results were obtained. The results indicated this developed UPLC method for avanafil and the proposed synthesis mechanism can be used for quality control purposes as required by regulatory agencies to ensure the safety and efficacy of the product.
1. Introduction
Researchers have been exploring the treatment of erectile dysfunction (ED) for a long time.1–4 Currently, the first-line drugs for ED are phosphodiesterase 5 inhibitors (PDE-5i).2,5 Avanafil has been shown to be one of the PDE-5i with the fewest side effects.3,6 As a fast-acting, highly selective oral PDE-5 inhibitor to treat erectile dysfunction in men, avanafil was licensed by Tanabe Mitsubishi Pharmaceutical Company, Ltd to Vivus, Inc. and approved by the U.S. FDA under the brand name Stendra.7,8 Most pharmaceutical products are manufactured through the application of fully synthetic methods. Due to the wide range of reaction reagents used in the process, it is natural that trace by-products are present in the final active pharmaceutical ingredient (API) as impurities. These impurities could have a significant impact on the efficacy and safety of the final product. According to the general guidelines on impurities in APIs recommended by the International Conference on Harmonization (ICH), the impurity greater than 0.10% in an API should be identified and characterized for drugs with a maximum daily dose equal to or less than 2 g.9 On the one hand, the identification and characterization of process-related impurities can guide us in controlling these impurities to acceptable levels by sequentially improving the reaction conditions. On the other hand, pure impurities are needed to validate the analytical method.A number of studies have focused on stability methods for avanafil. The analytical method used by Bhatt et al. was focused on understanding avanafil formulations, without a mention of impurities.10 Another approach reported by Kumar et al. discusses the stability analysis of avanafil utilizing gradient method under specific conditions, which showed degradation impurities A and B.11 Can's work in 2018 used LC-TOF-MS to identify three avanafil degradation products, one of which was impurity A.12 Patel et al. more recently systematically established stable methods to comprehensively analyze and resolve avanafil degrading impurities, including impurity A and B.13,14 Kammoun et al. identified impurity A in the brain and plasma metabolites of rats administered avanafil orally using LC-QQQ-MS.15 It is well known that HPLC is the basic tool for drug analysis.16 Impurity C was present as an intermediate in another synthetic route of avanafil and became an impurity in the route we applied.17 To the best of our knowledge, impurity D was reported for the first time and was also patented pending in China. As the demand for drug development increased, UPLC was invented and registered by waters. It has proven to be increasingly popular among chemical analysts for its time savings, low reagent consumption and better experimental results.18,19 However, little attention has been paid to the process impurities of avanafil, the level of which is critical for drug approval in APIs. This study focused on the process impurities of avanafil and the UPLC method developed was able to discriminate well between all process intermediates as well as impurities.
2. Experimental
2.1. Chemicals and reagents
The laboratory batches samples (96.53%) of avanafil were synthesized according to the route reported in literature20 and provided by Chemical Synthesis Department, Harvest Pharmaceutical Technology Co., Ltd, (Hunan, China). HPLC grade acetonitrile was purchased from Sigma-Aldrich. Ammonium formate and formic acid were purchased from Sigma-Aldrich, Aladdin and Shanghai Sinopharm, respectively.2.2. Ultra-performance liquid chromatography (UPLC) and chromatographic conditions
The UPLC method was developed for the analysis of the process related impurities of avanafil. The chromatographic analysis was performed on an Agilent 1260 UHPLC system (Agilent Technology Co., Ltd, California, USA). The chromatographic analysis was carried out on a Waters ACQUITY HSS C18 with 50 mm × 2.1 mm and 1.8 μm particle size column due to well resolution. The mobile phase composing of 20 mM ammonium formate aqueous solution; pH was adjusted to 5.00 ± 0.05 with dilute formic acid (mobile phase-A) and acetonitrile (mobile phase-B). It was degassed and filtered, before delivering into the system, through 0.22 μm filters under vacuum. The linear gradient programme was optimized by the percentage change of mobile phases and set as follows: T time/mobile phase-A:B (%): T0/90:10, T1/90:10; T8/20:80; T10/90:10; T11/90:10; with flow rate of 0.3 mL min−1. Injection volume used was 1.0 μL, and kept the column temperature at 35 °C. The analytes were detected in photo diode array detector at 239 nm.2.3. Liquid chromatography-mass spectrophotometry (LC-MS)
The main text of the article should appear here with headings as appropriate. LC-MS/MS analyses were performed on an Agilent 6470 triple quadrupole liquid mass spectrometer (Agilent Technologies, USA) coupled to an Agilent 1290 Infinity II system in positive and negative ESI mode. Analysis of all compounds was performed on Waters C18 columns. The gradient elution employed solution A and B as mobile phase components. Mobile phase A was 20 mM ammonium formate buffer (pH was adjusted to 5.00 with formic acid), while mobile phase B was acetonitrile. The gradient program was set as follows: time (min)/A:B (v/v); T0/90:10; T1/90:10; T8/20:80; T10/90:10; T11/90:10 with flow rate of 0.3 mL min−1. Product MS spectra were acquired over a m/z range from 100 to 1000 Da; the operating parameters were as follows: a nebulizer gas pressure of 7.5 bar, a dry gas flow rate of 5.0 L min−1, a capillary voltage of 3.5 kV, an ion flight time of 0.5 s, and a transfer capillary temperature of 300 °C. All data is collected and processed by Agilent's data analysis software Mass Hunter.2.4. Semi-preparative liquid chromatography
Preparation was performed using a Bonna-Agela CHEETAH II (Tianjin) medium pressure preparative liquid chromatograph with a C18 spherical 20–35 μm 100A column. The medium-pressure preparative detector at 254 nm with a flow rate of 30 mL min−1. Mobile phase A was 20 mM ammonium formate adjusted to pH 5.00 ± 0.02 with formic acid and mobile phase B was acetonitrile. The gradient program was set to (T min/mobile phase A:B): T0/90:10, T10/90:10, T50/50:50, T60/50:50, T110/10:90, T120/10:90, with a flow rate of 30 mL min−1 and the detection wavelength was kept at 254 nm. The corresponding target Imp-C and D were pooled separately and evaporated to dryness using a rotary evaporator.2.5. Nuclear magnetic resonance spectroscopy (NMR)
The structures of the impurities were elucidated by NMR spectroscopy. The data recorded on a Bruker Avance III 400 (Bruker, Switzerland) instrument were performed on 1H NMR and 13C NMR with DMSO-d6 solvent.2.6. The synthesis of Imp-A, Imp-B, Imp-C and Imp-D (Fig. 1)
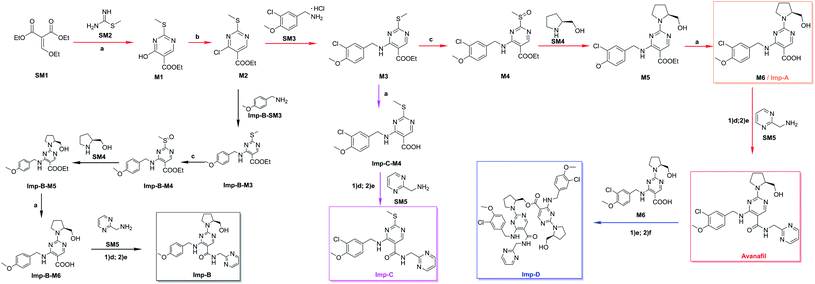
Imp-A is named (S)-4-((3-chloro-4-methoxybenzyl)amino)-2-(2-(hydroxymethyl)pyrrolidin-1-yl)pyrimidine-5-carboxylic acid, which is the intermediate 6 (M6) in the synthetic route of avanafil (see ESI Section 3.1† for details).Imp-B is named 2-[2-(hydroxymethyl)pyrrolidin-1-yl]-4-{[(4-methoxyphenyl)methyl]amino}-N-[(pyrimidin-2-yl)methyl]pyrimidine-5-carboxamide. M2 was reacted with tetramethoxybianamine by nucleophilic substitution at room temperature to obtain Imp-B-M3, and then oxidized with m-chloroperoxybenzoic acid (mCPBA) at 0–10 °C for 4 h, washed with 5% aqueous sodium carbonate, then washed twice with purified water and partitioned. The organic phase was nucleophilic ally substituted with L-prolinol for 4 h. After washing with water, the organic phase was hydrolyzed in NaOH solution at 60 °C for 12 h. The reaction solution was filtered with dilute hydrochloric acid to give 4-(3-chloro-4-methoxybenzyl)amino)-2-(methylthio)pyridine. The reaction solution was adjusted to pH = 5 with dilute hydrochloric acid and filtered to give 4-((3-chloro-4-methoxybenzyl)amino)-2-(methylthio)pyrimidine-5-carboxylic acid (Imp-B-M6), which was then amidated with SM5 in the presence of EDCI and HOBT for 8 h to give the impurity. The reaction solution of Imp-B was obtained by amide condensation for 8 h and concentrated by rotary evaporation at 40–45 °C. The Imp-B was then purified according to the separation described in Section 2.4 (see ESI Section 3.2† for details).
Imp-C is named 4-{[(3-chloro-4-methoxyphenyl)methyl] amino}-2-(methylsulfanyl)-N-[(pyrimidin-2-yl)methyl]pyrimidine-5-carboxamide, which is formed from the ethyl-4-((3-chloro-4-methoxybenzyl)amino)-2-(methylation)pyrimidine-5-carboxylate (M3). The M3 was hydrolysized in NaOH solution at 60 °C, and the reaction solution was adjusted to pH = 5 with dilute hydrochloric acid to give 4-((3-chloro-4-methoxybenzyl)amino)-2-(methylation)pyrimidine-5-carboxylic acid (Imp-C-M4) by filtration. The Imp-C-M4 condensation with SM5 in the presence of 1-(3-dimethylaminopropyl)-3-ethylcarbodiimide hydrochloride (EDCI) and biphenyl-4-amidoxime (HOBT) gave Imp-C (see ESI Section 3.3† for details).
Imp-D is named [1-(4-{[(3-chloro-4-methoxyphenyl)methyl] amino}-5-{[(pyrimidin-2-yl)methyl]carbamoyl}pyrimidin-2-yl)pyrrolidin-2-yl]methyl-4-{[(3-chloro-4-methoxyphenyl)methyl] amino}-2-[2-(hydroxymethyl)pyrrolidin-1-yl]pyrimidine-5-carboxylate, which was obtained by the esterification of M6 (Imp-A) and avanafil by O-benzotriazole-tetramethyl urea hexafluorophosphate (HBTU) at room temperature for 8 h, the reaction solution was extracted with ethyl acetate and concentrated by rotary evaporation at 40–45 °C before being purified according to Section 2.4 (see ESI Section 3.4† for details).
2.7. Preparation of sample solutions
A mixture of water and acetonitrile (50![[thin space (1/6-em)]](https://www.rsc.org/images/entities/char_2009.gif) :
:![[thin space (1/6-em)]](https://www.rsc.org/images/entities/char_2009.gif) 50, v/v) was used as a diluent in the sample preparation. Weigh the appropriate amounts of avanafil and impurity A–D standards, and then dissolve them with diluent to obtain 1500 μg mL−1 of avanafil stock solution and 150 μg mL−1 of each impurity stock solution. Main paragraph text follows directly on here. The laboratory batches samples (96.53%) of avanafil were provided by Chemical Synthesis Department, Harvest Pharmaceutical Technology Co., Ltd, (Hunan, China). HPLC grade acetonitrile was purchased from Sigma-Aldrich. Ammonium formate and formic acid were purchased from Sigma-Aldrich, Aladdin and Shanghai Sinopharm, respectively.
50, v/v) was used as a diluent in the sample preparation. Weigh the appropriate amounts of avanafil and impurity A–D standards, and then dissolve them with diluent to obtain 1500 μg mL−1 of avanafil stock solution and 150 μg mL−1 of each impurity stock solution. Main paragraph text follows directly on here. The laboratory batches samples (96.53%) of avanafil were provided by Chemical Synthesis Department, Harvest Pharmaceutical Technology Co., Ltd, (Hunan, China). HPLC grade acetonitrile was purchased from Sigma-Aldrich. Ammonium formate and formic acid were purchased from Sigma-Aldrich, Aladdin and Shanghai Sinopharm, respectively.
3. Results and discussion
3.1. Detection of processes
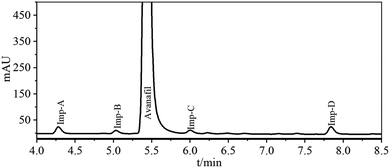
Several laboratory batches of avanafil were analyzed using the newly developed method described in Section 2.2, and the results showed that the Imp A–D content was 0.89%, 0.57%, 0.57% and 1.44%, respectively. According to ICH, we have to identify impurities higher than 0.10% since the maximum daily dose of avanafil is 200 mg.9,11 The UPLC retention behaviour of impurities is shown in Fig. 2. The retention time for avanafil was 5.44 min, and 4.29 min, 5.02 min, 6.02 min, and 7.85 min for Imp A–D, respectively. | ||
| Fig. 1 Synthesis of avanafil20 and Imp A–D. Reagents and conditions: (a) NaOH; (b) POCl3; (c) mCPBA; (d) EDCI; (e) HOBT; (f) HBTU. | ||
3.2. Proposed structural elucidation of impurities
On the basis of the compatibility of the UPLC method with LC-MS, we determined the molecular weight of these impurities by analyzing the samples in positive ion mode using LC-MS. We analyzed the structures by their fragmentation (see Fig. S1 and S2† for representative chromatographic and mass spectrometric analyses). Coupled with the understanding of the synthetic route, the structures of the four impurities are presented. The observed molecular structures are shown in Fig. 1.Imp-A is a raw material M6 for the synthesis of avanafil and a product of the previous reaction step of avanafil. The purified Imp-B, Imp-C and Imp-D were synthesized (Fig. 1) and characterized by UPLC, MS and NMR (Fig. S1, S10–S20, Tables S1 and S2†). The molecular weights of all intermediates were also determined by mass spectrometry (Fig. S3, S5 and S7†).
3.3. Proposed mechanisms of impurity formation
Imp-A was formed due to an incomplete reaction in the final stage of amide condensation, according to the proposed structure. Despite adequate post-treatment, a tiny amount of solvent is excessive due to its low content in comparison to the main component. It is always a little in the main component, regardless of polarity. Imp-B was formed as chlorine-deficient impurities were present in the starting material, and their characteristics are assumed to be comparable and that to their similar structure and API. To obtain it, Imp-B-M3 underwent oxidation, substitution, hydrolysis, and amide condensation reactions. Imp-C is caused by incomplete oxidation of a minor quantity of M3's methylthio group. Imp-D was produced since Imp-A does not yield 100% API and the reaction conditions allowed for esterification condensation during amide condensation.3.4. Synthesis and analysis of impurities
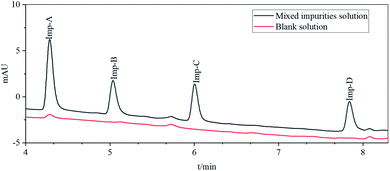
Four process-related impurities, including Imp-A, Imp-B, Imp-C and Imp-D, were synthesized by the designed routes (Fig. 1). Imp-A is the intermediate 6 (M6). The synthesis of Imp-B is a five-step reaction, which obtained from the reaction of M2 and Imp-B-SM3 (tetra-methoxybenzamide) through nucleophilic substitution, oxidation, nucleophilic substitution, hydrolysis and amide reaction. Imp-C is synthesized by hydrolysis and amide reaction of M3 in the avanafil synthetic route. Imp-D was obtained by esterification reaction between M6 and avanafil, and then separation and purification.The detailed experimental procedures have been described in Sections 2.6. The synthesized impurities were spiked and analyzed using UPLC as described in Section 2.3 to check their retention times (Fig. 3). The retention times of the synthetic impurities, Imp-A (4.29 min), Imp-B (5.04 min), Imp-C (6.01 min), and Imp-D (7.85 min) were significantly matched in the crude avanafil sample (Fig. S4, S6, S8 and S9†). Thus, the impurity structure assumed in Section 3.2 was strongly confirmed by its synthesis. Furthermore, the purities of these compounds were analyzed by UPLC (Section 2.3) and they were all found to be more than 97%. In addition, spectral data such as 1H NMR, 13C NMR and ESI-MS were recorded to characterize the structures of the synthesized impurities.
3.5. Optimization of the chromatographic conditions
To satisfy the necessity for a quicker adsorption and removal rate of the column, the UPLC technique was devised, and a gradient elution was chosen to identify all contaminants. Initially, a C18 column and the most common mobile phases were 0.1% formic acid solution (A) and methanol (B), but the separation of the main component from Imp-A was not possible and the resolution of the other components was not greater than 1.5. The organic phase was changed to acetonitrile because of the poor solubility of the main component in methanol. To obtain a stable and satisfactory resolution phosphate buffer was chosen and the pH was initially adjusted to 5.00 with sodium hydroxide solution, which was found to give a more satisfactory separation. In addition, 190 nm and 239 nm were the maximum absorption wavelengths for the avanafil and impurities, but 190 nm is the cut-off wavelength of acetonitrile, so the 239 nm was chosen as the detection wavelength. To develop a LC-MS compatible liquid chromatographic method, a volatile ammonium formate solution was used and the pH was adjusted with 1% formic acid and examined at pH 3.5–6.5. It was found that the separation of the components between pH 4.5–6.5 occurred well, and pH = 5 was chosen as the suitable condition. At the same time, the concentrations of 5–20 mM ammonium formate were investigated, which showed the different concentrations had very little effect on the stable separation. The 20 mM ammonium formate solution was finally chosen to give the system a relatively strong buffer strength.3.6. Method validation
The developed and optimized method was validated in terms of specificity, linearity, sensitivity, precision, accuracy. The results indicated this developed UPLC method can be used for quality control purposes of avanafil and the processed impurities.| Impurities | RT (min) | Resolution |
|---|---|---|
| Imp-A | 4.29 | — |
| Imp-B | 5.02 | 5.35 ± 0.03 |
| Avanafil | 5.44 | 2.81 ± 0.03 |
| Imp-C | 6.02 | 3.88 ± 0.03 |
| Imp-D | 7.85 | 12.35 ± 0.1 |
| Compound | LOD (μg mL−1) | LOQ (μg mL−1) | Linearity | Range (μg mL−1) | |
|---|---|---|---|---|---|
| Linear correlation coefficient (R2) | Linear regression equation | ||||
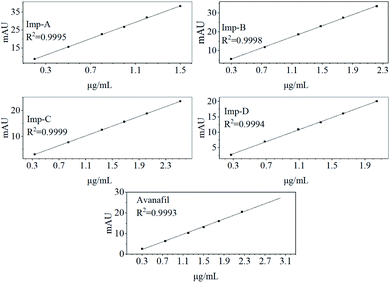
| Avanafil | 0.10 | 0.30 | 0.9993 | y = 9.2395x − 0.4212 | 0.3–3.0 |
| Imp-A | 0.0125 | 0.0375 | 0.9995 | y = 15.701x + 4.3281 | 0.3–2.25 |
| Imp-B | 0.05 | 0.15 | 0.9998 | y = 14.677x + 1.2176 | 0.3–2.25 |
| Imp-C | 0.05 | 0.15 | 0.9999 | y = 9.4336x − 0.1289 | 0.3–2.25 |
| Imp-D | 0.05 | 0.15 | 0.9994 | y = 9.7574x + 0.1656 | 0.3–2.25 |
The linear regression was performed by the least squares method with the peak area of each component as the vertical coordinate and the concentration of the solution as the horizontal coordinate (Fig. 4). The results of the linearity obtained from this method showed good linearity of avanafil with impurities (Table 2). The correlation coefficient R2 > 0.999 for linear regression analysis of all samples.
| Compound | Precision (RSD%) | Accuracy (%) | |||||
|---|---|---|---|---|---|---|---|
| Intra-day | Inter-day | 20 | 50 | 100 | 150 | RSD | |
| Imp-A | 0.085 | 0.865 | 98.4 | 92.17 | 95.52 | 98.59 | 0.031 |
| Imp-B | 0.093 | 0.407 | 98.51 | 99.14 | 101.24 | 101.26 | 0.014 |
| Imp-C | 0.136 | 2.187 | 99.8 | 95.37 | 100.54 | 98.81 | 0.023 |
| Imp-D | 0.962 | 1.648 | 98.24 | 103.14 | 97.12 | 99.76 | 0.026 |
The precision of the method, including reproducibility (intra-day) and intermediate precision (inter-day), was assessed by examining six different samples spiked with impurities at the 100% level on 3 days. The variation in RSD (%) values indicated that the method was precision (Table 3).
4. Conclusions
The avanafil synthesis process may contain a range of contaminants, and this study discovered the impurities that are difficult to remove in the final phase. Four process-related impurities of avanafil were synthesized and determined by LC-MS, 1H NMR, 13C NMR. To ensure the reliability of the quality of avanafil API synthesis, a new stable UPLC method was developed. The method was specific, sensitivity, accuracy, precision and reproducibility. Understanding impurity routes is critical for obtaining APIs with the requisite purity, especially for future avanafil quality research.Conflicts of interest
There are no conflicts to declare.Acknowledgements
This work was supported by the Hunan provincial education office major project (No. 200SJY045), Natural Science Foundation of Hunan Province (No. 2021JJ80010) and Fund of USC (No. 203YXJ026).Notes and references
- F. A. Yafi, L. Jenkins, M. Albersen, G. Corona, A. M. Isidori, S. Goldfarb, M. Maggi, C. J. Nelson, S. Parish, A. Salonia, R. Tan, J. P. Mulhall and W. J. G. Hellstrom, Nat. Rev. Dis. Primers, 2016, 2, 16003 Search PubMed.
- J. Yuan, R. Zhang, Z. Yang, J. Lee, Y. Liu, J. Tian, X. Qin, Z. Ren, H. Ding, Q. Chen, C. Mao and J. Tang, Eur. Urol., 2013, 63, 902–912 Search PubMed.
- J. Jung, S. Choi, S. H. Cho, J. L. Ghim, A. Hwang, U. Kim, B. S. Kim, A. Koguchi, S. Miyoshi, H. Okabe, K. S. Bae and H. S. Lim, Clin. Ther., 2010, 32, 1178–1187 Search PubMed.
- C. G. McMahon, Med. J. Aust., 2019, 210, 469–476 Search PubMed.
- A. L. Burnett, A. Nehra, R. H. Breau, D. J. Culkin, M. M. Faraday, L. S. Hakim, J. Heidelbaugh, M. Khera, K. T. McVary, M. M. Miner, C. J. Nelson, H. Sadeghi-Nejad, A. D. Seftel and A. W. Shindel, J. Urol., 2018, 200, 633–641 Search PubMed.
- A. M. Elkamshoushi, N. M. Badae, M. G. Kabary and S. I. Omar, Andrologia, 2020 DOI:10.1111/and.13833.
- M. Sanford, Drugs Aging, 2013, 30, 853–862 Search PubMed.
- J. A. Kyle, D. A. Brown and J. K. Hill, Ann. Pharmacother., 2013, 47, 1312–1320 Search PubMed.
- International Conference on Harmonization (ICH), Q3A (R2), Impurities in New Drug Substances, 2006, https://database.ich.org/sites/default/files/Q3A%28R2%29%20Guideline.pdf Search PubMed.
- B. Bhumik, R. Kashyap and S. Buddhadev, Int. J. Pharm. Drug Anal., 2015, 3, 181–194 Search PubMed.
- N. Kumar, D. Sangeetha, L. Kalyanraman and K. Sainath, Acta Chromatogr., 2018, 30, 158–163 Search PubMed.
- N. Ö. Can, Molecules, 2018 DOI:10.3390/molecules23071771.
- P. Mital, K. Charmy and V. Vivek, Arabian J. Chem., 2020, 13, 6493–6509 Search PubMed.
- M. Patel and C. Kothari, J. Anal. Sci. Technol., 2020 DOI:10.1186/s40543-020-00228-4.
- A. K. Kammoun, A. Khedr and O. A. A. Ahmed, RSC Adv., 2020, 10, 9407–9413 Search PubMed.
- B. Ramachandra, Crit. Rev. Anal. Chem., 2017, 47(1), 24–36 Search PubMed.
- T. Sakamoto, Y. Koga, M. Hikota, K. Matsuki, M. Murakami, K. Kikkawa, K. Fujishige, J. Kotera, K. Omori, H. Morimoto and K. Yamada, Bioorg. Med. Chem. Lett., 2014, 24, 5460–5465 Search PubMed.
- M. Gumustas, S. Kurbanoglu, B. Uslu and S. A. Ozkan, Chromatographia, 2013, 76, 1365–1427 Search PubMed.
- G. Chawla and C. Ranjan, Open Chem. J., 2016, 3, 1–16 Search PubMed.
- K. Yamada, K. Matsuki, K. Omori and K. Kikkawa. US pat., US6797709B2, 2004 Search PubMed.
Footnote |
| † Electronic supplementary information (ESI) available: Secondary mass spectra and cleavage pathways for each impurity, mass spectra of intermediates and NMR images. See DOI: 10.1039/d2ra01224c |
| This journal is © The Royal Society of Chemistry 2022 |


