 Open Access Article
Plasma-assisted removal of methanol in N2, dry and humidified air using a dielectric barrier discharge (DBD) reactor†
Usman H. Dahiru *ac,
Faisal Saleem
 ab,
Kui Zhanga and
Adam Harvey
 a
a
aDepartment of Chemical Engineering, School of Engineering, Newcastle University, Newcastle upon Tyne NE1 7RU, UK. E-mail: U.H.Dahiru-Hassan2@newcastle.ac.uk; usmandahiru70@gmail.com
bDepartment of Chemical and Polymer Engineering, University of Engineering and Technology Lahore, Faisalabad Campus, Pakistan
cRaw Materials Research and Development Council, Federal Ministry of Science and Technology, Abuja, Nigeria
First published on 7th April 2022
Abstract
In this work, a non-thermal plasma dielectric barrier discharge (DBD) was used to remove methanol from ambient air. The effects of carrier gases (N2, dry and humidified air), power (2–10 W), inlet concentration (260–350 ppm), and residence time (1.2–3.3 s) were investigated to evaluate the performance of the plasma DBD reactor in terms of removal efficiency, product selectivity and reduction of unwanted by-products at ambient temperature and atmospheric pressure. It was found that the conversion of methanol increased with power and residence time regardless of the carrier gas used. However, the removal efficiency decreased with the increasing concentration of CH3OH. Almost complete removal of methanol (96.7%) was achieved at 10 W and a residence time of 3.3 s in dry air. The removal efficiency of methanol followed a sequence of dry air > humidified air > N2 carrier gas. This was due to the action of the O radical in dry air, which dominates the decomposition process of the plasma system. The introduction of water vapour into the DBD system decreased the removal efficiency but had a number of significant advantages: increased CO2 selectivity and yield of H2, it significantly reduced the formation of O3, CO and higher hydrocarbons. These influences are probably due to the presence of potent OH radicals, and the conversion pathways for the various effects are proposed. It is important to note that no solid residue was formed in the DBD reactor in any carrier gas. Overall, this research indicates that methanol can be almost completely removed with the correct operating parameters (96.7% removal; 10 W; 3.3 s) and shows that humidification of the gas stream is beneficial.
1. Introduction
Volatile organic compounds (VOCs) emitted by the chemical processing industries, agricultural operations, and indoor sources have sparked widespread concern in recent years, owing to their harmful influence on human health and the environment.1 VOCs are precursors for the formation of ground-level ozone, organic aerosols, and photochemical smog.2 Some VOCs are toxic and carcinogenic, while others can cause unpleasant odours.3 Methanol is one of the most common alcohols and is a key product in the chemical industry. It is mainly used to produce other chemicals such as acetic acid, formaldehyde, and polymers.4 It is classified as highly volatile alcohol and has been widely used as a solvent in the chemical processing industries.5 Methanol is one of the most frequent odorous VOCs.5 Methanol production has almost doubled in the past decade. The production rate could rise to about 500 Mt per annum by 2050, which can lead to an increase in methanol emission.4 Long-term exposure to methanol can cause nausea, headaches, blurred vision and neurological damage.5 As a result, reducing methanol emissions is a significant concern and a critical research area worldwide.Non-thermal plasmas (NTPs) reactors are a promising method for removing VOC emissions from gas exhausts at relatively low temperatures and atmospheric pressure.6,7 NTP technology has received much attention in recent years as a promising method for removing low and high concentrations of VOC emissions from industrial exhausts.8 The term non-thermal plasma, or “cold plasma”, refers to an ionised gas consisting of bulk gas molecules and atoms, electrons, ions and excited species. NTPs are not in thermal equilibrium, and the temperature differs significantly between the electrons and other species such as atoms, molecules and ions. The gas temperature can be at room temperature, whereas the energy of the electrons is significantly high, with an average electron temperature of 10![[thin space (1/6-em)]](https://www.rsc.org/images/entities/char_2009.gif) 000 to 100
000 to 100![[thin space (1/6-em)]](https://www.rsc.org/images/entities/char_2009.gif) 000 K (1 to 10 eV).9 An NTP is typically generated by applying an electric field to a neutral gas, and if the breakdown field strength is exceeded, the plasma forms a gas discharge. Reactive species in NTP systems are generated through the impact of highly energetic electrons with gas molecules.10
000 K (1 to 10 eV).9 An NTP is typically generated by applying an electric field to a neutral gas, and if the breakdown field strength is exceeded, the plasma forms a gas discharge. Reactive species in NTP systems are generated through the impact of highly energetic electrons with gas molecules.10
Dielectric barrier discharge (DBD) technology is one of the most studied NTP techniques for removing odorous VOCs among different NTP reactors.11 DBD plasma is of practical interest due to its simple design, moderate cost, flexibility, operation under ambient conditions, and rapid attainment of a steady-state allows for fast start-up and shutdown.9,12 Previous researchers have studied the use of DBD plasma reactors to decompose odorous VOCs such as methanol. Sato et al.13 investigated methanol decomposition in a DBD reactor at a 16–20 kV voltage using an air carrier gas. Although a high removal efficiency was achieved, they did not report the product's composition. It's unknown what the hydrogen concentration and yield were in their studies. Wang et al.14 reported the direct conversion of methanol into value-added chemicals and fuels in a DBD reactor using N2. They reported a removal efficiency of 74% at 50 W and a constant concentration of CH3OH in N2 flow rate of 250 ml min−1. They demonstrated that increasing the power increased the methanol removal efficiency and product selectivity. Wang et al.2 studied methanol oxidation in a DBD reactor using an air carrier gas. They reported that for NTP alone system, the removal efficiency of methanol increased from 14.1% to 43.9% when power increased from 0.3 to 0.9 W. Their findings showed the formation of a high O3 concentration (about 773 ppm), which is an undesirable by-product that can limit the practical application of NTP-DBD reactors. Futamura et al.15 observed a low methanol conversion (between 8–26%) at 1 mol% inlet concentration and gas flow rate of 100 ml min−1 using N2 in two different configurations of the DBD reactor. In another study, Tanabe et al.16 used a DBD reactor to decompose methanol to hydrogen using argon carrier gas at a low voltage of 2–6 kV. They obtained a maximum removal efficiency of 80%, and the yield of H2 increased with increasing plasma power in the absence of humidity. The yield of H2 of more than 100% was obtained in the presence of H2O. The primary decomposition product was hydrogen. In the absence or presence of water in the system, CO or CO2 was the other main product. Norsic et al.17 investigated methanol oxidation using dry and humidified air carrier gases. They reported a removal efficiency of 60% in dry air plasma, which decreased to 43% when water vapour with a relative humidity of 35% was introduced to the DBD system. Their findings showed that high humidity had an inhibitive influence on methanol decomposition and hindered the formation of secondary products. The water vapour influences the features of the plasma discharge and the chemistry of the plasma in the gas stream, which has a substantial impact on the removal efficiency. Excess humidity restricted the current at constant applied voltage due to the alteration of the dielectric's surface resistance and lowered the transferred charges between the electrodes, limiting the plasma volume.18 Rico et al.19 reported the formation of coke during the conversion of CH3OH into CO and H2 using a DBD reactor. Solid residue formation can cause fouling problems to the DBD reactors over a long operation time.
However, there have been a variety of drawbacks associated with NTP-alone systems, including low selectivity and low removal efficiency,18,19 high energy consumption, and formation of unwanted by-products, e.g., high ozone concentration,2 and solid deposition.19 In addition, rapid deactivation of catalysts by poisoning and sintering,20 and high ozone emission in plasma catalytic systems limit their practical applications in VOC abatement.2 Catalyst lifetime is severely limited, which suggests that optimising non-catalytic DBD methanol treatment may be advantageous due to the reduced maintenance and ongoing consumable costs associated with replacing catalysts.
Therefore, there is a strong need to improve the performance of an NTP-alone system by investigating the effect of various operating parameters on the removal efficiency of methanol, product selectivity and the elimination of unwanted by-products. Furthermore, understanding the methanol decomposition pathways in the plasma-alone system using different carrier gases is critical for the practical application/scale-up of the NTP-DBD technology.
Methanol is selected as model VOC in this study since it is odorous volatile alcohol that has been mainly used industrially as a solvent, alternative source of fuel and pesticide. Therefore, ingestion or inhalation of methanol can cause neurological damage, blurred vision, headache, and dizziness. As a result, in this work, an NTP-DBD reactor is developed to remove methanol from ambient air. It is studied in N2, dry and humidified air environments at ambient temperature and atmospheric pressure. These carrier gases were chosen because they can aid in the development of pathways for methanol decomposition using NTPs. The effect of various operating parameters such as carrier gases, plasma power, inlet concentration and residence time were evaluated based on removal efficiency, product selectivity and elimination/reduction of unwanted by-products. In addition to the optimisation of the operating parameters, for example, solid residue formation is a big challenge in the application of plasma-assisted VOC decomposition. The air-cleaning technology developed in this study provided a solution to the major drawback associated with non-catalytic plasma-assisted VOC conversion by eliminating the solid residue formation in the DBD reactor, increasing the removal efficiency and product selectivity and reduced O3 concentrations.
Furthermore, the technology also converted methanol to higher hydrocarbons such as C2–C4. In addition, pathways for the decomposition of methanol in the NTP-alone system using different atmospheric gases has been explored. Overall, the study reports a technology for the reduction of methanol in gaseous effluents based on a low cost, low energy non-thermal plasma technology, so pertains to indoor and outdoor air quality control.
2. Materials and methods
2.1 Experimental set-up
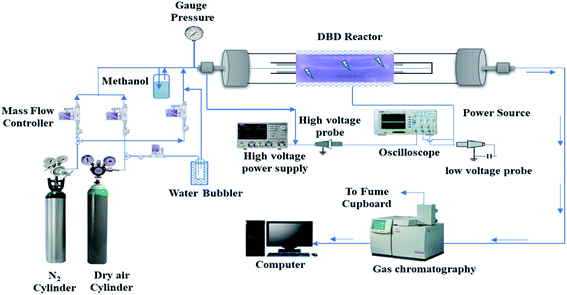
Fig. 1 shows a schematic of the experimental set-up. The experiment was carried out at ambient temperature and atmospheric pressure. The non-thermal plasma was generated using a cylindrical dielectric barrier discharge (DBD) reactor consisting of two coaxial quartz tubes. The plasma DBD reactor consists of two 316 stainless steel grade electrodes: one outside a cylindrical glass quartz tube (length 330 mm, inner diameter 15 mm, and outer diameter 18 mm) and the other inside the tube. The other electrode was inserted into the domed inner tube (outer diameter of 12 mm). Both the outer and inner electrodes were made of the same material. The discharge gap was 1.5 mm, and the inner tube was secured with quartz wool to keep the discharge gap uniform. Plasma was generated between the annular spaces of the cylindrical quartz tubes.The length of the external mesh was 60 mm, leading to a discharge volume of 3.82 cm3. A variac AC transformer was used to control the power supplied to the DBD reactor from the power source. The discharge zone is where the two electrodes overlap; so the residence time was calculated using the discharge volume. A P6015A high voltage probe was used to measure the voltage signal/waveform applied to the DBD plasma reactor, and a PEM CWT003X/B current probe was used to measure the plasma current signal/waveform. The current and voltage signals were recorded by a Tektronix TPS 2014 four-channel optical storage oscilloscope. The power was determined by integrating the current signal I(t) and voltage (U(t)) recorded by the oscilloscope, as shown in eqn (1). The power dissipated to the DBD reactor was varied from 2 to 10 W at a frequency of about 20 kHz in this study.
 | (1) |
Pure nitrogen (≥99.9%) and air (zero grade) were purchased from BOC industrial gases, U.K. The overall gas composition and total flow rates of the carrier gases (70–160 ml min−1) were regulated by computer-controlled Bronkhorst F201 mass flow controllers (MFC). To investigate the effect of humidity, water vapour-containing air with a relative humidity of 24% (at 20 °C and atmospheric pressure) was introduced into the DBD reactor by passing dry airflow through a water bubbler kept in a water bath (20 °C). Furthermore, to saturate with the desired amount of methanol, the carrier gas was passed through a bubbler containing anhydrous methanol (≥99.9% – Sigma-Aldrich). The methanol bubbler was placed in an ice bath to reduce the influence of diurnal fluctuations in ambient temperature on the rate of evaporation of methanol. The mixture of methanol vapour and the carrier gas then passed through the DBD reactor.
The composition of the product gases and methanol concentration was measured using a Varian 450 gas chromatograph equipped with a thermal conductivity detector (TCD) for the measurement of CH4, H2, CO and CO2, and a flame ionisation detector (FID) for measuring the inlet and outlet concentrations of methanol, and hydrocarbons.
2.2 Definitions
The removal efficiency of methanol (ηmethanol) is defined as:where [CH3OH]in and [CH3OH]out are the inlet and outlet methanol concentrations (ppm).
The following formulae were used to determine the selectivity of different gas products:
The specific input energy (SIE) is defined as:21
3. Results and discussion
3.1 Effect of carrier gases and power
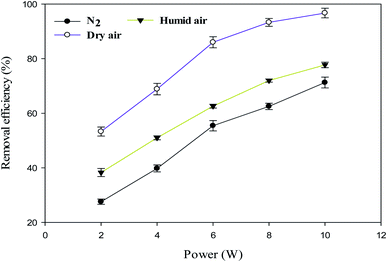
The effect of power on the removal efficiency of methanol in N2, dry, and humidified air is shown in Fig. 2. The input power significantly affects the performance of the reaction regardless of the carrier gas used. In N2 carrier gas, methanol decomposition increases from 27.6% to 71.3% when the input power is increased from 2 W to 10 W (SIE = 1.7–8.6 kJ L−1). This is generally expected because as the input power increases, the number of the energetic electrons increases, increasing the number of excited species, ions, and free radicals due to the collision between these energetic electrons and gas molecules.22 Therefore, the reaction probability between the reactive species and CH3OH molecules in the discharge zone increased.2The maximum methanol removal efficiency of 96.7% was achieved in dry air, followed by humidified air (77.7%) and N2 (71.3%) at 10 W and 3.3 s. This was due to the action of the O radical in dry air, which dominates the plasma system's decomposition process. The average electron temperature of dry air is 4.14 eV, which is higher than the 3.85 eV mean electron energy of pure nitrogen.23 It is well known that the decomposition of dilute volatile organic compounds in dry air plasmas is initiated by the direct electron impact dissociation of N2 and O2 to form chemically reactive species such as N,  , O, and O(1D) for the conversion of VOCs and intermediates into H2O, CO, CO2, and other by-products.5 Therefore, the generation of higher discharges in dry air plasma can lead to the formation of excited species such as O-radicals, excited N2 and metastable
  .13 This resulted in a more significant increase in the conversion of methanol.
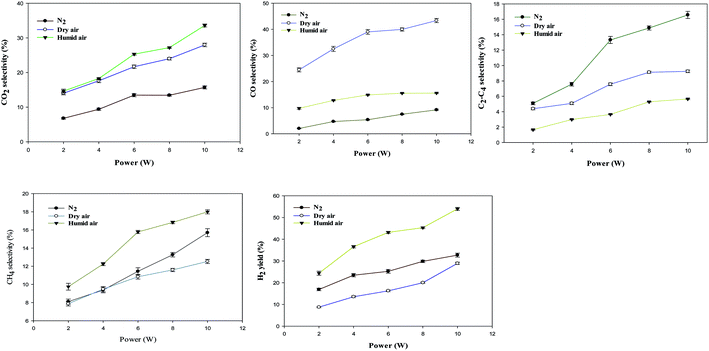
Fig. 3 below shows the selectivity to (a) CO2, (b) CO, (c) C2–C4, (d) CH4, and (e) H2 yield as a function of carrier gas and input power.
Carbon dioxide, carbon monoxide, methane, ethane, n-butane and butene, and hydrogen were produced in all carrier gases. Previous investigations reported only the production of CO, CO2 and H2 as the major products formed in dry or humid air carrier plasma.16
As presented in Fig. 3(a)–(e), increasing the input power increases product selectivity, indicating that the high input power appears to directly enhance the product selectivity due to the high number of energetic electrons. The relationship between electron energy distribution function (EEDF) and electron energy indicates that the higher the mean electron energy is, the more electrons with higher energy will be generated.24 Electron impact dissociation has been reported to play a significant role in decomposing VOCs to produce CH3 radicals, which recombine to produce higher hydrocarbons.25 These findings indicate that the presence of O˙ in dry air favoured the formation of CO and suppressed hydrocarbon formation.
Fig. 3(c) and (d) also show that higher input power resulted in higher selectivity to C2–C4 and CH4 in all the carrier gases. For instance, C2–C4 selectivity increased from 5.1% to 16.6% in N2, and CH4 selectivity increased from 9.7% to 17.9% in dry air. The selectivity to C2–C4 (C2H6, C4H10 and C4H8) is higher in N2 plasma than in dry and humidified air, especially at higher input power. This is because the presence of the O radical in dry air opens up routes to CO formation instead. The maximum selectivity to C2–C4 was observed in N2 plasmas. This was due to enrichment in CH3 radicals, compared to other carrier gases tested here, which can be converted to CH4, C2H6, C2H5, C4H8, and C4H10 (see Section 3.4). In N2 plasma, the probability of collision between CH3OH and various excited N2 species (e.g. metastable state nitrogen  ) are higher, leading to more CH3 radicals at higher residence time. The CH3 can be dimerised to form C2H6, and CH4 can be generated through the hydrogenation reaction of CH3, as shown in R(4) and R(5).26 However, the selectivity to C2–C4 is lower in dry and humidified air when compared with N2 plasma. This is because the presence of O and OH radicals in dry and humidified air oxidises the intermediate species to CO and CO2.5 At the same time, the excited N2, metastable N2, can be quenched/consumed by oxygen species to form ground state N2 and NOx (NO + NO2). It is significant to note that NOx was not detected in the present study. Furthermore, as the input power increases, methanol decomposition leads to a higher yield of H2 through recombination reaction of H-radicals or dissociation of CH3OH.27,28
In humid air, this route is joined by other routes based on the OH radical formed from the dissociation of H2O, which promotes CO2 formation. In addition, O and OH radicals can also oxidise hydrocarbon species and CO leading to higher CO2 selectivity.29
The presence of water vapour reduces the methanol removal efficiency. This is probably due to the opening up of the reverse reaction OH + CH3 to CH3OH. Also, greater humidity reduces the transfer of charges between the electrodes, leading to a decrease in effective plasma volume,30 which led to a greater reduction of the plasma electric field,31 which would also decrease the removal efficiency.
However, water addition increased the selectivity to CO2 and CH4 and the yield of H2, rather than CO and longer hydrocarbons. The increase in CO2 selectivity is due to the more rapid oxidation of CO to CO2 by the OH radical, than by the O˙ (dry air) or  (in nitrogen only). Clearly, introducing water vapour to the NTP-alone system could (i) reduce CO generation, (ii) reduce O3 concentration, (iii) increase the yield of H2, (iv) increase CO2 selectivity. Detailed mechanisms of the methanol decomposition pathways are presented in Section 3.4.
The formation of solid residues during the decomposition process is a source of concern because they can foul the DBD reactor over time and are undesirable by-products. Solid residue formation must be reduced or eliminated for DBD plasma techniques to be more effective and efficient.32,33 In this work, no solid residue was formed in the DBD reactor in all the tested carrier gases. This could be due to the influence operating conditions, reactor configuration or nature of the model VOC (i.e. CH3OH), which produced more OH˙ radicals through the dissociation of methanol during the decomposition process. In the NTP decomposition of VOCs, reactive species such as OH, O and H radicals can be generated due to the impact of energetic electrons on the VOC molecules and the carrier gases. The electrons have mean energy in the range of 1–10 eV.30 Therefore, in methanol decomposition, OH radical can easily be generated from the electron impact dissociation of CH3OH. It has been reported that OH and O radicals are potent oxidants produced in the non-thermal plasma technique.34 The OH, H and O radicals generated in the plasma reactor can convert methanol and its intermediates to CO, CO2, H2 and H2O, resulting in the elimination of solid residue in the DBD reactor. Another reason for the elimination of solid residue is the shorter discharge gap used in this study. The shorter discharge gap can significantly increase the electric field strength, which could enhance the energy in the plasma discharge zone, which increase the removal efficiency and CO2 selectivity.35 The shorter discharge gap (1.5 mm) can facilitate the generation of more OH radicals from electron impact dissociation of CH3OH, increasing the removal efficiency and fast oxidation of carbon species to CO and CO2.
3.2 Effect of CH3OH concentration
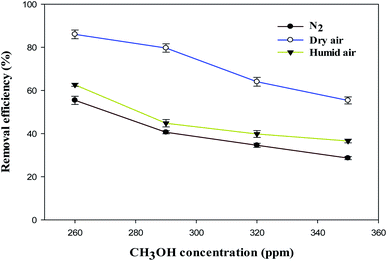
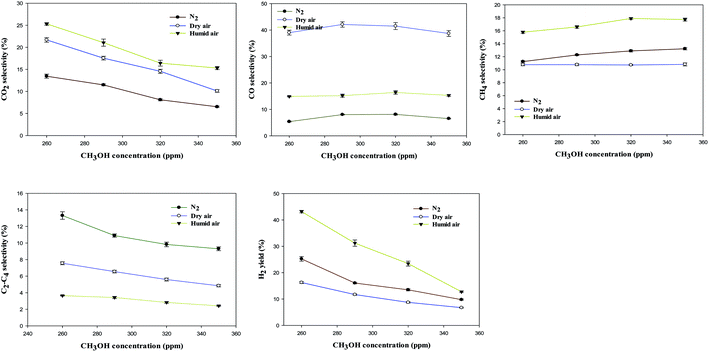
Fig. 4 shows the effect of CH3OH concentration on the removal efficiency in N2, dry, and humidified air. The inlet concentration of CH3OH was varied over the range of 260–350 ppm with a total gas flow rate of 70 ml min−1 (residence time of 3.3 s) and input power of 6 W at ambient temperature and atmospheric pressure. Fig. 4 shows that the removal efficiency of methanol decreased with increasing the inlet concentration of CH3OH regardless of the carrier gas used.For instance, the removal efficiency of methanol in N2, dry and humidified air plasmas are 55.4%, 86.0% and 62.6% at an inlet concentration of 260 ppm, respectively. However, these values decreased to 28.6%, 55.4% and 36.5% when the inlet concentration increased to 350 ppm. This is because the number of methanol molecules flowing into the DBD reactor increases while discharge length, input power, and residence time remain fixed. As a result, the undecomposed VOC molecules have a greater probability of leaving the DBD reactor discharge area unreacted.
Fig. 5 shows the selectivity to (a) CO2, (b) CO, (c) C2–C4, (d) CH4, and (e) H2 yield as a function of carrier gases and CH3OH inlet concentration.
The selectivity to CO2 decreased with increasing CH3OH inlet concentration. For example, increasing CH3OH inlet concentration from 260 ppm to 350 ppm resulted in a considerable decrease in CO2 selectivity from 25.3% and 10.1% in dry air plasma. The selectivity to CO increased as the CH3OH inlet concentration increased from 260 ppm to 320 ppm in all the carrier gases and then decreased when methanol concentration increased to 350 ppm. In humidified air plasma, an increase in CH4 selectivity from 15.8 to 17.9% was observed when methanol concentration increased from 260 to 320 ppm, as shown in Fig. 5(c). It was observed that selectivity to C2–C4 decreases as the CH3OH inlet concentration increases, as more CH3 radicals are produced, which react with H-radicals to form CH4 (see mechanisms in Section 3.4).
The H2 yield decreases as the CH3OH inlet concentration increases from 260 to 350 ppm. This is because, at higher concentrations, the number of energetic electrons, excited species, and gas-phase radicals is reduced per methanol molecule, resulting in a greater reduction in the yield of H2 in the decomposition process. Furthermore, more VOC molecules were subjected to the discharge zone at higher concentrations, while the concentration of energetic electrons, excited species, and gas-phase radicals remained constant.14,17,36,37
3.3 Effect of residence time
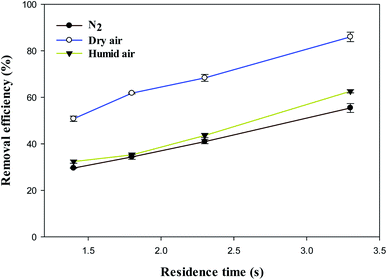
Fig. 6 shows the effect of residence time on the removal efficiency of methanol in N2, dry, and humidified air carrier gases. As presented in Fig. 6, the removal efficiency of methanol significantly increased from 29.6%, 32.4%, 50.8% at 1.4 s to 55.4%, 62.6%, and 86.1% at 3.3 s in N2, humidified and dry air carrier gases, respectively. Clearly, the removal efficiency of methanol significantly increases with increasing residence time in all carrier gases.The VOC molecules have more time to interact with the reactive plasma-generated species at higher residence times, increasing removal efficiency.37,38 The maximum removal efficiency of methanol achieved was 86.1% at 3.3 s in dry air plasma.
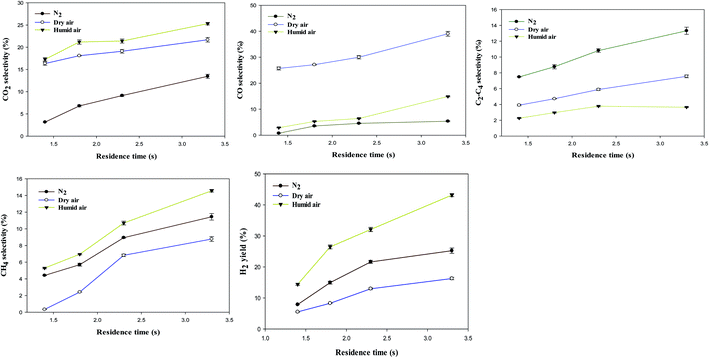
Fig. 7 shows selectivity to (a) CO2, (b) CO, (c) C2–C4, (d) CH4 and (e) H2 yield as a function of carrier gases and residence time.
The product selectivity and H2 yield increased with residence time. The CO2 selectivity and H2 yield increased from 17.3%, 14.4% to 25%, and 43.2% as the residence time increased from 1.4 to 3.3 s in humidified air. The selectivity to CO2 and yield of H2 increased due to more reaction/collision time between the energetic electrons, gas-phase radicals (OH˙, O˙ and H˙) and the methanol molecules in the plasma zone.
3.4 Mechanisms of methanol decomposition using NTP-plasma
In a dielectric barrier discharge (DBD) plasma, discharge occurs in three stages: breakdown, quasi-equilibrium, and non-equilibrium.39 Non-equilibrium plasmas cause the formation of excited species, ions and radicals. The average electron energy in the DBD system is between 1 and 10 eV.30 The excited species such as N2, N2(A), , O2 and radicals (O, H and OH) could be generated through continuous collision with the energetic electrons produced in the DBD plasma reactor.37 The plasma-assisted decomposition of VOCs in N2, dry and humidified air carrier gases can be initiated in three pathways: electron-impact decomposition reactions e*, collisions with excited species such as N2 and O2, and reactions with gas-phase radicals, such as O, H or OH. The C–O, C–H, and O–H bond dissociation energies of CH3OH are 3.638 eV, 4.291 eV, and 4.768 eV, respectively.40 Therefore, electrons, excited species, and gas-phase radicals with energies above 3.638 eV could break the strong C–O bond in methanol, generating intermediates that are further converted to gaseous products such as CO2, CO, CH4, H2, and C2–C4 hydrocarbons.
Methanol decomposes to species such as  , CH2OH, and CHOH through electron-impacted reaction as shown in R(1)–R(3).41
 | (R1) |
| CH3OH + e → CH2OH + H + e | (R2) |
| CH3OH + e → CHOH + H2 + e | (R3) |
Once produced, CH3 can easily react with H radicals to form CH4 through hydrogenation reaction R(4).27 CH3 can also dimerise to form longer hydrocarbons such as C2H6, C2H5, C4H8, and C4H10 through hydrogenation and coupling reactions between the CmHn species at low temperatures, as shown between R(4)–R(8).
| CH3 + H → CH4 | (R4) |
| CH3 + CH3 → C2H6 | (R5) |
| C2H6 + H → C2H5 + H2 | (R6) |
| C2H5 + C2H5 → C4H10 | (R7) |
| C2H10 + e → C4H8 + H2 + e | (R8) |
CH2O is unstable in NTPs,28 and can be converted to CO and H2 via electron impact dissociation reaction, as shown in R(9).41
| CHOH + e → CO + H2 + e | (R9) |
It has been proposed that the direct collision of methanol molecules with excited species and gas-phase radicals could open up a new decomposition pathway, as shown in R(10)–R(14).42
 | (R10) |
| CH3OH + N,N2(A)→CH3O˙ + H + N,N2 | (R11) |
| CH3OH + N,N2(A) → CH2OH˙ + H + N,N2 | (R12) |
| CH3OH + O,O(1D) → CH2OH˙ + OH˙ | (R13) |
| CH3OH + O,O(1D) → CH3O˙ + OH˙ | (R14) |
The addition of water vapour to non-thermal plasma DBD reactors provided new insights into the methanol decomposition pathway. Here, the radicals H˙ and OH˙ are generated through the electron impact dissociation and excitation reaction of H2O molecules as shown in R(15)–R(18).3,43
| H2O + e → OH˙ + H˙ + e | (R15) |
 | (R16) |
| e + O2 → e + O(1D) + O(3P) | (R17) |
| O(1D) + H2O → 2OH˙ | (R18) |
The OH, O and H radicals generated can convert methanol to CO2, H2 and H2O as shown in R(19)–R(22). It is important to note that the introduction of water vapour with a relative humidity of 24% at 20 °C increased CO2, CH4 and H2 and decreased CO and longer hydrocarbons selectivities as presented in Fig. 3(a)–(e).
| CH3OH + OH˙ → CH2OH˙ + H2O | (R19) |
| CH3OH + OH˙ → CH3O˙ + H2O | (R20) |
| CH3OH → 2H2 + CO | (R21) |
| CO + H2O → H2 + CO2 | (R22) |
The CH3OH decomposition pathway R(21) is followed by H2O gas shift reaction R(22) when water vapour is added to the DBD process, leading to increased CO2 selectivity and H2 yield.44 The H radical produced through the dissociation of CH3OH can recombined with the H radical generated from the dissociation of H2O to form more H2, as shown in R(23).
| H˙ + H˙ → H2 | (R23) |
| CHOH + H˙ → HCO + H2 | (R24) |
| H˙ + HCO˙ + e → H2 + CO | (R25) |
Another reason for the increased H2 is that during methanol conversion using non-thermal plasma, H2 is also produced through the reaction of CH2O with H radical R(24), and HCO can further react with H radical to form H2 and CO R(25).27 This agrees with this work's experimental findings, indicating that H2 yield increased with plasma power when water vapour with 24% relative humidity introduced the DBD system and CO decreased.
The interaction of H2O with CH3OH is also known to be a significant pathway for the production of H2 and CO2.44
| CH3OH + H2O → 3H2 + CO2 | (R26) |
Tanabe et al.16 also reported that, apart from methanol decomposition to H2 and CO, as shown in R(21), there was another reaction pathway between H2O and CH3OH, leading to CO2 and H2 (see R(26)). In addition, water vapour increased the selectivity to CO2.45 The O and OH radicals can oxidise CO to CO2, as shown in R(27) and R(28),46 and hydrogen radicals can recombine to form H2 (R29).47
| CO + OH˙ → CO2 + H | (R27) |
| CO + O˙ → CO2 | (R28) |
| H˙ + H˙ → H2 | (R29) |
Based on the analyses above, the methanol decomposition pathways are summarised in Fig. 8.
3.5 Ozone and NOx formation
Ozone is one of the main by-products formed in non-thermal plasma DBD abatement of VOCs using dry air. O3 formation can be initiated in a DBD plasma via collisions between energetic electrons and oxygen molecules, as shown in R(30) and R(31).48| e + O2 → O(3P) + O(3P) + e(6.1 eV) | (R30) |
| e + O2 → O(3P) + O(1D) + e(8.4 eV) | (R31) |
Furthermore, O3 can also be generated through a three-body recombinations reaction of atomic oxygen O and molecular oxygen, as shown in R(32).49 The third body M can be oxygen or nitrogen molecules in the dry air carrier gas.
| O + O2 + M → O3 + M | (R32) |
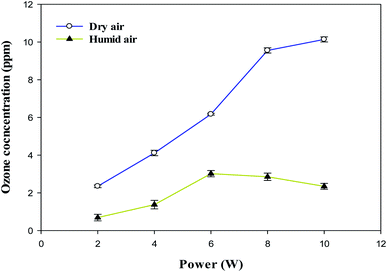
Here, the influence of input power on ozone formation at constant CH3OH concentration (260 ppm) and residence time (3.3 s) in dry and humidified air carrier gases were studied. The O3 concentrations from the outlet of the DBD reactor were measured using the standard KI solution method as described by Yulianto et al.50 The O3 concentration as a function of input power using dry and humidified air carrier gases is presented in Fig. 9.
The ozone concentration increased with input power in dry air. The O3 concentration increased from 2.4 ppm (2 W) to 10.2 ppm (10 W) at constant inlet methanol concentration (260 ppm) and residence time (3.3 s) in dry air. However, ozone concentration initially increases when the plasma power increases from 2 to 6 W and decreases when plasma power increases (8–10 W) in humid air plasma. The introduction of water vapour significantly reduced the ozone concentration at every point and kept it below 3 ppm. Water addition reduces the production of ozone due to the utilisation of O(1D) by H2O, the primary source of ozone formation.51 H2O decreased the O3 concentration by quenching the energetic electrons.52 On the other hand, the O3 concentration decreased due to an increase in direct interactions between O3 and gas-phase radicals such as OH, H and  radicals. As a result, the O3 destruction reactions can be summarised as follows: R(33)–R(35)51,53
| O3 + H˙ → O2 + OH˙ | (R33) |
 | (R34) |
 | (R35) |
In the plasma-assisted decomposition of VOCs, the formation of NOx is a significant health and environmental concern,54 and decreased the efficiency of the abatement process.55 In dry air plasma, NOx can be formed via the electron impacted dissociation reaction of N2/O2 as shown in R(36)–R(40).49,56
| O2 + e → O˙ + O˙ + e | (R36) |
| N2 + e → N˙+ N˙ + e | (R37) |
| O + N → NO | (R38) |
| O + NO → NO2 | (R39) |
| NO + O3 → O2 + NO2 | (R40) |
The excited N2 or metastable N2 species can be quenched/consumed by oxygen species to form ground state N2 and NOx (NO + NO2).57 In this work, the DBD outlet NOx concentrations at steady state were measured using Gastec detector tubes (detection limit = 0.1 ppm). NOx was not detected in any of the tested experimental conditions; hence, it is below 0.1 ppm and is therefore not at problematic levels. This could be due to more OH radicals in the decomposition process generated from the electron impact dissociation reaction of CH3OH and H2O, which provides more OH radicals in the plasma discharge, resulting in the conversion of VOC intermediates to CO2, H2O and H2.49 Furthermore, the OH radicals can oxidise NO to form HNO2 as shown in R(41).58
| NO + OH → HNO2 | (R41) |
Since OH and H radicals can shut down the ozone containing pathway as shown R(33) and R(34), it is possible to eliminate or reduce NOx concentrations to below 0.1 ppm by operating the DBD reactor at low flow rates and low plasma power or by the introduction of water vapour with a relative humidity of 24%. It is important to note that operating a DBD reactor at very flow rates and low plasma power can increase the specific input energy and residence time which can affect the product distribution.
4. Conclusions
A dielectric barrier discharge (DBD) plasma system was used to remove methanol from gas streams at ambient temperature and pressure. The system was studied with carrier gases of dry air, humidified air and nitrogen, to determine the respective roles of N2, O2 and H2O. The plasma power (2–10 W), CH3OH inlet concentration (260–350 ppm), and residence time (1.4–3.3 s) were varied for each gas. The removal efficiency of methanol increased with input power and residence time regardless of the carrier gas used and decreased with increasing CH3OH inlet concentration. The methanol removal efficiency increased in the series: N2 < humidified air < dry air. In dry air plasma, the findings suggest that the action of O radicals dominates the methanol decomposition. Methanol was converted to CO2, H2, and various hydrocarbons (CH4, C2H6, C4H10 and C4H8). The N2 carrier gas exhibited the highest selectivity to C2–C4 hydrocarbons due to the absence of O and OH, which could decompose hydrocarbons. CO2 and CO production were lower in N2 than the other carrier gases, again because of the absence of O and OH radicals, which resulted in higher selectivity to hydrocarbons. The introduction of H2O (RH = 24% at 20 °C) into the carrier gas reduced the removal efficiency, but significantly improved selectivity toward CO2 and H2. There were various other benefits to the presence of H2O, including significant reductions in both O3 and CO.The reaction mechanisms for the various decomposition pathways of methanol have been hypothesised, including electron impact decomposition reaction, direct collision with excited species, and reaction with gas-phase radicals such as O, H or OH. The role of the OH radical can largely explain the effects of H2O inclusion. Furthermore, no solid residue was formed in the DBD reactor in all the carrier gases. Overall, the dry air plasma exhibited the highest removal efficiency, but the humidification, although it decreased the removal efficiency, greatly reduced various typically unwanted species, including CO and O3, whilst increasing the more desired (less toxic) species, such as CO2 and H2.
Conflicts of interest
There are no conflicts to declare.Acknowledgements
Financial support was provided to the first author by the petroleum technology development fund (PTDF) Abuja, Nigeria, to conduct PhD research.References
- J. Van Durme, J. Dewulf, C. Leys and H. Van Langenhove, Appl. Catal., B, 2008, 78, 324–333 CrossRef CAS.
- X. Wang, J. Wu, J. Wang, H. Xiao, B. Chen, R. Peng, M. Fu, L. Chen, D. Ye and W. Wen, Chem. Eng. J., 2019, 369, 233–244 CrossRef CAS.
- A. M. Vandenbroucke, R. Morent, N. De Geyter and C. Leys, J. Hazard. Mater., 2011, 195, 30–54 CrossRef CAS PubMed.
- IRENA AND METHANOL INSTITUTE, Innovation outlook : Renewable Methanol, Report 978-92-9260-320-5, International Renewable Energy Agency, Abu Dhabi, 2021 Search PubMed.
- X. Zhu, S. Liu, Y. Cai, X. Gao, J. Zhou, C. Zheng and X. Tu, Appl. Catal., B, 2016, 183, 124–132 CrossRef CAS.
- F. Thevenet, L. Sivachandiran, O. Guaitella, C. Barakat and A. Rousseau, J. Phys. D: Appl. Phys., 2014, 47(22), 224011 CrossRef.
- X. Tu and J. C. Whitehead, Int. J. Hydrogen Energy, 2014, 39, 9658–9669 CrossRef CAS.
- W. Xu, N. Wang, Y. Chen, J. Chen, X. Xu, L. Yu, L. Chen, J. Wu, M. Fu, A. Zhu and D. Ye, Catal. Commun., 2016, 84, 61–66 CrossRef CAS.
- X. Tu and J. C. Whitehead, Appl. Catal., B, 2012, 125, 439–448 CrossRef CAS.
- K. Yan, E. J. M. van Heesch, A. J. M. Pemen, P. A. H. J. Huijbrechts, F. M. van Gompel, H. van Leuken and Z. Matyas, IEEE Trans. Ind. Appl., 2002, 38, 866–872 CrossRef CAS.
- F. Saleem, A. Rehman, F. Ahmad, A. H. Khoja, F. Javed, K. Zhang and A. Harvey, RSC Adv., 2021, 11, 27583–27588 RSC.
- S. Y. Liu, D. H. Mei, Z. Shen and X. Tu, J. Phys. Chem. C, 2014, 118, 10686–10693 CrossRef CAS.
- T. Sato, M. Kambe and H. Nishiyama, JSME Int. J. - Ser. B Fluids Therm. Eng., 2005, 48, 432–439 CrossRef CAS.
- L. Wang, S. Y. Liu, C. Xu and X. Tu, Green Chem., 2016, 18, 5658–5666 RSC.
- S. Futamura and H. Kabashima, IEEE Trans. Ind. Appl., 2004, 40, 1459–1466 CrossRef CAS.
- S. Tanabe, M. Hiroshi, O. Kenji and a. H. Matsumoto, Chem. Lett., 2000, 29(10), 1116–1117 CrossRef.
- C. Norsic, J.-M. Tatibouët, C. Batiot-Dupeyrat and E. Fourré, Chem. Eng. J., 2018, 347, 944–952 CrossRef CAS.
- Z. Falkenstein and J. J. Coogan, J. Phys. D: Appl. Phys., 1997, 30, 817–825 CrossRef CAS.
- V. J. Rico, J. L. Hueso, J. Cotrino and A. R. González-Elipe, J. Phys. Chem. A, 2010, 114, 4009–4016 CrossRef CAS PubMed.
- S. Liu, D. Mei, L. Wang and X. Tu, Chem. Eng. J., 2017, 307, 793–802 CrossRef CAS.
- Y. A. Wenjing Lu, M. F. Mustafa, C. Pan and H. Wang, Front. Environ. Sci. Eng., 2019, 13, 30 CrossRef.
- F. Saleem, K. Zhang and A. Harvey, Fuel, 2019, 235, 1412–1419 CrossRef CAS.
- L. Yu-Ran, J. Am. Chem. Soc., 2004, 126, 982 Search PubMed.
- A. Michelmore, D. A. Steele, J. D. Whittle, J. W. Bradley and R. D. Short, RSC Adv., 2013, 3(33), 13540 RSC.
- F. Saleem, J. Kennedy, U. H. Dahiru, K. Zhang and A. Harvey, Chem. Eng. Process., 2019, 142, 107557 CrossRef CAS.
- T. Kim, S. Jo, Y.-H. Song and D. H. Lee, Appl. Energy, 2014, 113, 1692–1699 CrossRef CAS.
- T. Kim, S. Jo, Y.-H. Song and D. H. Lee, Appl. Energy, 2014, 113, 1692–1699 CrossRef CAS.
- H. Zhang, X. Li, F. Zhu, Z. Bo, K. Cen and X. Tu, Int. J. Hydrogen Energy, 2015, 40, 15901–15912 CrossRef CAS.
- A. N. Trushkin, M. E. Grushin, I. V. Kochetov, N. I. Trushkin and Y. S. Akishev, Plasma Phys. Rep., 2013, 39, 167–182 CrossRef CAS.
- G. Petitpas, J. Rollier, A. Darmon, J. Gonzalezaguilar, R. Metkemeijer and L. Fulcheri, Int. J. Hydrogen Energy, 2007, 32, 2848–2867 CrossRef CAS.
- J. Van Durme, J. Dewulf, K. Demeestere, C. Leys and H. Van Langenhove, Appl. Catal., B, 2009, 87, 78–83 CrossRef CAS.
- F. Saleem, J. Umer, A. Rehman, K. Zhang and A. Harvey, Energy Fuels, 2020, 34, 1744–1749 CrossRef CAS.
- F. Saleem, K. Zhang and A. Harvey, Energy Fuels, 2019, 33, 2598–2601 CrossRef CAS.
- L. Jiang, R. Zhu, Y. Mao, J. Chen and L. Zhang, Int. J. Environ. Res. Publ. Health, 2015, 12, 1334–1350 CrossRef PubMed.
- T. J. Ma and W. S. Lan, Int. J. Environ. Sci. Technol., 2015, 12, 3951–3956 CrossRef CAS.
- F. Chen, X. Huang, D.-g. Cheng and X. Zhan, Int. J. Hydrogen Energy, 2014, 39, 9036–9046 CrossRef CAS.
- U. H. Dahiru, F. Saleem, K. Zhang and A. P. Harvey, J. Chem. Environ. Eng., 2021, 9(1), 1105023 Search PubMed.
- F. Saleem, K. Zhang and A. Harvey, Energy Fuels, 2018, 32(4), 5164–5170 CrossRef CAS.
- U. Kogelschatz, Plasma Chem. Plasma Process., 2003, 23, 46 CrossRef.
- Z. Qi, L. Yang, X. Lin, Y. Zhao, J. Niu, D. Liu, Z. Ding, Y. Xia, L. Ji and Z. Zhao, IEEE Trans. Plasma Sci., 2019, 47, 4802–4810 CAS.
- Y. Han, J.-g. Wang, D.-g. Cheng and C.-j. Liu, Ind. Eng. Chem. Res., 2006, 45, 3460–3467 CrossRef CAS.
- P.-F. Lee, H. Matsui, D.-W. Xu and N.-S. Wang, J. Phys. Chem. A, 2013, 117, 525–534 CrossRef CAS PubMed.
- A. Abdelaziz, T. Ishijima and T. Seto, Phys. Plasmas, 2018, 25, 043512 CrossRef.
- H. Zhang, F. Zhu, X. Li, K. Cen, C. Du and X. Tu, RSC Adv., 2016, 6, 12770–12781 RSC.
- F. Thevenet, O. Guaitella, E. Puzenat, C. Guillard and A. Rousseau, Appl. Catal., B, 2008, 84, 813–820 CrossRef CAS.
- R. Atkinson, D. L. Baulch, R. A. Cox, R. F. Hampson, J. A. Kerr, M. J. Rossi and J. Troe, J. Phys. Chem. Ref. Data, 1997, 26, 1329–1499 CrossRef CAS.
- N. R. Panda and D. Sahu, Heliyon, 2020, 6, e04717 CrossRef PubMed.
- J. T. Gudmundsson, E. Kawamura and M. A. Lieberman, Plasma Sources Sci. Technol., 2013, 22, 035011 CrossRef CAS.
- X. Zhu, X. Gao, C. Zheng, Z. Wang, M. Ni and X. Tu, RSC Adv., 2014, 4, 37796–37805 RSC.
- E. Yulianto, M. Restiwijaya, E. Sasmita, F. Arianto, A. W. Kinandana and M. Nur, J. Phys.: Conf. Ser., 2019, 1170, 012013 CrossRef CAS.
- T. Zhu, J. Li, Y. Jin, Y. Liang and G. Ma, Int. J. Environ. Sci. Technol., 2008, 5, 375–384 CrossRef CAS.
- H. Huang, D. Ye and D. Y. C. Leung, IEEE Trans. Plasma Sci., 2011, 39, 576–580 CAS.
- J. Karuppiah, E. L. Reddy, P. M. Reddy, B. Ramaraju, R. Karvembu and C. Subrahmanyam, J. Hazard. Mater., 2012, 237–238, 283–289 CrossRef CAS PubMed.
- C. Subrahmanyam, M. Magureanu, A. Renken and L. Kiwi-Minsker, Appl. Catal., B, 2006, 65, 150–156 CrossRef CAS.
- O. Karatum and M. A. Deshusses, Chem. Eng. J., 2016, 294, 308–315 CrossRef CAS.
- C. Zheng, X. Zhu, X. Gao, L. Liu, Q. Chang, Z. Luo and K. Cen, J. Ind. Eng. Chem., 2014, 20, 2761–2768 CrossRef CAS.
- A. M. Harling, D. J. Glover, J. C. Whitehead and K. Zhang, Appl. Catal., B, 2009, 90, 157–161 CrossRef CAS.
- C. Zheng, X. Shen, X. Gao, Z. Li, X. Zhu, Z. Luo and K. Cen, IEEE Trans. Plasma Sci., 2013, 41, 485–493 CAS.
Footnote |
| † Electronic supplementary information (ESI) available. See DOI: 10.1039/d2ra01097f |
| This journal is © The Royal Society of Chemistry 2022 |

