 Open Access Article
Evaluation of the microstructure, optical properties and hopping conduction mechanism of rare earth doped Ba0.85Ca0.12RE0.03Ti0.90Zr0.04Nb0.042O3 ceramics (RE = Ce3+ and Pr3+)
M. Bourguibaab,
Z. Raddaoui *cd,
W. Dimassie,
M. Chafraa,
J. Dhahri
 c,
P. Marchetd and
M. A. Garciaf
aLaboratory of Applied Mechanics and Systems, School Polytechnic of Tunisia, University of Carthage, La Marsa, Tunisia
bFaculty of Sciences Tunis, University of Tunis El Manar, Tunis 2092, Tunisia
cLaboratory of Condensed Matter and Nanosciences, Faculty of Sciences of Monastir, University of Monastir, Avenue of the Environment, 5019 Monastir, Tunisia. E-mail: raddaouizeineb@gmail.com
dInstitute for Research on Ceramics, University of Limoges, UMR 7315, 87068 Limoges, France
eLaboratory of Nanomaterials and Systems for Renewable Energies (LaNSER), Research and Technology Center of Energy, Techno-Park Borj-Cedria, Hammam-Lif 2050, Tunisia
fSpanish National Research Counsil CSIC, Madrid, Spain
First published on 6th April 2022
Abstract
The current research work examines the impact of Rare Earth (RE3+) ion substitution on the structural, optical and conduction properties of a Ba0.85Ca0.12RE0.03Ti0.90Zr0.04Nb0.042O3 (BCRETZN) (RE = Ce, Pr) ceramic compound produced via a solid-state route. The Rietveld method of the X-ray data revealed a tetragonal (P4mm) structure at room temperature for our ceramic compound. The morphology of the compound was explored using Scanning Electron Microscopy (SEM) as well as optical response and conduction behavior. The photoluminescence properties revealed that the BCPrTZN sample results in green and red photoemissions under laser excitation at 450 nm at RT. Furthermore, for the BCCeTZN sample, the photoluminescence data demonstrated that strong violet emission bands were acquired, at RT upon an excitation at 350 nm. The electrical conduction process was verified via the correlated barrier Hopping method. The scaling behavior suggests that the electrical conduction mechanism is independent of temperature. The existence of Ce3+ and Pr3+ ions in these materials could have important technological potential in new multifunctional devices.
1. Introduction
Perovskites with an ABO3 general formula have gained a lot of interest over the past decades based on their potential applications and power in a variety of nanotechnology fields such as ferroelectric sensors, ceramic capacitors, optoelectronic devices, piezoelectric devices and actuators.1–5 Among these materials, BaTiO3 (BT) is the most frequently used as a typical dielectric compound especially due to the elevated permittivity resulting from the interaction between dielectric behavior2,4–6 and structural deformation by means of Structural Phase Transitions (SPTs).6,7 These transitions are rhombohedral–orthorhombic–tetragonal–cubic and hexagonal (R–O–T–C–H) at −90 °C, 6 °C, 130 °C and 1432 °C, respectively, associated with the off-centering of the Ti cation.6 In effect, a relevant change in the behavior of the BT compound may be achieved via the incorporation or substitution of other ions in the Ti- and/or Ba-sites.4–6Concerning the optoelectronic applications, rare earth ions (Ln3+) are useful substituted ions to enhance the functionality of BT.8–10 Commonly, Ln3+ is used as an activator ion to achieve great luminescence characteristics. Furthermore, Ln3+ can change the lattice properties and enhance the electrical behavior, in particular in terms of thermal evolution of permittivity and dielectric losses, as well as piezoelectric coefficients.11 C. Chalfouh et al. reported the impact of the substitution of Ba2+ ions with lanthanide ions for example Pr3+, Nd3+ and Eu3+ on the physical characteristics of BaTi0.925(Yb0.5Nb0.5)0.075O3.12 The concurrent occurrence of ferroelectric and luminescence behavior in the titled system is considered most prospective for a novel collection of multifunctional electro-optic compounds.
Furthermore, (Ba,Ca)(Ti,Zr)O3 (BCTZ) compounds have more recently been considered as a lead-free perovskite compounds presenting interesting piezoelectric properties. Several investigations have shown that the incorporation of Ln3+ ions (Pr3+, Ce3+) in Ba0.85Ca0.15Ti0.90Zr0.10O3 compound can enhance its functional process. For example, the Pr3+ ions-modified lead-free BCTZ compound exhibits enhanced piezoelectric and ferroelectric properties. This material was found to be particularly suitable for energy harvesting applications, with an exceptional figure of merit.13 Moreover, R. Hayati et al. reported that the Ce3+-modified lead-free BCTZ compound exhibited enhanced electromechanical, piezoelectric and ferroelectric process at room temperature.14 Finally, I. Zouari et al. also reported that improved piezoelectric, dielectric, electro-caloric and ferroelectric process of BT-based compound have been achieved via the incorporation of (RE3+, Nb5+) for Ti4+ in B site and Ca2+ for Ba2+ in A site.15 Therefore, the study of lead-free perovskite materials presenting a combination of these different substitutions, with global formula (Ba,Ca,RE)(Ti,Zr,Nb)O3 (BCRETZN) appears as particularly interesting.
Consequently, this work aims to investigate the structural, morphological, optical and hopping conduction process of BCRETZN (R = Ce, Pr) produced by a solid-state route. The determination of their optical behavior allows to evidence photoluminescence properties. The analysis of electrical conductivity versus frequency allows a better understanding of the process of free and localized electrical charge carriers.
2. Materials and methods
2.1 Synthesis and sintering of Ba0.85Ca0.12RE0.03Ti0.90Zr0.04Nb0.042O3 (RE = Ce, Pr) samples
The polycrystalline Ba0.85Ca0.12RE0.03Ti0.90Zr0.04Nb0.042O3 (BCRETZN (RE = Ce, Pr)) samples were produced using solid-state route employing CaCO3 (99%), BaCO3 (99%), Pr2O3 (99%), CeO2 (99%), TiO2 (99%), ZrO2 (99%) and Nb2O5 (99%).The samples were calcined at 1000 °C for 24 h with intermediate grindings to remove impurities like carbon present, using temperature controlled programmable muffle furnace.
The calcined powder BCRETZN (RE = Ce, Pr) samples were pressed isostatically into circular pellet form under 8 t cm−2 (of about 2 mm thickness) using a hydraulic press and at 1350 °C for 48 h in air with intermediate remilling and repulsive to obtain the final product.
2.2 Characterization of the samples
The crystalline phases of BCRETZN (RE = Ce, Pr) compounds were identified at RT using X-ray powder diffraction patterns acquired using a θ/2θ diffractometer (“PANalytical X'Pert Pro” λCu-Kα = 1.5406 Å). The XRD patterns were recorded for 2θ values range of 20.00–70.00° with a step of 0.02°.The phase determination was carried out by examining the locations and intensities of the peaks and comparing then with the International Center of Diffraction Data database patterns with the HighScore program.
In addition, structural examination was carried out utilizing the FULLPROF software.16,17 The crystallite size and internal microstrain parameters of the compounds were investigated by the Data Viewer software following Lorentzian and Gaussian distributions.
The microstructure and composition of the BCRETZN (RE = Ce, Pr) compounds were investigated utilizing Scanning Electronic Microscopy (SEM) (Phillips XL30) coupled with an Energy Dispersive X-ray (EDX).
Photoluminescence (PL) data were measured on a cornerstone 260 monochromator (from Oriel instruments) connected to an R955 photomultiplier (Hamamatsu, Japan).
A multi-line argon (Ar) Lasos laser, with an output power of 40 mW and 488 nm, 350 nm wavelength selection, was employed as the source of excitation respectively for BCPrTZN and BCCeTZN compound.
For the conductivity measurements, the ceramic pellets were electroded by depositing silver on both sides of the sample. The conductance and capacitance were then measured using an impedance analyzer (Agilent 4294A) over a wide frequency range (40–106 Hz, AC signal amplitude 50 mV). A liquid nitrogen cooled cryostat (Janis Corporation) was utilized to achieve a temperature range between RT to 500 K.
3. Results and discussion
3.1 XRD and phase identification
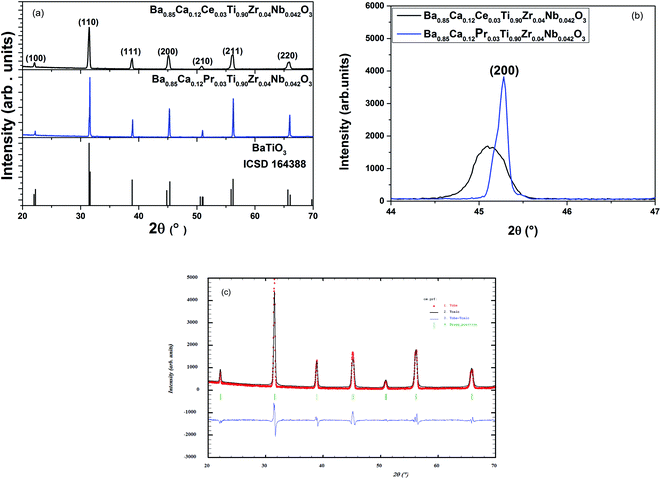
Fig. 1(a) presents the room temperature XRD data of all the BCRETZN (RE = Pr, Ce) compounds. The results revealed a single-phase perovskite system without any secondary phase. This result confirms the incorporation of (Ca2+, RE3+) at the Ba site and (Zr4+, Nb5+) at the Ti site. This result is consistent with the calculated tolerance factor: t = 1.050 for BCCeTZN and t = 1.049 for BCPrTZN, against 1.06 for BaTiO3. Therefore, our samples are in the stable domain of the perovskite system and crystallize in the tetragonal structure.From XRD patterns, it may be seen that the most intense peak [110] has been displaced to lower 2θ values for BCCeTZN compared to BCPrTZN (Fig. 1(b)), suggesting that the lattice parameters increase in the BCCeTZN sample compared to BCPrTZN.
The refinement of XRD data was carried out utilizing Rietveld model (Fig. 1(c)).
The results confirm that the BCRETZN (RE = Ce, Pr) sample crystallizes at room temperature in the tetragonal (P4mm) phase. Moreover, the refined lattice parameters agree well with the previous observation. Indeed, the lattice parameters calculated for BCCeTZN are slightly higher than those of BCPrTZN. These results are similar to those found in recent research.18–20 The XRD obtained for BCRETZN (RE = Pr, Ce) samples are quite similar for undoped BaTiO3.21
However, the refined occupancy factors suggest that the obtained stoichiometries present only small differences with the expected ones.
The refinement quality of the XRD data was estimated by utilizing adjustment parameters like goodness of fit χ2, the weighted pattern Rwp and the pattern Rp, (Table 1). We noticed a good agreement between the theoretical and measured XRD data.
| BaTiO3 (ref. 21) | Ba0.85Ca0.12Ce0.03Ti0.90Zr0.04Nb0.042O3 | Ba0.85Ca0.12Pr0.03Ti0.90Zr0.04Nb0.042O3 | |
|---|---|---|---|
| Space group | P4mm | P4mm | P4mm |
| Cell parameters | |||
| a (Å) | 3.996(1) | 4.0012(3) | 3.9981(1) |
| c (Å) | 4.027(5) | 4.0212(3) | 4.0034(8) |
| c/a | 1.0077 | 1.0049 | 1.0013 |
| V (Å3) | 64.36(1) | 64.379(1) | 63.995(2) |
![[thin space (1/6-em)]](https://www.rsc.org/images/entities/char_2009.gif) |
|||
| Agreement factors | |||
| RP (%) | 9.76 | 9.54 | 6.64 |
| Rwp (%) | 12.7 | 10.15 | 7.24 |
| χ2 | 1.89 | 2.60 | 2.70 |
![[thin space (1/6-em)]](https://www.rsc.org/images/entities/char_2009.gif) |
|||
| Tolerance factor | |||
| t | 1.060 | 1.050 | 1.049 |
![[thin space (1/6-em)]](https://www.rsc.org/images/entities/char_2009.gif) |
|||
| Average crystallite size (nm) | |||
| DW–H (nm) | 253.2 | 220.2 | |
| ε | 0.0707 | 0.052 | |
The refined structural settings are given in Table 2. Therefore, the XRD patterns confirm that our compounds crystallize in tetragonal (P4mm) structure and that (Ca2+, RE3+) are incorporated at the Ba site and (Zr4+, Nb5+) at the Ti site.
| Compounds | Atom | x | y | z | Occupancy |
|---|---|---|---|---|---|
| BaTiO3 (ref. 21) | Ba | 0 | 0 | 0 | 0.99 |
| Ti | 0.5000 | 0.5000 | 0.4990(6) | 0.98 | |
| O1 | 0.5000 | 0.5000 | 0.0920(4) | 0.99 | |
| O2 | 0.5000 | 0 | 0.5119(7) | 1.98 | |
| Ba0.85Ca0.12Ce0.03Ti0.90Zr0.04Nb0.042O3 | Ba | 0 | 0 | 0 | 0.82 |
| Ca | 0 | 0 | 0 | 0.10 | |
| Ce | 0 | 0 | 0 | 0.02 | |
| Ti | 0.5000 | 0.5000 | 0.3994(6) | 0.91 | |
| Nb | 0.5000 | 0.5000 | 0.3994(6) | 0.04 | |
| Zr | 0.5000 | 0.5000 | 0.3994(6) | 0.039 | |
| O1 | 0.5000 | 0.5000 | 0.0147(4) | 0.98 | |
| O2 | 0.5000 | 0 | 0.479(0) | 1.99 | |
| Ba0.85Ca0.12Pr0.03Ti0.90Zr0.04Nb0.042O3 | Ba | 0 | 0 | 0 | 0.84 |
| Ca | 0 | 0 | 0 | 0.11 | |
| Pr | 0 | 0 | 0 | 0.02 | |
| Ti | 0.5000 | 0.5000 | 0.4034(2) | 0.89 | |
| Nb | 0.5000 | 0.5000 | 0.4034(2) | 0.040 | |
| Zr | 0.5000 | 0.5000 | 0.4034(2) | 0.040 | |
| O1 | 0.5000 | 0 | 0.01474(0) | 0.97 | |
| O2 | 0.5000 | 0 | 0.84476(0) | 1.99 |
XRD pattern examination is among the most precise methods for finding crystals size22–24 and irregular movement strain of atoms with respect to their literature lattice in the lattice.25
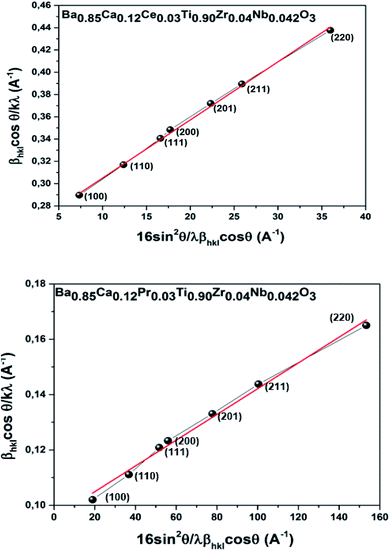
Furthermore, to explore the evolution in the microstructure of BCRETZN (RE = Ce, Pr) compounds, two micro-structural phenomena, namely crystallite size (D) and micro-deformation (ε), were determined based on the XRD peak broadening.
The XRD integral width (β) curve is primarily related to two parameters βL (Lorentzian component of β) and βG (Gaussian component of β) that are related to the impact of D and ε, respectively. It is defined as follows:
 | (1) |
 and βG = 4ε
![[thin space (1/6-em)]](https://www.rsc.org/images/entities/char_2009.gif) tan
tan![[thin space (1/6-em)]](https://www.rsc.org/images/entities/char_2009.gif) θ.
θ.
Thus, XRD based deconvolution of these two parameters was performed utilizing eqn (2). This formulation is reported by Halder and Wagner (H–W).26 It is described as follows:
 | (2) |
![[thin space (1/6-em)]](https://www.rsc.org/images/entities/char_2009.gif) cos
cos![[thin space (1/6-em)]](https://www.rsc.org/images/entities/char_2009.gif) θ/λ, X = 16
θ/λ, X = 16![[thin space (1/6-em)]](https://www.rsc.org/images/entities/char_2009.gif) sin2
sin2![[thin space (1/6-em)]](https://www.rsc.org/images/entities/char_2009.gif) θ/βhklλ
θ/βhklλ![[thin space (1/6-em)]](https://www.rsc.org/images/entities/char_2009.gif) cos
cos![[thin space (1/6-em)]](https://www.rsc.org/images/entities/char_2009.gif) θ, θ is Bragg's diffraction angle, λ is λCu-Kα = 1.5406 Å and k is about 4/3.
θ, θ is Bragg's diffraction angle, λ is λCu-Kα = 1.5406 Å and k is about 4/3.
Indeed, the behavior of Y according to X is linear. The intercept is given to determine D and the slope is ε2. To determine the magnitude of D and ε, the factor Y was graphed as a function of the factor X. As indicated in Fig. 2, the plot demonstrated a quasi-linear trend for the BCRETZN (RE = Ce, Pr) compound. The D and ε magnitude were found using the linearly adjusted plot. Table 1 summarizes the obtained values. We notice that the values of D and ε are more important for the BCCeTZN sample than those of BCPrTZN ceramics.
3.2 Surface morphological and composition analysis
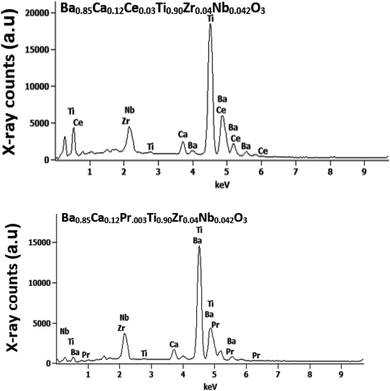
To explore the microstructure of the obtained sample, an EDX scanning was carried out at room temperature (Fig. 3). EDX findings support that there is no loss of incorporated components during the sintering with in experimental errors. The spectra reveal the presence of all chemical elements (Ba, Ca, Pr, Ce, Ti, Zr and Nb and O) introduced during the preparation of BCRETZN (RE = Ce, Pr) ceramic compound.The experimental and theoretical concentrations for our samples is displayed in Table 3. EDX analysis showed that the experimental concentrations of the samples are smaller than the theoretical ones. This indicates that there is no successful integral reaction of stoichiometric input components, since no secondary phases are suggested by XRD analysis.
| Sample | Chemical species | |||||||||||||
|---|---|---|---|---|---|---|---|---|---|---|---|---|---|---|
| At% EDX analysis | At% calculation | |||||||||||||
| Ba0.85Ca0.12Ce0.03Ti0.90Zr0.04Nb0.042O3 | Ba | Ca | Ce | Ti | Zr | Nb | O | Ba | Ca | Ce | Ti | Zr | Nb | O |
| 12.85 | 2.35 | 0.49 | 19.69 | 1.06 | 1.02 | 62.54 | 17.0 | 2.40 | 0.60 | 20 | 0.96 | 0.84 | 60 | |
| Ba0.85Ca0.12Pr0.03Ti0.90Zr0.04Nb0.042O3 | Ba | Ca | Pr | Ti | Zr | Nb | O | Ba | Ca | Pr | Ti | Zr | Nb | O |
| 15.25 | 2.38 | 0.35 | 18.42 | 0.76 | 0.80 | 62.04 | 17.0 | 2.40 | 0.60 | 20 | 0.96 | 0.84 | 60 | |
Therefore, it is reasonable to assure the substitution of (Zr4+, Nb5+) for Ti4+ in B site and Ca2+, RE3+ for Ba2+ in A site in our samples, which is consistent with our XRD result.
The SEM images illustrated in Fig. 4 for BCRETZN (RE = Ce, Pr) demonstrated that the surface of the original compound is composed of grains varying in size from 20 to 5 µm.
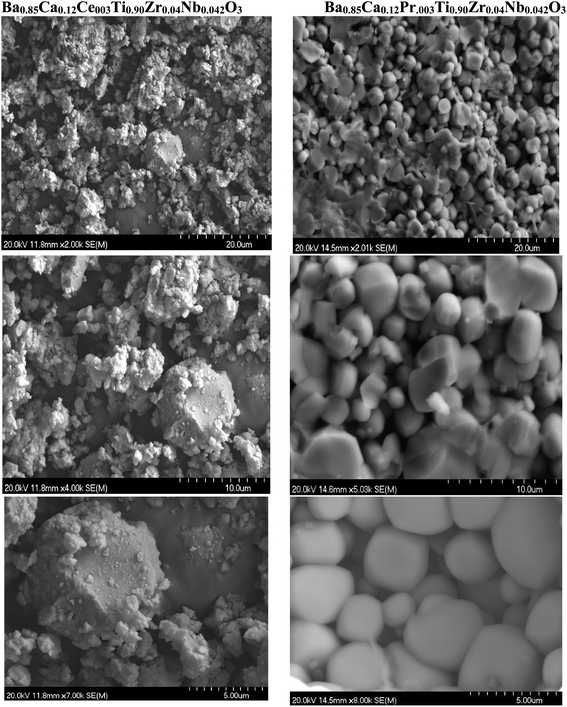 | ||
| Fig. 4 SEM picture of Ba0.85Ca0.12Ce0.03Ti0.90Zr0.04Nb0.042O3 and Ba0.85Ca0.12Pr0.03Ti0.90Zr0.04Nb0.042O3 samples. | ||
Various geometries are evenly distributed on surface as has been proposed in similar perovskite ceramics with a varying chemical stoichiometry.27
At higher magnification, we observe that all particles with a regular size of nearly 5 µm are evenly scattered on the surface, indicating that each particle consists of an agglomerate of a variety of crystallites.28
To compare doping elements, we remark that the BCPrTZN compounds have a smaller grain sizes than the BCCrTZN compound. This phenomenon agrees with the result obtained from the XRD profile (Fig. 1).
We conclude that the incorporation of Pr3+ ions can strongly reduce the size of ceramic than Ce3+ ion to form BCRETZN (RE = Ce, Pr) ceramic.
As reported in ref. 29, the existence of various grain sizes with long-term annealing leads to the formation of irregularly-shaped grains and, therefore, porosity can be deceased.
This behavior is the impact of the optical response.
3.3 Photoluminescence properties
Fig. 5(a) displays the PL spectra of BCPrTZN compounds measured at room temperature. The absorption of photons at 450 nm resulted in the excitation of the 3P0 level of Pr3+.30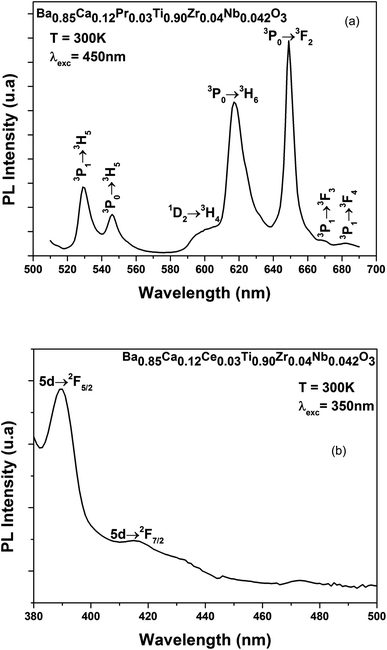 | ||
| Fig. 5 (a) PL spectra of Ba0.85Ca0.12Pr0.03Ti0.90Zr0.04Nb0.042O3 sample, (b) PL spectra of Ba0.85Ca0.12Ce0.03Ti0.90Zr0.04Nb0.042O3 sample. | ||
The PL spectra resulted in green and red emissions in the 530 nm to 700 nm range, excited utilizing the 450 nm light, in which the green light of Pr3+ ions revealed, in visible range, two emission peaks situated at 530 nm and 546 nm assigned, respectively, to the (3P1 → 3H5), (3P0 → 3H5) transitions.
Whereas, the red emission indicated five emission peaks situated at 600, 617, 649, 669 and 682 nm, and assigned to the (1D2 → 3H4), (3P0 → 3H6), (3P0 → 3F2), (3P1 → 3F3) and (3P1 → 3F4) transitions, respectively.31,32 It should be noted that the highest emissions are seen at 617 and 649 nm (Fig. 5(a)).
Under laser excitation at 450 nm, we observed that the PL spectra are composed of strong green and red emissions for the BCPrTZN compound at RT, corresponding to the transitions (3P0 → 3H6), (3P0 → 3F2), respectively.
The room temperature emission spectra (λex = 350 nm), of the BCCeTZN compound in the UV-Vis region is displayed in Fig. 5(b). We noticed a broad asymmetric blue band at 380–500 nm that is ascribed to the allowed parity transitions of the lowest component of 5d state to 2F5/2 and 2F7/2 levels of Ce3+ ions.33 Both emissions are centered at 389 and 416 nm.
The PL spectra at RT of the BCCeTZN compound upon a 350 nm laser excitation demonstrated the strong emission peak near 389 nm attributed to the 5d state to 2F5/2 levels of Ce3+ ions.
3.4 AC-conductivity study
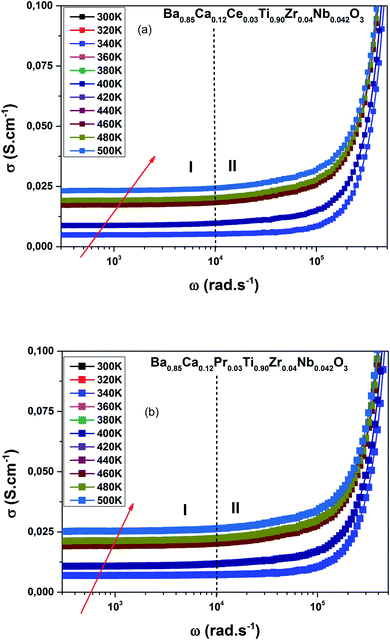
Fig. 6(a and b) demonstrates the distribution of conductivity (σ(ω)) against temperature and frequency of the BCRETZN (RE = Ce, Pr) compounds.The charges shifted as a result of the applied field and contributed to the electrical behavior of BCRETZN (RE = Ce, Pr) samples.
We notice the σ(ω) rose with the frequency. Consequently, it departed from its σdc(ω) value and independence with frequency up to about 104 Hz.
Furthermore, σ(ω) exhibited diffusion that moved to a higher frequency with rising temperatures for our samples.
The variation of the slopes σ(ω) was found in higher and lower frequency regions. The apparent low frequency plateau is frequency independent, which relates to σdc(ω) and indicates long-distance mobility of charge carriers. This low frequency plateau increased with increasing temperature, resulting in long-distance motion of the charge carriers.
For our case, data of σ(ω) of BCRETZN (RE = Ce, Pr) compounds could be divided into two areas: at low-frequency σdc(ω) region (R-I) and in the region with a strong frequency-dependent conductance at higher frequency (R-II).
According to Funke,34 this behavior may be explained on the basis of the Jump Relaxation Model (JRM) in which the two contrasting relaxation processes failed and successful hops occurred.
The latter is produced when ions hop to proximate locations and return to their original location. This dispersion is caused by a greater unsuccessful jump. Generally, electrical conduction is explained by the relationship known as Jonscher's power:
σ(ω) = σdc + σdc(ω) = σdc + A × (2π × ν)n![[thin space (1/6-em)]](https://www.rsc.org/images/entities/char_2009.gif) , 0 ≤ n ≤ 1 , 0 ≤ n ≤ 1
| (3) |
Similarly, P. Barranco et al.35 had suggested that deflection of n may be described on the basis of the jump of energy carriers between both sites assigned to the polarizability of compound.
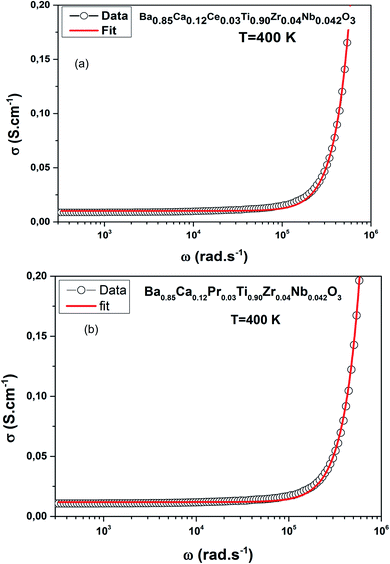
In the current search, the conductance data fitting in accordance with eqn (3) could not trace the modification of “n” with temperature.
Fig. 7(a and b) shows fitted conductance measurement for T = 400 K, an example, for both compounds.
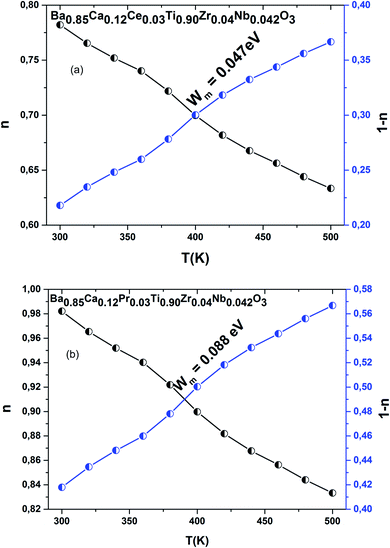
The evolution of “n” for both compounds is demonstrated in Fig. 8(a and b), revealing the changing of the conduction phenomena. We note a decrease in “n” with temperature increase, indicating that Correlated Barrier Hopping (CBH) is the most suitable conductance for R-II data.36 This provides the contribution of large polaron hopping conductance to BCRETZN (RE = Ce, Pr) compounds.
In our case, σac is calculated by the expression:
 | (4) |
In this mode of electrical conduction, potential barrier (Wm) is defined in the CBH method as below:
 | (5) |
To approximate the Wm/KBT large, the parameter “n” was reduced:
 | (6) |
The Wm-Ce and Wm-Pr were calculated from the linear adjustment of experimental values 1 − n versus temperature. Their magnitudes were Wm-Ce = 0.047 eV and Wm-Pr = 0.088 eV (Fig. 8(a and b)).
Fig. 9(a and b) shows the decreased electrical conductivity σ(ω)/σdc(ω) as a function of the decreased ω/(σdcT) values. All the measurements were practically overlapping.
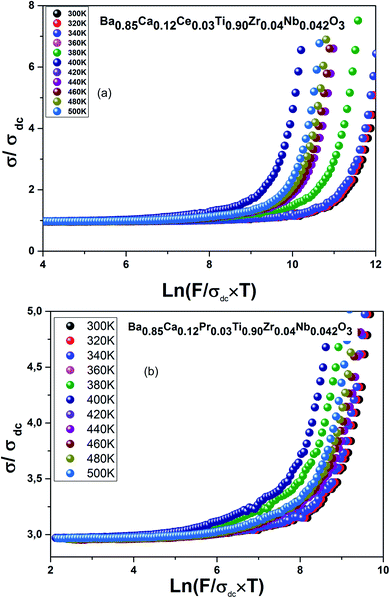 | ||
| Fig. 9 (a) Reduced conductivity for Ba0.85Ca0.12Ce0.03Ti0.90Zr0.04Nb0.042O3, (b) reduced conductivity for Ba0.85Ca0.12Pr0.03Ti0.90Zr0.04Nb0.042O3. | ||
They were approximately one line. This phenomenon is called the Time–Temperature Superposition Principle (TTSP).37
In fact, this suggests that the temperature relationship is integrated in the increase of charge carrier density without having a direct effect on the conductance phenomenon.
In addition, σ(ω)/σdc(ω)ratio is measured by the formula:38
 | (7) |
The overlap of data at various temperatures suggests that the electrical ionic conduction mechanism in our compounds is not connected to temperature; however, it is connected to a short distance assigned to electrode polarization effect, in low-frequency range and at high temperature.
4. Conclusion
In conclusion, BCRETZN (RE = Ce, Pr) compounds were prepared using a solid-state route. XRD data refined using Rietveld method indicated that the BCRETZN (RE = Ce, Pr) compounds crystallize in tetragonal structure. The morphology of the BCRETZN (RE = Ce, Pr) ceramic was examined by SEM.Strong red emission bands were observed for the BCPrTZN sample and strong green emission bands were found at RT upon laser excitation at 450 nm, corresponding to the transitions (3P0 → 3H6), (3P0 → 3F2), respectively. For BCCeTZN sample, upon excitation of a laser at 350 nm at RT, we found strong violet emission corresponding to the transition 5d → 2F5/2.
The electrical conduction process of our compounds have been examined depending on the frequency at various temperatures.
The coexistence of optical and electrical conduction characteristics may lay the foundation for improvement of a potential material for application in optoelectronic or photonic devices.
Conflicts of interest
There are no conflicts to declare.References
- M. C. Weber, M. Guennou, C. Toulouse, M. Cazayous, Y. Gillet, X. Gonze and J. Kreisel, Phys. Rev. B, 2016, 93, 125204 CrossRef.
- Z. B. Tian, X. H. Wang, L. K. Shu, T. Wang, T. H. Song, Z. Gui and L. Li, J. Am. Ceram. Soc., 2009, 92, 830–833 CrossRef CAS.
- H. A. Sauer and J. R. Fisher, J. Am. Ceram. Soc., 1960, 43, 297–301 CrossRef CAS.
- T. Mondal, S. Das, T. Badapanda, T. P. Sinha and P. M. Saruna, Phys. B, 2017, 508, 124–135 CrossRef CAS.
- A. Y. Fasasi, B. D. Ngom and J. B. Kana-Kana, J. Phys. Chem. Solids, 2009, 70, 1322–1329 CrossRef CAS.
- I. Bennour, M. Mohamed, A. Kabadou and M. Abdelmouleh, J. Mol. Struct., 2020, 1217, 128347 CrossRef CAS.
- M. Ganguly, S. K. Rout, W. S. Woo, C. W. Ahn and I. W. Kim, Phys. B, 2013, 411, 26–34 CrossRef CAS.
- Z. Raddaoui, B. Smiri, A. Maaoui, J. Dhahri, R. M'ghaieth, N. Abdelmoula and K. Khirouni, RSC Adv., 2018, 8, 27870 RSC.
- Z. Raddaoui, R. Lahouli, S. E. L. Kossi, J. Dhahri, K. Khirouni and K. Taibi, J. Alloys Compd., 2018, 765, 428–436 CrossRef CAS.
- Z. Raddaoui, N. Kokanyan, M. D. Fontana, S. E. Kossi and J. Dhahri, J. Mol. Struct., 2021, 1230, 129939 CrossRef CAS.
- Q. Zhang, H. Sun, X. Wang, Y. Zhang and X. Li, J. Eur. Ceram. Soc., 2014, 34, 1439–1444 CrossRef CAS.
- C. Chalfouh, A. Lahmar, N. Abdelmoula and H. Khemakhem, J. Alloys Compd., 2017, 729, 858–865 CrossRef CAS.
- Z. Wang, W. Li, R. Chu, J. Hao, Z. Xu and G. Li, J. Mater. Sci.: Mater. Electron., 2017, 17, 7569 Search PubMed.
- R. Hayati, M. A. Bahrevar, Y. Ganjkhanlou, V. Rojas and J. Koryza, J. Adv. Ceram., 2019, 8, 186–195 CrossRef CAS.
- I. Zouari, Z. Sassi, L. Seveyrat, N. Abdelmoula, L. Lebrun and H. Khemakhem, Ceram. Int., 2018, 44, 8018–8025 CrossRef CAS.
- H. M. Rietveld, Acta Crystallogr., 1967, 22, 151–152 CrossRef CAS.
- Z. Raddaoui, S. El Kossi, T. A. Shahrani, M. Bourguiba, J. Dhahri, M. Chafra and H. Belmabrouk, J. Mater. Sci.: Mater. Electron., 2020, 31, 21732–21746 CrossRef CAS.
- H. Kaddoussi, A. Lahmar, Y. Gagou, J.-L. Dellis, H. Khemakhem and M. El Marssi, Ceram. Int., 2015, 41, 15103–15110 CrossRef CAS.
- I. Zouari, Z. Sassi, L. Seveyrat, N. Abdelmoula, L. Lebrun and H. Khemakhem, J. Alloys Compd., 2020, 825, 153859 CrossRef CAS.
- A. P. A. Moraes, A. G. Souza Filho, P. T. C. Freire, J. Mendes Filho, J. C. M'Peko, A. C. Hernandes, E. Antonelli, M. W. Blair, R. E. Muenchausen, L. G. Jacobsohn and W. Paraguassu, J. Appl. Phys., 2011, 109, 124102 CrossRef.
- Z. Raddaoui, R. Lahouli, S. E. L. Kossi, J. Dhahri, K. Khirouni and K. Taibi, J. Alloys Compd., 2019, 771, 67–78 CrossRef CAS.
- Z. Zhang, C. Zhong, Y. Deng, L. Liu, Y. Wu and W. Hu, RSC Adv., 2013, 3, 6763 RSC.
- A. Chen, G. Yang, H. Long, P. Lu, W. Zhang and H. Wang, Mater. Lett., 2013, 91, 319 CrossRef CAS.
- S. Eisermann, A. Kronenberger, A. Laufer, J. Bieber, G. Haas, S. Lautenschlager, G. Homm, P. J. Klar and B. K. Meyer, Phys. Status Solidi A, 2011, 209, 531 CrossRef.
- A. A. Akl and A. S. Hassanien, Superlattices Microstruct., 2015, 85, 67 CrossRef CAS.
- Z. Raddaoui, R. Brahem, A. Bajahzar, H. M. Albetran, J. Dhahri and H. Belmabrouk, J. Mater. Sci.: Mater. Electron., 2021, 32, 23333–23348 CrossRef CAS.
- S. M. Salili, A. Ataie, M. R. Barati and Z. Sadighi, Mater. Charact., 2015, 106, 78 CrossRef CAS.
- Y. Regaiega, M. Koubaa, W. C. Koubaaa, A. Cheikhrouhou, L. Sicard, S. A. Merah and F. Herbst, Mater. Chem. Phys., 2012, 132, 839 CrossRef.
- H. Ghoudi, S. Chkoundali, Z. Raddaoui and A. Aydi, RSC Adv., 2019, 9, 25358 RSC.
- S. Q. Man, H. L. Zhang, Y. L. Liu, J. X. Meng, E. Y. B. Pun and P. S. Chung, Opt. Mater., 2007, 30, 334–337 CrossRef CAS.
- J. J. Velázquez, A. C. Yanes, J. del-Castillo, J. Méndez-Ramos and V. D. Rodríguez, J. Non-Cryst. Solids, 2010, 356, 1349–1353 CrossRef.
- Q. Zhang, H. Sun, X. Wang, Y. Zhang and X. Li, J. Eur. Ceram. Soc., 2014, 34, 1439 CrossRef CAS.
- N. Guo, Y. Song, H. You, G. Jia, M. Yang, K. Liu, Y. Zheng, Y. Huang and H. Zhang, Eur. J. Inorg. Chem., 2010, 4636–4642 CrossRef CAS.
- K. Funke, Prog. Solid State Chem., 1993, 22, 111–195 CrossRef CAS.
- A. P. Barranco, M. P. Gutiérrez-Amador, A. Huanosta and R. Valenzuela, Appl. Phys. Lett., 1998, 73, 2039–2041 CrossRef.
- M. Bourguiba, Z. Raddaoui, S. El Kossi, T. Al-shahrani, A. Dhahri, M. Chafra, J. Dhahri and H. Belmabrouk, J. Mater. Sci.: Mater. Electron., 2021, 32, 6520–6537 CrossRef CAS.
- Z. Raddaoui, S. El Kossi, R. Brahem, A. Bajahzar, A. V. Trukhanov, A. L. Kozlovskiy, M. V. Zdorovets, J. Dhahri and H. Belmabrouk, J. Mater. Sci.: Mater. Electron., 2021, 32, 16113–16125 CrossRef CAS.
- S. N. Tripathy, Z. Wojnarowska, J. Knapik, H. Shirota, R. Biswas and M. Paluch, J. Chem. Phys., 2015, 142, 184504 CrossRef PubMed.
| This journal is © The Royal Society of Chemistry 2022 |

