 Open Access Article
Rapid electrochemical detection of MiRNA-21 facilitated by the excellent catalytic ability of Pt@CeO2 nanospheres†
Peiwu Chen‡
a,
Lan Jiang‡a,
Xianjin Xie‡a,
Dong Sun‡ b,
Jinyao Liua,
Yuefeng Zhaoa,
Yuhao Lia,
Abel Ibrahim Balbín Tamayo*c,
Baolin Liu*d,
Yuqing Miao*a and
Ruizhuo Ouyang‡
 *a
*a
aInstitute of Bismuth and Rhenium Science, School of Materials and Chemistry, University of Shanghai for Science and Technology, Shanghai 200093, China. E-mail: yqmiao@usst.edu.cn; ouyangrz@usst.edu.cn
bSchool of Chemistry and Chemical Engineering, Henan Normal University, Xinxiang 453007, China
cFaculty of Chemistry, University of Havana, Havana 10400, Cuba. E-mail: ibrahim@fq.uh.cu
dSchool of Health Science and Engineering, University of Shanghai for Science and Technology, Shanghai 200093, China. E-mail: blliuk@usst.edu.cn
First published on 19th April 2022
Abstract
Pt@CeO2 nanospheres (NSs) were first synthesized by simply mixing Ce(NO3)3 and K2PtCl4 under the protection of pure argon at 70 °C for 1 h, which exhibited excellent catalytic ability toward hydrogen peroxide (H2O2). An electrochemical biosensor was successfully developed using Pt@CeO2 NSs as a capture probe for the ultra-sensitive and fast detection of miRNA-21, a new type of biomarker for disease diagnostics, especially for cancer. During the step-by-step construction process of the RNA sensor, Pt@CeO2 NSs were functionalized with streptavidin (SA) to obtain SA-Pt@CeO2 NSs through amide bonds. Gold nanoparticles (Au NPs) were electrodeposited on the surface of the glassy carbon electrode to improve the transmission capacity of electrons and provided Au atoms for fixing the thiolated capture probe (SH-CP) with a hairpin structure on the electrode via forming Au–S bonds. The target miRNA-21 specifically hybridized with SH-CP and opened the hairpin structure to form a rigid duplex so as to activate the biotin at the end of the capture probe. SA-Pt@CeO2 NSs were thus specially attached to the electrode surface through the biotin-streptavidin affinity interaction, finally leading to the significant signal amplification. The ultra-sensitive and rapid detection of miRNA-21 was finally realized as expected benefiting from the excellent catalytic ability of Pt@CeO2 NSs toward H2O2 in a wide linear concentration range from 10 fM to 1 nM with the detection limit as low as 1.41 fM. The results achieved with this new RNA sensor were quite satisfactory during the blood sample analysis.
1. Introduction
MicroRNAs (miRNAs), a type of endogenous non-coding short RNA molecules containing approximately 19–23 nucleotides, hinder protein translation or degrade messenger RNA to post-transcriptionally regulate gene expression in a variety of animals, plants, and viruses.1,2 The abnormal expression of miRNAs has been proved to be particularly related to a variety of cancers, genetic diseases and immune inefficiencies.3 Therefore, miRNAs have gradually become a new type of clinical diagnosis and prognostic biomarker, and potential therapeutic target for new drug discovery.4 However, due to the unique characteristics of miRNAs including small size, low abundance, and similar sequences in homogenous families, the detection of miRNAs is still quite challenging.5 Conventional miRNA analysis methods like Northern blotting, microarray and RT-qPCR usually suffer from different inherent shortcomings, such as low sensitivity, false positive signals and expensive equipment.6–9 As a result, there is an urgent need for a variety of rapid, sensitive and reliable miRNA detection strategies to analyze miRNAs in vitro or in vivo.10,11The inherent advantages of electrochemical methods like high sensitivity, simplicity, cost-effectiveness and good compatibility with micro-fabrication techniques have attracted widespread attention in nucleic acid analysis.12,13 In order to amplify the hybridization signal, various electrocatalytic enzyme labels and electroactive nanoparticles (NPs) have been utilized to develop electrochemical nucleic acid biosensors.14 Among these methods, the nanomaterial-based electrochemical signal amplification platform displays a broad application prospect owing to the large surface area, excellent electrical conductivity, good biocompatibility, high stability and advanced catalytic performance.15 For example, by using metal ion-functionalized titanium phosphate NPs as a kind of tracer, a highly sensitive miRNA electrochemical biosensor was developed.16 The noble metal Pt NPs are the most effective mimic enzyme candidates for a variety of reactions17 and have been widely used to catalyze CO oxidation, oxygen reduction reactions (ORR) and hydrogen evolution reactions (HER) without causing damage to normal tissues during the development of nanomedicines.18–20 Moreover, compared with other electroactive metal NPs like Cu, Fe and Ni,21 Pt NPs often display significantly higher catalytic activity and more excellent electrical conductivity.
On the other hand, metal oxides have received a wide use in biosensors because of their low cost, good stability and particularly the distinctive electrocatalytic capabilities, which makes metal oxides excellent to produce redox electron pairs for creating electrochemical sensing platforms.22 For instance, cerium dioxide (CeO2) plays a vital role in fabricating biosensors due to its excellent catalytic performance, high surface oxygen mobility, good anti-inflammatory effect, favorable biocompatibility as well as high adsorption capacity. More importantly, the biological characteristics and unique catalytic performance of CeO2 NPs result from their variable oxidation state and reversible conversion between Ce4+ and Ce3+.23,24 However, the redox signal of CeO2 NPs detected in the neutral and mild buffer solution is too weak to serve as a biosensing probe. The integration of Pt catalyst with CeO2 NPs is regarded as a promising strategy and can reduce the formation energy of oxygen vacancies, thereby generating additional oxygen vacancies.25–27 Therefore, Pt@CeO2 NSs are proposed to exhibit enhanced catalytic performance and catalytic efficiency toward H2O2 reduction.
Herein, a new electrochemical biosensor was developed for the highly sensitive detection of miRNA-21 benefiting from the powerful electrocatalysis of Pt@CeO2 NSs toward H2O2 reduction28. Pt@CeO2 NS were prepared as capture probes through mixing Ce(NO3)3 with K2PtCl4 protected by pure Ar gas at 70 °C for 1 h, followed by immobilizing streptavidin (SA) through amide bond to obtain SA-Pt@CeO2 NSs. The step-by-step construction process of the proposed RNA sensor was illustrated in Scheme 1. Briefly, the biotinylated probe SH-CP with a hairpin structure was first attached to the surface of glassy carbon electrode (GCE) covered by Au NPs through Au–S bonds. Biotin readily binds to biological macromolecules such as proteins and nucleic acids as marker, forming biotin derivatives that maintain the original biological activity of the macromolecules and bind the corresponding affinity molecules with four biotin binding sites.29 The subsequent addition of miRNA-21 would specifically hybridize the capture probe marked with biotin to open the hairpin structure and thus guarantee the specificity of the sensor. Finally, the SA-Pt@CeO2 NSs bound to SH-CP through biotin-avidin affinity interaction. As predicted, Pt@CeO2 NSs displayed extraordinary catalytic activity due their synergistic effect30 and generated significantly amplified electrochemical response to H2O2, which dramatically improved the sensitivity of the designed biosensor. The cumbersome modification process of the electrode could be simplified to a large extent and endow the biosensor with super high sensitivity owing to the excellent catalytic activity of Pt@CeO2 NSs.31 Moreover, the hairpin capture probe gave the biosensor good ability to recognize base mismatches, increased the specificity of the biosensor, and thus provided a promising detection platform for clinical applications.32
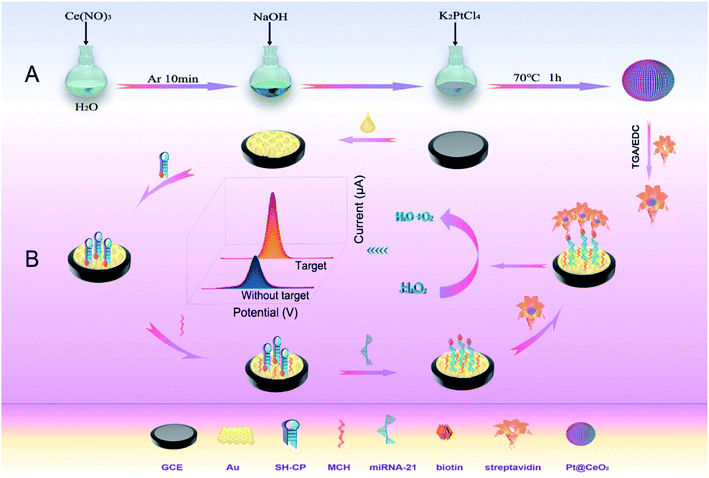 | ||
| Scheme 1 The schematic diagram of (A) the preparation of Pt@CeO2 NSs and (B) the detection principle of the proposed Pt@CeO2-based electrochemical miRNA sensor. | ||
2. Experimental sections
2.1 Reagents and materials
Potassium tetrachloroplatinate (K2PtCl4) powder was purchased from Haoxi Nanotechnology Co., Ltd. (Shanghai, China). 6-Mercaptohexanol (MCH), tris(carboxyethyl)phosphine (TCEP), potassium chloride (KCl), hydrogen tetrachloroaurate trihydrate (HAuCl4·3H2O), diethyl pyrocarbonate (DEPC) water, potassium hexacyanoferrate-III (K3[Fe(CN)6]), potassium hexacyanoferrate-II (K4[Fe(CN)6]), hydrogen peroxide (H2O2), sodium sulfate (Na2SO4), ammonia solution (NH4OH), cerium(III) nitrate hexahydrate (Ce(NO3)3·6H2O), phosphate buffer solution (PBS), streptavidin (SA), N-ethyl-3-(3-dimethylaminopropyl) carbodiimide (EDC) and mercapto acetic acid (TGA) were all purchased from Shanghai Titan Technology Co., Ltd. All chemical reagents were of analytical grade and used as received without any further purification. All the oligonucleotides were synthesized in Nanjing Kingsray Biotechnology Co., Ltd. (Nanjing, China) and purified with high-performance liquid chromatography (HPLC). Table 1 shows the detailed nucleotide sequences.| Oligonucleotides | Sequence (from 5′ to 3′) |
|---|---|
| miRNA-21 | UAG CUU AUC AGA CUG AUG UUG A |
| SH-CP | SH-AAAAAAAAAATCAACATCAGTCTGATAAGCTAGCTAGG-biotin |
| S-RNA | UAG CUU AUC GGA CUG AUG UUG A |
| T-RNA | UUG CUU AUC GGA CUG AUC UUG A |
| N-RNA | GUA AGG CAU CUG ACC GAA GGC A |
| miRNA-155 | UUAAUGCUAAUCGUGAUAGGGGU |
2.2 Apparatus
All electrochemical measurements were carried out on the electrochemical workstation (PGSTAT302N, Metrohm China Co., Ltd.). The conventional three-electrode system was applied using a GCE, Ag/AgCl electrode and the platinum wire as the working electrode, the reference electrode and the counter electrode, respectively. The chemical elements and morphologies of the composite materials were measured by energy dispersive spectroscopy (EDS), scanning electron microscope (SEM) (JSM-6701F, JEOL Co., Ltd.) and transmission electron microscopic (TEM) images were obtained on HT7800 from Hitachi High-Technologies Corporation (Japan). The crystal structures of the materials were analyzed by X-ray diffraction (XRD, Smartlab-3, Rigaku, USA). X-ray photoelectron spectroscopies (XPS) were obtained from a Kratos XSAM 800 X-ray photoelectron spectrometer (Thermo Scientific, USA). Oxygen vacancy was quantified by Electron paramagnetic resonance (EPR) spectrometer (Bruker EMXplus, Germany).2.3 Preparation of Pt@CeO2 nanospheres (NSs)
The whole synthesis process was carried out under the protection of pure Ar gas. 1 mL 0.1 M Ce(NO3)3 was first added to 10 mL H2O which was bubbled with Ar gas for 10 min. Then, 1 mL 0.2 M NaOH and 1 mL 0.01 M K2PtCl4 were quickly added to the bubbled mixture to form Pt@CeO2 NSs after being heated at 70 °C for 1 h. The prepared Pt@CeO2 NSs were purified by removing the residual K2PtCl4 remaining in the supernatant through centrifugation at room temperature and dried overnight at 80 °C.332.4 Functionalization of Pt@CeO2 NSs
Firstly, 1 mg mL−1 Pt@CeO2 NSs and 1 mM TGA were mixed in water to introduce the carboxyl group to the surface of Pt@CeO2 NSs under sonication, which were mixed with SA in PBS containing 10 mM EDC. TGA with two terminal functional groups of thiol and carboxylic acid could bind with the surface of Pt@CeO2 NSs, to further improve its dispersibility and biocompatibility and facilitate the formation of the carboxylated Pt@CeO2 NSs.34–36 Then, EDC acted as an activating reagent to promote the formation of amine bond between SA and the carboxylated Pt@CeO2 NSs, thereby forming SA-Pt@CeO2 NSs. The SA-Pt@CeO2 NSs were finally obtained by sonicating the mixture for 30 min and repeated centrifugation.372.5 Construction of the Pt@CeO2-based electrochemical biosensor
After being polished with a 0.3 μm alumina slurry to a mirror-like surface, the GCE was sequentially washed with water, ethanol and water, and dried at room temperature. A layer of bright Au NPs was then formed on GCE surface (Au/GCE) in 1 mM HAuCl4 solution containing Na2SO4 by electrodepositing for 300 s. 6 μL hairpin capture probe containing solution (50 nM) mixed with 2 μM TCEP was subsequently dripped on the surface of Au/GCE, where TCEP could activate the thiol group of the DNA probe through destroying its the disulfide bond, and facilitate the immobilization of hairpin capture probe via Au–S bond. After 3 h, the electrode was thoroughly washed with DEPC water to remove the non-specifically bound oligonucleotides, and immersed in 1 mM MCH for 1 h to block non-specific adsorption sites exposed on the surface. Afterwards, 5 μL of miRNA-21 at different concentrations was pipetted onto the resultant electrode to hybridize with SH-CP marked with biotin at room temperature for 2 h. Here, biotin-labeled SH-CP listed in Table 1 was synthesized and purified by specialized companies. The obtained electrode was rinsed again with DEPC water and incubated with a solution containing SA/Pt@CeO2 for 1 h at room temperature. In the pH 7.4 PBS containing 1 mM H2O2, differential pulse voltammetry (DPV) measurements were carried out with the corresponding parameters set as follows: from −0.5 to 0.1 V for the scanning potential range, 0.07 V for the pulse amplitude, 0.05 s for the pulse width and 0.0167 s for the sample width. All experiments were carried out at room temperature.3. Results and discussion
3.1 Preparation of the proposed Pt@CeO2-based RNA biosensor
As shown in Scheme 1, a layer of Au NPs was first electrodeposited on the surface of the bare GCE for the purpose to improve the transmission capacity of electrons and provide Au elements for forming Au–S bonds. Subsequently, the hairpin capture probe (SH-CP) labeled with biotin were immobilized on the surface of Au/GCE via the Au–S bonds. The unreacted Au sites on the electrode surface were sealed with MCH to avoid the non-specific adsorption. The hairpin structure capture was in a closed state without the target miRNA-21 which blocked the electrochemical tracer from interacting with the biotinylated end because of the large steric effect, as a result of SA-Pt@CeO2 not being immobilized on the electrode surface to catalyze H2O2.38 However, with the target present, the hairpin structure of the capture probe would be hydrolyzed and opened, forming a rigid duplex to activate the biotin at the end of the probe. Pt@CeO2 NSs was thus attached to the electrode surface through the affinity interaction between biotin and avidin. Under the strong catalytic ability of Pt@CeO2 NSs to reduce H2O2 to H2O, obvious redox electrochemical signal could be produced as predicted and the signal intensity increased with more miRNA-21 present. A preferred linear relationship was finally achieved within a certain concentration range to realize the qualitative and quantitative analysis of miRNA-21. The designed electrochemical miRNA sensor displayed preferred detection behaviour toward the target miRNA-21 due to the excellent catalytic performance of Pt@CeO2 as the electrochemical signal probe.3.2 Characterizations of Pt@CeO2 NSs
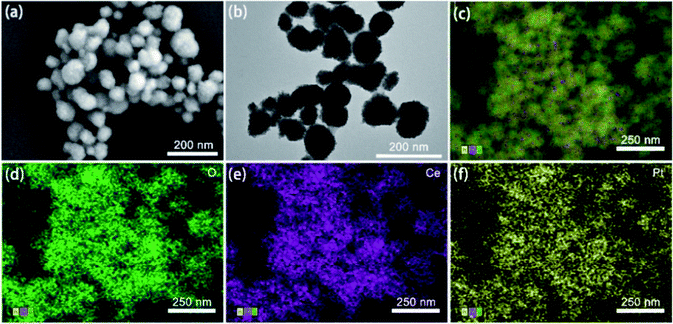
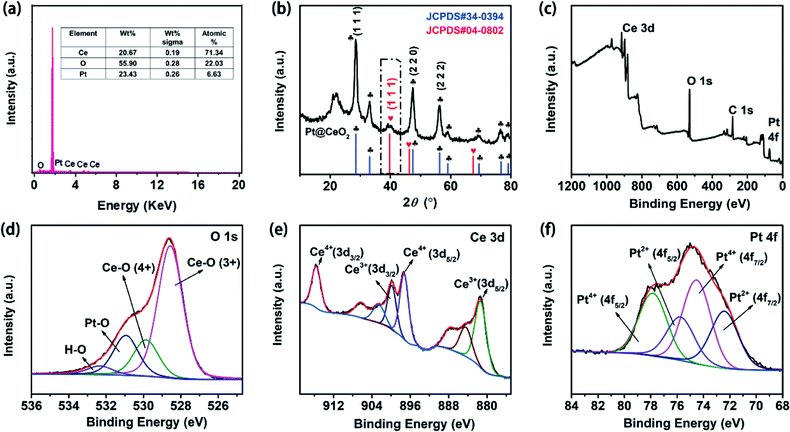
A nanosphere shape of the prepared Pt@CeO2 NPs with uniform size and rough surface was clearly observed in the SEM image (Fig. 1a), which was confirmed by TEM images as well (Fig. 1b). The size of the Pt@CeO2 NSs was about 67 nm. The EDS map scanning of the Pt@CeO2 NSs shown in Fig. 1c–e revealed the uniform distribution of the three elements of O, Ce and Pt and the successful encapsulation of a large number of Pt NPs inside each nanosphere. Moreover, the presence of elemental peaks of O, Ce and Pt indicated the formation of Pt@CeO2 NSs (Fig. 2a).The formation of Pt@CeO2 NSs was also verified by both XRD and XPS. The XRD results in Fig. 2b shows that the crystal planes (111), (220) and (222) of the Pt@CeO2 NSs appearing at 2θ of 28.55°, 47.48° and 59.09°, respectively, matched well the peaks in the standard diffraction card for CeO2 (JCPDS card no. 34-0394),39 and the (111) crystal planes at 38.76° perfectly matched the standard card for Pt (JCPDS card no. 04-0802).40 The above results verified the high purity and crystallinity of the synthesized Pt@CeO2 NSs. The presence of O 1s, Ce 3d and Pt 4f in the XPS full spectrum further confirmed the elemental chemical states and electronic structure of Pt@CeO2 NSs (Fig. 2c). In the fitted XPS spectrum (Fig. 2d), the four sets of peaks at 528.57, 529.86, 530.94 and 532.32 eV could be assigned to CeIV–O, CeIII–O, Pt–O and H–O bonds. In Fig. 2e, the fitted XPS spectrum of Ce 3d, the two peaks at 897.3 and 915.63 eV corresponded to CeIV 3d5/2 and CeIV 3d3/2, respectively, which were ascribed to CeO2.41 Meanwhile, the other two peaks at 881.47 and 900 eV could be assigned CeIII 3d5/2 and CeIII 3d3/2, respectively. The two peaks at 74.55 and 77.89 eV could be assigned to Pt 4f7/2 and Pt 4f5/2, respectively (Fig. 2f), which were generally attributed to PtIV. Moreover, the sub-bands at about 75.79 and 72.45 eV belonged to PtII 4f7/2 and PtII 4f5/2, respectively.42 These results proved the highly crystal structure of Pt@CeO2 NSs with uniform morphology.
3.3 Electrochemical behavior of the prepared biosensing platform
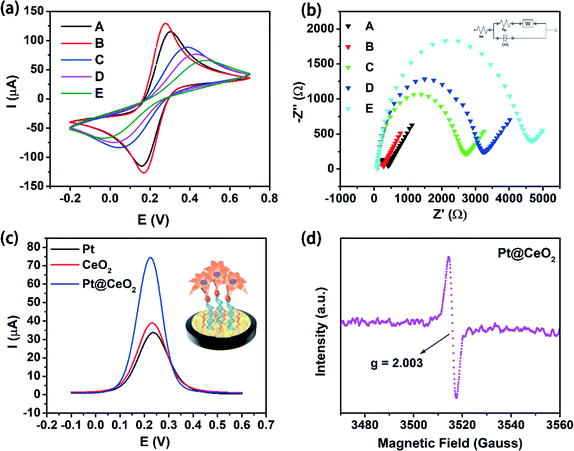
Cyclic voltammetry (CV) and electrochemical impedance spectroscopy (EIS) techniques could be used to qualitatively prove the successful construction of biosensors.43–45 In the solution of 5.0 mM [Fe(CN)6]3−/4− containing 0.1 M KCl, CV was selected to investigate the surface properties of electrodes in different modification processes at a scan rate of 0.1 V s−1 from 0.7 V to −0.2 V. Fig. 3a shows that a good reversible redox peak was clearly observed with the bare GCE (curve A). After Au NPs were electrodeposited on the electrode surface (curve B), the redox peak current increased significantly, indicating the good electrical conductivity and a larger specific surface area of Au/GCE. After the hairpin capture probe was subsequently fixed on the surface of Au/GCE, the peak current was found to greatly decrease (curve C) because of the mutual repulsion between the negatively charged phosphate group on the capture probe and [Fe(CN)6]3−/4− which prevented [Fe(CN)6]3−/4− from reaching the electrode surface. As a consequence, the peak current was reduced. Similarly, the sequential modification of MCH and miRNA-21 on the electrode surface further increased the steric hindrance of the electrode surface and accordingly hindered [Fe(CN)6]3−/4− from reaching the electrode surface. The peak current was, therefore, continuously reduced (curves D and E).EIS is also an effective tool to characterize the electrochemical properties of the modified electrodes.44 EIS measurements were obtained with different modified electrodes in 5.0 mM [Fe(CN)6]3−/4− solution containing 0.1 M KCl (Fig. 3b). The fitted EIS equivalent circuit diagram was inset in the upper right corner of Fig. 3b, where Rs is mainly the resistance of the electrolyte solution, Rp the interface reaction resistance, W the Warburg impedance related to ion diffusion in the main electrode, and CPE the interface capacitance. The values of Rp varied significantly for the differently modified electrodes. Clearly, the bare GCE showed a lower value of Rp reflecting on a small semicircle (curve A). However, the layer of Au NPs on GCE decreased the semicircle diameter (curve B), indicating that the electron transfer over the electrode surface was promoted to a certain extent due to the good conductivity of Au NPs. While the diameter of the semicircle greatly increased after the SH-CP was fixed on the Au/GCE surface (curve C). The reason might be that the SH-CP hindered the electron exchange of the redox probe [Fe(CN)6]3−/4− on the electrode surface, leading to the increase of Rp value. Similarly, the presence of MCH and miRNA-21 on the electrode surface in sequence further enlarged the semicircle diameter of EIS (curves D and E). These results were indicative of the effective construction of the proposed sensor, which was in good consistence with the CV analysis.
3.4 The catalytic behavior of Pt@CeO2 NSs
Signal amplification has been regarded as a very important strategy to improve the sensitivity of the electrochemical biosensors. In ordeiesy of both Pt and CeO2 were examined as well in 0.01 M pH 7.4 PBS containing 1 mM H2O2 for comparison. Fig. 3c shows that Pt exhibited lowest DPV peak current among the three signal probes, slightly lower than that of the signal probe CeO2, while the highest peak current was generated using the Pt@CeO2 NSs as signal probe. The greatly enhanced catalytic ability of Pt@CeO2 NSs toward H2O2 reduction was thus verified by the much higher current response than that of Pt and CeO2. Moreover, a sharp and strong paramagnetic signal was obviously seen at g = 2.003 from the EPR spectrum of Pt@CeO2 NS in Fig. 3d, indicative of the appearance of oxygen vacancies as a result of doping Pt inside the lattice of CeO2.46 Therefore, the increasing oxygen vacancies might majorly contribute to the excellent catalytic ability of Pt@CeO2 NSs.3.5 Optimization of experimental conditions
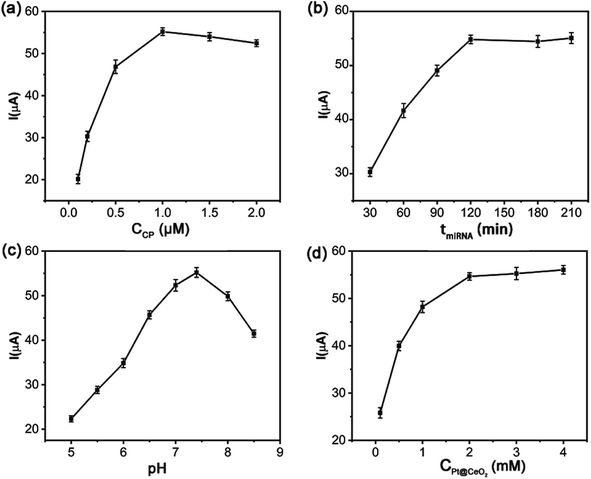
Some experimental parameters used to construct a sensor will significantly affect the detection performance of the designed biosensor, which here included the concentration of the capture probe SH-CP, the incubation time of miRNA-21, the pH of PBS and the concentration of Pt@CeO2 NSs. For the purpose to achieve the best detection performance, the above influencing factors need to be well optimized.The concentrations of SH-CP influenced the DPV signal of the proposed sensor. As shown in Fig. 4a, the current response increased with more capture probe used in the concentration range from 0.1 to 1.0 μM, and reached the highest value at 1.0 μM. The higher the concentration of SH-CP was, the more the target chains could be captured until the concentration increased to 1.0 μM. Afterwards, the current decreased slightly owing to the steric hindrance on the electrode surface produced by the lower efficiency of DNA hybridization. Therefore, 1.0 μM SH-CP was selected for the subsequent experiments. The amount of the signal probe immobilized majorly depended on the reaction time between the target miRNA-21 and the capture probe. As seen in Fig. 4b, longer incubation time of miRNA-21 led to higher current signal. When the reaction lasted 120 min, the current tended to be saturated without changing significantly afterwards. Therefore, miRNA-21 was incubated with the capture probe for 120 min during the fabrication of the sensor. At the same time, the increasing pH value was found to be able to strengthen the current signal which reached the top at pH 7.4 and sharply decreased at higher pH values (Fig. 4c). All subsequent experiments would be carried out in pH 7.4 PBS. Furthermore, the current response gradually rose up with more Pt@CeO2 NSs applied and kept constant after 2.0 mM (Fig. 4d) which was used as the optimal concentration to construct the miRNA-21 biosensor.
3.6 Detection of miRNA-21
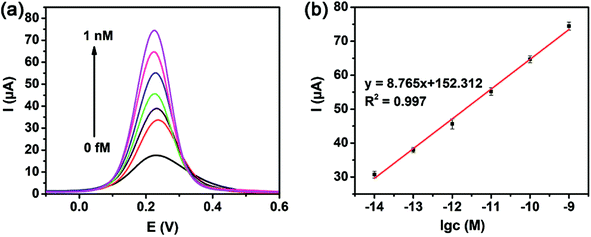
The DPV measurements of miRNA-21 at various concentrations were carried out under the optimal experimental conditions in the presence of 1 mM H2O2. As expected, the response current was found to proportionally go higher with the increasing miRNA-21 concentration from 10 fM to 1 nM (Fig. 5a), where a preferable linear relationship was achieved between response current I and the logarithm of miRNA-21 concentration (lg![[thin space (1/6-em)]](https://www.rsc.org/images/entities/char_2009.gif) c) with a linear equation fitted as I = 8.765
c) with a linear equation fitted as I = 8.765![[thin space (1/6-em)]](https://www.rsc.org/images/entities/char_2009.gif) lg
lg![[thin space (1/6-em)]](https://www.rsc.org/images/entities/char_2009.gif) c + 152.314 (R2 = 0.997) shown in Fig. 5b. The limit of detection (LOD) was calculated to be 1.41 fM for miRNA-21 analysis at a signal-to-noise ratio of 3 (S/N) (see the calculation details in the ESI†). Most importantly, the detection limit was much lower than that of some previously reported biosensors listed in Table 2. A wider detection range and ultra-low detection limit were thus provided with the constructed biosensor for miRNA-21 detection, further confirming the advanced catalytic ability of the Pt@CeO2 NSs toward H2O2 reduction and the ultra-high sensitivity of the proposed Pt@CeO2-biosensor.
c + 152.314 (R2 = 0.997) shown in Fig. 5b. The limit of detection (LOD) was calculated to be 1.41 fM for miRNA-21 analysis at a signal-to-noise ratio of 3 (S/N) (see the calculation details in the ESI†). Most importantly, the detection limit was much lower than that of some previously reported biosensors listed in Table 2. A wider detection range and ultra-low detection limit were thus provided with the constructed biosensor for miRNA-21 detection, further confirming the advanced catalytic ability of the Pt@CeO2 NSs toward H2O2 reduction and the ultra-high sensitivity of the proposed Pt@CeO2-biosensor.
| Sensor | MiRNA | Technique | Linear range | LOD | Refs |
|---|---|---|---|---|---|
| a MWCNTs refer to muti-wall carbon nanotubes; GO refers to graphene oxides; CHA refers to catalyzed hairpin assembly; MOF refers to metal–organic framework. | |||||
| S-MWCNTs | miRNA-21 | DPV | 0.1 pM to 12 nM | 0.032 pM | 14 |
| T7 exonuclease | miRNA-21 | DPV | 0.01 pM to 100 pM | 3.5 fM | 47 |
| GO/G | miRNA-21 | Chemiresistive | 10 pM to 100 nM | 14.6 pM | 48 |
| CHA | miRNA-141 | DPV | 10 fM to 10 nM | 4.5 fM | 49 |
| Cu-MOF | miRNA-3123 | SWV | 2 pM to 2 μM | 0.3 pM | 50 |
| CHA | miRNA-21 | DPV | 10 fM to 1 nM | 3.608 fM | 51 |
| Pt@CeO2 | miRNA-21 | DPV | 10 fM to 1nM | 1.41 fM | This work |
3.7 Selectivity, reproducibility and stability
Selectivity, reproducibility and stability are usually selected to evaluate the practicability of a sensor. Here, four small nucleic acid molecules with different sequences from miRNA-21 (S-RNA, T-RNA, N-RNA and miRNA-155) were chosen to assess the specificity of the proposed sensor through detecting the individual responses with and without miRNA-21 under the same condition (Fig. 6a). The proposed sensor was found respond to each interferent much less in the absence of the target miRNA-21, however, the current values produced were almost the same when each of S-RNA, T-RNA, N-RNA and miRNA-155 coexisted with miRNA-21 and in good agreement with that for the detection of miRNA-21 only, suggesting that the proposed sensing strategy was highly selective for the detection of miRNA-21.Both reproducibility and stability of the sensor are very important for the actual sample analysis. The results shown in Fig. 6b and c exhibited the excellent reproducibility and stability of this new sensor. No obvious current differences were observed among the five electrodes prepared individually and the response signal only decreased by 6.7% of the initial signal after the 8 days continuous measurement, which means that the excellent catalytic activity of noble metals was well preserved during the measurements. These results might lay a solid foundation for the practical application of the newly developed Pt@CeO2-based electrochemical sensor to detect miRNA-21 in real samples.
3.8 Analysis of miRNA-21 in human serum
In order to investigate the practical application of the Pt@CeO2-based miRNA-21 biosensor, the actual human blood samples collected from Changhai Hospital, Naval Medical University (Shanghai, China) were detected by the standard addition method. Three different concentrations of the target miRNA-21 were successively added to the 10 times diluted human serum. Table 3 shows that the recoveries of miRNA-21 in the blood samples with three different concentrations were between 98.2% and 102.6% with the RSD less than 4.56%, revealing the high accuracy, strong reliability and great potential of the sensor for analyzing the miRNA-21 level in real serum samples.| Sample | Amount added | Amount detected | Recovery (%) | RSD (%) |
|---|---|---|---|---|
| 1 | 100 pM | 101.06 pM | 98.2 | 1.79 |
| 98.43 pM | ||||
| 96.77 pM | ||||
| 2 | 1 pM | 0.98 pM | 99.6 | 4.56 |
| 0.94 pM | ||||
| 1.03 pM | ||||
| 3 | 10 fM | 9.72 fM | 102.6 | 2.68 |
| 10.44 fM | ||||
| 10.41 fM |
4. Conclusion
Taking full advantage of the excellent catalytic ability of Pt@CeO2 NSs toward H2O2, this work successfully developed a simple, ultra-sensitive and highly selective electrochemical biosensor to detect miRNA-21 in real blood samples. In the presence of the target miRNA-21, the capture probe with a hairpin structure was hybridized and opened to activate the biotin at the end of the probe, guaranteeing the specificity of the RNA sensor. Through the biotin-avidin affinity interaction, the hybridization event of the biomolecules immobilized on the electrode surface was successfully converted into the significantly amplified DPV signal in the PBS containing H2O2 resulting from the remarkable catalytic activity of Pt@CeO2 NSs toward H2O2 reduction, realizing the ultra-sensitive detection of miRNA-21. Compared with other existing biosensors, this newly developed biosensor displayed better specificity, higher reproducibility, stronger stability and lower detection limit, providing a promising and potential detection platform for the real-time testing in clinical applications.Conflicts of interest
There are no conflicts to declare.Acknowledgements
This work was financially supported by the Natural Science Foundation of Shanghai (19ZR1434800, 19ZR1461900) and Shanghai Collaborative Innovation Center of Energy Therapy for Tumors. Thanks for the human blood samples provided by Doctor Zha Ling from Department of Laboratory Diagnosis, Changhai Hospital, Naval Medical University. The authors greatly appreciated these supports.References
- J. Lu, G. Getz, E. A. Miska, E. Alvarez-Saavedra, J. Lamb, D. Peck, A. Sweet-Cordero, B. L. Ebert, R. H. Mak and A. A. Ferrando, nature, 2005, 435, 834–838 CrossRef CAS PubMed.
- H. Hwang and J. Mendell, Br. J. Cancer, 2006, 94, 776–780 CrossRef CAS PubMed.
- D. P. Bartel, Cell, 2004, 116, 281–297 CrossRef CAS PubMed.
- D. P. Bartel, Cell, 2009, 136, 215–233 CrossRef CAS PubMed.
- Y. Huang, Y. Dai, J. Yang, T. Chen, Y. Yin, M. Tang, C. Hu and L. Zhang, Ejso, 2009, 35, 1119–1123 CrossRef CAS PubMed.
- Y. Wen, M. Lin, H. Pei, N. Lu and C. Fan, Prog. Chem., 2012, 9, 1656–1664 Search PubMed.
- H. Yin, Y. Zhou, C. Chen, L. Zhu and S. Ai, Analyst, 2012, 137, 1389–1395 RSC.
- E. Hamidi-Asl, I. Palchetti, E. Hasheminejad and M. Mascini, Talanta, 2013, 115, 74–83 CrossRef CAS PubMed.
- Y. Ren, H. Deng, W. Shen and Z. Gao, Anal. Chem., 2013, 85, 4784–4789 CrossRef CAS PubMed.
- Z. Gao and Y. Peng, Biosens. Bioelectron., 2011, 26, 3768–3773 CrossRef CAS PubMed.
- M. Azimzadeh, M. Rahaie, N. Nasirizadeh, K. Ashtari and H. Naderi-Manesh, Biosens. Bioelectron., 2016, 77, 99–106 CrossRef CAS PubMed.
- A. Markou, M. Zavridou and E. S. Lianidou, Lung Cancer: Targets Ther., 2016, 7, 19 CAS.
- Y.-H. Yuan, Y.-D. Wu, B.-Z. Chi, S.-H. Wen, R.-P. Liang and J.-D. Qiu, Biosens. Bioelectron., 2017, 97, 325–331 CrossRef CAS PubMed.
- K. Deng, X. Liu, C. Li and H. Huang, Biosens. Bioelectron., 2018, 117, 168–174 CrossRef CAS PubMed.
- J. Guo, C. Yuan, Q. Yan, Q. Duan, X. Li and G. Yi, Biosens. Bioelectron., 2018, 105, 103–108 CrossRef CAS PubMed.
- J. Lu, J. Wang, X. L. Hu, E. Gyimah, S. Yakubu, K. Wang, X. Y. Wu and Z. Zhang, Anal. Chem., 2019, 91, 7353–7359 CrossRef CAS PubMed.
- C.-L. Sun, H.-H. Lee, J.-M. Yang and C.-C. Wu, Biosens. Bioelectron., 2011, 26, 3450–3455 CrossRef CAS.
- M. Wang, H. Cui, N. Hong, Q. Shu, X. Wang, Y. Hu, G. Wei, H. Fan and J. Zhang, Sens. Actuators, B, 2022, 358, 131496 CrossRef CAS.
- R. Ren, Q. Bi, R. Yuan and Y. Xiang, Sens. Actuators, B, 2020, 304, 127068 CrossRef CAS.
- S.-T. Liu, X.-P. Liu, J.-S. Chen, C.-j. Mao and B.-K. Jin, Biosens. Bioelectron., 2020, 165, 112416 CrossRef CAS PubMed.
- M. Li, Y. Liu, S. Ding, A. Zhu and G. Shi, Analyst, 2014, 139, 5964–5969 RSC.
- Z. G. Zhang, Y. L. Cong, Y. C. Huang and X. Du, Micromachines, 2019, 10, 397 CrossRef.
- X. Pang, J. Li, Y. Zhao, D. Wu, Y. Zhang, B. Du, H. Ma and Q. Wei, ACS Appl. Mater. Interfaces, 2015, 7, 19260–19267 CrossRef CAS PubMed.
- L. Yang, W. Zhu, X. Ren, M. S. Khan, Y. Zhang, B. Du and Q. Wei, Biosens. Bioelectron., 2017, 91, 842–848 CrossRef CAS PubMed.
- Y. Lai, L. Wang, Y. Liu, G. Yang, C. Tang, Y. Deng and S. Li, J. Biomed. Nanotechnol., 2018, 14, 44–65 CrossRef CAS PubMed.
- S. Liu, Z. Yang, Y. Chang, Y. Chai and R. Yuan, Biosens. Bioelectron., 2018, 119, 170–175 CrossRef CAS PubMed.
- Q. Xiao, J. Li, X. Jin, Y. Liu and S. Huang, Sens. Actuators, B, 2019, 297, 126740 CrossRef.
- C. L. Zhang, D. Li, D. W. Li, K. Wen, X. D. Yang and Y. Zhu, Analyst, 2019, 144, 3817–3825 RSC.
- A. Di Vito, E. Reitano, L. Poggi and M. Iaboni, Anal. Biochem., 2020, 593, 113590 CrossRef CAS PubMed.
- P. Gillespie, S. Ladame and D. O'Hare, Analyst, 2019, 144, 114–129 RSC.
- K. Dhara and R. M. Debiprosad, Anal. Biochem., 2019, 586, 113415 CrossRef CAS PubMed.
- J. Bao, C. J. Hou, Y. A. Zhao, X. T. Geng, M. Samalo, H. S. Yang, M. H. Bian and D. Q. Huo, Talanta, 2019, 196, 329–336 CrossRef CAS.
- Y. D. Wu, Y. Li, H. X. Han, C. S. Zhao and X. R. Zhang, Anal. Biochem., 2019, 564, 16–20 CrossRef PubMed.
- S. Abd Rahman, N. Ariffin, N. A. Yusof, J. Abdullah, F. Mohammad, Z. Ahmad Zubir and N. M. A. Nik Abd Aziz, Sensors, 2017, 17, 1537 CrossRef PubMed.
- J. Peng, Q. Huang, Y. Liu, P. Liu and C. Zhang, Sens. Actuators, B, 2019, 294, 157–165 CrossRef CAS.
- K. Zhang, H. Dong, W. Dai, X. Meng, H. Lu, T. Wu and X. Zhang, Anal. Chem., 2017, 89, 648–655 CrossRef CAS PubMed.
- M. U. A. Prathap, B. Kaur and R. Srivastava, Chem. Rec., 2019, 19, 883–907 CrossRef PubMed.
- Q. Zhou and D. Tang, Biochem. Eng. J., 2018, 140, 9–16 CrossRef CAS.
- H. Chen, Z. Ding, J. Yan, M. Hou and Y. Bi, Catal. Commun., 2021, 149, 106206 CrossRef CAS.
- W. Li, Y. Zhu, W. Guo, H. Xu, C. Gong and G. Xue, J. Chem. Sci., 2022, 134, 38 CrossRef CAS.
- Q. Jiang, R. Qian, T. Shen and S. Tong, Water Sci. Technol., 2022, 85, 1673–1687 CrossRef PubMed.
- Q. Yang, D. Gao, C. Li, S. Cao, S. Li, H. Zhao, C. Li, G. Zheng and G. Chen, Fuel, 2022, 311, 122584 CrossRef CAS.
- C. Karaman, O. Karaman, B. B. Yola, İ. Ülker, N. Atar and M. L. Yola, New J. Chem., 2021, 45, 11222–11233 RSC.
- C. Karaman, O. Karaman, N. Atar and M. L. Yola, Microchim. Acta, 2021, 188, 1–15 CrossRef.
- R. Monsef and M. Salavati-Niasari, J. Colloid Interface Sci., 2022, 613, 1–14 CrossRef CAS PubMed.
- Z. Li, W. Yang, L. Xie, Y. Li, Y. Liu, Y. Sun, Y. Bu, X. Mi, S. Zhan and W. Hu, Appl. Surf. Sci., 2021, 549, 149262 CrossRef CAS.
- Z. Chen, Y. Xie, W. Huang, C. Qin, A. Yu and G. Lai, Nanoscale, 2019, 11, 11262–11269 RSC.
- C.-H. Huang, T.-T. Huang, C.-H. Chiang, W.-T. Huang and Y.-T. Lin, Biosens. Bioelectron., 2020, 164, 112320 CrossRef CAS.
- L. Jiang, Y. Yang, Y. Lin, Z. Chen, C. Xing, C. Lu, H. Yang and S. Zhang, Analyst, 2020, 145, 3353–3358 RSC.
- Y. Sun, H. Jin, X. Jiang and R. Gui, Sens. Actuators, B, 2020, 309, 127777 CrossRef CAS.
- W. Zhang, H. Xu, X. Zhao, X. Tang, S. Yang, L. Yu, S. Zhao, K. Chang and M. Chen, Anal. Chim. Acta, 2020, 1122, 39–47 CrossRef CAS PubMed.
Footnotes |
| † Electronic supplementary information (ESI) available. See https://doi.org/10.1039/d2ra01047j |
| ‡ Chen P., Jiang L., Xie X. and Sun D. contributed to this work equally as co-first authors. |
| This journal is © The Royal Society of Chemistry 2022 |

