 Open Access Article
Oxidative dehalogenation of trichlorophenol catalyzed by a promiscuous artificial heme-enzyme†
Gerardo Zambranoa,
Alina Sekretareva b,
Daniele D'Alonzo
 a,
Linda Leone
 a,
Vincenzo Pavone
 a,
Angela Lombardi
 a and
Flavia Nastri
 *a
*a
aDepartment of Chemical Sciences, University of Napoli Federico II, Via Cintia, 80126 Napoli, Italy. E-mail: flavia.nastri@unina.it; Fax: +39-081674090; Tel: +39-081674419
bDepartment of Chemistry – Ångström, Uppsala University, Lägerhyddsvägen 1, 75120 Uppsala, Sweden
First published on 4th May 2022
Abstract
The miniaturized metalloenzyme Fe(III)-mimochrome VI*a (Fe(III)-MC6*a) acts as an excellent biocatalyst in the H2O2-mediated oxidative dehalogenation of the well-known pesticide and biocide 2,4,6-trichlorophenol (TCP). The artificial enzyme can oxidize TCP with a catalytic efficiency (kcat/KTCPm = 150![[thin space (1/6-em)]](https://www.rsc.org/images/entities/char_2009.gif) 000 mM−1 s−1) up to 1500-fold higher than the most active natural metalloenzyme horseradish peroxidase (HRP). UV-visible and EPR spectroscopies were used to provide indications of the catalytic mechanism. One equivalent of H2O2 fully converts Fe(III)-MC6*a into the oxoferryl-porphyrin radical cation intermediate [(Fe(IV)
000 mM−1 s−1) up to 1500-fold higher than the most active natural metalloenzyme horseradish peroxidase (HRP). UV-visible and EPR spectroscopies were used to provide indications of the catalytic mechanism. One equivalent of H2O2 fully converts Fe(III)-MC6*a into the oxoferryl-porphyrin radical cation intermediate [(Fe(IV)![[double bond, length as m-dash]](https://www.rsc.org/images/entities/char_e001.gif) O)por˙+], similarly to peroxidase compound I (Cpd I). Addition of TCP to Cpd I rapidly leads to the formation of the corresponding quinone, while Cpd I decays back to the ferric resting state in the absence of substrate. EPR data suggest a catalytic mechanism involving two consecutive one-electron reactions. All results highlight the value of the miniaturization strategy for the development of chemically stable, highly efficient artificial metalloenzymes as powerful catalysts for the oxidative degradation of toxic pollutants.
O)por˙+], similarly to peroxidase compound I (Cpd I). Addition of TCP to Cpd I rapidly leads to the formation of the corresponding quinone, while Cpd I decays back to the ferric resting state in the absence of substrate. EPR data suggest a catalytic mechanism involving two consecutive one-electron reactions. All results highlight the value of the miniaturization strategy for the development of chemically stable, highly efficient artificial metalloenzymes as powerful catalysts for the oxidative degradation of toxic pollutants.
Introduction
The need for sustainable technologies to meet demanding goals, such as the removal of environmental pollutants, is driving the scientific community to find cutting-edge solutions.1,2 Nature represents an outstanding guide for its ability to perform complicated chemical processes, using impressive catalytic systems, based on enzyme arrays. Enzymes are the benchmark of sustainability, as they are biocompatible, biodegradable and come from renewable resources.1 Among them, metal-containing oxidoreductases have the potential to be very useful tools for sustainable organic pollutant degradation,3 as they use clean oxidants, such as dioxygen or hydrogen peroxide,4 with no reaction by-products. Borrowing the skill of these enzymes is strongly dependent on our ability to develop Nature-inspired catalysts, efficiently working apart from cell regulatory constraints.5A variety of strategies have been proved very powerful for improving the properties of native metalloenzymes.6–14 They span de novo peptide and protein design, redesign of native scaffolds, design through miniaturization, and supramolecular metalloprotein design.15 These strategies have provided catalysts accurately designed for substrate specificity, enantioselectivity, stability under process conditions and tolerance to organic solvents. The metal cofactor is mainly enclosed within a protein scaffold endowed with all the structural and functional details needed for a given reactivity.
The design of a single scaffold, suited to host different metal ions, there by enabling to explore a variety of different chemistries and applications, would be a highly desirable, sustainable and cost-effective goal. Further, it would be very challenging to build up a catalyst endowed with substrate promiscuity, for any given metal ion. Modulation of hemeprotein activities is a clear example of how Nature wisely masters these tasks.16 The activity of the heme cofactor is modulated in natural proteins at various levels, by modifying the nature of the metal centre, the cofactor identity, such as the number of substituents and saturation, and by modification of second-shell interactions from the surrounding protein.16
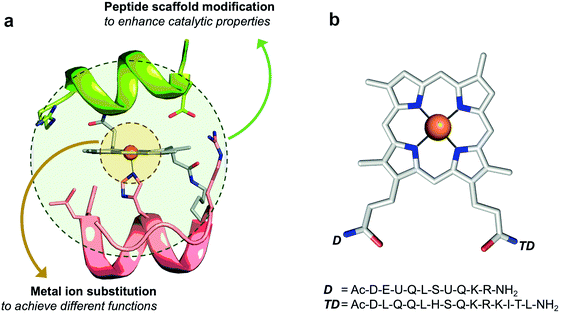
Inspired by Nature, we attempted to catch the technology of heme catalysis modulation into small synthetic systems. To this end, we approached the design of artificial heme-proteins through a miniaturization strategy.16 We developed simple yet functional synthetic molecules, named mimochromes (MCs), which respond to metal ion replacement and non-covalent modulation of the environment, similarly to natural heme-proteins.16–18 The key to this success has been the design of a proper protein scaffold, which bears all the information to tune metalloporphyrin behaviors, including catalytic promiscuity. Mimochromes consist of two small helical peptide chains covalently linked to the propionic groups of deuteroporphyrin IX (DPIX) (Fig. 1a). The peptide scaffold has a globin fold, as it was patterned after the F helix of the human deoxyhemoglobin α-chain. Symmetrization of a small (Leu88 to Leu95) F helix amphipathic fragment and design of non-covalent interactions afforded bis-His derivatives (MC4 among others),19 whose iron complex behaves as a cytochrome b,20 with redox potential being modulated by precise amino acid substitutions.16 Symmetry removal allowed the design of pentacoordinate complexes behaving like peroxidases (MC6 and MC6*).21,22 The last derivative, MC6*a (Fig. 1b), shows unprecedented performances, being able to tune the reactivity of different metal ions. Indeed, when housing iron, MC6*a acts as a highly active peroxidase able to oxidize ABTS with uncommon efficiency.23 The insertion of manganese switches MC6*a into an efficient catalyst for key synthetic transformations, such as the H2O2-mediated sulfoxidation of methyl phenyl thioethers,24 and the selective oxidation of indole at its C3 position.25 Finally, in the presence of cobalt, MC6*a becomes a proficient hydrogen evolution catalyst.26,27
These interesting results prompted us to exploit MC6*a artificial enzyme toward further applications. FeMC6*a can be conveniently applied in the construction of functional nanomaterials28 and biosensor technologies, acting as luminescence-based sensor for hydrogen peroxide detection.29
To evaluate the potential of FeMC6*a for pollutant degradation, we assayed its reactivity in the oxidative dehalogenation of 2,4,6-trichlorophenol (TCP). TCP remains one of the most prominent examples of halogenated phenols, largely used in the past as pesticides or as biocides in wood preservation.30 Although the use of halophenols has been prohibited, they can still be found in soils and waters as recalcitrant pollutants.31–34 In such contest, the enzymatic dehalogenation of the highly toxic TCP,30,35 has received considerable attention over the past years,36–40 in view of a potential role of this reaction in bioremediation strategies.31,41 Several heme-containing natural peroxidases, including Amphitrite ornata dehaloperoxidase (DHP),42 Caldariomyces fumago chloroperoxidase (CCPO)37 and HRP,38 are able to catalyze the oxidative dehalogenation of TCP into the corresponding 2,6-dichlorobenzoquinone (DCBQ), according to Scheme 1.5 To fully exploit the potential of these natural enzymes in the field of pollutants biodegradation, some challenging issue should be achieved, such as reusability, stability in non-aqueous media and immobilization on solid supports, to allow catalyst recycling and easy separation from the reaction media.
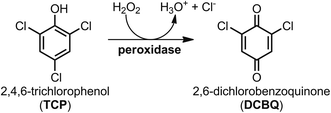 | ||
| Scheme 1 Peroxidase-catalyzed oxidative dehalogenation of 2,4,6-trichlorophenol (TCP) into 2,6-dichlorobenzoquinone (DCBQ). | ||
Herein we report the results on the Fe-MC6*a catalyzed oxidative dehalogenation of TCP. EPR and UV-vis spectroscopies proved that H2O2 converts Fe(III)-MC6*a into the oxoferryl-porphyrin radical cation intermediate [(Fe(IV)![[double bond, length as m-dash]](https://www.rsc.org/images/entities/char_e001.gif) O)por˙+], similar to peroxidase compound I (Cpd I), and that this intermediate is involved in TCP transformation. Notably, analysis of the kinetic data reveals that Fe(III)-MC6*a is the most active catalyst for TCP dehalogenation known to date, to the best of our knowledge, thus opening important perspectives for its application in the degradation of organic pollutants.
O)por˙+], similar to peroxidase compound I (Cpd I), and that this intermediate is involved in TCP transformation. Notably, analysis of the kinetic data reveals that Fe(III)-MC6*a is the most active catalyst for TCP dehalogenation known to date, to the best of our knowledge, thus opening important perspectives for its application in the degradation of organic pollutants.
Results and discussion
H2O2 activation by Fe(III)-MC6*a and Cpd I formation
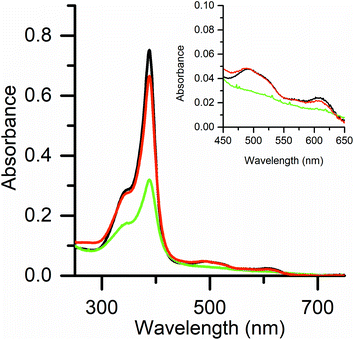
UV-vis and EPR spectroscopies were used to investigate the reaction of Fe(III)-MC6*a and hydrogen peroxide, without any reducing substrate. As previously reported,23 UV/vis spectral data of Fe(III)-MC6*a resting state (Fig. 2, black line) are indicative of a six-coordinate His–H2O species in a high spin state. Addition of 1 equivalent of H2O2 caused a 60% decrease in the Soret band intensity over 2 min (no λ shifts), while α/β bands flattened (Fig. 2, green line). These spectral changes are typical for the conversion of the resting ferric state into an oxoferryl-porphyrin radical cation intermediate [(Fe(IV)![[double bond, length as m-dash]](https://www.rsc.org/images/entities/char_e001.gif) O)por˙+], similar to Cpd I generated in the catalytic cycle of peroxidases.43,44 This intermediate spontaneously decays back to the ferric state without any detectable compound II (Cpd II) species (Fig. 2, red line). The observed behavior suggests that the decay of Cpd II to ferric is faster than the decay of Cpd I to Cpd II.
O)por˙+], similar to Cpd I generated in the catalytic cycle of peroxidases.43,44 This intermediate spontaneously decays back to the ferric state without any detectable compound II (Cpd II) species (Fig. 2, red line). The observed behavior suggests that the decay of Cpd II to ferric is faster than the decay of Cpd I to Cpd II.
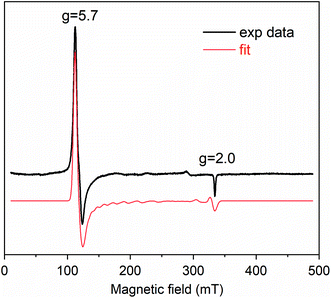
Cpd I formation was also ascertained by EPR spectroscopy. Fig. 3 reports the EPR spectrum of Fe(III)-MC6*a in 50 mM phosphate buffer (pH 6.5) with 50% TFE (v/v) at 6 K. In the resting state, Fe(III)-MC6*a shows two main signals at geff⊥ ≈ 5.7 and geff∥ ≈ 2, which are characteristic of pentacoordinate heme iron enzymes (S = 5/2) in the high spin state.45 For Kramers doublets in the weak field limit (D ≫ 0.3 cm−1), only intra-doublet transitions are possible, and each transition can be described by an effective S = 1/2. At low temperatures, the lowest Kramers doublet is mostly populated, and only transitions with ms = ±1/2 are observed. Using the reported procedure for simulating high-spin Kramer systems,46 the real values of the electronic g tensor can be obtained. The simulated spectrum is insensitive to the absolute value of the zero-field splitting, D, but is highly sensitive to rhombicity (η = E/D) and best described by η = 0.007 and axial symmetric electronic g tensor with gx,y = 2.05 and gz = 2.20. Thus, Fe(III)-MC6*a in the resting state can be described as a single high-spin species with tetragonal symmetry and almost no rhombic distortion, consistent with the schematic structure in Scheme 2.
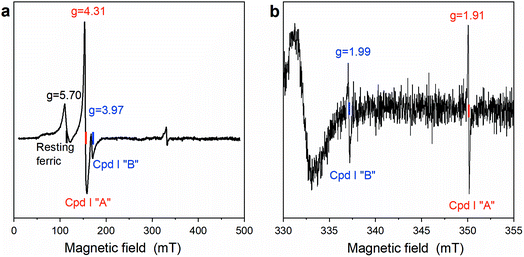
To trap and characterize any intermediate generated upon reaction of Fe(III)-MC6*a with H2O2, samples for EPR analysis were prepared by freeze-quenching the reaction mixtures in liquid N2. The EPR spectrum obtained after addition of one equivalent of H2O2 to Fe(III)-MC6*a and rapid freezing is shown in Fig. 4. A significant decrease in the intensity of the high-spin resting state signal (g ≈ 5.7) and concurrent appearance of two new signals at geff = 4.31 and geff = 3.97 were observed (Fig. 4a). Further, two radical-type signals at g ≈ 2 (1.99 and 1.91) were detected (Fig. 4b). These signals, with effective g-values of ∼4 (geff⊥) and ∼2 (geff∥), are consistent with the presence of an oxoferryl-porphyrin radical cation intermediate [(Fe(IV)![[double bond, length as m-dash]](https://www.rsc.org/images/entities/char_e001.gif) O)por˙+], namely Cpd I, as previously reported for peroxidases and heme model complexes.47–49
O)por˙+], namely Cpd I, as previously reported for peroxidases and heme model complexes.47–49
The EPR spectra of Cpd I are interpreted through the spin-coupling model developed by Schulz et al.48 According to this model, the S = 1 oxoferryl moiety and the S′ = 1/2 porphyrin π-cation radical are weakly exchange coupled:
| Hex = JSS′ | (1) |
![[double bond, length as m-dash]](https://www.rsc.org/images/entities/char_e001.gif) O]2+ and the porphyrin π-cation radical (por+˙) from ferromagnetic to antiferromagnetic, is attributed to lowering the four-fold symmetry provided by the coordination of iron by porphyrin.47 Higher values of |J|/D for Cpd I “A” and Cpd I “B” compared to HRP and ascorbate oxidase, suggest higher symmetry of Cpd I in Fe(III)-MC6*a. This observation is consistent with the absence of rhombic symmetry distortion observed in the parental high-spin ferric state, which is typically detected in HRP and ascorbate peroxidase.48,51 This high symmetry of the heme provides a strong ferromagnetic exchange between the oxoferryl moiety and the por+˙ radical.
O]2+ and the porphyrin π-cation radical (por+˙) from ferromagnetic to antiferromagnetic, is attributed to lowering the four-fold symmetry provided by the coordination of iron by porphyrin.47 Higher values of |J|/D for Cpd I “A” and Cpd I “B” compared to HRP and ascorbate oxidase, suggest higher symmetry of Cpd I in Fe(III)-MC6*a. This observation is consistent with the absence of rhombic symmetry distortion observed in the parental high-spin ferric state, which is typically detected in HRP and ascorbate peroxidase.48,51 This high symmetry of the heme provides a strong ferromagnetic exchange between the oxoferryl moiety and the por+˙ radical.
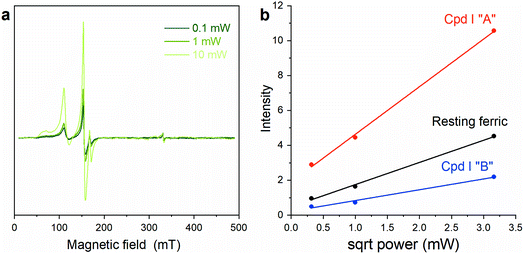
To further confirm the existence of two different Cpd I species, power saturation measurements were performed. Signals corresponding to Cpd I “A” and Cpd I “B” showed different power saturation behaviors (Fig. 5), thus supporting the hypothesis that the reaction of Fe(III)-MC6*a with H2O2 results in two Cpd I species with slightly different configurations, giving two distinct radical signals. Double-integration of the EPR spectra at different powers (Fig. 5a) gives similar ratios of Cpd I “A” to Cpd I “B” of ∼3![[thin space (1/6-em)]](https://www.rsc.org/images/entities/char_2009.gif) :
:![[thin space (1/6-em)]](https://www.rsc.org/images/entities/char_2009.gif) 2.
2.
These two spectroscopically distinct Cpd I “A” and “B” species may presumably arise from H2O2 activation catalyzed by two different conformers of the Fe(III)-MC6*a resting state. This finding is not surprising as MC-iron complexes likely occur into multiple configurational/conformational states,52 corresponding to regioisomers and/or diastereomers (see Fig. S1†). At ambient temperature, Fe(III)-MC6*a resting state is expected to occur as a dynamic ensemble of conformers, thus the EPR spectrum is the average of all the possible states. Shock-freezing of the solution after H2O2 addition, as performed for EPR characterization, affords two distinguishable Cpd I isomers.
TCP oxidative dehalogenation by Fe(III)-MC6*a
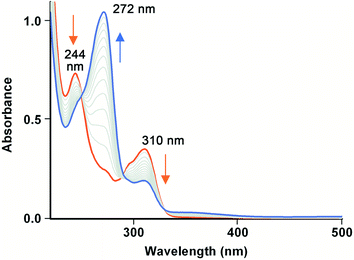
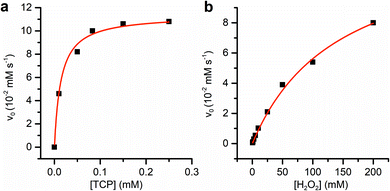
Fe(III)-MC6*a-catalyzed oxidative dehalogenation of TCP was assayed under the optimal experimental conditions previously determined for peroxidase and peroxygenase activity.23,24 Upon addition of hydrogen peroxide (400 μM) to a buffered solution (phosphate buffer 50 mM, pH 6.5, 50% (v/v) 2,2,2-trifluoroethanol (TFE)) containing Fe(III)-MC6*a (0.1 μM) and TCP (100 μM), a rapid decrease in TCP absorption maxima (244 and 310 nm) was observed (Fig. 6), while a concurrent increase of the band at 272 nm, characteristic of 2,6-dichloro-1,4-benzoquinone (DCBQ), was detected. No reaction progress was observed for the uncatalyzed dehalogenation carried out without the catalyst in the presence of TFE and H2O2 over the same timescales, thus proving the involvement of Fe(III)-MC6*a in driving TCP conversion to DCBQ.GC-MS analysis of the reaction mixture confirmed the formation of DCBQ as the main dehalogenation product (Fig. S2†). The mass spectrum of DCBQ is characterized by a main peak at m/z 176 (molecular ion peak or [M]˙+), and an isotopic pattern of two chlorine atoms at m/z 178 and 180 (Fig. S3b†). Next, the catalytic parameters for TCP dehalogenation catalyzed by Fe(III)-MC6*a were determined in phosphate buffer pH 6.5 with 50% TFE v/v (Fig. 7).
Table 1 reports the steady-state kinetic parameters for the H2O2-dependent TCP dehalogenation catalyzed by Fe(III)-MC6*a. For comparison, kinetic data for HRP, DHP and the most representative artificial metalloenzymes, namely CTM C45, F43Y/H64D Mb and A15C/H64D Ngb, obtained by de novo design or by redesign of native protein scaffolds, are also reported.36,40,53
| Enzyme | KTCPm (mM) | (mM) | kcat (s−1) | kcat/KTCPm (mM−1 s−1) | |
|---|---|---|---|---|---|
| Experimental conditions.a [Enzyme] = 6.7 × 10⁻⁸ M; 50 mM phosphate buffer, pH 6.5 with 50% (v/v) TFE.b [Enzyme] = 6.7 × 10⁻⁸ M; 50 mM phosphate buffer, pH 6.5.c [Enzyme] = 2.4 × 10⁻⁶ M; 100 mM phosphate buffer pH 7.0.d [Enzyme] = 2 × 10⁻⁷ M; 100 mM phosphate buffer pH 7.0.e [Enzyme] = 1 × 10⁻⁶ M; 50 mM phosphate buffer, pH 7.0.f [Enzyme] = 2.5 × 10⁻⁶ M; 100 mM potassium phosphate buffer pH 7.0.g [Enzyme] = 1 × 10⁻⁷ M; 100 mM KCl, 20 mM N-cyclohexyl-2-aminoethanesulfonic acid buffer, pH 8.58. N.R.: not reported. | |||||
| 1 | Fe(III)-MC6*aa | 0.016 ± 0.002 | 120 ± 10 | 2400 ± 80 | 150![[thin space (1/6-em)]](https://www.rsc.org/images/entities/char_2009.gif) 000 000 |
| 2 | Fe(III)-MC6*ab | 0.100 ± 0.0210 | 94.4 ± 8.2 | 70 ± 6 | 700 |
| 3 | DHP A54,c | 2.07 | 0.335 | 13.67 | 6.60 |
| 4 | DHP B54,c | 0.685 | 0.165 | 25.72 | 37.5 |
| 5 | HRP54,d | 5.40 | 0.050 | 571.3 | 105.8 |
| 6 | F43Y/H64D Mb40,e | 0.0035 ± 0.0003 | N.R. | 27.4 ± 0.9 | 7828 |
| 7 | A15C/H64D Ngb53,f | 0.13 ± 0.01 | N.R. | 43.85 ± 0.62 | 340 |
| 8 | CTM C4536,g | 0.012 | N.R. | 0.50 | 41.7 |
Inspection of Table 1 reveals that the turnover frequency (kcat) of Fe (III)-MC6*a (2400 s−1, Table 1, entry 1) is higher than any other metalloenzyme so far reported. Particularly, this value is 4-fold higher respect to HRP54 and almost 90-fold higher than F43Y/H64D Mb40 (Table 1, entries 5 and 6). Moreover, the Michaelis–Menten constant value for TCP (KTCPm = 16 μM) is 338-fold lower than in HRP and only about 4-fold higher than F43Y/H64D Mb. Catalytic efficiencies based on TCP were then calculated. Under its optimal conditions (Table 1, entry 1), Fe(III)-MC6*a is to date the heme-enzyme with the highest catalytic efficiency in TCP oxidation (kcat/KTCPm: 150![[thin space (1/6-em)]](https://www.rsc.org/images/entities/char_2009.gif) 000 mM−1 s−1), since kcat/Km value is about 19-fold and 1400-fold higher than of F43Y/H64D Mb and HRP, respectively. For better clarifying the role of the cosolvent, kinetic parameters were also measured in the absence of TFE (Table 1, entry 2). An increased KTCPm value (100 μM) together with a decreased K (70 s−1) were observed, causing a drop in the catalytic efficiency (down to 200-fold, Table 1). It should be underlined that even in this case FeMC6*a still showed relevant catalytic efficiency (kcat/KTCPm = 700 mM−1 s−1), which is lower only respect to F43Y/H64D Mb efficiency (kcat/KTCPm = 7828.57 mM−1 s−1; Table 1, entry 6).
000 mM−1 s−1), since kcat/Km value is about 19-fold and 1400-fold higher than of F43Y/H64D Mb and HRP, respectively. For better clarifying the role of the cosolvent, kinetic parameters were also measured in the absence of TFE (Table 1, entry 2). An increased KTCPm value (100 μM) together with a decreased K (70 s−1) were observed, causing a drop in the catalytic efficiency (down to 200-fold, Table 1). It should be underlined that even in this case FeMC6*a still showed relevant catalytic efficiency (kcat/KTCPm = 700 mM−1 s−1), which is lower only respect to F43Y/H64D Mb efficiency (kcat/KTCPm = 7828.57 mM−1 s−1; Table 1, entry 6).
This result confirmed the importance of helix folding on the catalytic activity, as already observed for other Fe(III)-MC6*a catalyzed peroxidase and peroxygenase reactions,23,25 and are also in agreement with our previous findings.16,21,22 We have demonstrated that in all MCs secondary structures stabilization, induced by TFE, facilitates inter-chain and peptide–heme interactions, thus favoring the formation of the sandwiched tertiary structure.22 In particular, TFE-dependent peptide structures were nicely correlated to their catalytic performances, thus demonstrating that the correct folding of both chains is necessary for reactivity.22
For TCP transformation, the sandwiched structure plays a positive role on both substrates binding (Km) and conversion (kcat). Further, it exerts a protective role toward heme bleaching as Fe(III)-MC6*a promotes a high conversion of TCP. The determination of the turnover number (TON), measured by GC-MS analysis of the reaction mixture, resulted in the conversion of 3850 equivalents of TCP, requiring a Fe(III)-MC6*a catalyst loading as low as 6.7 × 10⁻⁸ M (see Table S1†).
The favorable effect of TFE in modulating peroxidase activity, extensively studied by us over the years on MCs,16,21–23,25 has been very recently also reported for the promiscuous de novo designed peroxidase C45.55,56 All together these results strongly delineate the principle that the stabilization of designed enzyme, by helix-inducing cosolvent addition, is a suitable route to tune activity.
Mechanistic insights
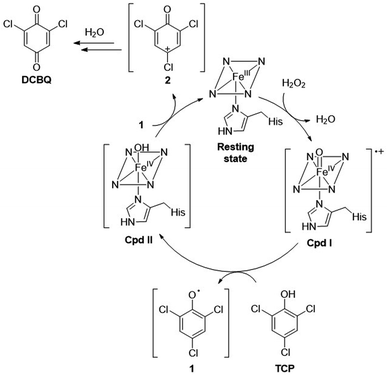
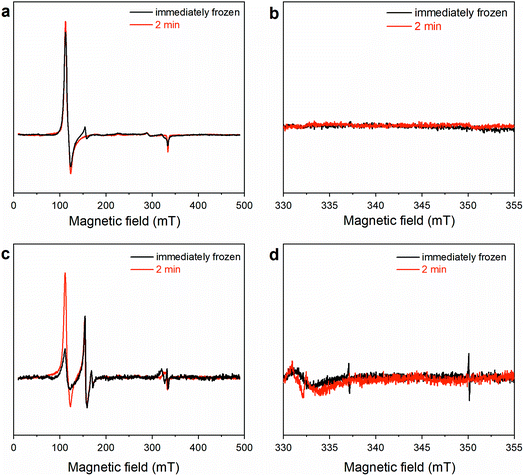
It is widely reported that the dehalogenation reaction catalyzed by natural heme-peroxidases occurs via a two-step, single-electron oxidation pathway (Scheme 2).37,38,42 Accordingly, TCP undergoes the first one-electron oxidation mediated by Cpd I, releasing the phenoxy radical species 1. Subsequently, the second one-electron oxidation yields a positively charged dienone 2, which is readily converted into DCBQ upon reaction with a water molecule.In order to ascertain whether TCP dehalogenation by Fe(III)-MC6*a occurs through a similar pathway (Scheme 2), investigation of the catalytic mechanism by EPR spectroscopy was performed. EPR spectra of the reaction mixture of Fe(III)-MC6*a in the presence of 1 equivalent of H2O2 and either 1 (Fig. 8a and b) or 0.5 (Fig. 8c and d) equivalents of TCP were collected at different quenching times. Spectra collected on the immediately frozen stoichiometric (1![[thin space (1/6-em)]](https://www.rsc.org/images/entities/char_2009.gif) :
:![[thin space (1/6-em)]](https://www.rsc.org/images/entities/char_2009.gif) 1
1![[thin space (1/6-em)]](https://www.rsc.org/images/entities/char_2009.gif) :
:![[thin space (1/6-em)]](https://www.rsc.org/images/entities/char_2009.gif) 1 of Fe(III)-MC6*a
1 of Fe(III)-MC6*a![[thin space (1/6-em)]](https://www.rsc.org/images/entities/char_2009.gif) :
:![[thin space (1/6-em)]](https://www.rsc.org/images/entities/char_2009.gif) H2O2
H2O2![[thin space (1/6-em)]](https://www.rsc.org/images/entities/char_2009.gif) :
:![[thin space (1/6-em)]](https://www.rsc.org/images/entities/char_2009.gif) TCP) reaction mixture (Fig. 8a and b, black lines) demonstrate a very low-intensity signal of the intermediate at geff = 4.31 and a high-intensity signal of the resting Fe(III)-MC6*a (geff⊥ ≈ 5.7). The spectra of the samples frozen after 2 min (Fig. 8a and b, red lines) fully resemble the spectrum of the resting Fe(III)-MC6*a (Fig. 4).
TCP) reaction mixture (Fig. 8a and b, black lines) demonstrate a very low-intensity signal of the intermediate at geff = 4.31 and a high-intensity signal of the resting Fe(III)-MC6*a (geff⊥ ≈ 5.7). The spectra of the samples frozen after 2 min (Fig. 8a and b, red lines) fully resemble the spectrum of the resting Fe(III)-MC6*a (Fig. 4).
These results suggest that Fe(III)-MC6*a completely cycled-back after the reaction in less than 2 min, which is consistent with the ultrafast kinetics of Fe(III)-MC6*a reaction with TCP (Table 1). This finding is also in agreement with the experiments performed by UV-vis spectroscopy. Indeed, addition of TCP to the stoichiometric mixture of Fe(III)-MC6*a and H2O2 caused direct conversion of Cpd I back to the resting state, without any detectable Cpd II formation.
A different behavior was observed in spectra collected by sub-stoichiometric addition of the reducing substrate (sample with 1![[thin space (1/6-em)]](https://www.rsc.org/images/entities/char_2009.gif) :
:![[thin space (1/6-em)]](https://www.rsc.org/images/entities/char_2009.gif) 1
1![[thin space (1/6-em)]](https://www.rsc.org/images/entities/char_2009.gif) :
:![[thin space (1/6-em)]](https://www.rsc.org/images/entities/char_2009.gif) 0.5 of Fe(III)-MC6*a
0.5 of Fe(III)-MC6*a![[thin space (1/6-em)]](https://www.rsc.org/images/entities/char_2009.gif) :
:![[thin space (1/6-em)]](https://www.rsc.org/images/entities/char_2009.gif) H2O2
H2O2![[thin space (1/6-em)]](https://www.rsc.org/images/entities/char_2009.gif) :
:![[thin space (1/6-em)]](https://www.rsc.org/images/entities/char_2009.gif) TCP, Fig. 8c and d, black lines). Interestingly, the immediately frozen sample showed signals corresponding to Cpd I “A” and “B” species, and a concomitant decrease of the high-spin ferric signal of the enzyme. In the sample frozen after 2 min (Fig. 8c and d, red lines), the two signals at geff∥ ≈ 2 (1.99 and 1.91) were not detected, while signals at geff⊥ ∼ 4 (4.31 and 3.97) were well resolved. This can be explained by quenching of the radical signal of Cpd I (0.5 eq., which did not react with TCP) by TCP radical (0.5 eq. should be formed).
TCP, Fig. 8c and d, black lines). Interestingly, the immediately frozen sample showed signals corresponding to Cpd I “A” and “B” species, and a concomitant decrease of the high-spin ferric signal of the enzyme. In the sample frozen after 2 min (Fig. 8c and d, red lines), the two signals at geff∥ ≈ 2 (1.99 and 1.91) were not detected, while signals at geff⊥ ∼ 4 (4.31 and 3.97) were well resolved. This can be explained by quenching of the radical signal of Cpd I (0.5 eq., which did not react with TCP) by TCP radical (0.5 eq. should be formed).
Notably, the intensity of the resting state signal (geff⊥ ≈ 5.7) in the EPR spectrum of the sample frozen after 2 min increased compared to its intensity in the sample frozen immediately, while both Cpd I “A” and “B” (geff⊥ ≈ 4.31 and 3.97, respectively) signal intensities were almost unchanged (Fig. 8c, red line vs. black line). This experimental observation suggests the conversion of Cpd I into a putative EPR-silent Cpd II intermediate, corresponding to the ferryl heme lacking the porphyrin radical (Scheme 2). The total spin count of the sample with additions of 1 eq. H2O2 and 0.5 eq. TCP is approximately half of the resting state, indicating that half of the sample is in an EPR-silent state.
Conclusions
Fe(III)-MC6*a represents an excellent biocatalyst in the oxidative dehalogenation of 2,4,6-trichlorophenol (TCP). Analysis of the kinetic parameters reveal that, under optimum conditions, Fe-MC6*a owns, to the best of our knowledge, the highest activity for this reaction, with a catalytic efficiency (kcat/KTCPm = 150![[thin space (1/6-em)]](https://www.rsc.org/images/entities/char_2009.gif) 000 mM−1 s−1) 1400-fold higher respect to the most active native metalloenzyme, HRP. Interestingly, higher efficiency is observed in the presence of TFE as cosolvent. Indeed, TFE is usually required for driving MCs helical folding, thus enhancing their catalytic performances. The use of fluorinated alcohol as TFE, recently considered as a recoverable green solvent,57 may expand the applicability of the Fe(III)-MC6*a/H2O2 system for oxidative dehalogenation in non-aqueous media. However, even considering the reaction in the absence of TFE, its catalytic performances still position Fe(III)-MC6*a among the most active heme-enzymes for TCP oxidative dehalogenation. All these results corroborate the potential applications of Fe(III)-MC6*a in bioremediation strategies aimed at pollutants degradation.
000 mM−1 s−1) 1400-fold higher respect to the most active native metalloenzyme, HRP. Interestingly, higher efficiency is observed in the presence of TFE as cosolvent. Indeed, TFE is usually required for driving MCs helical folding, thus enhancing their catalytic performances. The use of fluorinated alcohol as TFE, recently considered as a recoverable green solvent,57 may expand the applicability of the Fe(III)-MC6*a/H2O2 system for oxidative dehalogenation in non-aqueous media. However, even considering the reaction in the absence of TFE, its catalytic performances still position Fe(III)-MC6*a among the most active heme-enzymes for TCP oxidative dehalogenation. All these results corroborate the potential applications of Fe(III)-MC6*a in bioremediation strategies aimed at pollutants degradation.
Materials and methods
Materials
All solvents and TFA (trifluoroacetic acid) were supplied by Romil. 2,4,6-Trichlorophenol (TCP) was purchased from Merck. TFE was purchased from Romil. All buffer solutions were made by using HPLC grade water (Romil); phosphate salts (mono- and dibasic) for buffers preparation and hydrogen peroxide (H2O2) solution (30% (v/v)) were provided by Merck. Fe(III)-MC6*a was synthesized, purified and characterized according to the previously published procedure.23Equipment and methods
GC-MS analyses were performed on a Shimadzu GCMS-QP2010 SE system equipped with an EI MS source and a quadrupole array as MS analyser, using a Restek Rxi-5Sil-MS column with helium as the carrier gas. A linear gradient from 50 °C to 300 °C, with a rate of 24 °C min−1 was used. Mass spectra were recorded in the 50–450 m/z range.UV-vis spectra were recorded on a Cary Varian 60 Probe UV spectrophotometer, equipped with a temperature controller. All measurements were performed at 25 °C in 50 mM phosphate buffer (pH 6.5) with 50% TFE (v/v) unless otherwise specified. Quartz cuvettes with a path length of 1.00 cm or 0.100 cm were used for most measurements. Wavelength scans were performed from 200 to 800 nm, with a 300 nm min−1 scan speed. All data were blank subtracted. Fe(III)-MC6*a concentration was determined by UV/vis spectroscopy using ε = 1.17 × 10⁵ M−1 cm−1 in H2O 0.1% TFA (v/v) (λ = 387 nm). Data analysis was performed using Origin Pro, 9.0 version.
Catalytic assays
Kinetic experiments were performed using a Cary Varian 60 Probe UV spectrophotometer, equipped with a thermostated cell holder and magnetic stirrer. All kinetic measurements were performed at 25 °C in a 1.0 cm path length cuvette under magnetic stirring. The instrument was blanked before each acquisition. Fe(III)-MC6*a stock solutions were prepared in acidic water (0.1% TFA, (v/v)) and diluted to the final concentration in the reaction buffer (50 mM sodium phosphate, pH 6.5). TCP stock solutions (0.1 M) were prepared in 0.2 M NaOH solution. H2O2 stock solutions were prepared by diluting H2O2 30% (v/v) in water and their concentration was determined by UV-vis absorption spectroscopy (λmax = 240 nm; ε = 39.4 M−1 cm−1).To follow the formation of Cpd I, a solution of Fe(III)-MC6*a (10 μM) was treated with 1 eq. of H2O2 in 50 mM phosphate buffer (pH 6.5) with 50% TFE (v/v). Changes in the absorbance of the Soret band (λ = 387 nm) were monitored in a single-wavelength kinetic mode over 2 min. Afterwards, the decay of Cpd I to the resting state was followed by collecting UV-vis spectra every minute for 2 hours.
To evaluate enzyme activity, the formation of DCBQ was followed at λ = 272 nm (ε272 = 15.8 × 10³ M−1 cm−1). Fe(III)-MC6*a concentration in all experiments was fixed at 6.7 × 10⁻⁸ M using phosphate buffer (50 mM, pH 6.5) in the absence or in the presence of 50% TFE (v/v). The catalytic role of Fe(III)-MC6*a was ascertained by running the reaction in the absence of the catalyst, which gave no increase of the absorbance at 272 nm over 30 min.
Km values for TCP and H2O2 were measured keeping constant one of the two substrate concentrations, while varying the other one and vice versa. Progress curves of the reaction were monitored at λ = 272 nm, with an average time of 0.1 s. For the determination of  TCP concentration was fixed at 250 μM while H2O2 was varied from 0 to 200 mM. For the determination of KTCPm, H2O2 concentration was fixed at 300 mM while TCP concentration was varied from 0 to 250 μM.
Initial rate (v0) values were plotted as a function of both substrates concentration and data points were fitted according to a two-substrates Michaelis and Menten equation (eqn (2)), using Origin Pro 9.0 software:
 | (2) |
TON determination
Turnover number was determined by GC-MS analysis of the reaction, measuring the conversion degree based on substrate consumption. The reaction was carried out as follows: [TCP] = 340 μM, [H2O2] = 410 μM, [FeMC6*a] = 6.7 × 10⁻⁸ M, 50 mM phosphate buffer (pH 6.5) with 50% TFE (v/v). Chlorobenzene (CLB) was added ([CLB] = 340 μM) as an internal standard. Before (t = 0) and after (t = 5 and 15 min) H2O2 addition, aliquots of the reaction mixture (50 μL) were transferred to 2.0 mL Eppendorf tubes, quenched by the addition of a H2O 0.1% TFA (v/v) (50 μL) and extracted with dichloromethane (100 μL). Organic layers were dried (Na2SO4), centrifuged at 500 rpm and the supernatants were injected. Total Ion Current (TIC) chromatograms were acquired, and peaks corresponding to TCP and CLB were integrated for all reaction times. The conversion degree was calculated using eqn (2):
 | (3) |
Product identification
After addition of one equivalent of hydrogen peroxide to the Fe(III)-MC6*a-TCP reaction mixture, 100 μL aliquots at times 0, 10, 20 and 30 min were withdrawn and treated as described in the previous paragraph. Organic phases were analysed by GC-MS (Fig. S2–S4†).EPR characterization
EPR samples of Fe(III)-MC6*a were prepared in 50 mM phosphate buffer (pH 6.5) with 50% TFE (v/v) at a concentration of 0.25 mM. The samples were transferred to EPR-tubes and flash-frozen in liquid N2. Samples of intermediates were prepared by rapid mixing Fe(III)-MC6*a with one equivalent of H2O2 and either 1 or 0.5 equivalents of TCP (final concentration of 0.25 mM Fe(III)-MC6*a) in an EPR tube, and flash freezing in liquid N2 immediately or after 2 min, as stated in the figure captions. The prepared samples were stored at 77 K between measurements.X-band EPR measurements were performed on a Bruker ELEXYS E500 spectrometer equipped with a SuperX EPR049 microwave bridge and a cylindrical TE011 ER 4122SHQE cavity in connection with an Oxford Instruments continuous flow cryostat. Measuring temperatures were achieved using liquid helium flow through an ITC 503 temperature controller (Oxford Instruments). Modulation frequency at 100 kHz was set in all measurements. Bruker Xepr software package was used for all data processing. The EPR simulation was performed using EasySpin using the EasySpin MATLAB toolbox.58
Author contributions
G. Z. performed the experiments, analyzed the data and prepared the manuscript draft with D. D. support. L. L. and D. D. interpreted the data and conceived the mechanistic proposal. A. S. acquired, analyzed and interpreted EPR data. V. P., F. N. and A. L. contributed to design the experiments and provided critical feedback to the results. F. N. edited and finalized the manuscript. All the authors checked the manuscript.Conflicts of interest
The authors declare no conflict of interest. The funders had no role in the design of the study; in the collection, analyses, or interpretation of data; in the writing of the manuscript, or in the decision to publish the results.Acknowledgements
The authors wish to thank Dr Monica Grasso for technical assistance. This work was supported by Campania Region “Programma Operativo FESR Campania 2014–2020, Asse 1”, [CUP B63D18000350007], and by Italian Ministry of University and Research, PRIN 2020, [CUP E69J22001140005].References
- S. Feng, H. H. Ngo, W. Guo, S. W. Chang, D. D. Nguyen, D. Cheng, S. Varjani, Z. Lei and Y. Liu, Bioresour. Technol., 2021, 335, 125278 CrossRef CAS PubMed.
- S. M. Mousavi, S. A. Hashemi, S. M. I. Moezzi, N. Ravan, A. Gholami, C. W. Lai, W.-H. Chiang, N. Omidifar, K. Yousefi and G. Behbudi, Biochem. Res. Int., 2021, 2021, e5599204 Search PubMed.
- Y.-W. Lin, Coord. Chem. Rev., 2021, 434, 213774 CrossRef CAS.
- F. Nastri, M. Chino, O. Maglio, A. Bhagi-Damodaran, Y. Lu and A. Lombardi, Chem. Soc. Rev., 2016, 45, 5020–5054 RSC.
- Y.-W. Lin, Biotechnol. Appl. Biochem., 2020, 67, 484–494 CrossRef CAS PubMed.
- S. N. Natoli and J. F. Hartwig, Acc. Chem. Res., 2019, 52, 326–335 CrossRef CAS PubMed.
- L. A. Churchfield and F. A. Tezcan, Acc. Chem. Res., 2019, 52, 345–355 CrossRef CAS PubMed.
- K. J. Koebke and V. L. Pecoraro, Acc. Chem. Res., 2019, 52, 1160–1167 CrossRef CAS PubMed.
- J. C. Lewis, Acc. Chem. Res., 2019, 52, 576–584 CrossRef CAS PubMed.
- K. Oohora, A. Onoda and T. Hayashi, Acc. Chem. Res., 2019, 52, 945–954 CrossRef CAS PubMed.
- A. D. Liang, J. Serrano-Plana, R. L. Peterson and T. R. Ward, Acc. Chem. Res., 2019, 52, 585–595 CrossRef CAS PubMed.
- M. T. Reetz, Acc. Chem. Res., 2019, 52, 336–344 CrossRef CAS PubMed.
- A. Lombardi, F. Pirro, O. Maglio, M. Chino and W. F. DeGrado, Acc. Chem. Res., 2019, 52, 1148–1159 CrossRef CAS PubMed.
- E. N. Mirts, A. Bhagi-Damodaran and Y. Lu, Acc. Chem. Res., 2019, 52, 935–944 CrossRef CAS PubMed.
- F. Nastri, D. D'Alonzo, L. Leone, G. Zambrano, V. Pavone and A. Lombardi, Trends Biochem. Sci., 2019, 44, 1022–1040 CrossRef CAS PubMed.
- L. Leone, M. Chino, F. Nastri, O. Maglio, V. Pavone and A. Lombardi, Biotechnol. Appl. Biochem., 2020, 67, 495–515 CrossRef CAS PubMed.
- R. A. Baglia, J. P. T. Zaragoza and D. P. Goldberg, Chem. Rev., 2017, 117, 13320–13352 CrossRef CAS PubMed.
- M. Chino, L. Leone, G. Zambrano, F. Pirro, D. D'Alonzo, V. Firpo, D. Aref, L. Lista, O. Maglio, F. Nastri and A. Lombardi, Biopolymers, 2018, 109, e23107 CrossRef PubMed.
- L. Di Costanzo, S. Geremia, L. Randaccio, F. Nastri, O. Maglio, A. Lombardi and V. Pavone, J. Biol. Inorg Chem., 2004, 9, 1017–1027 CrossRef PubMed.
- A. Lombardi, F. Nastri, D. Marasco, O. Maglio, G. D. Sanctis, F. Sinibaldi, R. Santucci, M. Coletta and V. Pavone, Chem.–Eur. J., 2003, 9, 5643–5654 CrossRef CAS PubMed.
- F. Nastri, L. Lista, P. Ringhieri, R. Vitale, M. Faiella, C. Andreozzi, P. Travascio, O. Maglio, A. Lombardi and V. Pavone, Chem.–Eur. J., 2011, 17, 4444–4453 CrossRef CAS PubMed.
- R. Vitale, L. Lista, C. Cerrone, G. Caserta, M. Chino, O. Maglio, F. Nastri, V. Pavone and A. Lombardi, Org. Biomol. Chem., 2015, 13, 4858–4868 RSC.
- G. Caserta, M. Chino, V. Firpo, G. Zambrano, L. Leone, D. D'Alonzo, F. Nastri, O. Maglio, V. Pavone and A. Lombardi, ChemBioChem, 2018, 19, 1823–1826 CrossRef CAS PubMed.
- L. Leone, D. D'Alonzo, V. Balland, G. Zambrano, M. Chino, F. Nastri, O. Maglio, V. Pavone and A. Lombardi, Front. Chem., 2018, 6, 590 CrossRef CAS PubMed.
- L. Leone, D. D'Alonzo, O. Maglio, V. Pavone, F. Nastri and A. Lombardi, ACS Catal., 2021, 11, 9407–9417 CrossRef CAS.
- V. Firpo, J. M. Le, V. Pavone, A. Lombardi and K. L. Bren, Chem. Sci., 2018, 9, 8582–8589 RSC.
- J. M. Le, G. Alachouzos, M. Chino, A. J. Frontier, A. Lombardi and K. L. Bren, Biochemistry, 2020, 59, 1289–1297 CrossRef CAS PubMed.
- G. Zambrano, M. Chino, E. Renzi, R. D. Girolamo, O. Maglio, V. Pavone, A. Lombardi and F. Nastri, Biotechnol. Appl. Biochem., 2020, 67, 549–562 CrossRef CAS PubMed.
- G. Zambrano, F. Nastri, V. Pavone, A. Lombardi and M. Chino, Sensors, 2020, 20, 3793 CrossRef CAS PubMed.
- J. Huff, Chemosphere, 2012, 89, 521–525 CrossRef CAS PubMed.
- M. Chen, P. Xu, G. Zeng, C. Yang, D. Huang and J. Zhang, Biotechnol. Adv., 2015, 33, 745–755 CrossRef CAS PubMed.
- X. Jin, S. Peldszus and P. M. Huck, Water Res., 2012, 46, 6519–6530 CrossRef CAS PubMed.
- Y. Peng, J. Chen, S. Lu, J. Huang, M. Zhang, A. Buekens, X. Li and J. Yan, Chem. Eng. J., 2016, 292, 398–414 CrossRef CAS.
- T. Czech, N. B. Bonilla, F. Gambus, R. R. González, J. Marín-Sáez, J. L. M. Vidal and A. G. Frenich, Sci. Total Environ., 2016, 557–558, 681–687 CrossRef CAS PubMed.
- M. Pera-Titus, V. García-Molina, M. A. Baños, J. Giménez and S. Esplugas, Appl. Catal., B, 2004, 47, 219–256 CrossRef CAS.
- D. W. Watkins, J. M. X. Jenkins, K. J. Grayson, N. Wood, J. W. Steventon, K. K. Le Vay, M. I. Goodwin, A. S. Mullen, H. J. Bailey, M. P. Crump, F. MacMillan, A. J. Mulholland, G. Cameron, R. B. Sessions, S. Mann and J. L. R. Anderson, Nat. Commun., 2017, 8, 1–9 CrossRef CAS PubMed.
- R. L. Osborne, M. K. Coggins, J. Terner and J. H. Dawson, J. Am. Chem. Soc., 2007, 129, 14838–14839 CrossRef CAS PubMed.
- S. Sumithran, M. Sono, G. M. Raner and J. H. Dawson, J. Inorg. Biochem., 2012, 117, 316–321 CrossRef CAS PubMed.
- R. L. Osborne, L. O. Taylor, K. P. Han, B. Ely and J. H. Dawson, Biochem. Biophys. Res. Commun., 2004, 324, 1194–1198 CrossRef CAS PubMed.
- L. Yin, H. Yuan, C. Liu, B. He, S.-Q. Gao, G.-B. Wen, X. Tan and Y.-W. Lin, ACS Catal., 2018, 8, 9619–9624 CrossRef CAS.
- A. O. Olaniran and E. O. Igbinosa, Chemosphere, 2011, 83, 1297–1306 CrossRef CAS PubMed.
- R. L. Osborne, M. K. Coggins, G. M. Raner, M. Walla and J. H. Dawson, Biochemistry, 2009, 48, 4231–4238 CrossRef CAS PubMed.
- J. N. Rodríguez-López, D. J. Lowe, J. Hernández-Ruiz, A. N. P. Hiner, F. García-Cánovas and R. N. F. Thorneley, J. Am. Chem. Soc., 2001, 123, 11838–11847 CrossRef PubMed.
- P. C. E. Moody and E. L. Raven, Acc. Chem. Res., 2018, 51, 427–435 CrossRef CAS PubMed.
- A. Ivancich, C. Jakopitsch, M. Auer, S. Un and C. Obinger, J. Am. Chem. Soc., 2003, 125, 14093–14102 CrossRef CAS PubMed.
- W. R. Hagen, Mol. Phys., 2007, 105, 2031–2039 CrossRef CAS.
- A. Khindaria and S. D. Aust, Biochemistry, 1996, 35, 13107–13111 CrossRef CAS PubMed.
- C. E. Schulz, P. W. Devaney, H. Winkler, P. G. Debrunner, N. Doan, R. Chiang, R. Rutter and L. P. Hager, FEBS Lett., 1979, 103, 102–105 CrossRef CAS PubMed.
- R. Rutter, L. P. Hager, H. Dhonau, M. Hendrich, M. Valentine and P. Debrunner, Biochemistry, 1984, 23, 6809–6816 CrossRef CAS PubMed.
- B. M. Hoffman, J. E. Roberts, C. H. Kang and E. Margoliash, J. Biol. Chem., 1981, 256, 6556–6564 CrossRef CAS.
- W. R. Patterson, T. L. Poulos and D. B. Goodin, Biochemistry, 1995, 34, 4342–4345 CrossRef CAS PubMed.
- O. Maglio, M. Chino, C. Vicari, V. Pavone, R. O. Louro and A. Lombardi, Chem. Commun., 2021, 57, 990–993 RSC.
- S.-F. Chen, X.-C. Liu, J.-K. Xu, L. Li, J.-J. Lang, G.-B. Wen and Y.-W. Lin, Inorg. Chem., 2021, 60, 2839–2845 CrossRef CAS PubMed.
- J. Zhao, C. Lu and S. Franzen, J. Phys. Chem. B, 2015, 119, 12828–12837 CrossRef CAS PubMed.
- J. M. X. Jenkins, C. E. M. Noble, K. J. Grayson, A. J. Mulholland and J. L. R. Anderson, J. Inorg. Biochem., 2021, 217, 111370 CrossRef CAS PubMed.
- S. A. Hindson, H. A. Bunzel, B. Frank, D. A. Svistunenko, C. Williams, M. W. van der Kamp, A. J. Mulholland, C. R. Pudney and J. L. R. Anderson, ACS Catal., 2021, 11, 11532–11541 CrossRef CAS PubMed.
- D. Anshu, S. Ruby, J. Jyoti and K. Sukhbeer, Mini-Rev. Org. Chem., 2014, 11, 462–476 CrossRef.
- S. Stoll and A. Schweiger, J. Magn. Reson., 2006, 178, 42–55 CrossRef CAS PubMed.
Footnote |
| † Electronic supplementary information (ESI) available. See https://doi.org/10.1039/d2ra00811d |
| This journal is © The Royal Society of Chemistry 2022 |

