 Open Access Article
Temporal evolution of viscoelasticity of soft colloid laden air–water interface: a multiple mode microrheology study
Merin Jose†
 *,
Muruga Lokesh†*,
Rahul Vaippully,
Dillip K. Satapathy‡
 * and
Basudev Roy‡
 *
*
Department of Physics, Indian Institute of Technology Madras, Chennai, Tamil Nadu, India 600036. E-mail: basudev@iitm.ac.in; dks@iitm.ac.in
First published on 28th April 2022
Abstract
Mechanical properties of particle laden interfaces is crucial for various applications. For water droplets containing soft microgel particles, passive microrheology studies have revealed that the dynamically varying surface area of the evaporating drop results in a viscous to viscoelastic transition along the plane of the interface. However, the behaviour of the medium orthogonal to the interface has been elusive to study using passive microrheology techniques. In this work, we employ optical tweezers and birefringent probe particles to extract the direction-resolved viscoelastic properties of the particle–laden interface. By using special types of birefringent tracer particles, we detect not only the in-plane translational mode but also the out-of-plane translational (perpendicular to the interface) and rotational modes. We first compare different passive methods of probing the viscoelasticity of the microgel laden interface of sessile drop and then study the modes perpendicular to the interface and the out-of-plane rotational mode using optical tweezers based passive microrheology. The viscoelasticity of the interface using two different methods, i.e., multiple-particle tracking passive microrheology using video microscopy and by trapping birefringent tracer particles in optical tweezers, relying on different models are studied and found to exhibit comparable trends. Interestingly, the mode orthogonal to the interface and the rotational mode also show the viscous to viscoelastic transition as the droplet evaporates, but with lesser viscoelasticity during the same evaporation time than the in-plane mode.
1 Introduction
Irreversible adsorption of colloids to fluid interfaces is largely exploited in stabilizing emulsions,1 where the high efficiency stems from the high desorption energy (∼103–104kBT) of the colloids adsorbed to the interfaces.2,3 Although hard colloids such as highly crosslinked polystyrene and silica particles are generally used to stabilize emulsions, soft colloids and proteins are being widely explored only recently. Moreover, the adsorption and self-assembly of soft colloidal particles at fluid interfaces are ideal model systems to investigate a range of exciting physics problems such as phase transitions in two-dimensions, confinement induced crystallization, glass transition and assembly of binary mixture of particles.4–6Understanding and controlling the adsorption kinetics of soft particles to fluid interfaces and the physio-chemical properties of particle–laden interfaces are of primary relevance for a wide range of technological applications spanning across scientific disciplines such as biomedicine,7,8 cosmetics,9 food processing10 and paints and coatings.11,12 Remarkably, the use of stimuli-responsive microgels endows the fluid interfaces with rich behaviour and unique functionalities, owing to their tunability in softness and responsiveness to temperature, pH etc.13 Such versatility has enabled microgel monolayers to be used as substrates for cell culture and harvesting,14 in sensing,15 optics16 and patterning applications.17 Moreover, the transfer of the colloidal monolayers to solid substrates finds applications as lithography masks.18,19 In particular, the mechanical properties of the particle–laden interfaces is crucial in studies concerning the stability of particle-stabilized emulsions and foams. Investigating the rheological properties of the particle–laden interfaces also provides insight into the thermodynamic and hydrodynamic interactions between the particles.2,20 Rheological properties of interfaces can be studied by subjecting them to certain deformations such as a change in area or shape.21 Such dilatational and shear rheology measurement techniques using Langmuir trough and rheometers require large sample volumes. Microscopic methods such as particle tracking, on the other hand, are relatively straightforward to perform. In the particle tracking technique, video microscopy is used to record the random thermal motions of multiple tracer particles. The trajectories of the particles are obtained, and the relative mean squared displacements are computed. A generalized Stokes–Einstein relation is then employed to extract the complex viscoelastic moduli of the interface. In addition to such passive microrheology measurements, forces or deformations can be imposed via external sources.22 Micro-rheology using optical tweezers serves as another technique and has an added advantage that it can be used to measure the particle interactions and the drag coefficient of the particle, provided that the trap is calibrated.23
In this paper, we use optical tweezers to record the passive thermal motion of the optically trapped particles. The translational mode along the interface obtained using the optical tweezers is used to study the evolution of the viscoelastic moduli in the interface plane and compared with results obtained via multiple particle tracking using video microscopy. In addition, the use of optical tweezers to study the rheological properties of the particle–laden interface enables us to extract the translational mode that is perpendicular to the interface as well as the out of plane rotational mode of the probe particles.24 However, these rotational modes are generated by the Brownian motion and are detected by the use of birefringent particles with structural anisotropy.
We probe the mechanical properties of the air–water interface loaded with intramolecular crosslinked polymeric particles composed of poly(N-isopropylacrylamide) (p-NIPAM). These microgel particles adsorb onto interfaces spontaneously.25 Unlike hard colloids, these soft particles, on adsorption, get deformed or flattened, being subject to the interfacial tension. The extent to which an individual microgel particle deforms at the interface is dictated by its internal elasticity and the available interfacial area.26 We use a simple model system to study the assembly of microgel particles and the properties of the soft particle monolayer at the interface. A droplet dispersed with the microgel particles is placed on a glass substrate and allowed to evaporate. Multiple particle tracking passive microrheology using video microscopy has shown that the microgel laden interface undergoes a viscous to viscoelastic transition upon evaporation.27
Viscoelastic properties of particle–laden interfaces has profound importance in determining the stability of emulsions stabilised by particles (Pickering emulsions) that finds applications in varied fields. It is insightful to realize that to get a complete picture of the viscoelasticity, not only the in-plane mode, but also the orthogonal mode should be taken into consideration. We study the viscoelasticity of interface laden with soft microgel particles that deform and flatten at the interface. The resultant lateral stretching of these particles leads to a non-uniform distribution of polymer density along the interfacial plane and orthogonal to it. It is imperative in our experiments, that we observe a higher viscoelasticity measured along the in-plane mode compared to the orthogonal mode. Although a complete understanding of the underlying mechanism requires detailed studies, we believe that the present work emphasizes the need to understand different viscoelastic modes for interfaces laden with microgel particles.
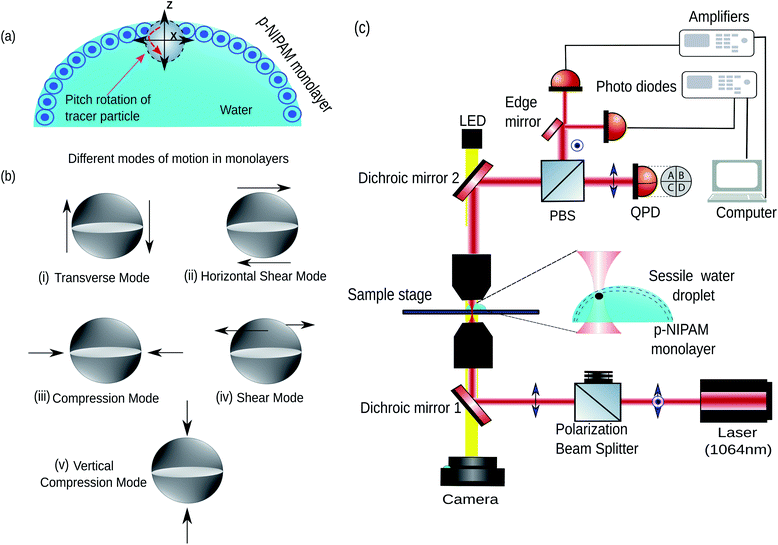
In general, the mechanical properties of monolayer fluid interfaces responding to external stimuli are characterised by different modes of interfacial viscoelasticity.28,29 A cartoon of the particle laden air–water interface has been shown in Fig. 1(a). These modes30 have been shown in Fig. 1(b)(i–v). Motions (i), (ii), and (iv) are shear deformations of the specimen, whereas motions (iii) and (v) correspond to changes in volume of the specimen. The elastic constant for motion (i) is the surface tension (σ) and the elastic constant for motion (iii) is the dilational elasticity (εd),31 which is the static elasticity. The shear viscosity in the motion (iv) is referred to as surface viscosity and has been the most extensively studied rheological parameter. However, very little is known about the rheological parameters arising from the motions (i) (also called the capillary-gravity mode), (ii) and (v), neither has any complete quantitative theory been developed. It is here that we reiterate that our out-of-plane rotational mode studies the cases (i) and (ii), while the vertical translational mode studies the mode in (v).32
We confirm the evolution of the viscoelasticity of the interface using optical tweezers along the in the plane and out of plane modes. Interestingly, we see that the out of plane rotational mode also shows evolution of viscoelasticity of the interface. In addition, the change in relative polymer viscosity with respect to the solvent in different modes confirms that the evolution of the viscoelasticity of the interface has lesser change in out of plane translational and rotational modes as compared to in the plane translational mode.
2 Theory
An incompressible low Reynolds number viscoelastic medium can be shown to have a frequency-dependent viscosity33 in a medium comprising of a solvent and a polymer solute34 dissolved in it. The expression has been found to be given by eqn (1) derived from the Stokes Oldroyd-B model for linear microscopic viscoelasticity,35 and is also known as the generalized Maxwell model.36,37
 | (1) |
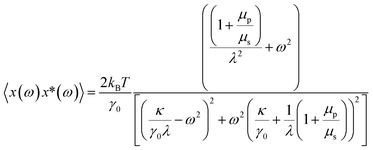 | (2) |
The term κ indicates the trap stiffness and γ0 is the drag coefficient for only the solvent. The expression for the γ0 is given by,
| γ0 = 6πμsa0 | (3) |
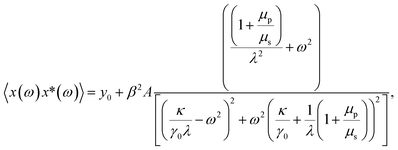 | (4) |
 | (5) |
Thus, the calibration factor β (ref. 40 and 41) is then given as
 | (6) |
Fitting the PSD with this eqn (4), we can extract the values of relative viscosity  of solution, polymer relaxation time constant (λ), the trap stiffness κ and the calibration factor β. The calibration factor indicates how to scale between the V2 Hz−1 to nm2 Hz−1 and thus, reducing the number of fitting parameters, we could normalise the curve to 1 to find all other parameters and then come back to this parameter later. We are making an attempt to apply a theory that works well for bulk linear viscoelastic medium to a viscoelastic interface comprising of water with polymer particles.
For multiple-particle tracking passive microrheology, the X- an Y-coordinates of four tracer particles were simultaneously detected as a function of time and the relative Mean Squared Displacement (MSD) determined.42 The MSD was then assumed to be a function of the form
MSD = 〈(Δ![[r with combining right harpoon above (vector)]](https://www.rsc.org/images/entities/i_char_0072_20d1.gif) ij(t + τ) − Δ ij(t + τ) − Δ![[r with combining right harpoon above (vector)]](https://www.rsc.org/images/entities/i_char_0072_20d1.gif) ij(t))2〉 = 8Dτα, ij(t))2〉 = 8Dτα,
| (7) |
![[r with combining right harpoon above (vector)]](https://www.rsc.org/images/entities/i_char_0072_20d1.gif) ij(t + τ) and Δ
ij(t + τ) and Δ![[r with combining right harpoon above (vector)]](https://www.rsc.org/images/entities/i_char_0072_20d1.gif) ij(t) respectively are the separation between two tracer particles i and j at times t + τ and t. From eqn (7), we can further write,
ij(t) respectively are the separation between two tracer particles i and j at times t + τ and t. From eqn (7), we can further write,
log(MSD) = α![[thin space (1/6-em)]](https://www.rsc.org/images/entities/char_2009.gif) log log![[thin space (1/6-em)]](https://www.rsc.org/images/entities/char_2009.gif) τ + log τ + log![[thin space (1/6-em)]](https://www.rsc.org/images/entities/char_2009.gif) 8D. 8D.
| (8) |
Here, the diffusion coefficient (D) and the diffusion exponent (α) are extracted as the antilog of intercept and slope respectively (see eqn (8)). It may be noted here that this model for MSD given in eqn (7) is different from the generalised Maxwell model.
Viscoelastic properties of the interface were then determined by using the generalized Stokes–Einstein relation (GSER),43
![[r with combining tilde]](https://www.rsc.org/images/entities/i_char_0072_0303.gif) 2(s)〉 is the Laplace transform of the measured MSD, kB is the Boltzmann constant, T is temperature in Kelvin, a is radius of the tracer particle, s is the Laplace frequency in rad s−1 and
2(s)〉 is the Laplace transform of the measured MSD, kB is the Boltzmann constant, T is temperature in Kelvin, a is radius of the tracer particle, s is the Laplace frequency in rad s−1 and ![[G with combining tilde]](https://www.rsc.org/images/entities/i_char_0047_0303.gif) (s) is the frequency-dependent viscoelastic modulus.44
(s) is the frequency-dependent viscoelastic modulus.44 ![[G with combining tilde]](https://www.rsc.org/images/entities/i_char_0047_0303.gif) (s) was transformed into Fourier domain by substituting s = iω to obtain G*(ω). The elastic and the loss modulus were obtained respectively as the real and imaginary parts of the complex viscoelastic modulus, G*(ω) = G′(ω) + iG′′(ω).45 We note that, G′ and G′′ obey the Kramers–Kronig relations, they are not two independent functions, and both can be determined from the single, real function
(s) was transformed into Fourier domain by substituting s = iω to obtain G*(ω). The elastic and the loss modulus were obtained respectively as the real and imaginary parts of the complex viscoelastic modulus, G*(ω) = G′(ω) + iG′′(ω).45 We note that, G′ and G′′ obey the Kramers–Kronig relations, they are not two independent functions, and both can be determined from the single, real function ![[G with combining tilde]](https://www.rsc.org/images/entities/i_char_0047_0303.gif) (s). However, the Laplace transform is valid at lower frequencies and to obtain complex viscoelastic modulus G*(ω) at higher frequencies we fit the data to a function, typically used to understand glassy dynamics of hard sphere colloids43
(s). However, the Laplace transform is valid at lower frequencies and to obtain complex viscoelastic modulus G*(ω) at higher frequencies we fit the data to a function, typically used to understand glassy dynamics of hard sphere colloids43 ![[G with combining tilde]](https://www.rsc.org/images/entities/i_char_0047_0303.gif) (s) = g1 − g2s−0.55 + g3s0.3 + g4s0.5 + g5s and extract the non-negative fitting parameters gis. In the context of a hard sphere colloidal glass, the first three terms are indicative of the cage dynamics, as suggested by mode coupling theories;46 they take into account the plateau and a low-frequency relaxation. The fourth term is associated with the predicted high-frequency elastic modulus,47 while the fifth term corresponds to the high-frequency viscosity of the suspension. The applicability of this scheme is tested for several distinctly different complex fluids such as suspension silica particles in ethylene glycol, entangled polymer solution and oil-in-water microemulsions.43 This procedure establishes a general relationship between the MSD of the particles and the bulk rheological properties of the complex fluid.43 Under this scheme, the elastic compression/dilation modulus is given by E(ω) = E′(ω) + iE′′(ω) which can then be written as E(ω) = E′(ω) + iωηi (ref. 48 and 49) where, ηi is the interfacial viscosity. Then
(s) = g1 − g2s−0.55 + g3s0.3 + g4s0.5 + g5s and extract the non-negative fitting parameters gis. In the context of a hard sphere colloidal glass, the first three terms are indicative of the cage dynamics, as suggested by mode coupling theories;46 they take into account the plateau and a low-frequency relaxation. The fourth term is associated with the predicted high-frequency elastic modulus,47 while the fifth term corresponds to the high-frequency viscosity of the suspension. The applicability of this scheme is tested for several distinctly different complex fluids such as suspension silica particles in ethylene glycol, entangled polymer solution and oil-in-water microemulsions.43 This procedure establishes a general relationship between the MSD of the particles and the bulk rheological properties of the complex fluid.43 Under this scheme, the elastic compression/dilation modulus is given by E(ω) = E′(ω) + iE′′(ω) which can then be written as E(ω) = E′(ω) + iωηi (ref. 48 and 49) where, ηi is the interfacial viscosity. ThenHere it may be noted that G′′(ω) = ηiω,50,51 such that G′(ω) = E′(ω). Here, θp is the phase angle. The elastic modulus applies to the case of dynamic systems while the shear storage modulus is for quasi-static systems. In the limit of small amplitude oscillatory systems, the moduli are identical.
But, E′ is related to the surface pressure48,52 as
 | (9) |
G′![[thin space (1/6-em)]](https://www.rsc.org/images/entities/char_2009.gif) ln(A0/A) = ΔΠ ln(A0/A) = ΔΠ
| (10) |
Thus,
| ΔΠ = G′(ω)ln(A0/A) | (11) |
The surface area (A) of the sessile water droplet is calculated using eqn (12)
 | (12) |
3 Materials and methods
p-NIPAM microgel particles were synthesized by precipitation polymerisation reaction.53 The reagents, N-isopropylacrylamide, NIPAM (Sigma Aldrich), N,N′-methylenebisacrylamide, MBAA (Sigma Aldrich) and potassiumperoxodisulfate (KPS) were used without further purification. The NIPAM monomer (0.25 g) and the crosslinker MBAA (0.025 g) were dissolved in 15 mL de-ionized (DI) water (resistivity – 18.2 MΩ cm, Millipore), the solution was stirred under nitrogen atmosphere and heated in a water bath maintained at a temperature of 70 °C. Then, KPS (0.02 g) dissolved in 5 mL DI water was added to initiate the polymerization reaction. The reaction was allowed to continue for 7–8 hours and then the reaction mixture was cooled to room temperature. The synthesised particles were subjected to six cycles of centrifugation and redispersion in DI water. The monolayer concentration (CML, defined as the particle concentration such that a uniform monolayer deposit spanning the entire circular base area of the droplet forms after complete evaporation54) for the microgel particles, determined by performing a series of trial experiments by diluting the mother solution to the desired concentration was found to be 0.02 wt%.The passive microrheology of the microgel-laden air–water interface of the sessile droplet was performed using tracer polystyrene (PS) particles (ThermoScientific, Cat No. 4010A). The particles are 1 μm in diameter. For the particle tracking experiments, 1 μL of the droplet containing p-NIPAM microgel particles at the monolayer concentration (0.02 wt%) was mixed with 1 μL of tracer PS particles at very low concentration (0.005 wt%). The tracer particle movement at the apex of the droplet was observed and recorded using an Olympus IX71 inverted optical microscope (transmission mode). Relevant frames of the video were extracted using the ImageJ software and the MSD is obtained by using a in-house developed MATLAB® routine. For calibration, we use the Thorlabs optical tweezers kit OTKB/M55 as shown in the Fig. 1(c). An Olympus UPlanFLN 100× objective with 1.3 Numerical Aperture (NA) was used to focus the laser spot to about 1 μm diameter. The illumination aperture of the objective was overfilled. At this diffraction-limited spot, a 1 μm diameter RM257 (Merck) particle was trapped, and a Nikon E-Plan 10×/0.25 NA condenser was used to collect the forward scattered light. The laser was a 1064 nm wavelength diode laser from Lasever with a maximum power of 1.5 W. The forward scattered light was made incident onto a Quadrant Photo Diode (QPD from Thorlabs Inc.) and the data was obtained at the rate of 10k samples per second. The sample illumination was done from the top via a dichroic mirror using a visible LED, and another dichroic mirror was used to combine the trapping laser with the visible light. A CMOS camera (Thorlabs Inc.) was used to get the images.
We prepare the spherical liquid crystalline particles,56 by heating 150 mL de-ionized water to 75 °C and 50 mL ethanol (with 99% purity) to 55 °C simultaneously. We then add 20 mg of RM257 (Merck) powder to the ethanol after it reaches 55 °C. A magnetic stirrer was used to dissolve the powder properly and get a clear solution. When the powder gets dissolved, we add the whole RM257-ethanol solution in a dropwise manner to the de-ionized water while keeping the temperature at 75 °C. The color of this 200 mL solution is milky white. We then cover the beaker's opening with aluminum foil bearing perforations, and wait while all the ethanol has been evaporated and the solution becomes 150 mL again. Thereafter, we cool the solution and store. The resultant birefringent micro-spheres are about 1 μm in size, with a standard deviation of about 0.2 μm. We can get bigger particles upon increasing the amount of RM257 powder in the same amount of ethanol or by slowing down the evaporation rate.
The birefringent microspheres solution was added to p-NIPAM solution at monolayer concentration. A 2 μL drop of this solution was gently placed on a coverslip as shown in Fig. 1 and allowed to evaporate till height of the interface falls below 200 μm (working distance of our objective). As the evaporation progresses a p-NIPAM monolayer begins to form at the interface. Here, we trap the birefringent particle to measure the changes in the power spectral density of parallel and perpendicular modes to the interface along with out of the plane rotational modes.
We use two different techniques to perform rheology, namely use the video camera to detect position of tracer particles to find the G′ and G′′, and, the position and orientation measurement of the particle at high resolution using optical tweezers to find the passive thermal response of the tracer to Brownian motion.
4 Results and discussions
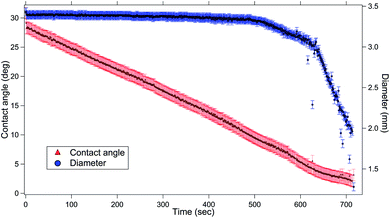
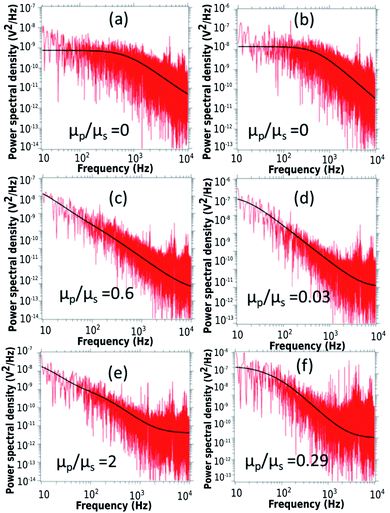
First, we discuss the evolution of the surface of the microgel loaded droplet subject to evaporation. The surface serves as the substrate for our experiments wherein, the microgel assembly takes place and the viscoelastic property is investigated. The sessile droplets placed on hydrophilic substrates like the glass substrate used in the present study typically exhibit a constant contact radius (CCR) mode of evaporation. The droplets stay pinned to the substrate for the majority of the drying time. Consequently, the interfacial area of the droplet shrinks with the loss of the solvent due to evaporation. The time evolution of the diameter and the contact angle of the microgel loaded sessile droplet during the evaporation process is shown in Fig. 2. As can be inferred from the figure, the droplet evaporates in a CCR mode for about 75% of the total evaporation time. The area of the sessile water droplet surface was initially 2.89 mm2 while it reduced to 2.65 mm2 after t/T = 0.3.Initially, as the number density of microgels is less on the surface of the air–water interface, a tracer birefringent particle can be trapped on the interface and would show a Lorentzian power spectral density,57,58 as shown in Fig. 3(a) and (b). This is about 2 minutes from the time of placing the droplet on glass and amounts to a t/T = 0.1, where T is the total time for evaporation for a 3 μL droplet which is about 20 min. As time progresses, the number density of microgels on the surface increases and the interface starts to become viscoelastic in both the X (along the interface) and Z (perpendicular to the interface) directions. This is shown in Fig. 3(c) and (d) with t/T = 0.2 and Fig. 3(e) and (f) with t/T = 0.3. Here the data was taken over a single 5 second segment of time series and not averaged.
The relative viscosity of the polymer particle laden interface with respect to the solvent gradually increases as indicated in the Fig. 3. Interestingly, the in-plane translational mode has higher viscoelasticity than the mode orthogonal to the interface during the same evaporation time span. There is a qualitative change in the power spectrum too as the Lorentzian (indicating low viscoelasticity) paves the way for more viscoelastic spectra for the same particle.
We find that the in-plane mode has higher viscoelasticity than the mode orthogonal to the interface. We conjecture this by taking into account the non-uniform distribution of polymer density along the interface and orthogonal to it, owing to the microgel deformation at the interface. The adjacent microgels at the interfacial plane interact through the dangling polymer chains at their periphery, forming an elastic network,26 thus contributing to the in-plane viscoelasticity and possibly making it higher than that of the orthogonal mode.
To study the viscoelastic properties of the microgel laden interface using multiple particle tracking passive microrheology, we first extract the X–Y tracks of the tracers. Using video microscopy, we bring the tracer particles into focus. The tracers used are 1 μm diameter polystyrene particles. Unlike the p-NIPAM microgel particles that get spontaneously adsorbed to the air–water interface of the sessile droplet, the PS particles themselves do not have any affinity to adsorb to the interface. However, some PS particles get randomly trapped on the p-NIPAM interfacial network. Also, as the evaporation progresses, the descending interface captures some of the PS particles present within the bulk of the droplet. Thus, the number of tracers on the interface increases with time. We focus on the tracers that are present at the apex of the droplet. The apex of the drop is relatively flat compared to other regions; thus, the region in focus can be considered to be the X–Y plane. The video during the entire evaporation process is recorded, keeping the apex of the drop in focus. Since the droplet is subject to evaporation, the interface keeps descending, and so the microscope objective has to be continuously adjusted to keep the tracer particles in focus. Relevant frames of the video at different t/Ts are extracted, containing at least four tracer particles in focus as shown in Fig. 4. The X–Y trajectories of tracer particles at t/T = 0.1, 0.5 and 0.8 are shown in Fig. 5. Initially, the particles exhibit Brownian motion along the X–Y plane, as evident from the trajectory recorded at t/T = 0.1. The interface can be considered predominantly viscoelastic liquid at this stage as the tracer trajectory is comparatively unconstrained. But with time, the tracer motion at the interface gets more and more constrained, as can be seen from the trajectory recorded at t/T = 0.5. The particle movement is largely constrained on the interface plane towards the penultimate evaporation stage, with the p-NIPAM network almost completely immobilising the tracer. At this stage, the interface behaves as predominantly a viscoelastic solid (or gel).
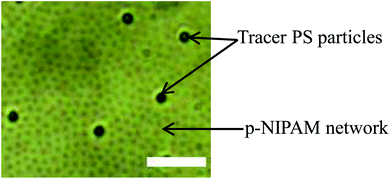 | ||
| Fig. 4 Snapshot of tracer PS particles at the air–water interface of a sessile droplet during evaporation (t/T = 0.5). Scale bar: 5 μm. | ||
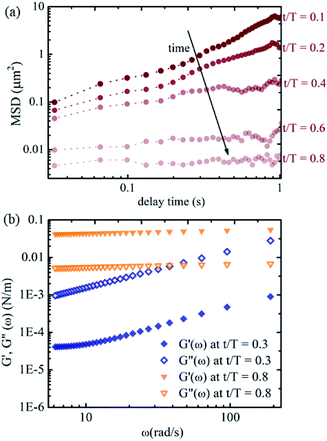
To gain a more quantitative understanding, we further calculate the relative mean squared displacements of the tracers at the interface at different times. The advantage of using relative MSD rather than absolute MSD is that the error in MSD due to collective motion of the interface arising from drift or air currents can be rectified. The relative MSDs of the tracers at the interface near the apex of the droplet at different evaporation times are shown in Fig. 6(a). The slope of the MSD plot is nearly one at the early stage of evaporation and decreases gradually, approaching zero with time. Fig. 6(b) shows the viscoelastic moduli calculated using the generalised Stokes–Einstein equation. The loss moduli values are higher than the elastic moduli values at t/T = 0.3. The trend reverses at t/T = 0.8, with higher elastic moduli values than the loss moduli values. Thus, we observe a clear viscoelastic liquid to solid (or gel) transition in the mechanical properties of the air–water interface of the sessile droplet loaded with p-NIPAM microgel particles in line with previous studies. The p-NIPAM microgel particles possessing inherent surface-active behaviour adsorb to the air–water interface of the sessile drop within a few minutes after the drop is placed on the substrate. Initially, the interfacial area is large, and the microgel adsorption still maintains the viscoelastic liquid nature of the interface. As time progresses, the adsorbed microgels form a network that spans the entire interfacial area. This is due to more microgel particles populating the interface and the shrinking interfacial area. The interfacial network layer of the microgels makes the tracer movement highly constrained.
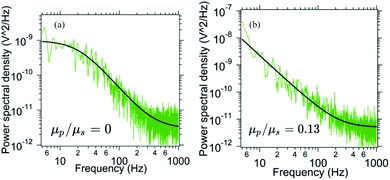
In order to probe the out of plane rotational mode we employ optical tweezers. Here, we trap a birefringent particle close to the interface and record the power spectral density. The power spectral density for the pitch rotational mode has been specified in Fig. 7. As the number density of p-NIPAM particles increases, the PSD changes from Lorentzian to Oldroyd-model. The ratio μp/μs changes from 0 (only water, no p-NIPAM particles) initially to 0.13 after 6 minutes (t/T = 0.5) of evaporation. This indicates the onset of higher viscoelasticity even in this mode of motion, although the extent of viscoelasticity is lesser than in-plane and orthogonal modes in the same duration of evaporation time.
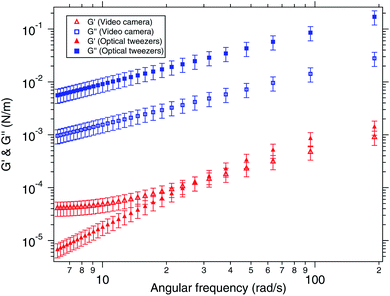
Generally, the viscoelasticity of an air–water interface is estimated by assuming that the MSD is a power law. However, the power law is indeed an approximation. We tried to use a more general model for viscoelasticity derived from the first principles for a bulk linear viscoelastic material to the case of an interface of a water droplet laden with polymeric particles. Thus, we compare the viscoelastic moduli of the surface computed from the generalised Maxwell's model with that computed directly from video tracking, assuming a power law for the MSD. Fig. 8 shows the comparison of the viscoelastic moduli of the interface computed by the generalized Maxwell's model in closed symbols and by the video tracking method in open symbols. The generalised Maxwell's model (or the Jeffery's model) works well for bulk linear viscoelastic systems. We make an attempt to use it for viscoelastic interfaces with elasticity coming from polymeric particles suspended in water. We find that the trends are qualitatively similar but have quantitative differences which may be explained by the fact that these are two entirely different models. Moreover, generalised Maxwell's model assumes linear viscoelasticity while the actual system might have become non-linear, but yet better than assuming a power law for the MSD. Initially, the system is more viscous than elastic which is when the generalised Maxwell's model matches well. But as the elasticity increases, and the system becomes more elastic than viscous, the model breaks down.
Finally, we estimate the excess pressure of the microgel-laden interface. As discussed previously, there is a reduction in the interfacial area of the drop upon evaporation, evident from Fig. 2. This amounts to an excess pressure ΔΠ = 0.00005![[thin space (1/6-em)]](https://www.rsc.org/images/entities/char_2009.gif) ln(2.89/2.65) = 4.3 μN m−1. This can be compared with 72 mN m−1 of surface tension of water. Moreover, the force due to this excess pressure on a particle of 1 μm diameter at the interface is then 4.3 × (2π × 0.5) pN = 4 pN. This force is acting on the particle from all the radial directions at the interface.
ln(2.89/2.65) = 4.3 μN m−1. This can be compared with 72 mN m−1 of surface tension of water. Moreover, the force due to this excess pressure on a particle of 1 μm diameter at the interface is then 4.3 × (2π × 0.5) pN = 4 pN. This force is acting on the particle from all the radial directions at the interface.
5 Conclusions
To conclude, we ascertain the viscoelasticity of the air–water interface of a sessile droplet laden with p-NiPAM microgels along with some tracer particles. These tracer particles are either highly crosslinked polystyrene or birefringent particles. Using these tracers, we find that the modes parallel to the interface, perpendicular to the interface and the out-of-plane rotational mode of the particle with respect to the interface. As the evaporation progresses, the interface area decreases and all the modes clearly shows a gradual viscous to viscoelastic transition. We probe it with two different techniques, multiple-particle tracking passive microrheology using video microscopy and by trapping birefringent tracer particles in optical tweezers. The multiple-particle tracking method captures the rheological properties on the mode parallel to the interface while the optical tweezers can also be used to find information about the transnational mode parallel to the interface. We compare the rheological properties of the interface estimated from the two methods for the mode parallel to the interface using different models; the video camera tracking data is fitted to an MSD of the form of a power law, while the PSD from the optical trapping is fitted to the generalised Maxwell's model. We find qualitative agreements but with some quantitative differences. Interestingly, the in-plane translational mode possesses higher viscoelasticity than the mode orthogonal to the interface considering the same evaporation time span.59 We also estimate that the excess pressure of the interface in the direction parallel to the interface increases by about 4 pN at t/T = 0.3.Author contributions
M. J., M. L. and R. V. performed the experiments, B. R. and D. K. S. designed the study; all authors analyzed the data and wrote the manuscript.Conflicts of interest
There are no conflicts to declare.Acknowledgements
We thank the Indian Institute of Technology, Madras, India for their seed and initiation grants to B. R. This work was also supported by the DBT/Wellcome Trust India Alliance Fellowship IA/I/20/1/504900 awarded to Basudev Roy.Notes and references
- B. P. Binks and T. S. Horozov, Angew. Chem., Int. Ed., 2005, 44, 3722–3725 CrossRef CAS PubMed.
- O. S. Deshmukh, D. van den Ende, M. C. Stuart, F. Mugele and M. H. Duits, Adv. Colloid Interface Sci., 2015, 222, 215–227 CrossRef CAS PubMed.
- R. McGorty, J. Fung, D. Kaz and V. N. Manoharan, Mater. Today, 2010, 13, 34–42 CrossRef CAS.
- D. M. Kaz, R. McGorty, M. Mani, M. P. Brenner and V. N. Manoharan, Nat. Mater., 2012, 11, 138–142 CrossRef CAS PubMed.
- P. Pieranski, Phys. Rev. Lett., 1980, 45, 569 CrossRef CAS.
- M. Jose, M. Mayarani, M. G. Basavaraj and D. K. Satapathy, Phys. Chem. Chem. Phys., 2021, 23, 7115–7124 RSC.
- P. P. Constantinides, Pharm. Res., 1995, 12, 1561–1572 CrossRef CAS PubMed.
- M. Levy and S. Benita, Int. J. Pharm., 1990, 66, 29–37 CrossRef CAS.
- C. Puglia and F. Bonina, Expert Opin. Drug Delivery, 2012, 9, 429–441 CrossRef CAS PubMed.
- H. D. Silva, M. Â. Cerqueira and A. A. Vicente, Food Bioprocess Technol., 2012, 5, 854–867 CrossRef CAS.
- J. Keddie and A. F. Routh, Fundamentals of Latex Film Formation: Processes and Properties, Springer Science & Business Media, 2010 Search PubMed.
- H. M. Van Der Kooij, G. T. Van De Kerkhof and J. Sprakel, Soft Matter, 2016, 12, 2858–2867 RSC.
- J. Vialetto, F. Camerin, F. Grillo, S. N. Ramakrishna, L. Rovigatti, E. Zaccarelli and L. Isa, ACS Nano, 2021, 15, 13105–13117 CrossRef CAS PubMed.
- Y. Xia, X. He, M. Cao, C. Chen, H. Xu, F. Pan and J. R. Lu, Biomacromolecules, 2013, 14, 3615–3625 CrossRef CAS PubMed.
- J. Kim, S. Nayak and L. A. Lyon, J. Am. Chem. Soc., 2005, 127, 9588–9592 CrossRef CAS PubMed.
- S. Tsuji and H. Kawaguchi, Langmuir, 2005, 21, 8439–8442 CrossRef CAS PubMed.
- J. Peng, D. Zhao, X. Tang, F. Tong, L. Guan, Y. Wang, M. Zhang and T. Cao, Langmuir, 2013, 29, 11809–11814 CrossRef CAS PubMed.
- B. M. Rey, R. Elnathan, R. Ditcovski, K. Geisel, M. Zanini, M.-A. Fernandez-Rodriguez, V. V. Naik, A. Frutiger, W. Richtering and T. Ellenbogen, et al., Nano Lett., 2016, 16, 157–163 CrossRef CAS PubMed.
- M. Á. Fernández-Rodríguez, R. Elnathan, R. Ditcovski, F. Grillo, G. M. Conley, F. Timpu, A. Rauh, K. Geisel, T. Ellenbogen and R. Grange, et al., Nanoscale, 2018, 10, 22189–22195 RSC.
- J. Mewis and N. J. Wagner, Colloidal Suspension Rheology, Cambridge University Press, 2012 Search PubMed.
- R. Miller and L. Liggieri, Interfacial Rheology, CRC Press, 2009, vol. 1 Search PubMed.
- A. Kandar, R. Bhattacharya and J. Basu, Phys. Rev. E: Stat., Nonlinear, Soft Matter Phys., 2010, 81, 041504 CrossRef CAS PubMed.
- R. Aveyard, B. Binks, J. Clint, P. Fletcher, T. Horozov, B. Neumann, V. Paunov, J. Annesley, S. Botchway and D. Nees, et al., Phys. Rev. Lett., 2002, 88, 246102 CrossRef CAS PubMed.
- M. Lokesh, R. Vaippully, V. P. Bhallamudi, A. Prabhakar and B. Roy, J. Phys. Commun., 2021, 5, 115016 CrossRef PubMed.
- K. Horigome and D. Suzuki, Langmuir, 2012, 28, 12962–12970 CrossRef CAS PubMed.
- C. Picard, P. Garrigue, M.-C. Tatry, V. Lapeyre, S. Ravaine, V. Schmitt and V. Ravaine, Langmuir, 2017, 33, 7968–7981 CrossRef CAS PubMed.
- M. Mayarani, M. G. Basavaraj and D. K. Satapathy, Langmuir, 2018, 34, 14294–14301 CrossRef CAS PubMed.
- S. Barman and G. F. Christopher, J. Rheol., 2016, 60, 35–45 CrossRef CAS.
- N. Jaensson and J. Vermant, Curr. Opin. Colloid Interface Sci., 2018, 37, 136–150 CrossRef CAS.
- F. Goodrich, J. Phys. Chem., 1962, 66, 1858–1863 CrossRef CAS.
- M. Kawaguchi, Prog. Polym. Sci., 1993, 18, 341–376 CrossRef CAS.
- X. Ji, X. Wang, Y. Zhang and D. Zang, Rep. Prog. Phys., 2020, 83, 126601 CrossRef CAS PubMed.
- Y. Feng, J. Goree and B. Liu, Phys. Rev. E: Stat., Nonlinear, Soft Matter Phys., 2012, 85, 066402 CrossRef PubMed.
- R. Cerf, J. Chem. Phys., 1952, 20, 395–402 CrossRef CAS.
- S. Paul, A. Kundu and A. Banerjee, J. Phys. Commun., 2019, 3, 035002 CrossRef CAS.
- J. P. Boon and S. Yip, Molecular Hydrodynamics, Courier Corporation, 1991 Search PubMed.
- W. Götze, Complex Dynamics of Glass-Forming Liquids: A Mode-Coupling Theory, OUP Oxford, 2008, vol. 143 Search PubMed.
- D. Y. Song and T. Q. Jiang, Rheol. Acta, 1998, 37, 512–517 CrossRef CAS.
- S. Paul, B. Roy and A. Banerjee, J. Phys.: Condens. Matter, 2018, 30, 345101 CrossRef PubMed.
- E. Schaffer, S. Norrelykke and J. Howard, Langmuir, 2007, 23, 3654–3665 CrossRef PubMed.
- R. Vaippully, V. Ramanujan, M. Gopalakrishnan, S. Bajpai and B. Roy, Soft Matter, 2020, 16, 7606–7612 RSC.
- Y. Cohin, M. Fisson, K. Jourde, G. G. Fuller, N. Sanson, L. Talini and C. Monteux, Rheol. Acta, 2013, 52, 445–454 CrossRef CAS.
- T. G. Mason and D. Weitz, Phys. Rev. Lett., 1995, 74, 1250 CrossRef CAS PubMed.
- T. Mason and D. Weitz, Phys. Rev. Lett., 1995, 75, 2770 CrossRef CAS PubMed.
- B. Felderhof, J. Chem. Phys., 2011, 134, 204910 CrossRef CAS PubMed.
- W. Götze and L. Sjögren, Phys. Rev. A: At., Mol., Opt. Phys., 1991, 43, 5442 CrossRef PubMed.
- I. De Schepper, H. Smorenburg and E. Cohen, Phys. Rev. Lett., 1993, 70, 2178 CrossRef CAS PubMed.
- X. Ji, X. Wang, Y. Zhang and D. Zang, Reports on Progress in Physics, 2020 Search PubMed.
- R. Miller, J. K. Ferri, A. Javadi, J. Krägel, N. Mucic and R. Wüstneck, Colloid Polym. Sci., 2010, 288, 937–950 CrossRef CAS.
- N. Jaensson and J. Vermant, Curr. Opin. Colloid Interface Sci., 2018, 37, 136–150 CrossRef CAS.
- I. Alshareedah, M. M. Moosa, M. Pham, D. A. Potoyan and P. R. Banerjee, Nat. Commun., 2021, 12, 6620 CrossRef CAS PubMed.
- M. D. Reichert, N. J. Alvarez, C. F. Brooks, A. M. Grillet, L. A. Mondy, S. L. Anna and L. M. Walker, Colloids Surf., A, 2015, 467, 135–142 CrossRef CAS.
- R. Pelton and P. Chibante, Colloids Surf., 1986, 20, 247–256 CrossRef CAS.
- M. Mayarani, M. G. Basavaraj and D. K. Satapathy, Nanoscale, 2017, 9, 18798–18803 RSC.
- R. Vaippully, D. Bhatt, A. D. Ranjan and B. Roy, Phys. Scr., 2019, 94, 105008 CrossRef CAS.
- R. Vaippully, M. Lokesh and B. Roy, J. Opt., 2021, 23, 094001 CrossRef.
- M. Lokesh, R. Vaippully, G. Nalupurackal, S. Roy, V. P. Bhallamudi, A. Prabhakar and B. Roy, RSC Adv., 2021, 11, 34636–34642 RSC.
- D. Bhatt, R. Vaippully, B. Kharbanda, A. D. Ranjan, R. Sulochana, V. Dharod, D. Satapathy and B. Roy, Opt. Express, 2019, 27, 31900–31912 CrossRef CAS PubMed.
- M. Jose, M. G. Basavaraj and D. K. Satapathy, Soft Matter, 2021, 17, 7921–7931 RSC.
Footnotes |
| † These authors contributed equally as first authors. |
| ‡ These authors contributed equally as corresponding authors. |
| This journal is © The Royal Society of Chemistry 2022 |

