
 Open Access Article
 This Open Access Article is licensed under a Creative Commons Attribution-Non Commercial 3.0 Unported Licence
Understanding the active sites of Fe–N–C materials and their properties in the ORR catalysis system†
Tanlun Wanga,
Chenxiang Suna,
Yong Yanb and
Fan Li *a
*a
aBeijing Key Laboratory for Catalysis and Separation, Department of Environment and Chemical Engineering, Beijing University of Technology, Beijing 100124, China. E-mail: vanadiumli@bjut.edu.cn
bBeijing Key Laboratory for Catalysis and Separation, Faculty of Environment and Life, Beijing University of Technology, Beijing 100124, China
First published on 25th March 2022
Abstract
Metal–N–C-based catalysts prepared by pyrolysis are frequently used in the oxygen reduction reaction (ORR). Zeolitic imidazolate frameworks (ZIFs), a type of metal organic framework (MOF), are selected as precursors due to their special structure and proper pore sizes. A series of Fe–N–C catalysts with different concentrations of 2-methylimidazole were prepared with a simple solvothermal-pyrolysis method, and the transformation productivity, morphology and ORR activity were investigated. It was found that the Fe–N–C catalyst with a 2-methylimidazole concentration of 0.53 mol L−1 had the best performance. In 0.1 M KOH solution, the half-wave potential was 0.852 V (vs. RHE), with the highest electrochemically active surface area (ECSA) of 94.1 cm2, and the ORR reaction was dominated by a 4-electron process. The current only decreased by 10.5% after 50![[thin space (1/6-em)]](https://www.rsc.org/images/entities/char_2009.gif) 000 s of chronoamperometry (CA), while the half-wave potential only decreased 20 mV in 3 M methanol. Additionally, this catalyst cannot be poisoned by Cl− and SO32− ions in the ORR process. Finally, some typical ions including SCN−, Fe(CN)63− and Fe(CN)64− were used to inhibit the active sites, and it was determined that Fe(II) is the real active species. The series of synthesis and testing experiments has significance in guiding optimization of the synthesis conditions and analysis of the mechanism of active sites in Fe–N–C materials.
000 s of chronoamperometry (CA), while the half-wave potential only decreased 20 mV in 3 M methanol. Additionally, this catalyst cannot be poisoned by Cl− and SO32− ions in the ORR process. Finally, some typical ions including SCN−, Fe(CN)63− and Fe(CN)64− were used to inhibit the active sites, and it was determined that Fe(II) is the real active species. The series of synthesis and testing experiments has significance in guiding optimization of the synthesis conditions and analysis of the mechanism of active sites in Fe–N–C materials.
1 Introduction
With society's increasing demand for energy, the energy crisis has become a worldwide problem. Development of a highly efficient energy conversion device is a promising way to solve this problem. Fuel cells (FCs) have attracted extensive attention worldwide due to their advantages of clean products, high energy density, and highly efficient energy conversion. Alkaline fuel cells (AFCs) and proton exchange membrane fuel cells (PEMFCs)1,2 are of particular interest due to their low operating temperature, which has more application prospects than other fuel cell designs. However, the sluggish ORR kinetics in the cathode have so far restricted their application and development. Therefore, the most effective catalysts of platinum group metals (PGMs) are typically selected to improve the cathode kinetic process. The main problem with PGM catalysts is the high price of Pt and its poor reserves in the Earth's crust,3 which demand that researchers investigate new catalysts. Among the PGM-free catalysts, transition metals coordinate with nitrogen and form a metal–Nx (M–Nx) site in the carbon skeleton, which has been investigated as a highly active site in the alkaline system of the ORR process4–7 and has the potential to replace PGMs as a catalyst in AFCs. Fe–N–C is regarded as one of the most active sites,8–10 while the abundant reserves and low price of Fe further indicate that Fe–N–C is worth investigating.MOF derivatives with high conductivity and a high number of M-N-C sites are obtained by pyrolysis and carbonization of MOFs.11,12 ZIFs, as typical MOF materials, are usually selected to synthesize M–N–C catalysts because of their high specific surface area, proper pore sizes and composition, structure and morphology, which are all easy to design.13–15 ZIF-8 has been widely investigated in ORR electrocatalysis. The current research focuses on the control of synthesis,10,16,17 design of pore patterns and morphology,18–21 multicomponent doping21–24 and composites with other materials25–28 to achieve catalysts with high performance, in addition to discussing the catalytic mechanism. For the optimization of synthesis conditions, research is focused on the type and dosage of metal and the process of heat treatment. However, there are a few reports on tuning the concentration of the precursor to change the morphology of the ZIF. Zhang and coworkers changed the volume of methanol and synthesized a series of Fe–N–C catalysts with different particle sizes.29 Their research showed that ORR activity is related to the particle sizes, which suggested that the influence of precursor concentrations on ORR activity can be used to optimize the synthesis conditions. The change in the volume of methanol can significantly affect the concentration of various precursors. Hence, variation of a single precursor is still worthy of investigation. On the other hand, some typical ions from the atmosphere and tap water, such as Cl− and SO32−, may have an attenuation effect on ORR activity in real FC conditions, but there are few studies on their effect on activity. Wang and coworkers selected poly-m phenylenediamine (PmPDA) to synthesize Fe–N–C catalysts.30 Their research showed that the Fe–N–C catalyst had a decrease in ORR half-wave potential with the addition of Cl− and SO32−. Whether this phenomenon appears in other types of Fe–N–C catalysts remains unknown. In addition, in the study of the active site of Fe–N–C catalysts, further research is needed to understand whether the different valence states of the Fe site have the same catalytic properties. Potassium thiocyanide, KSCN, is used as an inhibiting reagent for Fe sites, but the effect of this reagent on other valence states of Fe sites and the effect of other inhibiting reagents on Fe sites is still unclear. Despite the progress made in this field, it remains unclear which valence state of Fe provides the best ORR activity.
In this work, a simple solvothermal-pyrolysis combination method is used to synthesize FeNC catalysts with different concentrations of 2-methylimidazole, and the relationships between 2-methylimidazole concentration and productivity, phase, morphology and ORR performance are analysed to optimize the synthesis conditions. The change in ORR activity can be explained by the trend in productivity and surface state. The optimized product has a high half-wave potential, high durability, strong ability to resist methanol poisoning and good ORR catalytic kinetic performance. The addition of Cl− and SO32− in solution do not decrease the half-wave potential, but instead increase it, although the mechanism for this effect still needs further investigation. Instead of the typical SCN− ion used to inhibit Fe(III), Fe(CN)64− and Fe(CN)63− are used to block Fe(III) and Fe(II) sites, and the degree of half-wave potential attenuation confirms that Fe(II) is the real active site.
2 Experimental
2.1 Chemicals
Fe(acac)3 (98%, Shanghai Aladdin), Zn(NO3)2·6H2O (99%, YiLi Fine Chemicals), 2-methylimidazole (98%, Shanghai Aladdin), methanol (>99.5%, Tianjin DaMao), N,N-dimethylformamide (>99.5%, Tianjin DaMao), KOH (95%, Macklin), Na2S·9H2O (>98%, Shanghai Aladdin), NaCl (>99.5%, Beijing Chemical Works), Na2SO3 (>97%, Tianjin DaMao), KSCN (98%, Heowns), K3Fe(CN)6 (>99.5%, Sinopharm Chemical Regents), K4Fe(CN)6 (>99.5%, Tianjin FuChen), Nafion (5%, Sigma). All the chemicals were of AR grade and used as received without further purification. Commercial 20 wt% Pt/C electrocatalyst was supplied by Sigma Aldrich.2.2 Synthesis of catalyst
The molar quantities of 2-methylimidazole were varied to produce different samples at 12 mmol, 16 mmol, 24 mmol, 32 mmol and 36 mmol. The as-prepared ZIFs are named FeZIF-X (where X is the number of mmols of 2-methylimidazole). The carbonized samples are named Fe–NC-X (where X is the number of mmols of 2-methylimidazole).
2.3 Characterization methods
The phase identification of the powder samples was performed with X-ray diffraction (XRD, Smartlab 3) at a scan rate of 10 degrees (°) per min from 5° to 80° and confocal laser microscopy Raman spectroscopy (Raman, Renishaw) from 900 cm−1 to 2000 cm−1. The morphology was investigated by scanning electron microscopy (SEM, JSM-7900) and transmission electron microscopy (TEM, JEM-2100F). Valence states were analysed by X-ray photoelectron spectroscopy (XPS, ESCALAB 250Xi) with an Al Kα radiation source (note: the XPS results after the CA test of FeNC-24 were obtained without the addition of binder. The elemental composition was analysed by an inductively coupled plasma optical emission spectrometer (ICP-OES, Optima8300)).2.4 Electrochemical measurements
The electrochemical measurements were obtained in a three-electrode system, with the working electrode, a cylindrical glassy carbon electrode with a diameter of 5 mm, functioning as a rotating disk electrode (RDE, Pine AFMSRCE); the counter electrode, a carbon rod; the reference electrode, a Hg/HgO electrode in 0.1 M KOH and an electrolyte of 0.1 M KOH. The following experiments included cyclic voltammetry (CV), linear sweep voltammetry (LSV), chronoamperometry (CA) and Electrochemical Impedance Spectroscopy (EIS).Generally, a 6 mg Fe-NC-X powder sample (2 mg for commercial Pt/C) was prepared in a centrifuge tube. Then, 1 mL ethanol and 0.5 mL 0.2% Nafion ethanol solution were added to the powder with ultrasonic dispersion for 10 min to disperse them into a slurry. Then, 20 μL of slurry was added dropwise onto the glassy carbon electrode with a microsyringe and dried. The theoretical mass of FeNC catalysts on the electrode is 8.00 × 10⁻⁴ mg (2.67 × 10⁻⁴ mg for commercial Pt/C).
In the chronoamperometry (CA) test, a glassy carbon piece of 10 × 10 mm was used as the working electrode. The formulation of the electrode material slurry was dropwise added onto the electrode at 200 μL for each side.
3 Results and discussion
3.1 Phase and morphology analysis
Fig. 1(a) exhibits the XRD patterns of different FeZIFs. All samples demonstrated the same patterns with ZIF-8, indicating the similar crystal structure. The XRD patterns of FeNCs are shown in Fig. 1(b). Except mixed phase of Fe and Fe2O3 for FeNC-12, the other samples show no crystal phase structure. It demonstrates that the crystallinity of these samples are limited during the heat treatment at 900 °C for 3 h. While for FeNC-12, the difference might be attribute to the extremely low productivity (Fig. S1†) of its FeZIF, resulting in the higher molar ratio of Fe(acac)3 in the composite, which is favorable for the sintering of Fe species during the high-temperature process. Fig. 1(c) shows the Raman spectra of the typical three named as FeNC-16, 24, 32. The broad peaks around 1340 cm−1 and 1580 cm−1 attribute to the unordered carbon and ordered graphitic carbon. FeNC-24 has the highest peak ratio of ID/IG = 1.12, demonstrating the higher defects in carbon structure with the doping of N, Zn and Fe atoms, which is beneficial to its promotion in activity.32,33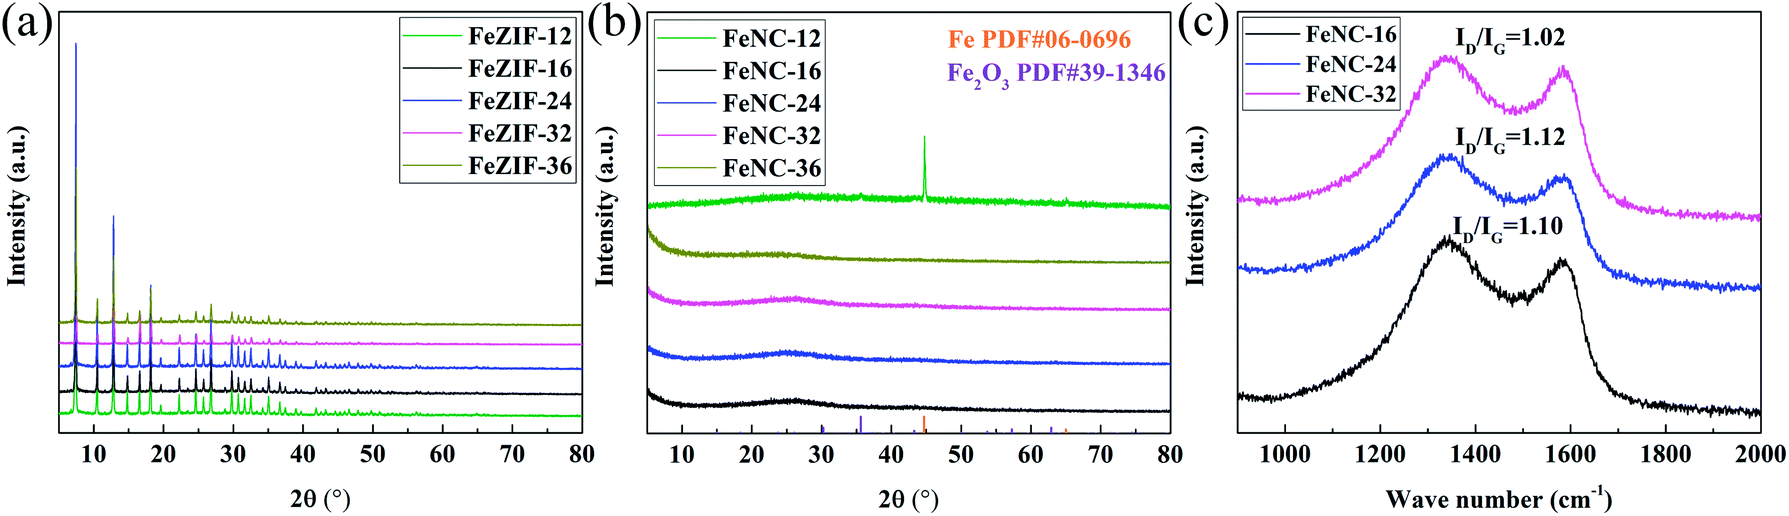 | ||
| Fig. 1 XRD patterns of different (a) FeZIFs and (b) FeNCs samples. (c) Raman spectra of FeNC-16, FeNC-24 and FeNC-32. The dosage of 2-methylimidazole are respectively 12 mmol, 16 mmol, 24 mmol, 32 mmol and 36 mmol and the molar ratio of Zn:Fe in all the samples are 10:1. | ||
The SEM images of FeNC-24 are shown in Fig. 2(a). It is observed that the achieved materials are in particles, uniformly distributed in this area. Fig. S2† shows SEM images and histogram of particle size distribution of typical FeNCs. The result of particle size distribution statistics show that the average sizes of such samples are less than 1 μm. Fig. S3† are SEM images of typical FeZIFs. The diameter of FeZIF particles are also uniformed, which demonstrates that FeNCs remain the dispersity of FeZIFs even after pyrolysis. As shown in Fig. S4(a),† the dispersity of FeZIF-12 is worse than typical FeZIFs. Pyrolyzed FeNC-12 shows a different morphology from other samples with the appearance of silk-liked structures around the morphology of ZIF-liked carbon (Fig. S4(b–d)†). The silk-liked structure corresponding to the carbon nano tubes (CNTs) which was formed with the catalyzing of sintered iron particles during the heat treatment.34,35 This result is consistent with XRD results.
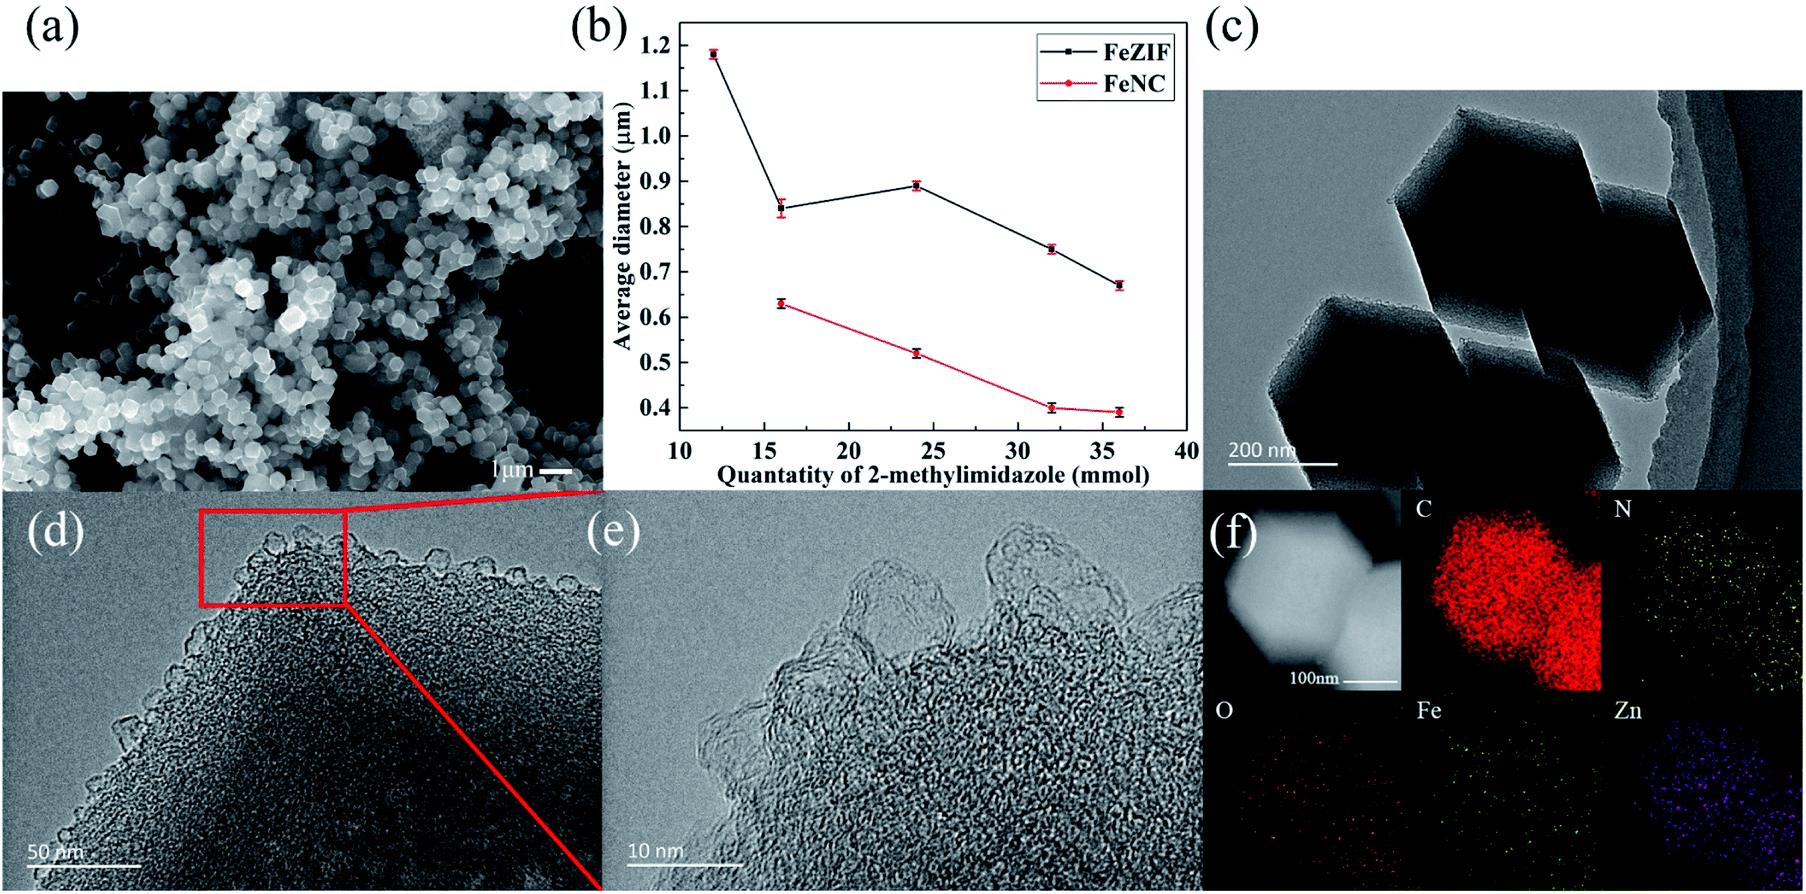 | ||
| Fig. 2 (a) The SEM image of FeNC-24, (b) average particle size distribution curves of FeZIFs and FeNCs, (c–e) the TEM images of FeNC-24 (f) the EDS image of FeNC-24. | ||
The summary of average sizes of FeZIFs and FeNCs are shown in Fig. 2(b). The average size of obtained FeZIF distribution from 1.18 μm to 0.67 μm while that counterpart of FeNC is from 0.63 μm to 0.39 μm. It can be observed that the average sizes of FeZIFs and FeNCs decrease with the increase of 2-methylimidazole dosage. It also can be discovered that the sizes of FeZIFs are larger than that counterpart of FeNCs, which might be caused by the consumption in volume and mass during the pyrolysis of ZIFs.
Fig. 2(c) is the TEM image of FeNC-24. The shape of these particles clearly indicate that carbonized samples remain the dodecahedral structure of ZIF-8. The result in Fig. 2(d and e) show the amorphous structure of FeNC-24 from the bulk to the surface. And the rough structure on the surface might appears during the evaporation of zinc in the ZIFs. Fig. S5† shows the image of FeNC-24 in high-angle annular dark-field scanning transmission electron microscopy (HAADF-STEM). No lightspots are observed, indicating metal particles does not existing in this sample, which manifests metal is not seriously sintered and formed in amorphous structure. Fig. 2(f) illustrates the energy dispersive spectrum (EDS) mapping of FeNC-24. The elements of C, N, O, Fe, Zn are equally dispersed in this material. The appearance of zinc in EDS demonstrate that part of zinc still remains in the material after heat treatment.
The XPS results are demonstrated in Fig. 3. For Fe species, the binding energy of Fe2+ 2p3/2, Fe3+ 2p3/2, Fe2+ 2p1/2, Fe3+ 2p1/2 respectively located at ∼711.5 eV, 714.5 eV, 724.5 eV, 727.5 eV, respectively (Fig. 3(a–c)). It can be observed that the valence state of Fe are in +2 and +3 in such samples, and the proportion of +2 is higher than +3, indicating Fe prefer +2 form after the process of heat treatment. For N species, the form of N in samples are in pyridine N, M (Fe or Zn)–N, pyrrole N, graphitic N, oxide N, the binding energy respectively assigned to ∼398.5 eV, 399.4 eV, 400.2 eV, 401.1 eV, 402.1 eV, respectively (Fig. 3(d–f)). The appearance of M–N indicates the coordination of metal and N. And in C 1 s pattern (Fig. S6†), C–N bond is observed, indicating the structure of M(Fe or Zn)–N–C is formed. The graphitic N have the ability in control the geometric and electronic structure of carbon framework36 and improve the limiting current density of ORR catalysts.33 Table S2† provide the atomic ratio of Fe measured by XPS and ICP-OES. FeNC-24 shows higher surface Fe atomic ratio than that of bulk. On the contrary, the trend of FeNC-16 and 32 are distinct. Generally, XPS can measure the metal distribution on surface while ICP-OES measure that counterpart of bulk. The data in this table cannot give consistent result among the three samples, which might be caused by the inhomogeneity of MOF samples after pyrolysis at high temperature.
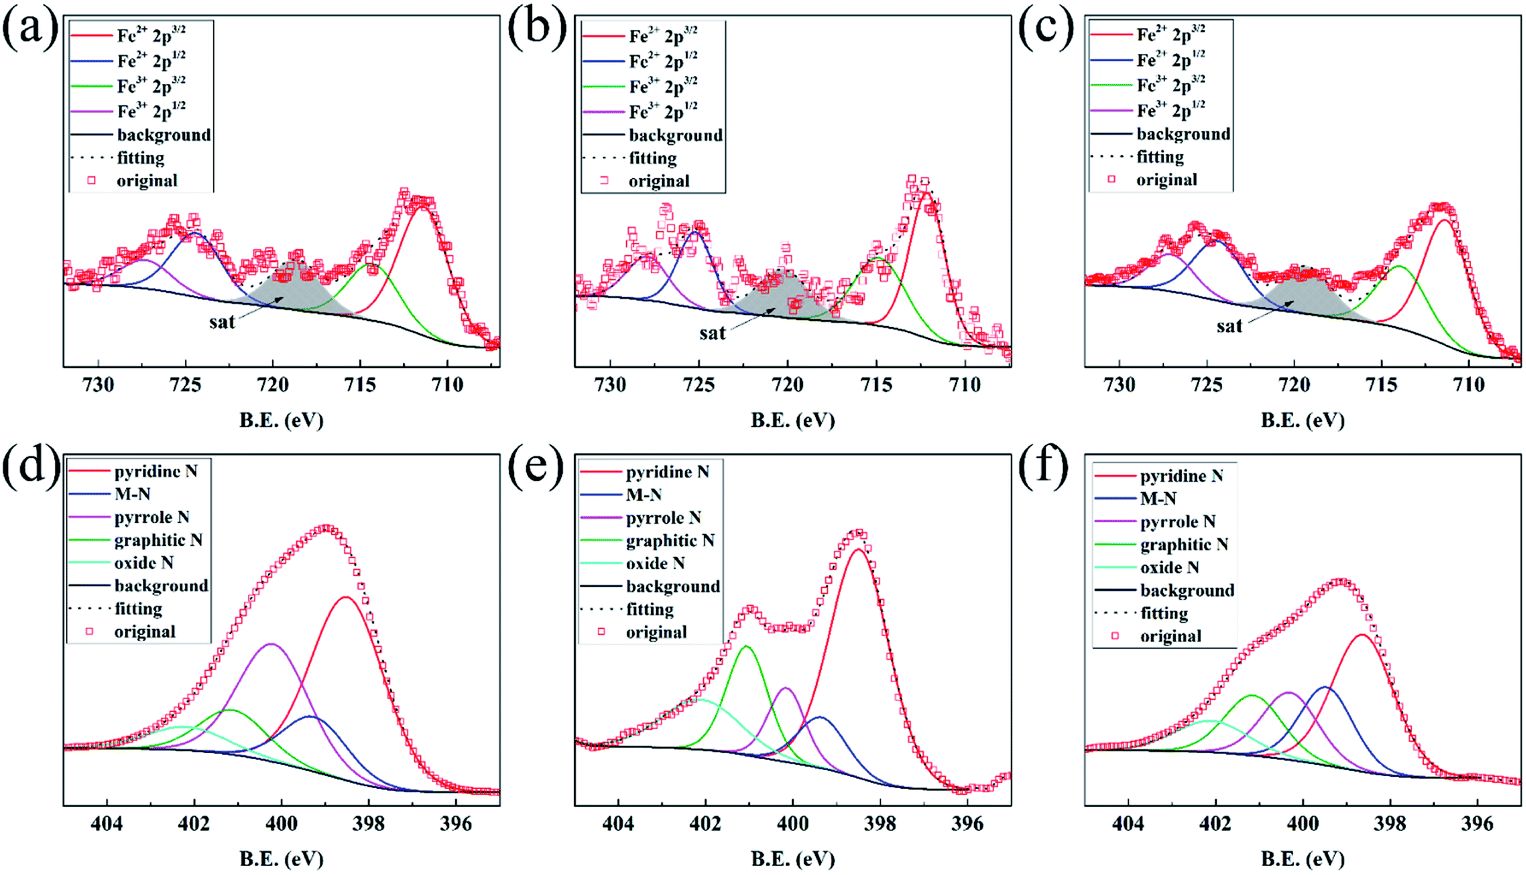 | ||
| Fig. 3 The XPS patterns of Fe 2p for (a) FeNC-16, (b) FeNC-24, (c) FeNC-32. N 1s for (d) FeNC-16, (e) FeNC-24, (f) FeNC-32. | ||
3.2 Electrochemical properties and analysis
The electrochemical properties of FeNC-X, NC-24, Pt/C samples are tested in 0.1 mol L−1 KOH solution. For CV and LSV tests, argon is saturated in electrolyte solution to ensure sample activated in the non-oxygen solution. Then, ORR activity is measured in oxygen saturated electrolyte. For stability tests, oxygen is saturated in electrolyte solution and kept plugging in electrolyte.The LSV curves of FeNC-16, 24, 32, NC-24 and Pt/C are shown in Fig. 4(a). The half-wave potential of FeNC-24 is 0.852 V, which is 9 mV lower than that of commercial Pt/C(0.861 V) and is the best among the three typical FeNCs. NC-24 has much lower half-wave-potentials than FeNCs, demonstrating Fe might play the key roles in ORR electrocatalysis.
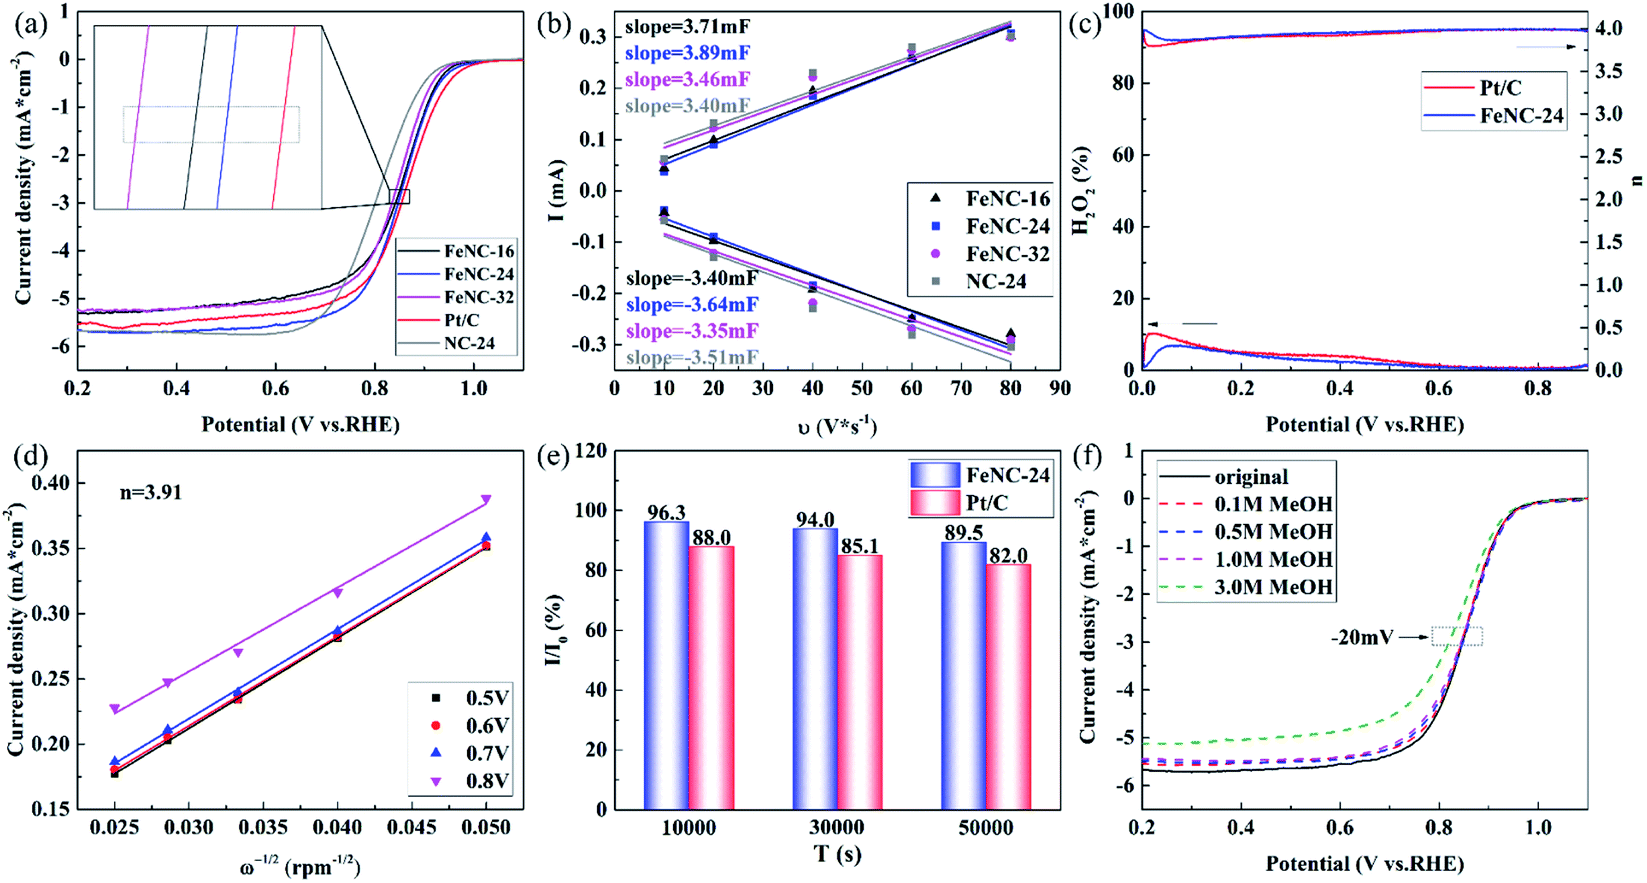 | ||
| Fig. 4 (a) The LSV curves of FeNC-16, 24, 32, NC-24 and Pt/C in 0.1 M O2-saturated KOH solution in 1600 rpm. (b) ECSA fitting results of FeNC-16, 24, 32, NC-24. (c) Productivity of H2O2 and electron transfer number of FeNC-24 and Pt/C. (d) K–L equation fitting of FeNC-24. (e) The current attenuation rate of FeNC-24 and Pt/C in CA test. (f)The LSV curves of FeNC-24 in 0.1 M O2-saturated KOH solution in 1600 rpm with methanol at different concentrations (0 M, 0.1 M, 0.5 M, 1.0 M and 3.0 M). | ||
As shown in Fig. S7,† the FeNC-24 has the best ORR activity among all FeNCs. The half-wave potential of FeNCs first increased and then decreased with the increase of 2-methylimidazole dosage. Combined with production and morphology, it might be explained that: when the dosage of 2-methylimidazole is to a low level, the larger particle size of Fe will be obtained during the heat treatment, which is a negative factor for ORR. On the other hand, the much higher dosage of 2-methylimidazole will induce the extremely high production of ZIF, leading to the decrease of the density of Fe active sites, which is also unfavorable for ORR. The medium dosage of 2-methylimidazole will lead to the reasonable particle sizes and production, which is beneficial to the ORR catalyst.
The ECSA fitting of such samples is shown in Fig. 4(b). The original curves are exhibited in Fig. S8.† The value of ECSA is calculated in Table S3.† It is demonstrated that FeNC-24 has the highest ECSA among these materials, which might provide more redox sites for ORR catalysis.
The electron transfer number and yield of H2O2 are measured in RRDE test (Fig. 4(c)). The electron transfer number is close to 4, demonstrating ORR is basically a four-electron process. The productivity of H2O2 is blow to 10% even in the apex of the curve for both FeNC-24 and Pt/C. The result of K-L equation fitting also support above conclusion (Fig. 4(d) and S9†). The calculated average electron transfer number is 3.91, which is in accordance with RRDE curve results.
The CA data is shown in Fig. 4(e). The current density decrease with increasing of time. At 10000 s, 30000 s and 50000 s, the retention rates of current are respectively 96.3%, 94.0% and 89.5% for FeNC-24. And that counterpart of Pt/C are 88.0%, 85.1% and 82.0% (The original curves are shown in Fig. S10.†) For each times, FeNC-24 has higher retention rate of current than that of Pt/C, demonstrating FeNC-24 is much better durability than that of commercial Pt/C. The TEM and EDS-mapping image of FeNC-24 after CA test is shown in Fig. S11.† It is clear that catalysts still remain the similar morphology and components as original after stability test. These results indicate the excellent durability of FeNC-24, and the change of carbon framework is negligible during the CA test.
Fig. 4(f) exhibits the LSV curve of FeNC-24 with the addition of different concentration of methanol. The half-wave potential and limiting diffusion current density decrease with increasing of methanol concentration. In the electrolyte with 3 M methanol, the half-wave potential left shifted∼20 mV. In contrast with commercial Pt/C (Fig. S12†), the decrease of FeNC-24 is slight. Therefore it is suggested that FeNC-24 has satisfactory tolerance toward methanol. A previous research37 demonstrate that FeNC sites has no activity in catalyzing the decomposition of small molecule alcohols, that is distinct with some noble metals. The poisoning of FeNC material is caused by the lower conductivity of solution with the addition of methanol and the blockage of pathway in ORR. The pores of FeNC-24 are not blocked by the methanol, presenting the less degree of activity.
The Tafel plot of such samples are presented in Fig. S13.† Except NC-24, FeNC samples in this graph have lower slope in the selected scope than commercial Pt/C, proving that FeNCs electrode possess better kinetic of ORR. And the EIS plots and equivalent circuit of FeNCs are shown in Fig. S14.† The solution resistances(Rs) are same while the polarization resistances (Rp) of FeNC-16, 24, 32 are respectively 294 Ω, 201 Ω, 160 Ω. The Rp decrease with the increase of the dosage of 2-methylimidazole. It is attribute to the increase of productivity, improving the amount of carbon in FeNC, which promoting the conductivity of FeNC.
Some typical ions are added into the electrolyte to simulate the electrochemical environment in PEMFC. As shown in Fig. S15(a),† with the added of 1 mM SO32−, a very-slight positive shift (4 mV) is observed in half-wave potential of FeNC-24, indicating that SO32− has no obvious toxic effect to this material. This very-slight improvement in half-wave potential is caused by the increase in the concentration of conductive ions. There is a larger increase in activity with the addition of Cl−(Fig. S15(b)†). It possible relate to the pitting mechanism in a previous research in steel corrosion.38 The effect in ORR activity of SO32− and Cl− is widely divergent with Wang and co-workers' experiments,30 demonstrating that the real impact and mechanism of poisoning toxic ions in different systems of FeNC material are highly important.
From the electrochemical measurements, Fe components are usually considered as important active sites for ORR activity. For XPS results, Fe could be divided into two valence of +2 and +3. Hence, the addition of complex ions are used to investigated which valence is the real active site for ORR. The LSV curves are shown in Fig. S16.† SCN− is added to block Fe(III), which shows that it has no affect in half-wave potential. It is proposed that Fe(II) might be the real source of activity rather than Fe(III). Fe(CN)63− is chosen to block Fe(II); on the other hand, Fe(CN)64− is applied to block Fe(III). The obtained results reveal that the half-wave potential has a negative shift about 30 mV with the addition of Fe(CN)63− while that counterpart of Fe(CN)64− is only 7 mV. This significant gap in activity can reasonable prove that Fe(II) is the centre of activity. In addition, it observed in ion experiment is the difference of SCN− and Fe(CN)64− in reducing the half-wave potential. It might be attribute to the oxidation of Fe(CN)64− in ORR process. As exhibit in Fig. S17,† the colour of the solution of 1 mM Fe(CN)64− changes from colourless into pale yellow after ORR test. While the electrolyte with 1 mM Fe(CN)63− is deep yellow, demonstrating some of Fe(CN)64− oxides into Fe(CN)63−, which blocks Fe(II), caused the small negative shift in half-wave potential. Some researches11,39–41 demonstrate that KSCN has powerful ability in reducing the activity of Fe active sites. To sum up, for FeNC materials in different electron structure, skeleton structure and in even micro area environment, the real active site should to be analysed in specific circumstance.
The change in half-wave potential is summarized in Fig. 5(a). The XPS result of FeNC-24 after CA test is shown in Fig. 5(b). The valence states of Fe are still in +2 and +3 state, and +2 state is also the main valence state in the sample, which indicating the change in surface valence state of Fe is little after the CA test. Thus, the result of ion experiments is still applicable to sample after durability test.
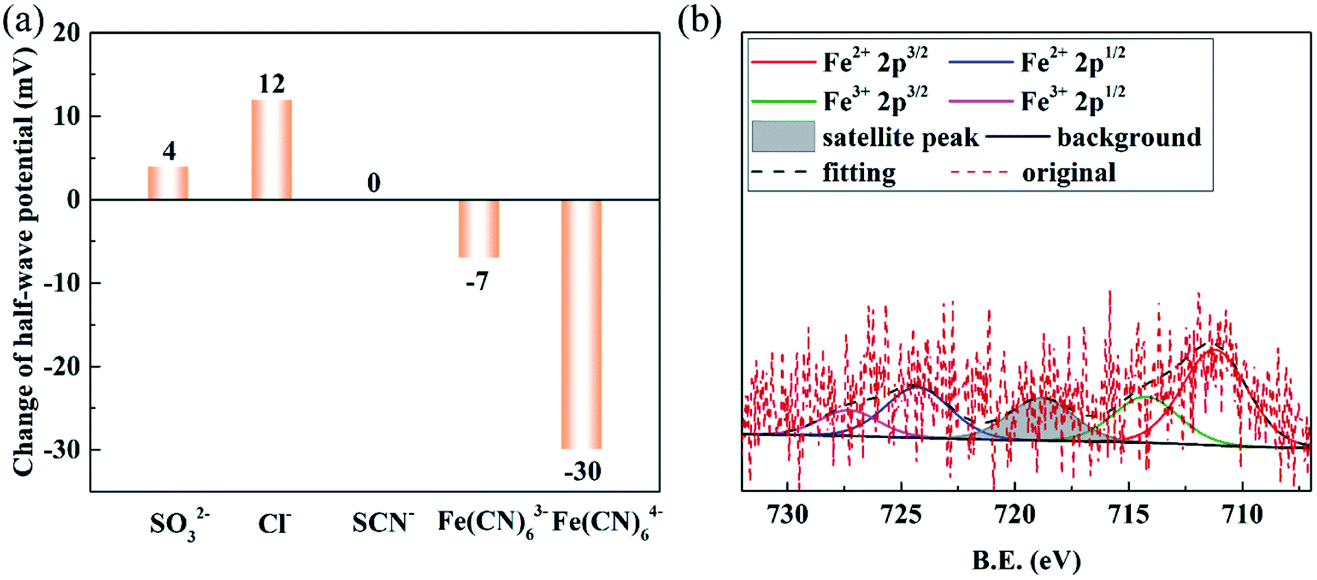 | ||
| Fig. 5 The change in half-wave potential with the addition of some typical ions (a); the Fe 2p XPS result of FeNC-24 after CA test (b). | ||
4 Conclusions
A series of FeNC materials were synthesized by solvothermal-pyrolysis method with different dosage of 2-methylimidazole in this work.No obvious crystalline structure was observed in these materials. And the N and metal atoms doped in carbon skeleton to form lots of defects and FeNC active sites. In addition, the particle sizes of FeNCs were uniformed and could be controlled by the dosage of 2-methylimidazole to some extent. Electrochemical measurements demonstrated that the ORR activity of samples increased first and then decreased with the increasing of 2-methylimidazole.
FeNC-24 had the highest half-wave potential of 0.852 V and ECSA among FeNCs. The half wave potential of FeNC-24 was only 9 mV lower than that of Pt/C. On the other hand, it also had favourable stability of ORR. The CA tests in the 50000 s, retention rate of current density is 89.5%, and the morphology had no distinct difference after CA test. The tolerance of methanol test indicated the decrease in half-wave potential of FeNC-24 was only 20 mV in 3 M methanol, which was much lower than that of Pt/C. And the Tafel slope was 122.6 mV dec−1, lower than Pt/C. Meanwhile, the ORR activity cannot be decreased by Cl−, SO32− pollution ions.
The block test of activity sites indicated that Fe(II) was an important active site, while the valence state had no change after the ORR test.
In this research, the synthesis conditions was optimized, and the real iron active species were revealed by the experiment of complex ions, which provided a new thinking and methods in the research of FeNC materials.
Conflicts of interest
There are no conflicts to declare.Acknowledgements
This work was supported by nature science foundation of China (NSFC 52074016 and 21905010) for their financial support.References
- R. Raza, N. Akram, M. S. Javed, A. Rafique, K. Ullah, A. Ali, M. Saleem and R. Ahmed, Renewable Sustainable Energy Rev., 2016, 450–461 CrossRef.
- Y. Wang, B. Seo, B. Wang, N. Zamel, K. Jiao and X. C. Adroher, Energy and AI, 2020, 2666–5468 Search PubMed.
- S. T. Thompson and D. Papageorgopoulos, Nat. Catal., 2019, 7, 558–561 CrossRef.
- Y. Chen, S. Ji, S. Zhao, W. Chen, J. Dong, W. C. Cheong, R. Shen, X. Wen, L. Zheng, A. I. Rykov, S. Cai, H. Tang, Z. Zhuang, C. Chen, Q. Peng, D. Wang and Y. Li, Nat. Commun., 2018, 1, 5422 CrossRef PubMed.
- X. X. Wang, D. A. Cullen, Y. T. Pan, S. Hwang, M. Wang, Z. Feng, J. Wang, M. H. Engelhard, H. Zhang, Y. He, Y. Shao, D. Su, K. L. More, J. S. Spendelow and G. Wu, Adv. Mater., 2018, 11, 1706758 CrossRef PubMed.
- J. Li, M. Chen, D. A. Cullen, S. Hwang, M. Wang, B. Li, K. Liu, S. Karakalos, M. Lucero, H. Zhang, C. Lei, H. Xu, G. E. Sterbinsky, Z. Feng, D. Su, K. L. More, G. Wang, Z. Wang and G. Wu, Nat. Catal., 2018, 12, 935–945 CrossRef.
- F. Li, G.-F. Han, H.-J. Noh, S.-J. Kim, Y. Lu, H. Y. Jeong, Z. Fu and J.-B. Baek, Energy Environ. Sci., 2018, 8, 2263–2269 RSC.
- L. Zhao, Y. Zhang, L. B. Huang, X. Z. Liu, Q. H. Zhang, C. He, Z. Y. Wu, L. J. Zhang, J. Wu, W. Yang, L. Gu, J. S. Hu and L. J. Wan, Nat. Commun., 2019, 1, 1278 CrossRef PubMed.
- N. R. Sahraie, U. I. Kramm, J. Steinberg, Y. Zhang, A. Thomas, T. Reier, J. P. Paraknowitsch and P. Strasser, Nat. Commun., 2015, 8618 CrossRef CAS PubMed.
- Y. Li, P. Zhang, L. Wan, Y. Zheng, X. Qu, H. Zhang, Y. Wang, K. Zaghib, J. Yuan, S. Sun, Y. Wang, Z. Zhou and S. Sun, Adv. Funct. Mater., 2021, 15, 2009645 CrossRef.
- D. Xu, Y. Fu, D. Xiao, X. Li, Y. Wang, K. Li, Z. Li, L. Zheng and X. Zuo, RSC Adv., 2021, 15, 8437–8443 RSC.
- Y. Zhou, X. Tao, G. Chen, R. Lu, D. Wang, M. X. Chen, E. Jin, J. Yang, H. W. Liang, Y. Zhao, X. Feng, A. Narita and K. Mullen, Nat. Commun., 2020, 1, 5892 CrossRef PubMed.
- A. Kirchon, L. Feng, H. F. Drake, E. A. Joseph and H. C. Zhou, Chem. Soc. Rev., 2018, 23, 8611–8638 RSC.
- S. Dang, Q. L. Zhu and Q. Xu, Nat. Rev. Mater., 2017, 1, 17075 Search PubMed.
- J. Du, F. Li and L. Sun, Chem. Soc. Rev., 2021, 4, 2663–2695 RSC.
- R. Jiang, L. Li, T. Sheng, G. Hu, Y. Chen and L. Wang, J. Am. Chem. Soc., 2018, 37, 11594–11598 CrossRef PubMed.
- J. Li, H. Zhang, W. Samarakoon, W. Shan, D. A. Cullen, S. Karakalos, M. Chen, D. Gu, K. L. More, G. Wang, Z. Feng, Z. Wang and G. Wu, Angew. Chem., Int. Ed. Engl., 2019, 52, 18971–18980 CrossRef PubMed.
- X. Zhang, X. Han, Z. Jiang, J. Xu, L. Chen, Y. Xue, A. Nie, Z. Xie, Q. Kuang and L. Zheng, Nano Energy, 2020, 104547 CrossRef CAS.
- M. Qiao, Y. Wang, Q. Wang, G. Hu, X. Mamat, S. Zhang and S. Wang, Angew. Chem., Int. Ed. Engl., 2020, 7, 2688–2694 CrossRef PubMed.
- J. Yan, X. Zheng, C. Wei, Z. Sun, K. Zeng, L. Shen, J. Sun, M. H. Rümmeli and R. Yang, Carbon, 2021, 320–328 CrossRef CAS.
- Z. Zhu, H. Yin, Y. Wang, C. H. Chuang, L. Xing, M. Dong, Y. R. Lu, G. Casillas-Garcia, Y. Zheng, S. Chen, Y. Dou, P. Liu, Q. Cheng and H. Zhao, Adv. Mater., 2020, 42, 2004670 CrossRef PubMed.
- B. Zhong, L. Zhang, J. Yu and K. Fan, J. Colloid Interface Sci., 2019, 113–121 CrossRef CAS PubMed.
- Y.-J. Wu, X.-H. Wu, T.-X. Tu, P.-F. Zhang, J.-T. Li, Y. Zhou, L. Huang and S.-G. Sun, Appl. Catal., B, 2020, 119259 CrossRef CAS.
- Z. Lu, B. Wang, Y. Hu, W. Liu, Y. Zhao, R. Yang, Z. Li, J. Luo, B. Chi, Z. Jiang, M. Li, S. Mu, S. Liao, J. Zhang and X. Sun, Angew. Chem., Int. Ed. Engl., 2019, 9, 2622–2626 CrossRef PubMed.
- Y. Pan, K. Sun, S. Liu, X. Cao, K. Wu, W. C. Cheong, Z. Chen, Y. Wang, Y. Li, Y. Liu, D. Wang, Q. Peng, C. Chen and Y. Li, J. Am. Chem. Soc., 2018, 7, 2610–2618 CrossRef PubMed.
- X.-L. Chen, L.-S. Ma, W.-Y. Su, L.-F. Ding, H.-B. Zhu and H. Yang, Electrochim. Acta, 2020, 135273 CrossRef CAS.
- W. Zhu, Y. Pei, J. C. Douglin, J. Zhang, H. Zhao, J. Xue, Q. Wang, R. Li, Y. Qin, Y. Yin, D. R. Dekel and M. D. Guiver, Appl. Catal., B, 2021, 120656 CrossRef CAS.
- H. Chen, K. Shen, J. Chen, X. Chen and Y. Li, J. Mater. Chem. A, 2017, 20, 9937–9945 RSC.
- H. Zhang, S. Hwang, M. Wang, Z. Feng, S. Karakalos, L. Luo, Z. Qiao, X. Xie, C. Wang, D. Su, Y. Shao and G. Wu, J. Am. Chem. Soc., 2017, 40, 14143–14149 CrossRef PubMed.
- Q. Wang, Z. Y. Zhou, Y. J. Lai, Y. You, J. G. Liu, X. L. Wu, E. Terefe, C. Chen, L. Song, M. Rauf, N. Tian and S. G. Sun, J. Am. Chem. Soc., 2014, 31, 10882–10885 CrossRef PubMed.
- Y. Chen, S. Ji, Y. Wang, J. Dong, W. Chen, Z. Li, R. Shen, L. Zheng, Z. Zhuang, D. Wang and Y. Li, Angew. Chem., Int. Ed. Engl., 2017, 24, 6937–6941 CrossRef PubMed.
- J. Huo, L. Lu, Z. Shen, Y. Liu, J. Guo, Q. Liu, Y. Wang, H. Liu, M. Wu and G. Wang, J. Mater. Chem. A, 2020, 32, 16271–16282 RSC.
- J. Han, X. Meng, L. Lu, J. Bian, Z. Li and C. Sun, Adv. Funct. Mater., 2019, 41, 1808872 CrossRef.
- P. Zhao, H. Nie, J. Yu, J. Wang and G. Cheng, Inorg. Chem. Front., 2018, 10, 2546–2553 RSC.
- J. Jia, H. Yang, G. Wang, P. Huang, P. Cai and Z. Wen, ChemElectroChem, 2018, 3, 471–477 CrossRef.
- J. Zhu, H. Zhou, C. Zhang, J. Zhang and S. Mu, Nanoscale, 2017, 35, 13257–13263 RSC.
- Y.-C. Wang, Y.-J. Lai, L.-Y. Wan, H. Yang, J. Dong, L. Huang, C. Chen, M. Rauf, Z.-Y. Zhou and S.-G. Sun, ACS Energy Lett., 2018, 6, 1396–1401 CrossRef.
- Y. Li, J. Wu, D. Zhang, Y. Wang and B. Hou, J. Solid State Electrochem., 2010, 9, 1667–1673 CrossRef.
- J.-D. Yi, R. Xu, Q. Wu, T. Zhang, K.-T. Zang, J. Luo, Y.-L. Liang, Y.-B. Huang and R. Cao, ACS Energy Lett., 2018, 4, 883–889 CrossRef.
- M. X. Chen, M. Zhu, M. Zuo, S. Q. Chu, J. Zhang, Y. Wu, H. W. Liang and X. Feng, Angew. Chem., Int. Ed. Engl., 2020, 4, 1627–1633 CrossRef PubMed.
- Z. Tan, H. Li, Q. Feng, L. Jiang, H. Pan, Z. Huang, Q. Zhou, H. Zhou, S. Ma and Y. Kuang, J. Mater. Chem. A, 2019, 4, 1607–1615 RSC.
Footnote |
| † Electronic supplementary information (ESI) available. See DOI: 10.1039/d2ra00757f |
| This journal is © The Royal Society of Chemistry 2022 |