
 Open Access Article
 This Open Access Article is licensed under a
 Creative Commons Attribution 3.0 Unported Licence
Pd–Pd/PdO as active sites on intercalated graphene oxide modified by diaminobenzene: fabrication, catalysis properties, synergistic effects, and catalytic mechanism†
Zihan Li‡
a,
Erran Song‡a,
Ruirui Ren a,
Wuduo Zhaoa,
Tiesheng Li*a,
Minghua Liu*bc and
Yangjie Wua
a,
Wuduo Zhaoa,
Tiesheng Li*a,
Minghua Liu*bc and
Yangjie Wua
aCollege of Chemistry and Molecular Engineering, Zhengzhou University, Kexuedadao 100, Zhengzhou, 450001, P. R. China. E-mail: lts34@zzu.edu.cn; Fax: (+)86-371-67766667
bHenan Institute of Advanced Technology, Zhengzhou University, Kexuedadao 100, Zhengzhou 450001, Henan Province, P. R. China
cBeijing National Laboratory for Molecular Science, Institute of Chemistry, Chinese Academy of Sciences, Zhongguancun North First Street 2, Beijing 100190, P. R. China
First published on 18th March 2022
Abstract
Pd–Pd/PdO nanoclusters well dispersed on intercalated graphene oxide (GO) (denoted as GO@PPD–Pd) were prepared and characterized. GO@PPD–Pd exhibited high catalytic activity (a TOF value of 60![[thin space (1/6-em)]](https://www.rsc.org/images/entities/char_2009.gif) 705 h−1) during the Suzuki coupling reaction, and it could be reused at least 6 times. The real active centre was Pd(200)–Pd(200)/PdO(110, 102). A change in the Pd facets on the surface of PdO was a key factor leading to deactivation, and the aggregation and loss of active centres was also another important reason. The catalytic mechanism involved heterogeneous catalysis, showing that the catalytic processes occurred at the interface, including substrate adsorption, intermediate formation, and product desorption. The real active centres showed enhanced negative charge due to the transfer of electrons from the carrier and ligands, which could effectively promote the oxidative addition reaction, and Pd(200) and the heteroconjugated Pd/PdO interface generated in situ also participated in the coupling process, synergistically boosting activity. Developed GO@PPD–Pd was a viable heterogeneous catalyst that may have practical applications owing to its easy synthesis and stability, and this synergistic approach can be utilized to develop other transition-metal catalysts.
705 h−1) during the Suzuki coupling reaction, and it could be reused at least 6 times. The real active centre was Pd(200)–Pd(200)/PdO(110, 102). A change in the Pd facets on the surface of PdO was a key factor leading to deactivation, and the aggregation and loss of active centres was also another important reason. The catalytic mechanism involved heterogeneous catalysis, showing that the catalytic processes occurred at the interface, including substrate adsorption, intermediate formation, and product desorption. The real active centres showed enhanced negative charge due to the transfer of electrons from the carrier and ligands, which could effectively promote the oxidative addition reaction, and Pd(200) and the heteroconjugated Pd/PdO interface generated in situ also participated in the coupling process, synergistically boosting activity. Developed GO@PPD–Pd was a viable heterogeneous catalyst that may have practical applications owing to its easy synthesis and stability, and this synergistic approach can be utilized to develop other transition-metal catalysts.
1. Introduction
Palladium catalysts are widely used during C–C coupling reactions, such as Suzuki,1 Heck,2 and Sonogashira3 reactions, which have been extensively studied.4,5 The Suzuki–Miyaura cross-coupling reaction can be used to synthesize numerous organic compounds, including pharmaceuticals, herbicides, natural products, intermediates, and conductive polymers,6–9 and therefore it is considered to be one of the most effective transformations.10 As we know, homogeneous palladium catalysts exhibit high selectivity and good dispersion in solvents, and they can be easily synthesized. However, they are difficult to separate from reaction mixtures, restricting their use in industrial production due to high costs and potential heavy-metal pollution.11–13 Therefore, there is an urgent need to develop more effective and environmentally friendly catalysts.Heterogeneous catalysts with high activity have aroused the interest of researchers in recent years, and they can be reused following simple filtration and centrifugation.14–17 The catalytic properties of a heterogeneous catalyst depend on the active composition, the structure of the catalyst, and the used support.18 Palladium catalysts supported on solid materials have been reported, with supports such as carbon materials,19–21 mesoporous silica materials,22–24 polymers,25–27 metal–organic frameworks,28 and metallic oxides.29–35 Among the different supports used, graphene oxide (GO) has been the subject of intense interest because of its inimitable structural and electronic properties.36–40 Additionally, the abundant functional groups on the surface of GO facilitate the covalent modification of the surface to improve the stability of associated catalysts.41–43 Moreover, the two-dimensional structure of graphene oxide facilitates the dispersion of organic substrate molecules and promotes catalytic reactions.44 These characteristics lead to a broad development space in areas such as heterogeneous catalysis, sensors, solar cells, and gas storage.45–49 Yang et al. synthesized polydispersed graphene sheets modified with an amine derivative,50 and the amine-functionalized graphene oxide can stabilize metal nanoparticles and distribute them well, avoiding aggregation and thus increasing the catalytic activity.51–56 Recently, Ma et al. prepared a graphene-based Pd hybrid catalyst modified with DNA (called DNA–G–Pd), which could chelate Pd via dative bonding, showing enhanced catalytic activity toward the Suzuki reaction.57 In recent years, three-dimensional graphene frameworks with porous structures have become ideal carriers for preparing heterogeneous catalysts, having a large specific surface area, adjustable porosity, controlled active site growth, and high stability.58–60 As we know, utilizing a covalent-bond-based structure assisted by ligands acting as linkers is a possible strategy for improving the stability of three-dimensional graphene materials and avoiding the aggregation of nanoparticles.61–63 Yuan et al. developed a novel way to encapsulate Pd nanoparticles inside a GO framework, using covalent intercalation with benzene-1,4-diboronic acid, resulting in a periodic layered structure and high activity toward the Suzuki coupling reaction.64 In the case of using metal oxides as supports, it is still a challenge to obtain Pd–metal oxide stability at the interface due to interconvertibility, while metal oxide surfaces exhibit good selectivity toward different substrates. Strong metal–support interaction can be strongly influenced by reducible oxide supports, and this can also concomitantly boost activity.29–36 Considering that a combination of Pd–Pd/PdO with intercalated GO might play a key role in catalysis, it is plausible to postulate what is the most suitable way to enhance catalytic activity and stability in a controlled manner.
Self-assembly is usually used to construct desired structures, offering controllable orientation and thickness, and stable monolayers, allowing the catalytic activity to be enhanced.65–76 Therefore, using self-assembly between a suitable ligand and GO to construct layered monolayers is expected to help with the immobilization, stabilization, and good distribution of Pd–metal oxide nanoclusters, offering an ideal catalytic surface for understanding what is truly happening at the interface.
In this work, a simple approach for preparing Pd–metal oxide supported by diamino-modified GO was reported. The catalytic activity, structure of active centres, and catalytic mechanism were investigated in detail, using the Suzuki coupling reaction as a template.
2. Experimental
2.1 Chemical reagents
All chemical reagents were obtained from different commercial sources and used without further purification.2.2 Characterization
X-ray diffraction (XRD) patterns were obtained using a PAN analytical X-Pert PRO instrument. Fourier-transform infrared spectroscopy (FTIR) analysis was carried out using a BRUKER TENSOR FTIR spectrometer using KBr pellets in the range of 400–4000 cm−1 with a resolution of 4 cm−1. Raman spectra were obtained using a Thermo Scientific DXR Raman microscope with an excitation laser wavelength of 532 nm. X-ray photoelectron spectroscopy (XPS) analysis was carried out using an ESCALab220i-XL electron spectrometer from VG Scientific with 300 W Al Kα radiation. Scanning electron microscopy (SEM) images were recorded using a Hitachi S-4800 system. Transmission electron microscopy (TEM) images were obtained using a JEM-2100F transmission electron microscope operating at 200 kV. The size distributions of palladium nanoparticles were calculated from representative TEM images at a constant magnification based on 100 randomly selected nanoparticles. The Pd content was measured using ICAP 6000 Series apparatus (Thermo Scientific). SBET data from the as-prepared catalyst were obtained based on N2 adsorption–desorption data and BET measurements (ASAP2020, Micromeritics, USA). Electrochemical impedance spectra (EIS) were obtained using a three-electrode system (CHI660, CH Instrument, USA). During these experiments, 0.1 M aqueous Na2SO4 was used as an electrolyte, and a Ni foam electrode fully covered with the as-obtained catalyst was used as the working electrode. Thermogravimetric analysis (TGA) was carried out using an STA 409 PC Thermal Analyzer under a nitrogen atmosphere in the range of 30–800 °C at a heating rate of 10°C min−1. 1H-NMR and 13C-NMR spectra were recorded using a Bruker Avance III 400 MHz spectrometer in CDCl3 with tetramethylsilane as an internal standard.2.3 Preparation of amino-modified graphene oxide (GO@PPD)
Firstly, graphene oxide (GO) (100 mg) was dispersed in ethanol (20 mL) in a round-bottom flask via ultrasonic treatment for 2 h. Then, p-phenylenediamine (PPD, 200 mg) and KOH (200 mg) were added into the above flask. The suspension in the flask was subjected to ultrasonication for 30 min. Finally, the mixture was refluxed at 80 °C for 24 h under vigorous stirring. The resulting solution was subsequently centrifuged and washed several times using absolute ethanol and deionized water to remove unreacted PPD, and the obtained product was dried in a vacuum oven at 40 °C for 12 h.2.4 Preparation of palladium catalyst derivatives supported on graphene oxide modified with diaminobenzene (GO@PPD–Pd)
Li2PdCl4 (0.1 M) was prepared via mixing 177 mg of PdCl2, 85 mg of LiCl, and 10 mL of anhydrous methyl alcohol in an Erlenmeyer flask, followed by stirring at room temperature for 24 h. GO@PPD (100 mg) was dispersed in anhydrous methyl alcohol (20 mL) and sonicated for 1 h. Then, avoiding the use of any supplementary reductants and stabilizers, Li2PdCl4 (200 μL, 100 μL, or 300 μL) was directly added into the above mixture under continuous stirring at 40 °C for 24 h to prepare GO@PPD–Pd, GO@PPD–Pd1, and GO@PPD–Pd2, respectively. The mixture was cooled to room temperature, centrifuged, and washed several times with dichloromethane, absolute ethanol, and alcohol. The obtained product was dried in a vacuum oven at 40 °C for 12 h. For comprehensive comparison, GO@Pd was also synthesized using the same procedure without the addition of PPD. The Pd content levels in the as-prepared GO@PPD–Pd, GO@PPD–Pd1, GO@PPD–Pd2, and GO@Pd samples were further determined via ICP-AES.2.5 Suzuki coupling reaction catalysed by GO@PPD–Pd
The catalytic activity of the GO@PPD–Pd catalyst was tested based on the Suzuki coupling reaction; 4-bromotoluene (0.25 mmol), phenylboronic acid (0.3 mmol), base (0.5 mmol), and GO@PPD–Pd (1 mg) were added to a reaction tube with 4 mL of solvent. The reaction mixture was carried out in an oil bath under vigorous stirring at a specified temperature. After the completion of the reaction, the GO@PPD–Pd catalyst was separated from the reaction mixture via filtration, and the coupling products were separated using a chromatographic column.2.6 Recycling experiments
Recycling experiments were carried out under the above-described conditions. After each run, the used catalyst was filtrated, washed with water, methanol, ethanol, and chloroform several times, and reused for sequential runs.3. Results and discussion
3.1 The fabrication route to GO@PPD–Pd
The fabrication route to the GO@PPD–Pd catalyst is depicted in Scheme 1.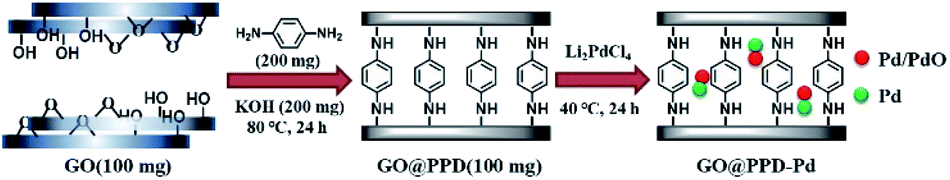 | ||
| Scheme 1 The fabrication route to GO@PPD–Pd. | ||
3.2 Characterization of GO@PPD–Pd
XRD spectra of GO, GO@PPD, and GO@PPD–Pd were obtained (Fig. S1†). Characteristic peaks at 42.35° and 11.43° were observed, which can be assigned to the (100) plane of the hexagonal structure of carbon and the (001) plane of GO. The two peaks shifted to 43.12° and 10.53° in the case of GO@PPD, showing expanded d001 interlayer spacing and decreased d100 interlayer spacing. A broad peak appeared at 25.45° corresponding to the (002) plane of graphite, indicating that partially reduced GO was modified with PPD; in addition, the diffraction peak widened, indicating a decrease in the integrity of the crystal structure and an increase in disorder. The presence of Pd immobilized on GO@PPD led to the characteristic peak of GO being shifted to 11.20° due to interactions between the graphene oxide layers. Moreover, a new weaker peak at 39.60° corresponding to the (111) plane of Pd appeared, indicating that Pd nanoparticles were formed from Li2PdCl4 reduced by nitrogen groups, which can be used as reducible agents and stabilizers to help form Pd nanoparticles.77FT-IR spectra were recorded throughout the fabricating process of GO@PPD–Pd, and they are shown in Fig. S2.† Peaks at 3426, 1726, 1622, 1398, 1215, and 1049 cm−1 correspond to hydroxyl stretching, carbonyl stretching (Fig. S2,† black line), C–OH vibrations, –CH2– stretching, C–O stretching, and epoxy vibrations. After modification with PPD, three distinct peaks at 1562, 1120, and 625 cm−1 were observed, which can be assigned to N–H vibrations, C–N stretching, and N–H stretching, which further confirmed the attachment of PPD to the graphene oxide nanosheets. Meanwhile, the peak at 1726 cm−1 disappeared, showing that GO was reduced. In the case of GO@PPD–Pd, no obvious changes were observed compared with GO@PPD.
Raman spectroscopy is usually used to investigate the structural disorder of GO.78 The two distinct peaks at around 1592 and 1346 cm−1 can be assigned to the G and D bands of GO (Fig. S3†), respectively. The D band is related to the disordered vibrations of sp3 carbon, while the G band is related to the vibrations of sp2 carbon atoms in GO. The ID/IG intensity ratio of GO@PPD (1.04) increased compared to GO (0.96), which reflected that the number of sp2 carbon atoms had decreased, and the ID/IG ratio of GO@PPD–Pd(1.01) was lower than that of GO@PPD, indicating that interactions occurred between Pd nanoparticles and amino-modified graphene oxide. The D band position showed almost no change after modification with PPD, and the G band at 1592 cm−1 shifted to 1583 cm−1, which was ascribed to the reduced GO.79
XPS spectra were obtained throughout the preparation to explore the surface composition (Fig. 1).80 The measured survey spectrum exhibited C, O, N, Cl, and Pd peaks (Fig. 1a), which matched the elemental composition of GO@PPD–Pd. N 1s HR-XPS analysis showed a single peak at a BE of 399.30 eV, corresponding to nitrogen–hydrogen bonds, confirming that PPD molecules were successfully modified onto graphene oxide (Fig. 1b). Pd 3d HR-XPS analysis of GO@PPD–Pd showed distinct peaks from Pd0 at 335.25 and 340.52 eV, which could be assigned to Pd0 3d5/2 and Pd0 3d3/2, respectively, suggesting the existence of partially reduced Pd species in GO@PPD–Pd. Peaks at 200.57 eV and 198.25 eV were attributed to Cl 2p1/2 and Cl 2p3/2, showing the presence of Cl coordinated with palladium in the catalyst. Two characteristic peaks at 342.82 and 337.6 eV were assigned to Pd2+ 3d3/2 and Pd2+ 3d5/2 (Fig. 1d). The XPS results confirmed the simultaneous existence of palladium nanoparticles and divalent palladium in GO@PPD–Pd.
 | ||
| Fig. 1 (a) XPS survey spectrum of GO@PPD–Pd, (b) HR-XPS of N 1s, (c) HR-XPS of Cl 2p and (d) HR-XPS of Pd 3d. | ||
The morphologies of GO, GO@PPD, and GO@PPD–Pd were studied via SEM, as shown in Fig. S4.† A large number of folded and layer-like GO structures were present (Fig. S4a†), and the morphology showed a relatively neat sheet-like structure after modification with PPD (Fig. S4b†). The SEM image of as-synthesized GO@PPD–Pd shows the good distribution of Pd nanoparticles, indicating that GO@PPD–Pd was prepared (Fig. S4c†).
The morphology and structure of GO@PPD–Pd were further investigated via TEM analysis. As shown in Fig. 2, layered structures of GO were confirmed (Fig. 2a), and similar layered structures were also observed after PPD modification (Fig. 2b), demonstrating the morphology of GO. Well-dispersed nanoparticles were observed (Fig. 2c) after Pd modification. The lattice spacings of the particles in Fig. 2c are 0.193 nm and 0.218 nm based on high-resolution imaging (Fig. 2d), corresponding to Pd(200) crystalline planes and Pd/PdO (111: 0.224 nm; 110: 0.211 nm; 102: 0.20 nm) polycrystalline planes (solid solution). The lattice spacing (0.218 nm) is between the distances of Pd (111: 0.224 nm) and PdO (102: 0.200 nm; 110: 0.211 nm),30 suggesting that a solid solution containing Pd(200) and Pd(111)/PdO(110) clusters is immobilized on GO@PPD–Pd, and Pd(111)/PdO(110) planes may be regarded as sites serving as templates for the formation of Pd(200).31,81
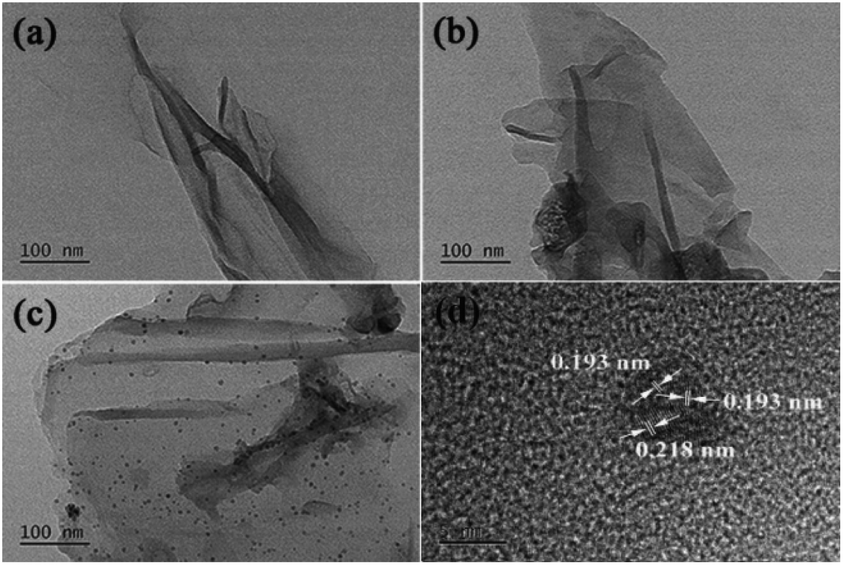 | ||
| Fig. 2 TEM images of (a) GO, (b) GO@PPD, and (c) GO@PPD–Pd, and (d) a HRTEM image of GO@PPD–Pd. | ||
Meanwhile, EDX (energy dispersive X-ray) images of GO@PPD–Pd were also obtained (Fig. 3); carbon, oxygen, nitrogen, and palladium elements were present on the surface of GO@PPD–Pd, suggesting that the material had been successfully modified with ligands and Pd. In addition, the good dispersion of palladium on the modified GO could strengthen the interactions between amino groups, oxygen atoms, palladium, and palladium oxide species.
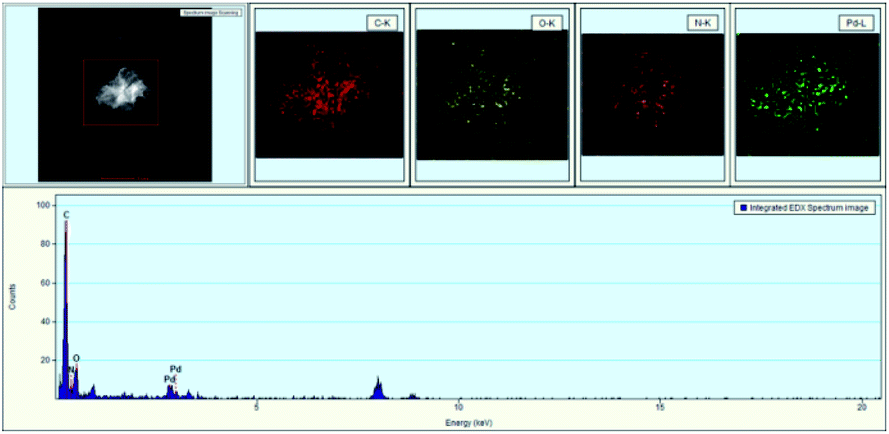 | ||
| Fig. 3 TEM images and EDX analysis of GO@PPD–Pd. | ||
Brunauer–Emmett–Teller (BET) analysis of the catalyst was performed (Fig. S5†). The adsorption isotherms are presented in Fig. S5a,† clearly indicating that the isotherm of graphene oxide was type IV with a H4 hysteresis loop, while the isotherms of GO@PPD and GO@PPD–Pd were type IV with a H3 hysteresis loop. This is characteristic of mesoporous materials.82 BJH analysis (Fig. S5b†) exhibited that the size of the pores was in the range from 2–10 nm, which is consistent with a mesoporous material. In addition, the SBET and pore size values of GO, GO@PPD, and GO@PPD–Pd are listed in Table S1.† Obviously, changes in the surface area and pore size were induced by the chemical modification of the surface of GO.
Electrochemical impedance spectroscopy (EIS) analysis of GO, GO@PPD, and GO@PPD–Pd was carried out, as shown in Fig. S6.† The arc radius represents the electrochemical reaction impedance, and the smaller the arc radius, the faster the electron transfer efficiency. Notably, the arc radius showed an obvious decrease as the fabrication process proceeded, predicting that GO@PPD–Pd has superior charge transfer abilities, which could help improve its catalytic activity.
The thermal behaviour as the catalyst fabrication process processed was further analysed using thermogravimetric analysis (TGA). As shown in Fig. S7,† weight loss from GO below 100 °C occurred because trapped moisture was removed, and significant weight loss was observed in the range of 180–240 °C because of the decomposition of groups containing oxygen, giving CO2, CO, and steam.83,84 However, the slow decomposition above 240 °C was attributed to the pyrolysis of the carbon skeleton (Fig. S7,† black line). The TGA curves of GO@PPD and GO@PPD–Pd showed a slow increase in decomposition with an increase in temperature, implying that the catalyst had higher thermal stability due to the introduction of diamino groups and immobilized Pd (Fig. S7,† red and blue lines).
The characterization results obtained above show that the diaminobenzene-modified graphene-oxide–supported metal palladium catalyst (GO@PPD–Pd) was successfully prepared.
3.3 Catalytic properties
:1 and 1:2 aqueous ethanol solvents, respectively (entries 8 and 9), and there were lower yields with other solvents (entries 4–7 and 10), suggesting that a specific ratio of ethanol to water was conducive to boosting the catalytic reaction.5 Then, different bases were studied (entries 11–15), and K2CO3 was selected due to its economy and high yield (entry 11). Furthermore, the yield decreased upon decreasing the temperature and time (entries 16–21), and only 76% yield was obtained at 30 °C after 30 min (entry 19). Considering the maximum yield and economic factors, the optimized reaction conditions were set to 60 °C for 20 min (entry 20). Additionally, when the amount of substrate was increased from 0.5 mmol to 1 mmol (entries 22 and 23), a yield of 86% with a higher TOF (60705 h−1) was obtained (entry 23), implying excellent activity arising from the good dispersion of stabilized Pd nanoparticles on the modified graphene oxide.To consider the effects of ligand structure, derivatives were used to modify GO, and their catalytic properties were investigated, as shown in Table S6.† When m-phenylenediamine or other derivatives were used, lower TOF values were obtained (entries 2 and 4–8). However, in the case of o-phenylenediamine, a higher TOF value was obtained (entry 3), indicating that the effects of the structures of the ligands used, such as electronic effects and steric effects, could efficiently influence the activity.
The catalytic performance of GO@PPD–Pd is compared with similar previously reported palladium catalysts in Table S7.†
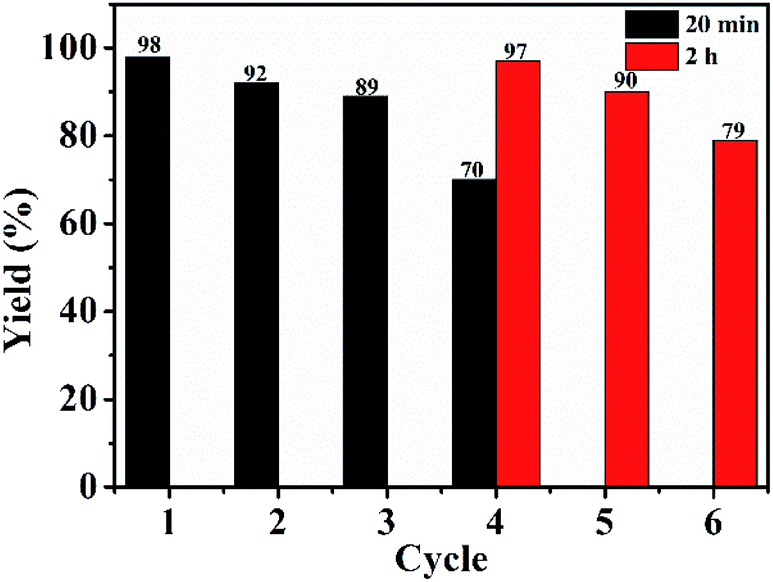 | ||
| Fig. 4 Recycling of GO@PPD–Pd. | ||
Almost all supported heterogeneous catalysts show significant loss of activity after reuse. Elucidating the deactivation mechanism is important for enhancing the activity and reusability. Therefore, SEM and TEM analysis were used to investigate the reasons for deactivation.
To further investigate the morphologies of GO@PPD–Pd before and after reuse, SEM images were obtained (Fig. 5). The results showed that the morphology was preserved during the catalytic process and after recycling (Fig. 5a–e). However, there were different degrees of active Pd nanoparticle aggregation (Fig. 5e), which might be a possible cause of deactivation.
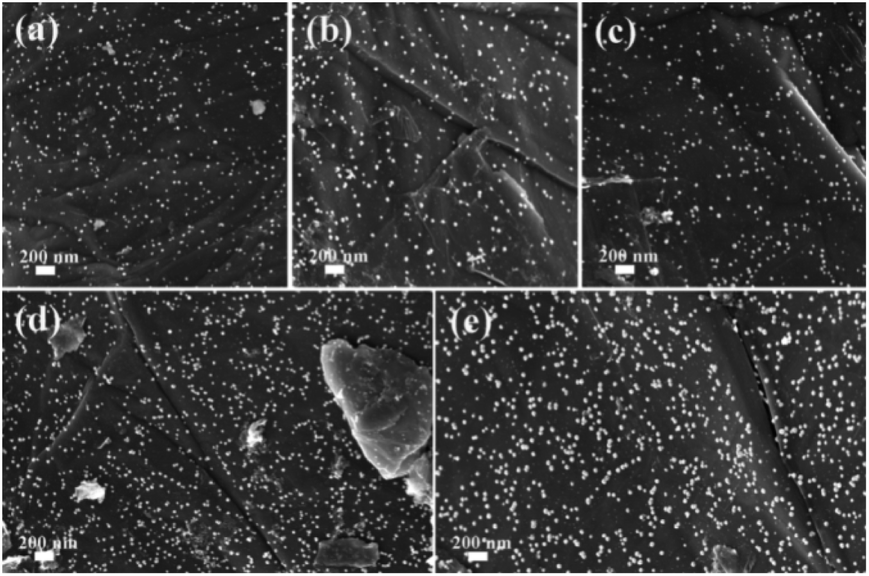 | ||
| Fig. 5 SEM images of GO@PPD–Pd during the reaction and after recycling: (a) 0 min, (b) 10 min, (c) 20 min, (d) 4th run, and (e) 6th run. | ||
TEM images of GO@PPD–Pd obtained during the catalytic process were also investigated, as shown in Fig. 6. Nanoparticles were dispersed without aggregation before catalysis (Fig. 6a), and a HR-TEM image of a chosen nanocluster illustrates Pd(200) and Pd(200)/PdO(102, 110) with a phase boundary, as shown in Fig. 2d.81 It was obvious that two discrete nanoclusters of Pd(200) and PdO(110) were observed after 10 min (Fig. 6b), predicting that the active species might be Pd(200). The existence of Pd(200) and Pd(200)/PdO(110, 102) with a phase boundary suggests that charge transfer may be an important factor responsible for the catalytic activity.86 The Pd–PdO interface as an active site was also observed after 20 min (Fig. 6c), meaning that the Pd(200) facet and Pd(200)/PdO(110) interface played a vital role in the catalytic process.34 A slightly agglomerated cluster composed of Pd(111), the main domain, and PdO(110, 102) with a phase boundary was also observed after the fourth run, with the Pd(200) facet changing into Pd(111), suggesting that the intrinsic activity of Pd(0) with suitable facets was important for enhancing the activity. Upon moving to the sixth recycling cycle, large-scale agglomeration occurred, with Pd(111) and Pd(200)/PdO(110, 102) having segregated distortion planes outside of the cluster, and distinct domains with different orientations were formed, indicating the destruction of the nanocluster (Fig. 6e). The results demonstrated that a change in the Pd facets and the destruction of active centres were the main reasons for deactivation.87 It was also evident that the co-existence of stabilized Pd/PdO and Pd(0) phases on intercalated GO could efficiently enhance the activity.88
 | ||
| Fig. 6 TEM images of GO@PPD–Pd during the reaction and after recycling: (a) 0 min, (b) 10 min, (c) 20 min, (d) 4th run, and (e) 6th run. | ||
Meanwhile, the size distributions of the nanoclusters were calculated, as shown in Fig. 7. The average size of palladium nanoparticles changed from 4.40 to 5.01 nm after 20 min (Fig. 7a–c), and average sizes of 5.32 and 5.92 nm were observed after the fourth and sixth runs, respectively (Fig. 7d and e). The results implied that the aggregation of Pd–Pd/PdO active centres was a key factor explaining the deactivation. The retained Pd content levels were measured to be 3.07 × 10⁻⁵ mmol mg−1 after the fourth cycle and 8.56 × 10⁻⁶ mmol mg−1 after the sixth cycle, indicating the loss of Pd compared with a fresh sample (4.25 × 10⁻⁵ mmol mg−1). The results showed that deactivation could mainly be attributed to the structure of the active centres, including changes to the Pd facet and the aggregation and loss of active species during recycling, which led to the loss of activity.
 | ||
| Fig. 7 Histograms showing the diameters of Pd nanoparticles during the reaction and after recycling, determined from a sample population of 100: (a) 0 min (4.40 nm); (b) 10 min (4.74 nm); (c) 20 min (5.01 nm); (d) 4th run (5.32 nm); and (e) 6th run (5.92 nm). | ||
3.4 Investigation into the catalytic mechanism
 | ||
| Fig. 8 Hot filtration testing involving GO@PPD–Pd. | ||
In order to distinguish between heterogeneous and homogeneous catalysis and to investigate where the catalytic reaction occurred, poisoning experiments were carried out (Table S8†).89 As is known, a poisoning reagent can effectively form bonds with the metal centres of a heterogeneous catalyst, resulting in a loss of activity. The activity of GO@PPD–Pd obviously decreased upon the addition of 0.5 equivalents of 2,2′-dipyridyl, which is an effective poisoning reagent (entry 2). However, when thiophene was added to the reaction mixture, the activity obviously decreased, but the catalyst was not completely deactivated. A possible reason was that thiophene could not coordinate with palladium completely, indicating that catalytic processes occurred at the interface. Combined with the hot filtration experiment results, the existence of a heterogeneous catalytic process can be confirmed.
 | ||
| Fig. 9 Electrochemical impedance spectra (EIS) of GO@PPD–Pd on Ni foam during the catalytic process. | ||
Raman spectra of GO@PPD–Pd during the catalytic process were recorded (Fig. 10). The distinct D and G bands showed no shifts, suggesting high stability during catalysis. However, the ID/IG intensity ratio slightly increased with an increase in the reaction time, which was ascribed to micro-changes in the layered GO structure.
 | ||
| Fig. 10 Raman spectra of GO@PPD–Pd during the catalytic process. | ||
XRD patterns of GO@PPD–Pd during the catalytic process and after the third run were recorded (Fig. 11). The characteristic peak of GO at 2θ ≈ 11.20° shifted to a lower angle of 11.17° after 10 min, to 10.70° after 20 min, and to 10.36° after the third run, which indicated that the interlayer distance became larger due to the slight aggregation of palladium or substrates in the layered graphene oxide structure.
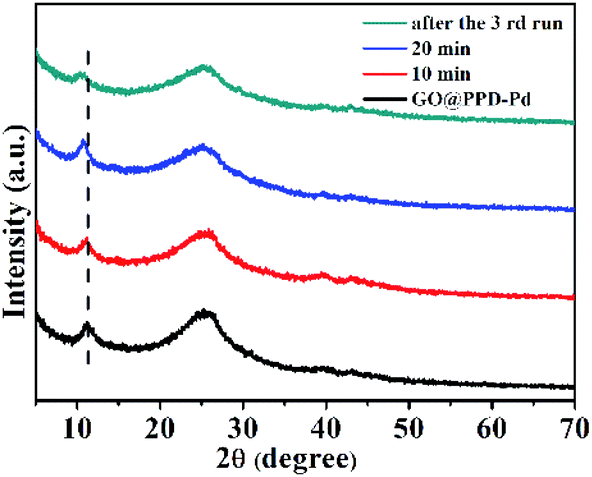 | ||
| Fig. 11 XRD patterns of GO@PPD–Pd during the catalytic process and after the 3rd reaction cycle. | ||
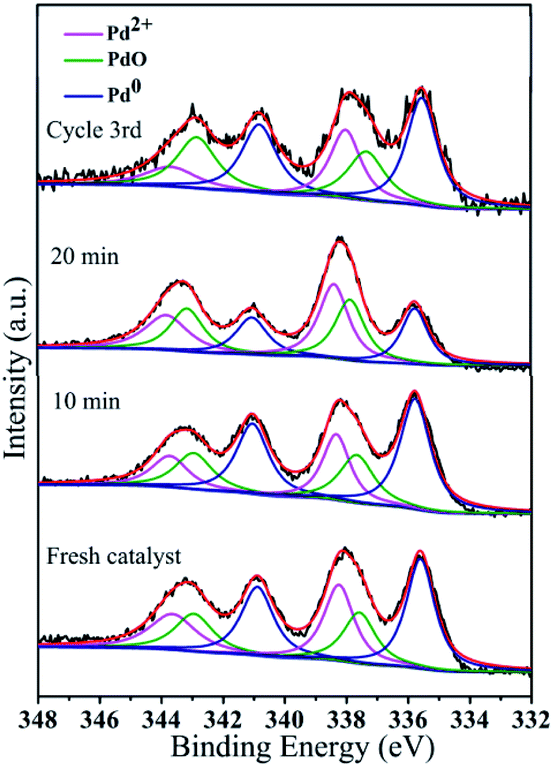 | ||
| Fig. 12 Pd 3d HR-XPS spectra during the catalytic process and after reuse: fresh catalyst, 10 min, 20 min, and cycle 3rd. | ||
The peak at 284.8 eV in the C 1s spectrum showed no changes with an increase in the reaction time or during recycling, indicating the stability of GO@PDD–Pd (Fig. 13a). Evidence for the existence of PdO could be inferred from the O 1s HR-XPS spectrum due to the exposure of Pd to air (Fig. 13b), and the weak peak appearing at 533.7 eV before catalysis due to Pd 3p3/2 (PdO) gradually became more distinct with an increase in time, suggesting the partial oxidation of Pd.95 The O 1s peak with a BE of 530.1 eV was assigned to the lattice oxygen of PdO, confirming the existence of PdO during the catalytic process.79,96 The presence of both Pd and Pd/PdO in GO@PDD–Pd corroborates the TEM analysis results.
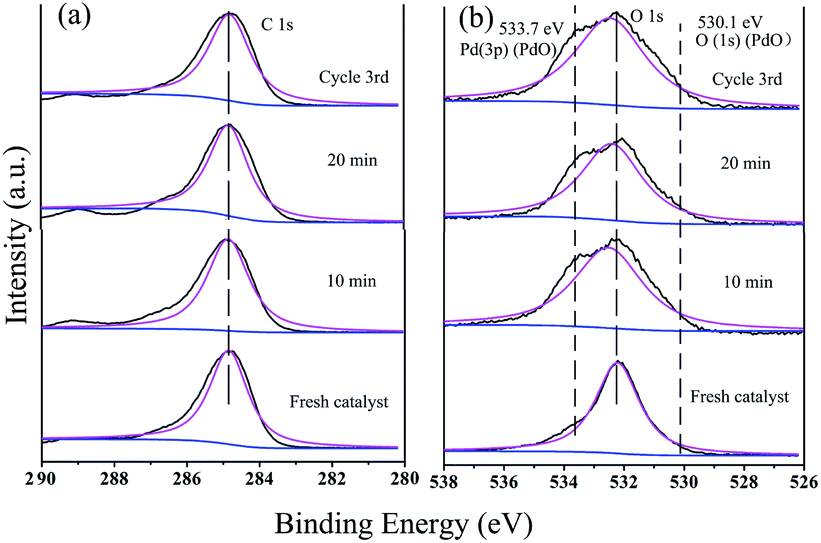 | ||
| Fig. 13 (a) C 1s and (b) O 1s HR-XPS spectra during the catalytic process: fresh catalyst (GO@PDD–Pd); after 10 min; after 20 min; and after the 3rd cycle. | ||
Based on the above results, we speculated that GO as a carrier could transfer electrons to the ligand, and these could be further transferred to Pd0, making Pd0 more negative. In addition, the Pd(200)/PdO(110, 102) interface generated in situ also actively participated in the coupling reaction synergistic to improve the activity,97 and the real active centre could be described (Scheme 2).
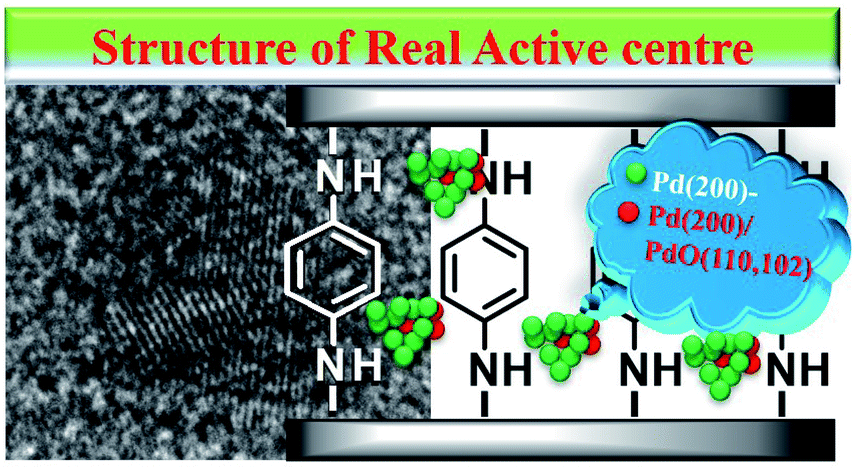 | ||
| Scheme 2 The proposed structure of the formed active centres. | ||
Changes in the N 1s, Br 3d, Cl 2p, and B 1s XPS spectra during the catalytic process could further explain the catalytic mechanism (Fig. 14). There was no Br 3d peak in the fresh GO@PPD–Pd spectrum; then, the peak at 68.8 eV exhibited an increasing trend at first, weakening with the progression of the reaction (Fig. 14a), indicating the adsorption of bromo-toluene on the catalyst surface. In addition, a B 1s peak at 190.5 eV appeared and shifted to a higher BE during the catalytic reaction (Fig. 14b), suggesting the adsorption of boronic acid, which reacted with an oxidative addition intermediate to yield a metal translation compound. The peaks at 198.07 eV and 199.81 eV in the Cl 2p spectra showed almost no shift during catalysis and after reuse (Fig. 14c), suggesting that Cl coordinated with Pd2+ and Pd atoms during the catalytic process.
 | ||
| Fig. 14 (a) Br 3d, (b) B 1s, (c) Cl 2p, (d) N 1s HR-XPS spectra during the catalytic process and after recycling: 0 min, 10 min, 20 min, and after the 3rd cycle. | ||
The change in the binding energy (BE) of the N 1s peak, which shifted a little from 399.3 eV to 399.7 eV and 399.5 eV during the catalytic process (Fig. 14d), may be related to the loss of electrons. All the changes listed above suggest that the catalytic process proceeded via substrate adsorption, intermediate formation, and product desorption.
 | ||
| Fig. 15 ReactIR plots as a function of the catalytic reaction time during the formation of 4-phenyltoluene at 60 °C: (a) a 3D map obtained using GO@PPD–Pd, (b) a 3D map obtained using Li2PdCl4, (c) kinetics curves plotted based on GO@PPD–Pd and Li2PdCl4 at 754 cm−1. ReactIR plots as a function of the catalytic reaction time during the formation of 4-phenyltoluene at 40 °C: (d) a 3D map plotted using GO@PPD–Pd as the catalyst, (e) a 3D map obtained using Li2PdCl4, and (f) kinetics curves plotted based on GO@PPD–Pd and Li2PdCl4 at 754 cm−1. | ||
The activation energies of GO@PPD–Pd and Li2PdCl4 were calculated (Fig. 16), and the rate constants (60 °C, k1 = 0.037; 40 °C, k2 = 0.028) and activation energy (Ea Hetero = 12.1 kJ mol−1) of GO@PPD–Pd were obtained. Also, the rate constants (60 °C, k1 = 0.034; 40 °C, k2 = 0.03) and activation energy (Ea Homo = 5.4 kJ mol−1) of Li2PdCl4 were calculated.
 | ||
| Fig. 16 ReactIR-based plots over time during the formation of 4-phenyltoluene via the Suzuki coupling reaction at 60 °C: kinetics analysis of the catalytic reaction (a) involving GO@PPD–Pd using the band at 754 cm−1 and (c) that catalyzed by Li2PdCl4. ReactIR plots over time during the formation of 4-phenyltoluene via the Suzuki coupling reaction at 40 °C: kinetics analysis of the catalytic reaction (b) involving GO@PPD–Pd using the band at 754 cm−1 and (d) that catalyzed by Li2PdCl4. | ||
The Ea results are contrary to theory, because the value of Ea Hetero was higher than that of Ea Homo. To consider the effects of GO@PPD–Pd dispersion, the same amount of GO was put into the Li2PdCl4 homogeneous system, and the rate constants (60 °C, k1 = 0.019; 40 °C, k2 = 0.014) and Ea Homo (13.2 kJ mol−1) were obtained (Fig. 17). The experimental results showed that Ea Homo (13.2 kJ mol−1) was larger than Ea Hetero (12.1 kJ mol−1), indicating that support dispersion could influence the catalytic activity.
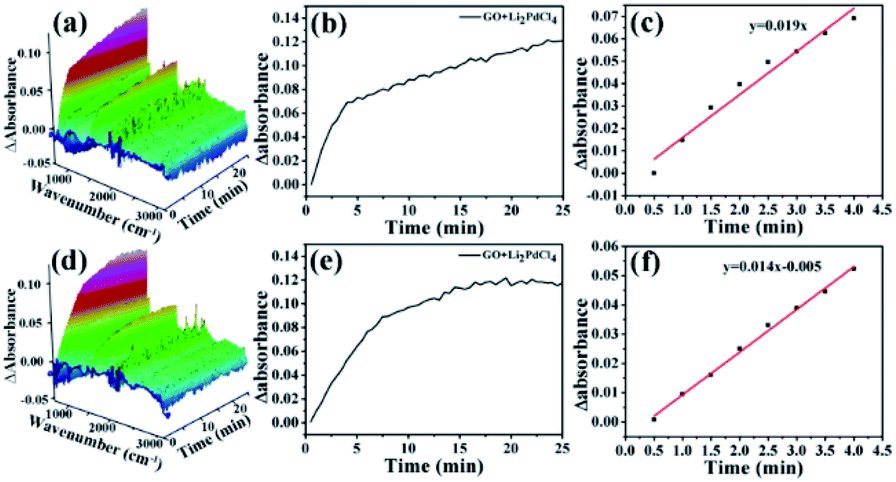 | ||
| Fig. 17 Plots over time during the formation of 4-phenyltoluene: (a) a 3D map (Li2PdCl4 + GO) at 60 °C, and (b and c) kinetics analysis of the Li2PdCl4 + GO reaction at 754 cm−1; (d) a 3D map (Li2PdCl4 + GO) at 40 °C, and (e and f) kinetics analysis of Li2PdCl4 + GO at 754 cm−1. | ||
From all the results listed above, a catalytic mechanism could be described (Scheme 3). At the beginning, the aryl halide reactant absorbed on the surface of the catalytic monolayer where it then contacted with active Pd(200) and the Pd(200)/Pd(110, 102) interface to give oxidative addition intermediates. This was followed by a reaction with phenylboronic acid absorbed on vicinal PdO to yield the intermediate via transmetallation, which was then transformed into the product via reductive elimination, giving the target molecule (TM, the cross-coupling compound) and releasing Pd(0).
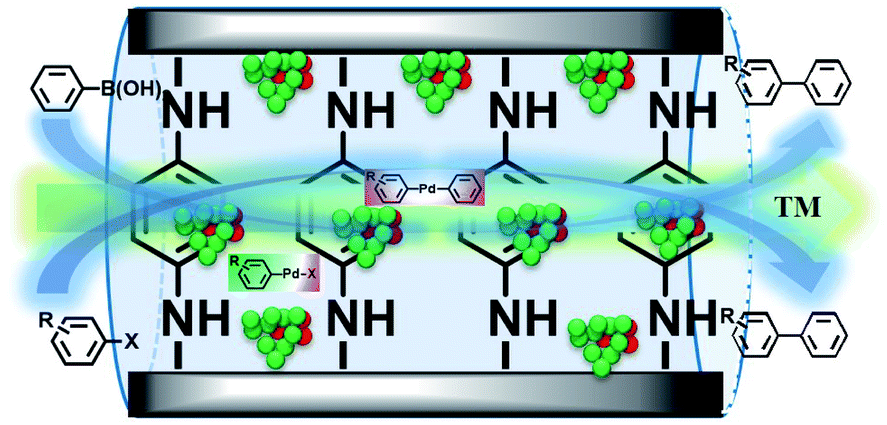 | ||
| Scheme 3 A plausible catalytic mechanism for the Suzuki coupling reaction catalyzed by GO@PPD–Pd. | ||
4. Conclusions
A catalyst consisting of well-dispersed Pd–Pd/PdO nanoparticles supported on graphene oxide modified with diaminobenzene (GO@PPD–Pd) was prepared, in which graphene oxide was intercalated with PPD as a well-defined support, stabilizing the Pd–Pd/PdO nanoparticles. This was due to strong metal–ligand–support interactions between the amine-functionalized support and nanoparticles. GO@PPD–Pd exhibited high catalytic activity and recyclability. Its deactivation was mainly attributed to (i) the destruction of active centres, including changes to Pd facets and Pd/PdO, and (ii) the aggregation and loss of active species during recycling. The catalytic mechanism involved heterogeneous catalysis occurring at the interface, and the catalytic process involved substrate adsorption, the formation of intermediates, product formation, and product desorption from the catalytic surface. The real active sites were composed of Pd(200) and Pd(200)/PdO(102, 110) with high catalytic activity, and Pd was made more negative via the transfer of electrons from the carrier and ligands; also, there was active electron transfer at the interface of Pd/PdO between Pd and PdO. Therefore, the active centres could effectively promote oxidative addition reactions, while Pd(200) and the Pd/PdO interface generated in situ also participated in intermediate formation via a synergistic effect.Conflicts of interest
There are no conflicts to declare.Acknowledgements
This work was supported by the NSFC (21861132002) and the Henan Natural Science Foundation of China (192102210046) via financial support.Notes and references
- G. P. McGlacken and I. J. S. Fairlamb, Eur. J. Org. Chem., 2009, 2009, 4011–4029 CrossRef.
- L. Xue and Z. Lin, Chem. Soc. Rev., 2010, 39, 1692–1705 RSC.
- T. J. Colaco, Platinum Met. Rev., 2011, 55, 84–89 CrossRef.
- A. B. Santanilla, M. Christensen, L. Campeau, I. W. Davies and S. D. Dreher, Org. Lett., 2015, 17, 3370–3373 CrossRef PubMed.
- J. Sherwood, J. H. Clark, I. J. S. Fairlamb and J. M. Slattery, Green Chem., 2019, 21, 2164–2213 RSC.
- M. Nasrollahzadeh, S. M. Sajadiand and A. Rostami-Vartooni, J. Mol. Catal. A: Chem., 2015, 396, 31–39 CrossRef CAS.
- M. Nasrollahzadeh, S. M. Sajadiand and M. Maham, J. Mol. Catal. A: Chem., 2015, 396, 297–303 CrossRef CAS.
- M. Nasrollahzadeh and S. M. Sajadiand, J. Colloid Interface Sci., 2016, 462, 243–251 CrossRef CAS PubMed.
- M. Nasrollahzadeh and S. M. Sajadiand, J. Colloid Interface Sci., 2016, 465, 121–127 CrossRef CAS PubMed.
- J. Muzart, Tetrahedron, 2005, 61, 4179–4212 CrossRef CAS.
- I. D. Kostas, F. J. Andreadaki, D. Kovala-Demertzi, C. Prentjas and M. A. Demertzis, Tetrahedron Lett., 2005, 46, 1967–1970 CrossRef CAS.
- S. Mohanty, D. Suresh, M. S. Balakrishna and J. T. Mague, J. Organomet. Chem., 2009, 694, 2114–2121 CrossRef CAS.
- D. J. M. Snelders, G. Koten and R. J. M. K. Gebbink, J. Am. Chem. Soc., 2009, 131, 11407–11416 CrossRef CAS PubMed.
- D. Astruc, Inorg. Chem., 2007, 46, 1884–1894 CrossRef CAS PubMed.
- S. Kotha, K. Lahiri and D. Kashinath, Tetrahedron, 2002, 58, 9633–9695 CrossRef CAS.
- R. Luque, B. Baruwati and R. S. Varma, Green Chem., 2010, 12, 1540–1543 RSC.
- S. Cheong, J. D. Watt and R. D. Tilley, Nanoscale, 2010, 2, 2045–2053 RSC.
- J. Shi, Chem. Rev., 2013, 113, 2139–2181 CrossRef CAS PubMed.
- H. Sakurai, T. Tsukuda and T. Hirao, J. Org. Chem., 2002, 67, 2721–2722 CrossRef CAS PubMed.
- N. Z. Shang, C. Feng, H. Y. Zhang, S. T. Gao, R. X. Tang, C. Wang and Z. Wang, Catal. Commun., 2013, 40, 111–115 CrossRef CAS.
- D. V. Jawale, E. Gravel, C. Boudet, N. Shah, V. Geertsen and H. Y. Li, Catal. Sci. Technol., 2015, 5, 2388–2392 RSC.
- J. C. Park, E. Heo, A. Kim, M. Kim, K. H. Park and H. J Song, J. Phys. Chem. C, 2011, 115, 15772–15777 CrossRef CAS.
- D. K. Shen, L. Chen, J. P. Yang, R. Y. Zhang, Y. Wei, X. M. Li, W. Li, Z. K. Sun, H. W. Zhu, A. M. Abdullah, A. Al-Enizi, A. A. Elzatahry, F. Zhang and D. Y. Zhao, ACS Appl. Mater. Interfaces, 2015, 7, 17450–17459 CrossRef CAS PubMed.
- J. Liu, J. F. Hao, C. C. Hu, B. J. He, J. B. Xi, J. W. Xiao, S. A. Wang and Z. W. Bai, J. Phys. Chem. C, 2018, 122, 2696–2703 CrossRef CAS.
- Y. Y. Gu, I. Favier, C. Pradel, D. L. Gin, J. Lahitte and R. D. Noble, J. Membr. Sci., 2015, 492, 331–339 CrossRef CAS.
- T. Park, G. H. Choi, D. Lee and P. J. Yoo, J. Membr. Sci., 2021, 634, 119386 CrossRef CAS.
- A. Kunfi, Z. May, P. Németh and G. London, J. Catal., 2018, 361, 84–93 CrossRef CAS.
- D. Saha, R. Sen, T. Maity and S. Kone, Langmuir, 2013, 29, 3140–3151 CrossRef CAS PubMed.
- C. T. Campbell, Nat. Chem., 2012, 4, 597–598 CrossRef CAS PubMed.
- D. A. Svintsitskiy, T. Y. Kardash, O. A. Stonkus, E. M. Slavinskaya, A. I. Stadnichenko, S. V. Koscheev, A. P. Chupakhin and A. I. Boronin, J. Phys. Chem. C, 2013, 117, 14588–14599 CrossRef CAS.
- S. Meher and R. K. Rana, Green Chem., 2019, 21, 2494–2503 RSC.
- L. Zhang, P. H. Li, C. Liu, J. Yang, M. Wang and L. Wang, Catal. Sci. Technol., 2014, 4, 1979–1988 RSC.
- K. Fujiwara, U. Müller and S. E. Pratsinis, ACS Catal., 2016, 6, 1887–1893 CrossRef CAS.
- Q. Lv, Q. L. Meng, W. W. Liu, N. Sun, K. Jiang, L. P. Ma, Z. Q. Peng, W. B. Cai, C. P. Liu, J. J. Ge, L. M. Liu and W. Xing, J. Phys. Chem. C, 2018, 122, 2081–2088 CrossRef CAS.
- C. Y. Dai, M. M. Li, A. F. Zhang, C. Liu, C. S. Song and X. W. Guo, RSC Adv., 2015, 5, 40297–40302 RSC.
- C. N. R. Rao, A. K. Sood and K. S. Subrahmanyam, Angew. Chem., Int. Ed., 2009, 48, 7752–7777 CrossRef CAS PubMed.
- Q. Q. An, L. H. Wang, S. Bi, W. D. Zhao, D. H. Wei, T. S. Li, M. H. Liu and Y. J. Wu, Mol. Catal., 2021, 501, 111359 CrossRef CAS.
- P. Huang, E. Song, Y. Sun, T. Li, D. Wei, M. Liu and Y. Wu, Mol. Catal., 2019, 469, 75–86 CrossRef CAS.
- W. Shang, X. Zeng, T. Li, W. Xu, D. Wei, M. Liu and Y. Wu, J. Catal., 2019, 376, 228–237 CrossRef CAS.
- D. A. Dikin, S. Stankovich, E. J. Zimney, R. D. Piner, G. H. B. Dommett, G. Evmenenko and S. T. N. S. Ruoff, Nature, 2007, 448, 457–460 CrossRef CAS PubMed.
- D. R. Dreyer, S. Park, C. W. Bielawski and R. S. Ruoff, Chem. Soc. Rev., 2010, 39, 228–240 RSC.
- O. C. Compton and S. T. Nguyen, Small, 2010, 6, 711–723 CrossRef CAS PubMed.
- X. B. Fan, G. L. Zhang and F. B. Zhang, Chem. Soc. Rev., 2015, 44, 3023–3035 RSC.
- S. Stankovich, D. A. Dikin, G. H. B. Dommett, K. M. Kohlhaas, E. J. Zimney, E. A. Stach, R. D. Piner, S. T. Nguyen and R. S. Ruoff, Nature, 2006, 442, 282–286 CrossRef CAS PubMed.
- C. H. Lu, H. H. Yang, C. L. Zhu, X. Chen and G. N. Chen, Angew. Chem., Int. Ed., 2009, 48, 4785–4787 CrossRef CAS PubMed.
- Y. H. Hu, H. Wang and B. Hu, ChemSusChem, 2010, 3, 782–796 CrossRef CAS PubMed.
- J. Pyun, Angew. Chem., Int. Ed., 2011, 50, 46–48 CrossRef CAS PubMed.
- L. Wang, K. Lee, Y. Y. Sun, M. Lucking, Z. F. Chen, J. J. Zhao and S. B. Zhang, ACS Nano, 2009, 3, 2995–3000 CrossRef CAS PubMed.
- M. A. White, J. A. Johnson, J. T. Koberstein and N. J. Turro, J. Am. Chem. Soc., 2006, 128, 11356–11357 CrossRef CAS PubMed.
- H. F. Yang, C. S. Shan, F. H. Li, D. X. Han, Q. X. Zhang and L. Niu, Chem. Commun., 2009, 26, 3880–3882 RSC.
- D. Guin, B. Baruwati and S. V. Manorama, Org. Lett., 2007, 9, 1419–1421 CrossRef CAS PubMed.
- A. A. Ibrahim, A. Lin, M. S. Adly and M. S. El-Shall, J. Catal., 2020, 385, 194–203 CrossRef CAS.
- R. M. Crooks, M. Zhao, L. Sun, V. Chechik and L. K. Yeung, Acc. Chem. Res., 2001, 34, 181–190 CrossRef CAS PubMed.
- S. Moussa, A. Siamaki, B. F. Gupton and M. S. El-Shall, ACS Catal., 2012, 2, 145–154 CrossRef CAS.
- V. B. Saptal, M. V. Saptal, R. S. Mane, T. Sasaki and B. M. Bhanage, ACS Omega, 2019, 4, 643–649 CrossRef CAS PubMed.
- K. G. Qu, L. Wu, J. S. Ren and X. G. Qu, ACS Appl. Mater. Interfaces, 2012, 4, 5001–5009 CrossRef CAS PubMed.
- Y. F. Ma and Y. S. Chen, Natl. Sci. Rev., 2015, 2, 41–53 Search PubMed.
- C. Li and G. Q. Shi, Nanoscale, 2012, 4, 5549–5563 RSC.
- Z. H. Tang, S. L. Shen, J. Zhuang and X. Wang, Angew. Chem., 2010, 122, 4707–4711 CrossRef.
- S. G. J. W. Burress, J. Ford, J. M. Simmons, W. Zhou and T. Yildirim, Angew. Chem., Int. Ed., 2010, 49, 8902–8904 CrossRef PubMed.
- R. Kumar, V. M. Suresh, T. K. Maji and C. N. R. Rao, Chem. Commun., 2014, 50, 2015–2017 RSC.
- J. Liu, G. W. Hu, Y. M. Yang, H. L. Zhang, W. Zuo, W. S. Liu and B. D. Wang, Nanoscale, 2016, 8, 2787–2794 RSC.
- T. P. N. Tran, D. X. Trinh, A. T. N. Dao and T. Taniike, Appl. Catal., A, 2018, 549, 60–67 CrossRef CAS.
- J. Yuan and M. H. Liu, J. Am. Chem. Soc., 2003, 125, 5051–5056 CrossRef CAS PubMed.
- B. Mu, T. Li, C. Li, P. Liu, W. Shang and Y. Wu, Tetrahedron, 2009, 65, 2599–2604 CrossRef CAS.
- X. Huang, C. Li, S. Jiang, X. S. Wang, B. W. Zhang and M. H. Liu, J. Am. Chem. Soc., 2004, 126, 1322–1323 CrossRef CAS PubMed.
- Z. Fu, T. Li, B. Mu, L. Mao, G. Li, W. Xu and Y. Wu, J. Mol. Catal. A: Chem., 2012, 363–364, 200–207 CrossRef CAS.
- Z. Fu, T. Li, X. He, J. Liu, W. Xu and Y. Wu, J. Mol. Catal. A: Chem., 2014, 395, 293–299 CrossRef CAS.
- Z. Fu, N. Zhang, J. Liu, T. Li, W. Xu, F. Wang, T. Wang, Z. Zhai, L. Liu, L. Mao and Y. Wu, J. Colloid Interface Sci., 2013, 394, 409–418 CrossRef CAS PubMed.
- N. Zhao, T. S. Li, Z. Zhai, J. J. Qiu, W. J. Xu, H. Liu and Y. J. Wu, ChemCatChem, 2013, 5, 1481–1489 CrossRef CAS.
- J. Wang, B. Mu, Z. Fu, L. Wang, T. Li and Y. Wu, Chin. J. Catal., 2014, 35, 1059–1067 CrossRef CAS.
- H. Liu, T. Li, X. Xue, W. Xu and Y. Wu, Catal. Sci. Technol., 2016, 6, 1667–1676 RSC.
- L. Wang, P. Huang, J. Yang, T. Li, L. Mao, M. Liu and Y. Wu, RSC Adv., 2018, 8, 31860–31867 RSC.
- E. Song, J. Wang, T. Li, W. Zhao, M. Liu and Y. Wu, Mol. Catal., 2020, 482, 110671 CrossRef CAS.
- L. Li, X. Xue, Y. Sun, W. Zhao, T. Li, M. Liu and Y. Wu, Chem. Res. Chin. Univ., 2020, 36, 821–828 CrossRef CAS.
- M. K. Bhunia, S. K. Das, P. Pachfule, R. Banerjee and A. Bhaumik, Dalton Trans., 2012, 41, 1304–1311 RSC.
- M. A. Pimenta, G. Dresselhaus, M. S. Dresselhaus, L. G. Cançado, A. Jorio and R. Saito, Phys. Chem. Chem. Phys., 2007, 9, 1276–1290 RSC.
- Z. Xue, P. Huang, T. Li, P. Qin, D. Xiao, M. Liu, P. Chen and Y. Wu, Nanoscale, 2017, 9, 781–791 RSC.
- K. S. Kim, A. F. Gossmann and N. Winograd, Anal. Chem., 1974, 46, 197–200 CrossRef CAS.
- X. J. M, L. Gao, Z. Weng, H. Yang and X. Sun, New J. Chem., 2020, 44, 20525–20529 RSC.
- P. Huang, E. Song, Y. Sun, T. Li, D. Wei, M. Liu and Y. Wu, Mol. Catal., 2019, 469, 75–86 CrossRef CAS.
- S. Stankovich, D. A. Dikin, R. D. Piner, K. A. Kohlhaas, A. Kleinhammes, Y. Y. Jia, Y. Wu, S. T. Nguyen and R. S. Ruoff, Carbon, 2007, 45, 1558–1565 CrossRef CAS.
- A. Lerf, H. Y. He, M. Forster and J. Klinowski, J. Phys. Chem. B, 1998, 102, 4477–4482 CrossRef CAS.
- T. Tamoradi, M. Ghadermazi and A. Ghorbani-Choghamarani, J. Saudi Chem. Soc., 2019, 23, 846–855 CrossRef CAS.
- Á. Molnár and A. Papp, Coord. Chem. Rev., 2017, 349, 1–65 CrossRef.
- G. J. Wu, X. M. Wang, N. J. Guan and L. D. Li, Appl. Catal., B, 2013, 136– 137, 177–185 CrossRef.
- B. Liu, P. Wang, A. Lopes, L. Jin, W. Zhong, Y. Pei, S. L. Suib and J. He, ACS Catal., 2017, 7, 3483–3488 CrossRef CAS.
- J. X. Fan, H. X. Du, Y. Zhao, Q. Wang, Y. A. Liu, D. Q. Li and J. T. Feng, ACS Catal., 2020, 10, 13560–13583 CrossRef CAS.
- C. T. Campbell and J. Sauer, Chem. Rev., 2013, 113, 3859–3862 CrossRef CAS PubMed.
- J. A. Moulijn, A. E. Diepen and F. Kapteijn, Appl. Catal., A, 2001, 212, 3–16 CrossRef CAS.
- P. Huang, Z. Xue, T. Li, Z. Liu, D. Wei, M. Liu and Y. Wu, ChemCatChem, 2018, 10, 5141–5153 CrossRef CAS.
- C. M. Woodbridge, D. L. Pugmire, R. C. Johnson, N. M. Boag and M. A. Langell, J. Phys. Chem. B, 2000, 104, 3085–3093 CrossRef CAS.
- M. Sharma, B. Das, A. Hazarika, A. K. Guha, S. K. Bhargava and K. K. Bania, ACS Appl. Nano Mater., 2019, 2, 3769–3779 CrossRef CAS.
- Y. S. Feng, J. J. Ma, Y. M. Kang and H. J. Xu, Tetrahedron, 2014, 70, 6100–6105 CrossRef CAS.
- J. Dong, Q. Fu, Z. Jiang, B. Mei and X. Bao, J. Am. Chem. Soc., 2018, 140, 13808–13816 CrossRef CAS PubMed.
- S.-H. O. a. G. B. Hoflund, J. Phys. Chem. A, 2006, 110, 7609–7613 Search PubMed.
- H.-J. Cho, V. T. Chen, S. Qiao, W.-T. Koo, R. M. Penner and I.-D. Kim, ACS Sens., 2018, 3, 2152–2158 CrossRef CAS PubMed.
- D. A. Foley, C. W. Doecke, J. Y. Buser, J. M. Merritt, L. Murphy, M. Kissane, S. G. Collins, A. R. Maguire and A. Kaerner, J. Org. Chem., 2011, 76, 9630–9640 CrossRef CAS PubMed.
- S. A. Eisenbeis, R. Chen, M. Kang, M. Barrila and R. Buzon, Org. Process Res. Dev., 2015, 19, 244–248 CrossRef CAS.
Footnotes |
| † Electronic supplementary information (ESI) available. See DOI: 10.1039/d2ra00658h |
| ‡ These authors contributed equally. |
| This journal is © The Royal Society of Chemistry 2022 |