
 Open Access Article
 This Open Access Article is licensed under a
 Creative Commons Attribution 3.0 Unported Licence
The effect of hydrophobic chains on retarding performance of retarding acids
Quan Hongping *ab,
Zhen Xueleab,
Lu Qiangyingab,
Wang Linyuanab and
Jiang Silongab
*ab,
Zhen Xueleab,
Lu Qiangyingab,
Wang Linyuanab and
Jiang Silongab
aOil & Gas Field Applied Chemistry Key Laboratory of Sichuan Province, Chengdu 610500, P. R. China. E-mail: 59183228@qq.com; Tel: +86-28-83037309
bCollege of Chemistry and Chemical Engineering, Southwest Petroleum University, Chengdu 610500, P. R. China
First published on 22nd March 2022
Abstract
Acidizing retarders are used to reduce the reaction rate between hydrochloric acid (HCl) and carbonates to increase the efficiency of acidification of oil and gas wells and increase oil and gas recovery. We synthesized two polymeric acidizing retarders (AR-1 and AR-2) to explore ways to improve the efficiency of this process. Retarder AR-1 is based on acrylamide (AM) and allyl polyethylene glycol (APEG-1000), and retarder AR-2 is composed of AM, APEG-1000, and octadecyl dimethyl allyl ammonium chloride (C-18). The molecular structures of AR-1 and AR-2 were characterized by Fourier transform infrared (FT-IR) and 1H nuclear magnetic resonance (1H-NMR). The retarding performance and acid–rock reaction rates of AR-1 and AR-2 were evaluated, and the experimental results indicated that AR-2 had a better retarding performance than AR-1, and the acid–rock reaction rate of AR-1 was higher than AR-2. This could be because AR-2 with its hydrophobic chains forms a thicker adsorbed film. This was confirmed by X-ray photoelectron spectroscopy (XPS) and adsorption behavior studies. The scanning electron microscope (SEM) images, contact angle, and XPS results showed that both retarders form adsorption films on the surface of rocks, indicating that the introduction of AM and APEG-1000 makes the retarder adsorb on rock surfaces. The introduction of hydrophobic chains for AR-2 enhanced the thickness of adsorbed film, indicating that adding hydrophobic chains to the acidizing retarder significantly improves its retarding performance.
1. Introduction
Because of the world's continuing reliance on oil and natural gas, there has been concern about the decrease in the recovery rates of oil fields.1–5 Acidification, most commonly with hydrochloric acid (HCl), effectively increases the production of oil and gas wells,6,7 however, the efficiency of acidification is restricted because HCl cannot penetrate to the deeper places of reservoirs due to the fast reaction rate between the HCl and carbonates. Therefore, there has been a search for chemicals that could be added to the HCl to reduce the reaction rate between the HCl and carbonates and allow the HCl to penetrate more deeply into the reservoir.In the past, thickening acid,8 foam acid,9 diverting acid,10–13 and others have been used to reduce the acid–rock reaction rate.14–16 The high viscosity of thickening acid effectively reduces the diffusion rate of hydrogen ions to the rock surface, thus reducing the reaction rate of acid–rock. However, the secondary damage caused by the thickening acid is a problem, and it is difficult to pump it in and out, so its application is limited. Foaming acid is a system with a mixture of acids, such as hydrochloric acid, hydrofluoric acid, and formic acid, introduced with bubbles created by adding a water-soluble polymer as a foaming agent and a foam stabilizer to the acid solution. Foaming acid with its high apparent viscosity and small filtration loss can effectively slow down the acid–rock reaction, but its foam stability is poor under high temperature conditions.17 The mixture of a chemical diverting agent and acid is called diverting acid. The existing diversion methods include in situ cross-linked acid and self-diverting acid.18,19 The diverting acid blocks some of the channels produced by dissolution, changing the flow profile and forcing the acid solution to flow into a relatively low permeability formation, which improves the acidification effect, but it is expensive and has poor temperature resistance and a complex construction technology.
At present, the retarding mechanisms are divided into two types. The first, reduces the diffusion rate of the H+ ions by increasing the viscosity of acids, the other separates the acid solution from the rock by forming a film on the surface of the rock, thus reducing the reaction rate between the acid and rock.
The adsorptive acidizing retarders include small molecular surfactants and macromolecular polymers synthesized using acrylamide. However, the former has the shortcomings of large dosage and high price, the latter mainly reduces the acid–rock reaction through the method of adsorbed film. Quan's20–22 research group proposed that a retarding acid with low viscosity could be adsorbed on the surface of carbonate rock and form a hydrated film that would delay the acid–rock reaction, but no published research has described a study of which factors could influence the film-forming properties.
In this paper, we describe our development of two low viscosity acidizing retarders (AR-1 and AR-2) that differ with respect to the presence of hydrophobic functional groups. AR-1 was synthesized using AM and APEG-1000, and AR-2 was synthesized using AM, APEG-1000, and C-18. The addition of C-18 adds hydrophobic groups to AR-2. We compared the retarding performance of the two acidizing retarders to better understand the key role of hydrophobic chains in retarding performance.
2. Materials and methods
2.1 Materials
Acrylamide (AM, AR), allyl polyethylene glycol (APEG-1000, >99%), hydrochloric acid (HCl, 37%), anhydrous ethanol (>99.5%), and potassium bromide (KBr, AR) were purchased from the Chengdu Kelong Chemical Factory. Octadecyl dimethyl allyl ammonium chloride (C-18, 70%) was bought from Jiangsu Fumiao chemical reagent plant. 2,2′-Azobis(2-methyl-propionamidine)dihydrochloride (V50, 97%) was purchased from Aladdin chemicals.2.2 Synthesis of AR-1 and AR-2
The two reactions were completed in 250 mL three-necked flasks. We synthesized AR-1 by combining AM and APEG-1000 in a mole ratio of 24![[thin space (1/6-em)]](https://www.rsc.org/images/entities/char_2009.gif) :0.25, and we synthesized AR-2 by combining AM, APEG-1000, and C-18 in a mole ratio of 22:1:1. We added V50 as an initiator. The two reactions were conducted at 50 °C for 5 h, and the two products were purified with ethanol and dried at 40 °C for 24 h.
:0.25, and we synthesized AR-2 by combining AM, APEG-1000, and C-18 in a mole ratio of 22:1:1. We added V50 as an initiator. The two reactions were conducted at 50 °C for 5 h, and the two products were purified with ethanol and dried at 40 °C for 24 h.
2.3 Characterization and measurements
| Δm = m1 − m2 | (1) |
 | (2) |
 | (3) |
 | (4) |
3. Result and discussion
3.1 Characterization of AR-1 and AR-2
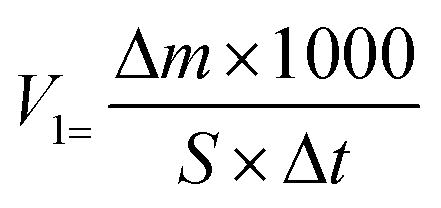
Fig. 1 shows the FT-IR spectra of AR-1 and AR-2. The peak at 3413 cm−1 for AR-1 corresponds to its O–H stretching vibration, and the peak at 3423 cm−1 for AR-2 corresponds to its O–H stretching vibration. The peaks at 2933 and 2877 cm−1 for AR-1 correspond to the C–H stretching vibrations of its –CH2 and –CH3 groups, and the peaks at 2942 cm−1 and 2867 cm−1 for AR-2 correspond to the C–H stretching vibrations of its –CH2 and –CH3 groups. Characteristic absorption bands at 1656 cm−1 (AR-1) and 1673 cm−1 (AR-2) correspond to C–O stretching vibrations of polyacrylamide, and the peak at 647 cm−1 for AR-2 correspond to the absorption peak of the C–H bonds of C-18. These results indicate that we successfully synthesized AR-1 and AR-2. | ||
| Fig. 1 The FT-IR spectra of AR-1 and AR-2. | ||
Fig. 2 shows the 1H-NMR spectra of AR-1 and AR-2 that we used to provide further evidence of the successful synthesis of AR-1 and AR-2.
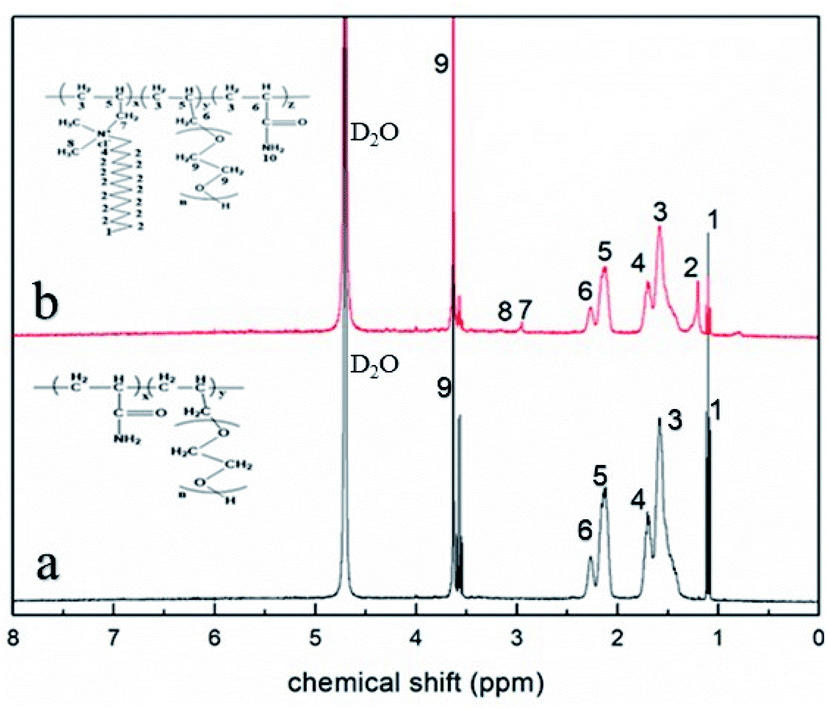 | ||
| Fig. 2 The 1H-NMR (400 MHz, D2O) spectra of (a) AR-1 and (b) AR-2. | ||
For AR-1, the chemical shift peaks of –CH2–CH– and –CH–(C![[double bond, length as m-dash]](https://www.rsc.org/images/entities/char_e001.gif) O)–) appear at 1.52 (marked as 3) and 2.20 ppm (marked as 6), respectively. The peak for –CH–CH2–O– is at 2.11 ppm (marked as 5). The peak at 3.59 ppm (marked as 9) is for –CH2–CH2–O–. The spectrum for AR-2 is similar to that of AR-1. The chemical shift peak for –CH–CH2–N– is at 2.11 ppm (marked as 5), and the characteristic chemical shift peaks for –CH2–N– and –N–CH3 appear at 3.28 (marked as 7) and 3.32 (marked as 8), respectively.
O)–) appear at 1.52 (marked as 3) and 2.20 ppm (marked as 6), respectively. The peak for –CH–CH2–O– is at 2.11 ppm (marked as 5). The peak at 3.59 ppm (marked as 9) is for –CH2–CH2–O–. The spectrum for AR-2 is similar to that of AR-1. The chemical shift peak for –CH–CH2–N– is at 2.11 ppm (marked as 5), and the characteristic chemical shift peaks for –CH2–N– and –N–CH3 appear at 3.28 (marked as 7) and 3.32 (marked as 8), respectively.
According to the results of our FT-IR and 1H-NMR analysis, we successfully synthesized AR-1 and AR-2, and their structures were consistent with our expected structures.
We measured the number-average molecular weight (Mn) and the weight-average molecular weight (Mw) of the two retarders, and Table 1 shows the results.
| Retarder | Mn | Mw | Mw/Mn |
|---|---|---|---|
| a The results showed that the average weight of two polymers were lower. | |||
| AR-1 | 120106 |
568777 |
4.74 |
| AR-2 | 11199 |
22420 |
2.00 |
3.2 Carbonate rock sample analysis
The purity of our experimental carbonate was determined by X-ray diffraction (XRD; X' Pert PRO MRD, Holland) with the XRD diffractogram recorded between 10° and 60° with Cu Kα X-rays at 85 W. Fig. 3 shows the results.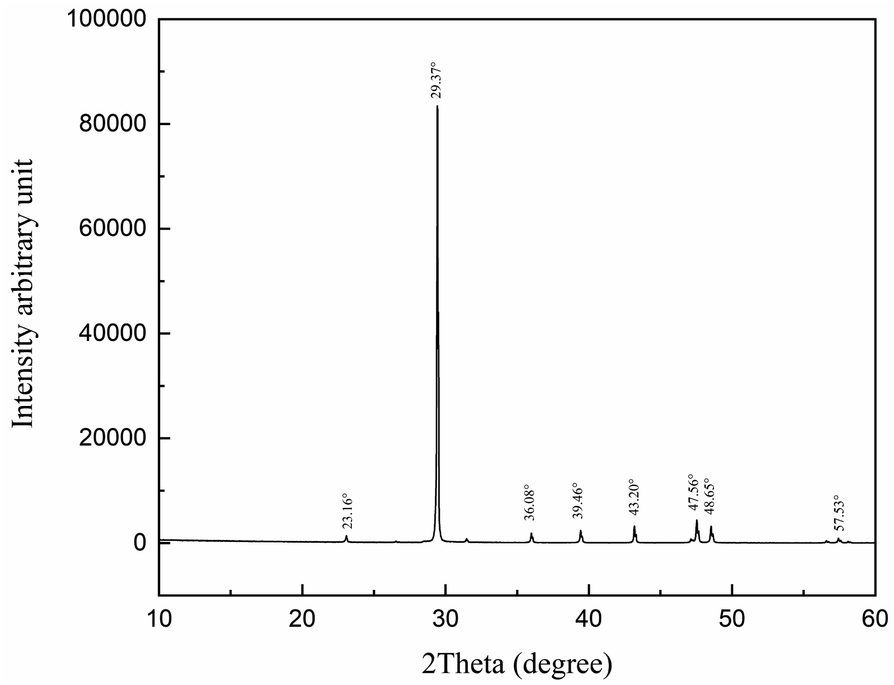 | ||
| Fig. 3 XRD patterns of the carbonate rock. | ||
The interplanar spacing and the intensity of the diffraction peaks shown in Fig. 3 at 23.16°, 29.37°, 36.08°, 39.46°, 43.20°, 47.56° 48.65°, and 57.53° are consistent with CaCO3.25
3.3 The viscosity of the retarders
We added AR-1 and AR-2 to 20 wt% HCl to obtain different concentrations of samples, and we measured the viscosities of the mixtures. The viscosities were measured by a rotational viscometer (ZNN-D6, China) at 30 °C. Table 2 shows the results.| Concentration (mg L−1) | The viscosity of AR-1 (mPa s) | The viscosity of AR-2 (mPa s) |
|---|---|---|
| 2000 | 3 | 3 |
| 4000 | 3 | 3 |
| 6000 | 9 | 6 |
| 8000 | 18 | 15 |
| 10000 |
27 | 18 |
The results in Table 2 show that although the viscosities were all low, increasing concentration of the mixtures led to a gradual increase in the viscosities of AR-1 and AR-2 acids. As we will demonstrate below, our experimental results showed that both AR-1 and AR-2 reduced the acid–rock reaction rate significantly despite their low viscosity, which is very different from the traditional method that requires high viscosity to reduce the acid–rock reaction rate.26,27
3.4 Effect of retarder dosage on retarding performance
Fig. 4 shows the effect of retarder dosage and temperature on retarding performance.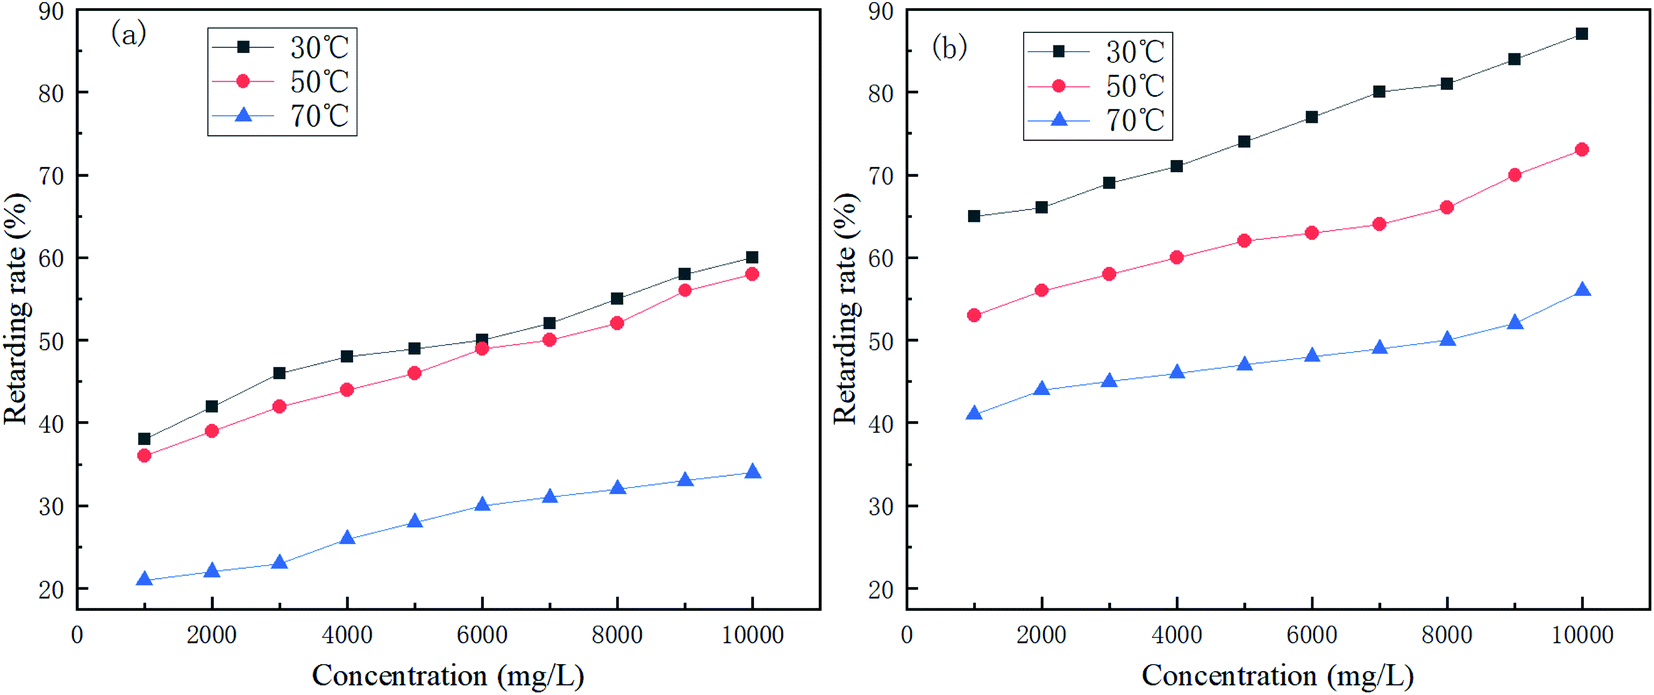 | ||
| Fig. 4 Variation of the retarding rate of (a) AR-1 and (b) AR-2 for different mass concentrations and different temperatures. | ||
Fig. 4 shows that the retarding rates of AR-1 and AR-2 decreased as the temperature increased at the same concentration, because the higher the temperature, the faster the acid–rock reaction rate. Fig. 4 also shows that the retarding rates increased gradually as the mass concentration increased at each temperature. A comparison of the retarding rates of AR-1 and AR-2 for the same mass concentration and same temperature shows that AR-2 had a significantly higher retarding rate than AR-1. Table 2 showed that when the concentrations of AR-1 and AR-2 were lower than 6000 mg L−1, their viscosities were the same, but when the concentrations were greater than 6000 mg L−1, the viscosities of AR-1 were higher than for AR-2. Because AR-2 has higher retarding rates than AR-1 despite its lower viscosity, the retarding mechanism must be different from the traditional method for which higher viscosity leads to decreased acid–rock reaction. The results also suggested that the introduction of hydrophobic chains on AR-2 molecules played a significant role in retarding performance.
3.5 Determination of the acid rock reaction rates
Fig. 5 shows the trend in CO2 production for the reaction of acid and carbonate for different concentrations of AR-1 and AR-2.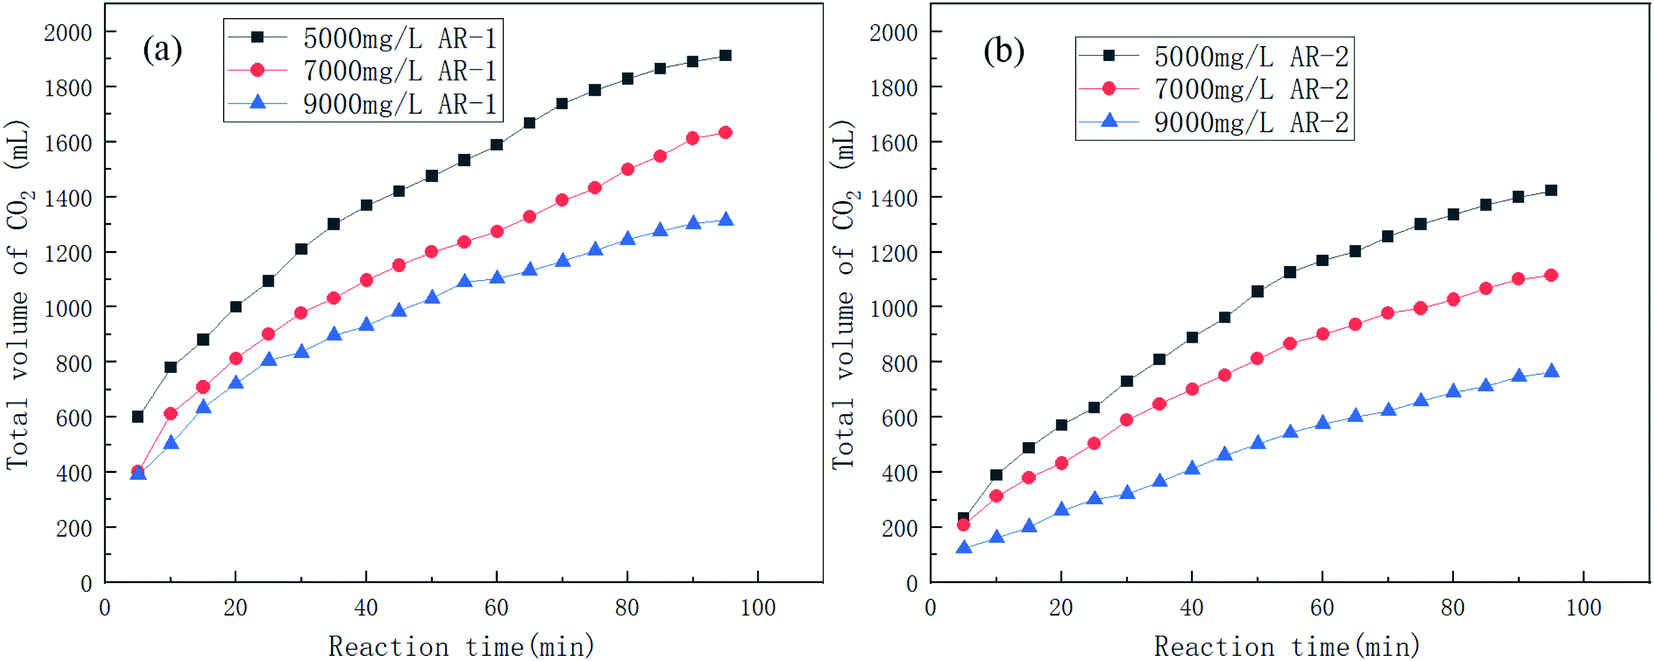 | ||
| Fig. 5 The volume of CO2 produced over time during the acid–rock rection for different concentrations of (a) AR-1 and (b) AR-2. | ||
Fig. 6 shows the trend in reaction rates for the reaction of acid and carbonate for different concentrations of AR-1 and AR-2.
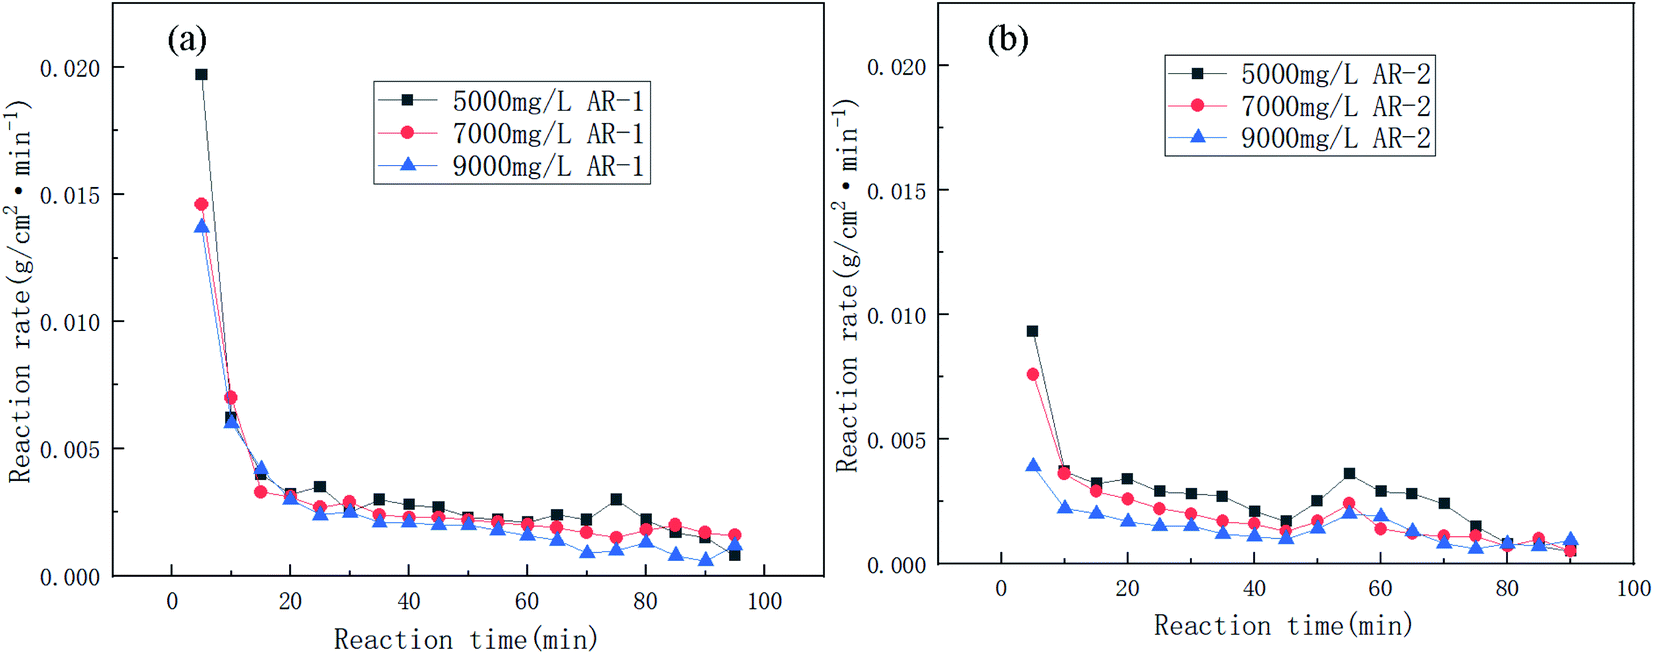 | ||
| Fig. 6 The reaction rates of the carbonate rock and retarding acid for different concentrations of (a) AR-1 and (b) AR-2. | ||
Fig. 5 shows that the total volume of CO2 produced during the acid–rock reaction decreased with increasing polymer concentration. Fig. 6(a) shows that the reaction rate decreased with the increasing reaction time for all of the concentrations of AR-1, which could be due to the adsorption of the retarder AR-1 on the rock surface to form a film and the decrease of the HCl concentration. Fig. 6(b) shows that for all of the concentrations of AR-2, the reaction rate first decreased, then increased slightly, and finally decreased with increasing reaction time. The initial decrease in reaction rate could be due to the adsorption of the retarder AR-2 on the rock surface, forming a film that prevented the HCl from contacting the rock surface. The increase in reaction rate at about 45 min could be due to adsorption reaching saturation, followed by some desorption from the rock surface. Finally, the reaction rate gradually decreased due to a decrease of HCl concentration.
Comparison of the acid–rock reaction rate of AR-1 and AR-2 shows that the reaction rate of AR-1 was higher than for AR-2, indicating that the introduction of hydrophobic chains on AR-2 cause it to do a better job of blocking the reaction of HCl with the carbonate rocks. This will be explained below.
3.6 SEM analysis of the carbonate surface
The microstructure of carbonate rocks treated in different ways was obtained by SEM. Fig. 7 showed the SEM image of a carbonate sample treated with 20 wt% HCl, Fig. 8 shows the SEM images of carbonate samples treated with AR-1 and AR-2 acids.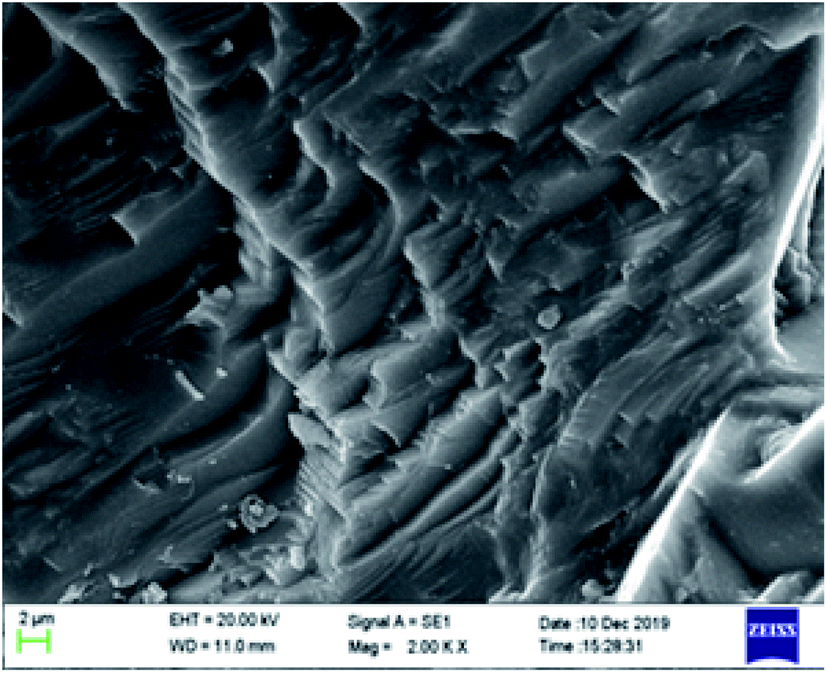 | ||
| Fig. 7 The SEM image of a carbonate sample treated with 20 wt% HCl (2000 times). | ||
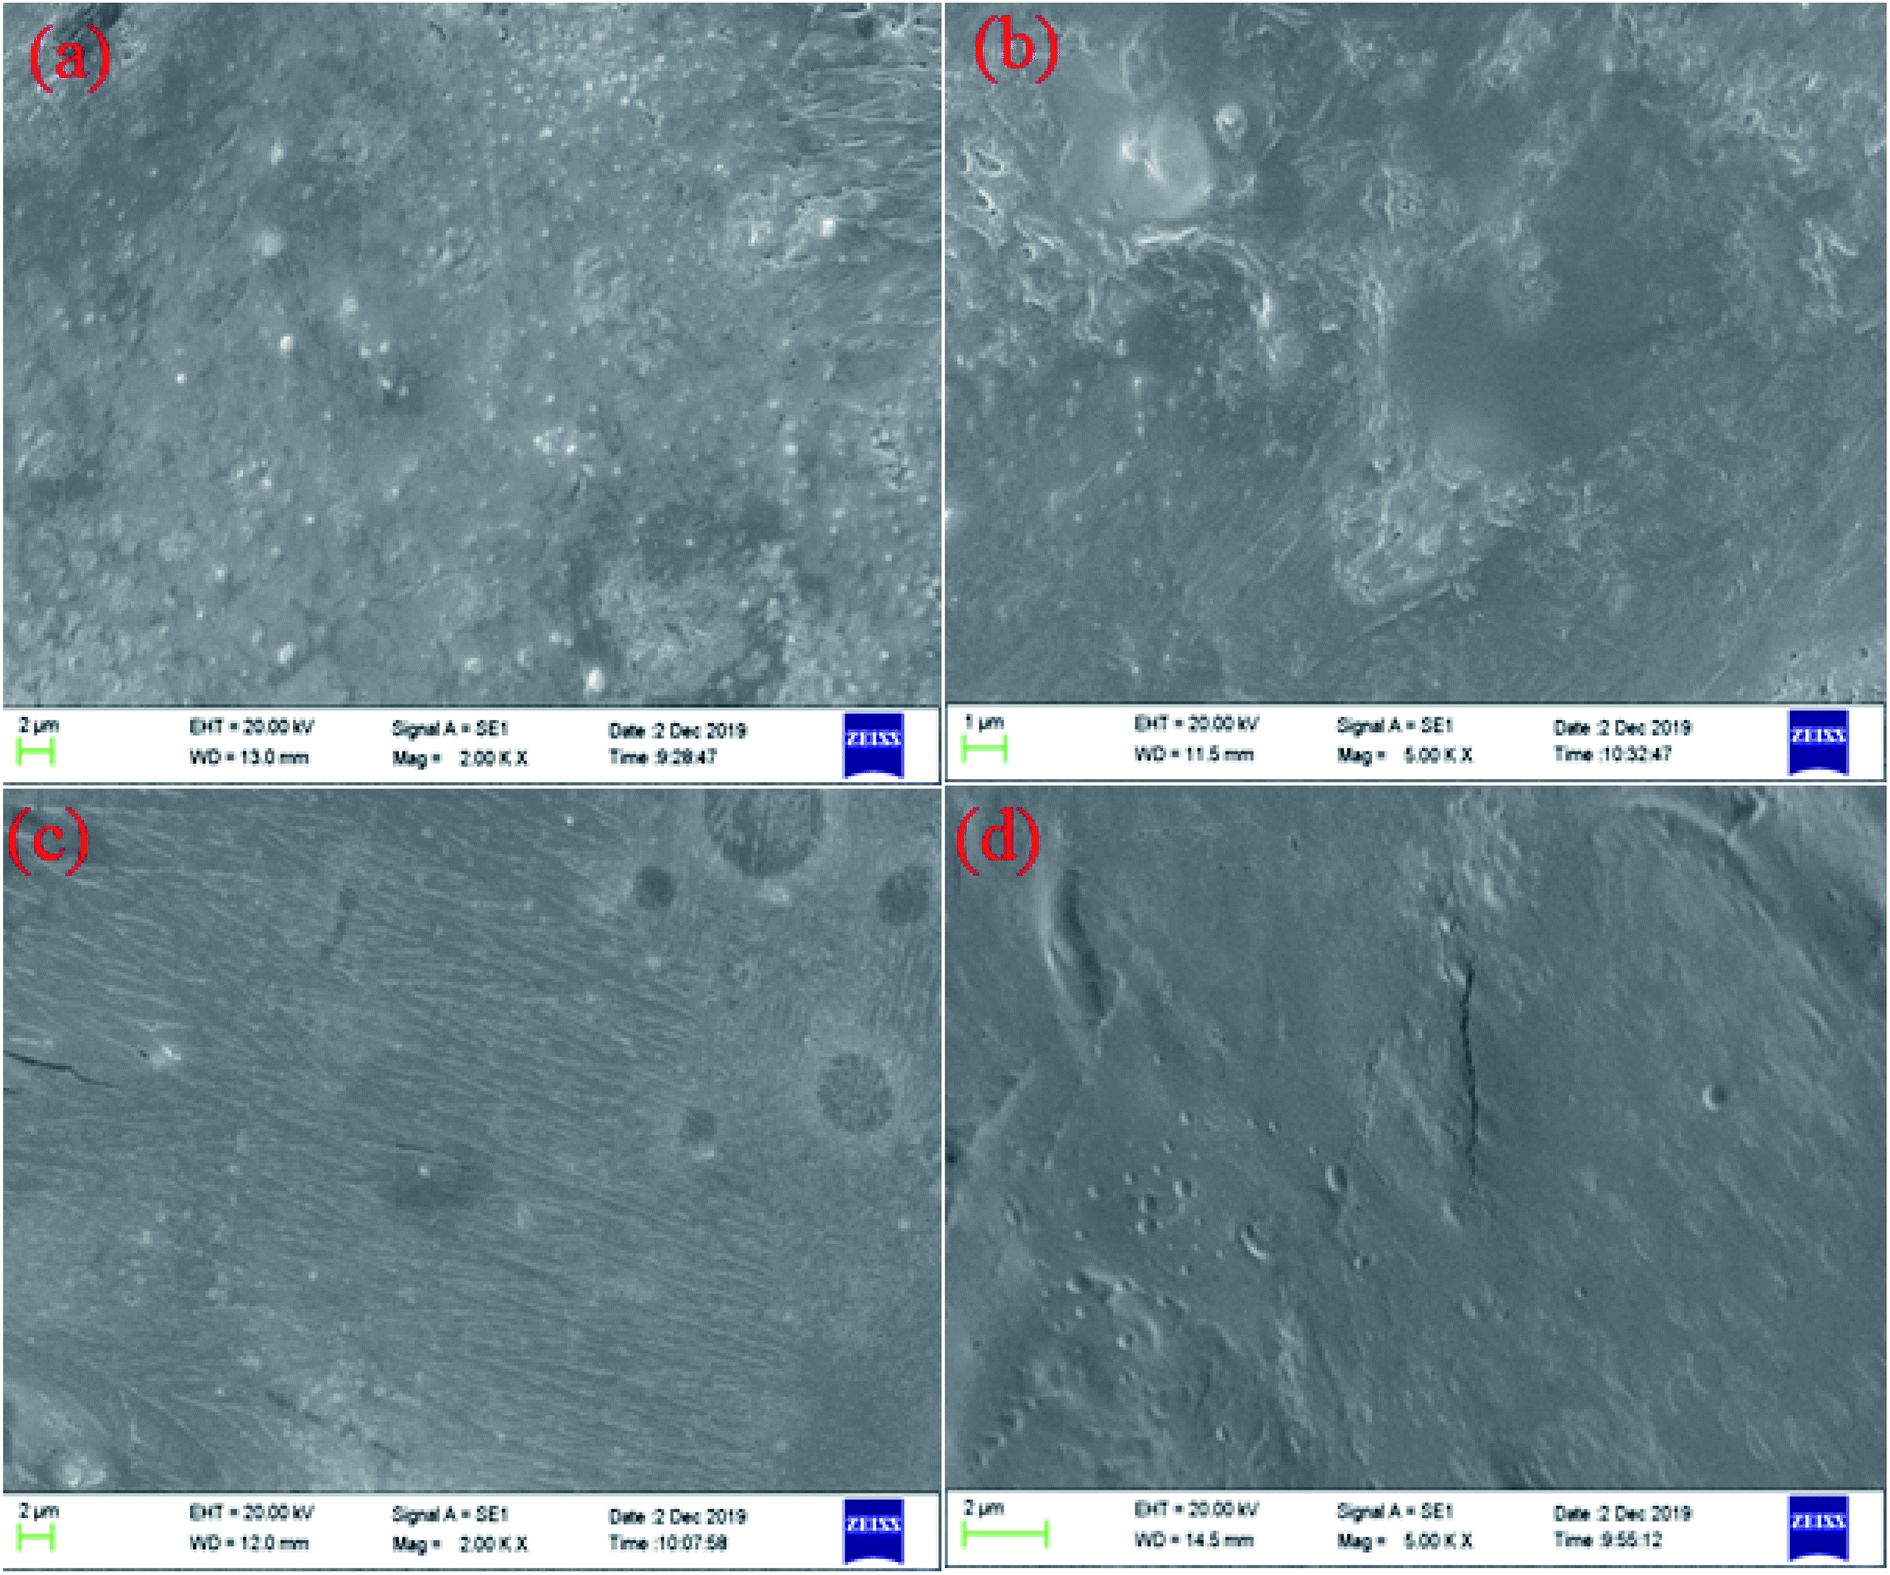 | ||
| Fig. 8 The SEM images of carbonate samples treated with (a) the AR-1 acid reacted with rock (2000 times), (b) the AR-1 acid reacted with rock (5000 times), (c) the AR-2 acid reacted with rock (2000 times), and (d) the AR-2 acid reacted with rock (5000 times). | ||
Fig. 7 shows that the carbonate sample treated by 20 wt% HCl had an uneven and rough surface. Fig. 8(a) and (b) show that the carbonate sample that was treated by AR-1 acid looked relatively smooth, indicating the AR-1 formed a thin-layer of adsorbed film on the carbonate surface, and the Fig. 8(c) and (d) show that the rock surface that was treated by AR-2 acid was smoother and the film-forming properties were more obvious. This shows that both AR-1 and AR-2 can be absorbed on a carbonate rock surface to form an adsorption film. The adsorbed film prevented H+ ions from coming into contact with the rock surface, thus reducing the reaction rate between the acid and rock. The smoother and more obvious film shown in the SEM images for AR-2 helps to explain why AR-2 acts as a more efficient retarder.
3.7 The adsorption behavior of AR-1 and AR-2
Adsorption isotherms describe the relationship between the adsorption capacity of adsorbent and the equilibrium concentration of adsorbate in the liquid when the adsorption achieves equilibrium at a given temperature.28 Eqn (5) is the equation for adsorption capacity,
 | (5) |
Fig. 9 shows the adsorption isotherms of AR-1 and AR-2 at 30 °C, 50 °C, and 70 °C.
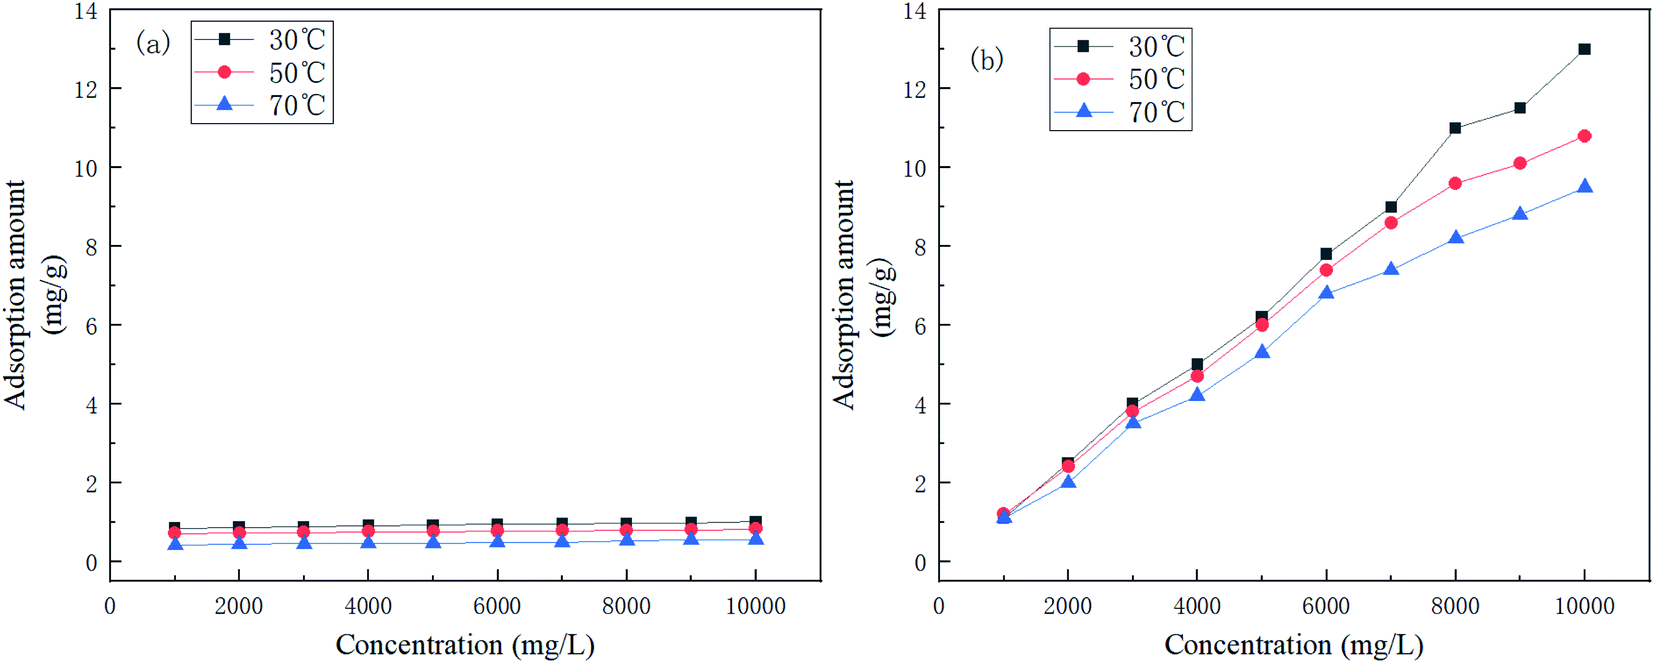 | ||
| Fig. 9 The adsorption isotherms of (a) AR-1 and (b) AR-2. | ||
Fig. 9 shows that at any concentration, the adsorption amount of AR-1 was lower than AR-2, indicating that the adsorption film of AR-2 adsorbed on a rock surface was thicker than AR-1, so AR-2 should be better at separating the acid solution from the rock. This could also explain why AR-2 has a better retarding performance than AR-1.
We further explored the adsorbing behavior and mechanism by fitting the data using Langmuir and Freundlich models. The Langmuir and Freundlich isotherm equations were expressed by eqn (6) and (7).29 The two models are most commonly used to determine isotherms for different adsorbent/adsorbate systems, to interpret solid–liquid adsorption, and predict their equilibrium parameters.
 | (6) |
 | (7) |
Table 3 shows the isotherm constants for AR-1 and AR-2.
| T (°C) | Langmuir | Freundlich | |||||
|---|---|---|---|---|---|---|---|
| Qmax (μg mg−1) | KL | R2 | KF | n | R2 | ||
| AR-1 | 30 | 0.983 | 0.0033 | 0.9982 | 0.6139 | 21.0526 | 0.8603 |
| 50 | 0.829 | 0.0029 | 0.9977 | 0.4949 | 19.3798 | 0.8208 | |
| 70 | 0.511 | 0.0028 | 0.998 | 0.2933 | 17.889 | 0.8563 | |
| AR-2 | 30 | 5000 | 2.20 × 10⁻⁷ | 0.0004 | 0.0011 | 0.996 | 0.9969 |
| 50 | 68.49 | 2.08 × 10⁻⁵ | 0.8031 | 0.0022 | 1.0666 | 0.9964 | |
| 70 | 208.33 | 6.83 × 10⁻⁶ | 0.3119 | 0.0017 | 1.0295 | 0.9984 | |
The Langmuir model yields the homogeneous adsorptive energies on the adsorbent surface. Table 3 shows that the correlation coefficient (R2) for AR-1 was close to 1 for the Langmuir model, indicating that the Langmuir model was appropriate for generating the isotherm adsorption data of AR-1. Because the polyoxyethylene ether chain at AR-1 helps AR-1 to be attracted to a carbonate surface by hydrogen bonds, the adsorption tended to be monolayer adsorption.
The Freundlich isotherm model yields the heterogeneous adsorptive energies on the adsorbent surface.30 Table 3 shows that the correlation coefficient (R2) for AR-2 was close to 1, indicating that the Freundlich model was suitable for generating the isotherm adsorption data of AR-2. Because its hydrophobic chain is pointed away from the carbonate rock when AR-2 is adsorbed on the rock surface, and the association between the hydrophobic chains leads to multi-layer adsorption.
The difference of adsorption isotherm models between AR-1 and AR-2 demonstrates that the introduction of hydrophobic chains enhanced the thickness of adsorption film, which can further explain why the retarding effect of AR-2 is superior to AR-1.
3.8 The contact angle analysis
We used contact angle to test the wettability of the rock surface.31,32 Fig. 10 show the contact angles of rock surfaces for different mass concentrations of AR-1 and AR-2.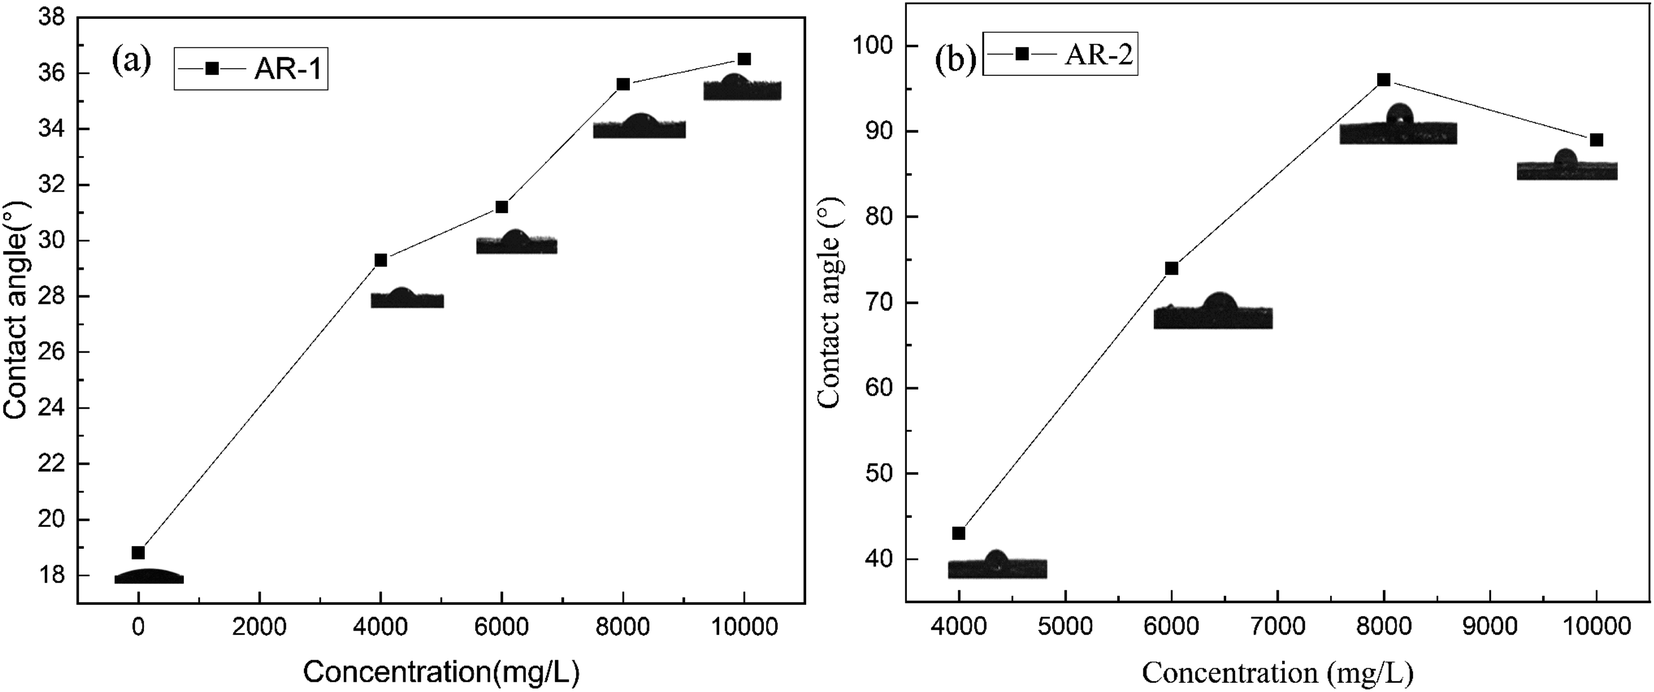 | ||
| Fig. 10 Contact angles for different mass concentration of (a) AR-1 and (b) AR-2. | ||
Fig. 10(a) shows that for AR-1, as the concentration increased, the contact angle increased, indicating a decrease in the hydrophilicity of the rock, but it was still less than 90 degrees, which is same as the water wetness of untreated rock.
Fig. 10(b) shows that when the concentration of AR-2 was less than 8000 mg L−1, the contact angle of the rock surface gradually increased with increasing concentration, but still was less than 90 degrees. This was because during the adsorption process of the AR-2, the hydrophobic chains of AR-2 were outward, which gradually changed the rock surface from hydrophilic to more hydrophobic. When the concentration of AR-2 was beyond 8000 mg L−1, the contact angle on the rock surface was greater than 90°, which could be due to the intermolecular association of polymers, and with the number of hydrophobic chains decreased, the rock surface was identified as water wetness gradually.
To further understand the wettability of the rock surface after AR-2 acid interacted with it, we measured the contact angles of 8000 mg L−1 AR-2 for different acid–rock reaction times, and Fig. 11 shows the results.
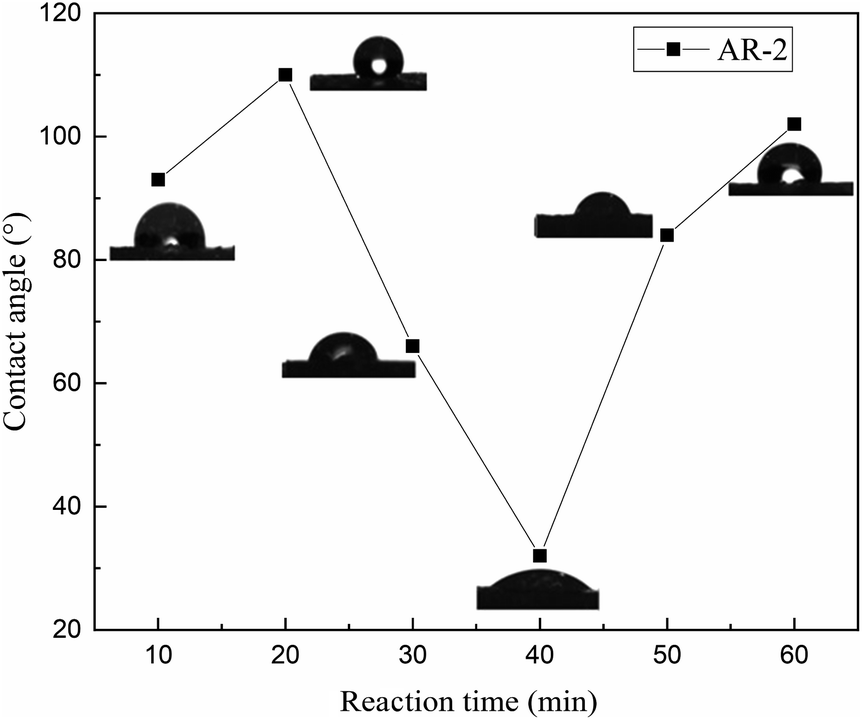 | ||
| Fig. 11 Contact angles for 8000 mg L−1 AR-2 with different reaction times. | ||
Fig. 11 shows that as the reaction time of AR-2 increased, the contact angle increased at first and then decreased and then increased again, indicating that the wettability of the carbonate rock changed from increasing hydrophobicity to increasing hydrophilicity and then to increasing hydrophobicity again. The untreated rock surface is hydrophilic, so the increasing hydrophobicity shows that the retarder AR-2 was adsorbed on the rock surface, and the hydrophobic ends of the AR-2 were outward. As the reaction time increased, the wettability changed from increasing hydrophobicity to increasing hydrophilicity. A possible reason is that multilayer of AR-2 was added to the rock surface with its hydrophobic side interacting with the hydrophobic side, resulting in the hydrophilic side of the multilayer pointing away from the rock.33–36 When the reaction time was longer than 40 min, the wettability gradually changed from increasing hydrophilicity to increasing hydrophobicity. This could be due to desorption of the AR-2 from the rock surface, exposing the hydrophobic end of AR-2 on the rock surface. These trends provide evidence that there was multilayer adsorption of AR-2 on the rock surface.
In summary, the contact angle experimental results showed that the rock surface itself was hydrophilicity. Although the addition of the retarder AR-1 decreased the hydrophilicity of the rock, the rock surface remained hydrophilic. The adsorption of the retarder AR-2 on the rock surface led to a more significant decrease in the hydrophilicity of the rock surface with increasing AR-2 concentration and acid–rock reaction time, indicating that the introduction of a hydrophobic chain improved the film-forming ability of the AR-2 on the rock surface, making AR-2 a better retarder.
3.9 X-ray photoelectron spectroscopy analysis
We did X-ray photoelectron spectroscopy (XPS, Escalab 250Xi England) analysis to determine the elemental composition of the substances37,38 on the rock surface after retarding acid interacted with rock. Fig. 12 shows the XPS analysis of C, N, O, and Cl for rock without AR-1 or AR-2, rock with AR-1, and rock with AR-2. The elements for untreated rock were different from the rock with the two retarding acids, indicating that both retarders had adsorbed on the rock surface. One difference between AR-1 and AR-2 is the presence of chlorine, Cl, in AR-2, and the XPS analysis showed Cl, indicating that AR-2 with its hydrophobic chains adsorbed on the rock surface.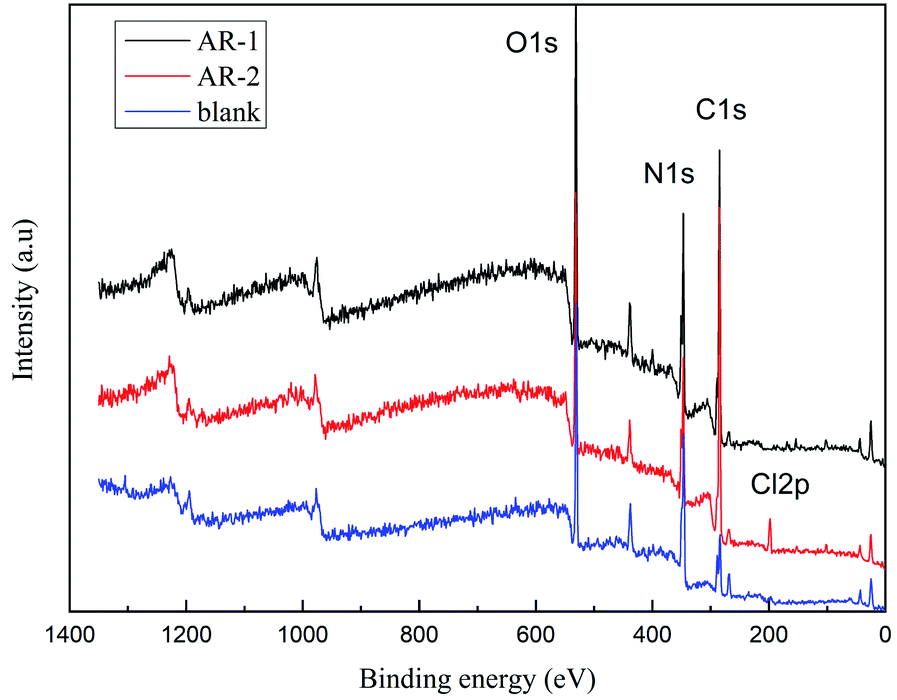 | ||
| Fig. 12 Results of X-ray photoelectron spectroscopy. | ||
We used eqn (8) and (9) to calculate the thickness of the adsorption film.
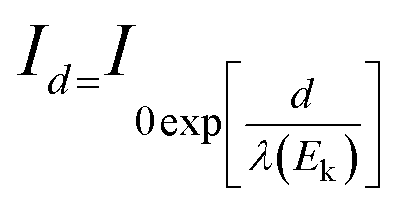 | (8) |
| λ(EK) = 49Ek−2 + 0.11(Ek)0.5 | (9) |
Table 4 shows the characteristic element optoelectronic test data.
| Acid solution | EK (eV) | λ(EK) (nm) | I0 | Id | d (nm) |
|---|---|---|---|---|---|
| AR-1 | 1086.8 | 3.6264 | 0.3177 | 0.4854 | 1.5371 |
| AR-2 | 0.5968 | 2.2864 |
Table 4 shows that the thicknesses of the AR-1 and AR-2 adsorbed films were 1.5371 nm and 2.2864 nm respectively, indicating that both retarders adsorbed on the rock surface to form an adsorption film, and the addition of hydrophobic chains of AR-2 increased the thickness of adsorbed film, thereby improving the retarding effect.
4. Conclusion
We synthesized two retarders, AR-1 and AR-2, and studied their retarding properties. The results showed that the retarding rate of AR-2 with its hydrophobic chain was higher than that of AR-1, and this was further verified by acid–rock reaction rate and SEM experiments. SEM images showed that there was an adsorption film on the rock surfaces treated by both retarding acids, and the thickness of the adsorption film was measured by XPS showed that the adsorption film thicknesses of AR-1 and AR-2 on the rock surface were 1.5371 nm and 2.2864 nm, respectively. The XPS and contact angle analysis of the rock surfaces after the acid–rock reactions verified that the two retarders were adsorbed on the rock surface. We found that the Langmuir model (monolayer adsorption) was a better fit for AR-1, and the Freundlich model (multi-layer adsorption) was a better fit for AR-2. This shows that the introduction of a hydrophobic chain on AR-2 increases the thickness of the adsorption films on rock surfaces, thereby improving the retarding rate of the retarding acid. This provides a direction for further research on retarding acids.Conflicts of interest
The authors declare that they have no known competing financial interests or personal relationships that could have appeared to influence the work reported on this paper.Acknowledgements
This work was supported by the Opening Project of Oil & Gas Field Applied Chemistry Key Laboratory of Sichuan Province (YQKF201401), (YQKF202001), the National Natural Science Foundation of China (No. 51604229) and supported by the Sichuan Science and Technology Program (No. 2019YJ0315).References
- M. M. Amro, Polymer-acid solutions: Their use for the enhancement of oil reservoir stimulation, J. Appl. Polym. Sci., 2008, 110(3), 1382–1387 CrossRef CAS.
- V. G. Pashakolaie, S. Khaleghi, T. Mohammadi and M. Khorsandi, Oil production cost function and oil recovery implementation- Evidence from an Iranian oil field, Energy Explor. Exploit., 2015, 33(4), 459–470 CrossRef.
- Y. R. Chen and Y. F. Wang, Research on quantitative evaluation methd of reasonable oil recovey rate in oil and gas field development, Fresenius Environ. Bull., 2020, 29(4), 2540–2546 Search PubMed.
- K. Li and R. N. Horne, Modeling of oil production by gravity drainage, J. Pet. Sci. Eng., 2008, 60(3–4), 161–169 CrossRef CAS.
- A. R. Solaimany-Nazar and A. Zonnouri, Modeling of asphaltene deposition in oil reservoirs during primary oil recovery, J. Pet. Sci. Eng., 2011, 75(3–4), 251–259 CrossRef CAS.
- H. Long, Research and Application on Homogeneous Acidification to Enhance Producing Degree of Horizontal Wells, Appl. Mech. Mater., 2014, 675, 1526–1529 Search PubMed.
- Y. B. Zhang, G. S. Cao and S. W. Cheng, Research of Retarded Acid Formula System of Qijiabei Oil field, Adv. Mater. Res., 2013, 734, 1235–1239 Search PubMed.
- B. Yu, W. L. Kang, B. Sarsenbekuly, R. M. Yang, H. M. Fan and X. Yin, Thickening behavior and synergistic mechanism of mixed system of two hydrophobically associating polymers, J. Dispersion Sci. Technol., 2017, 38(8), 1196–1203 CrossRef CAS.
- T. S. Davies, A. M. Ketner and S. R. Raghavan, Self-assembly of surfactant vesicles that transform into viscoelastic wormlike micelles upon heating, J. Am. Chem. Soc., 2006, 128(20), 6669–6675 CrossRef CAS PubMed.
- H. P. Quan, H. Y. Tian, Z. Y. Huang and Y. W. Long, Salt stimulus response of a carboxyl betaine amphoteric hydrophobic associative polyacrylamide, Russ. J. Appl. Chem., 2017, 90(7), 1193–1201 CrossRef CAS.
- H. Y. Tian, H. P. Quan and Z. Y. Huang, Investigation on rheological properties and thickening mechanism of a novel thickener based on hydrophobically associating water-soluble polymer during the acid rock reaction, J. Pet. Sci. Eng., 2020, 188, 106895 CrossRef CAS.
- H. Y. Tian, H. P. Quan, Z. Y. Huang and W. M. Duan, Effects of two kinds of viscoelastic surfactants on thickening and rheological properties of a self-thickening acid, J. Pet. Sci. Eng., 2021, 197, 107962 CrossRef CAS.
- H. Y. Tian, H. P. Quan, Z. Y. Huang, W. M. Duan and S. J. Deng, Polymeric and non-crosslinked acid self-thickening agent based on hydrophobically associating water-soluble polymer during the acid rock reaction, J. Appl. Polym. Sci., 2019, 136(36), 47907 CrossRef.
- H. Matsubara, T. Umezaki, T. Funatsu, H. Tanaka, N. Ikeda and M. Aratono, Thinning and thickening transitions of foam film induced by 2D liquid-solid phase transitions in surfactant-alkane mixed adsorbed films, Adv. Colloid Interface Sci., 2020, 282, 102206 CrossRef CAS PubMed.
- Z. Panovska, A. Vachova and J. Pokorny, Effect of Thickening Agents on Perceived Viscosity and Acidity of Model Beverages, Czech J. Food Sci., 2012, 30(5), 442–445 CrossRef CAS.
- A. Waissbluth, G. Ghigliotti, D. R. Abendschein, P. R. Eisenberg and D. Schwartz, Aurintricarboxylic acid attenuates intimal thickening after balloon injury of the rabbit aorta, Thromb. Haemostasis, 2002, 88(4), 668–672 CrossRef.
- Y. L. Yan, Q. Xi, C. C. Una, B. C. He, C. S. Wu and L. L. Dou, A novel acidizing technology in carbonate reservoir: In-Situ formation of CO2 foamed acid and its self-diversion, Colloids Surf., A, 2019, 580, 123787 CrossRef CAS.
- A. I. Rabie, A. M. Gomaa and H. A. Nasr-El-Din, Reaction of In Situ-Gelled Acids With Calcite: Reaction-Rate Study, SPE J., 2011, 16(4), 981–992 CrossRef CAS.
- A. I. Rabie, A. M. Gomaa and H. A. Nasr-El-Din, HCl/Formic In Situ-Gelled Acids as Diverting Agents for Carbonate Acidizing, SPE Prod. Oper., 2012, 27(2), 170–184 CAS.
- H. P. Quan, H. Li, Z. Y. Huang, S. S. Dai and J. F. Jiang, Copolymer MCJS as a Retarder of the Acid–Rock Reaction Speed for the Stimulation of Deep Carbonate Reservoirs, J. Appl. Polym. Sci., 2015, 132(7) DOI:10.1002/app.41471.
- H. P. Quan, Z. H. Chen, Y. Wu and Z. K. Li, Adsorption behavior of the copolymer AM/DMC/APEG/DMAAC-16 on a carbonate rock and its application for acidizing, RSC Adv., 2017, 7(50), 31771–31778 RSC.
- H. P. Quan, Q. Y. Lu, Z. H. Chen, Z. Y. Huang and Q. Y. Jiang, Adsorption-desorption behavior of the hydrophobically associating copolymer AM/APEG/C-18/SSS, RSC Adv., 2019, 9(22), 12300–12309 RSC.
- K. C. Taylor, A. H. Al-Ghamdi and H. A. Nasr-El-Din, Measurement of acid reaction rates of a deep dolomitic natural gas reservoir, J. Can. Pet. Technol., 2005, 43(10), 49–56 Search PubMed.
- K. C. Taylor, A. M. Al-Ghamdi and H. A. Nasr-El-Din, Effect of Additives on the Acid Dissolution Rates of Calcium and Magnesium Carbonates, SPE Prod. Facil., 2004, 19(3), 122–127 CrossRef CAS.
- S. H. Al-Mutairi, H. A. Nasr-El-Din, A. D. Hill and A. Al-Aamri, Effect of droplet size on the reaction kinetics of emulsified acid with calcite, SPE J., 2009, 14(04), 606–616 CrossRef CAS.
- A. I. Rabie, A. M. Gomaa and H. A. Nasr-El-Din, Reaction of in situ-gelled acids with calcite: reaction-rate study, SPE J., 2011, 16(04), 981–992 CrossRef CAS.
- L. Zhou, C. J. Zou, T. Gu, X. K. Li and Y. J. Shi, Cucurbit [7] uril-modified intelligent polymer as acid thickening agent for unconventional reservoir recovery, J. Pet. Sci. Eng., 2017, 149, 65–74 CrossRef CAS.
- F. J. Cao, P. Yin, J. Zhang, H. Chen and R. J. Qu, Nanoplates of cobalt phosphonate with two-dimensional structure and its competitive adsorption of Pb(II) and Hg(II) ions from aqueous solutions, J. Ind. Eng. Chem., 2014, 20(4), 2568–2573 CrossRef CAS.
- A. Zaman, J. T. Orasugh, P. Banerjee, S. Dutta, M. S. Ali, D. Das, A. Bhattacharya and D. Chattopadhyay, Facile one-pot in situ synthesis of novel graphene oxide-cellulose nanocomposite for enhanced azo dye adsorption at optimized conditions, Carbohydr. Polym., 2020, 246, 116661 CrossRef CAS PubMed.
- H. Huang, Y. F. Fan, J. W. Wang, H. Q. Gao and S. Y. Tao, Adsorption kinetics and thermodynamics of water-insoluble crosslinked beta-cyclodextrin polymer for phenol in aqueous solution, Macromol. Res., 2013, 21(7), 726–731 CrossRef CAS.
- M. Schmitt, R. Hempelmann, S. Ingebrandt, W. Munief, D. Durneata, K. Gross and F. Heib, Statistical approach for contact angle determination on inclining surfaces: “slow-moving” analyses of non-axisymmetric drops on a flat silanized silicon wafer, Int. J. Adhes. Adhes., 2014, 55, 123–131 CrossRef CAS.
- M. Schmitt, R. Hempelmann, S. Ingebrandt, W. M. Munief, K. Gross, J. Grub and F. Heib, Statistical contact angle analyses: 'slow moving' drops on inclining flat mono-aminopropylsiloxane surfaces, J. Adhes. Sci. Technol., 2015, 29(17), 1796–1806 CrossRef CAS.
- H. Abdelmoulahi, H. Ghalla, S. Nasr, J. Darpentigny and M. C. Bellissent-Funel, Intermolecular associations in an equimolar formamide-water solution based on neutron scattering and DFT calculations, J. Chem. Phys., 2016, 145(13), 134502 CrossRef PubMed.
- W. Egan, Intermolecular association in adenosine 5'-monophosphate. An 2H nuclear magnetic resonance investigation, J. Am. Chem. Soc., 1976, 98(14), 4091–4093 CrossRef CAS PubMed.
- T. Endo, A. Kuwahara, H. Tasai, T. Murata, M. Hashimoto and T. Ishigami, Intermolecular association and geometrical shape as two factors controlling chemical reactions, Nature, 1977, 268(5615), 74–76 CrossRef CAS PubMed.
- H. C. Yi, Z. H. You, D. S. Huang, Z. H. Guo, K. C. C. Chan and Y. M. Li, Learning Representations to Predict Intermolecular Interactions on Large-Scale Heterogeneous Molecular Association Network, Science, 2020, 23(7), 16 Search PubMed.
- A. D. Fedorenko, L. N. Mazalov, E. Y. Fursova, V. I. Ovcharenko, A. V. Kalinkin and S. A. Lavrukhina, X-ray photoelectron and X-ray emission study of the electronic structure of hexanuclear Mn(II,III) pivalate complexes, J. Struct. Chem., 2017, 58(6), 1166–1172 CrossRef CAS.
- Y. M. Shul'ga, E. N. Kabachkov, P. V. Fursikov, S. A. Mironova, S. P. Shilkin, B. I. Kornev and V. V. Novikov, X-Ray Photoelectron Spectra of TbB66, Inorg. Mater., 2018, 54(1), 45–48 CrossRef.
| This journal is © The Royal Society of Chemistry 2022 |